
Abstract
Concrete cone (or breakout) failure mode is the dominant failure for cast-in headed anchors under tension in mature brittle concrete, however, other failure modes such as plug failure has been found experimentally to dominate in early age concrete. Design codes generally assume concrete cone failure and do not cover plug failure. A new model for concrete at early ages is proposed based on continuum damage mechanics which can model both failure modes for cast-in headed anchors in early age concrete. The new damage model combines a modified power law for the onset of damage, an exponential softening law for the post-failure softening stage, and an additional modified power law to reproduce the final stages of fracture. The combined damage law is calibrated with three experimental tests for concrete at two different ages (43 hours and 14 days): uniaxial compression, Brazilian splitting tensile and wedge splitting tests. The new models are applied to investigate anchor pull-out failure to demonstrate that both cone and plug failure modes are produced depending on concrete age. Simulations using the combined damage evolution laws gave the lowest average percent error over the mechanical properties measured in the four tests, when compared with existing damage evolution laws.
This is a visual representation of the abstract.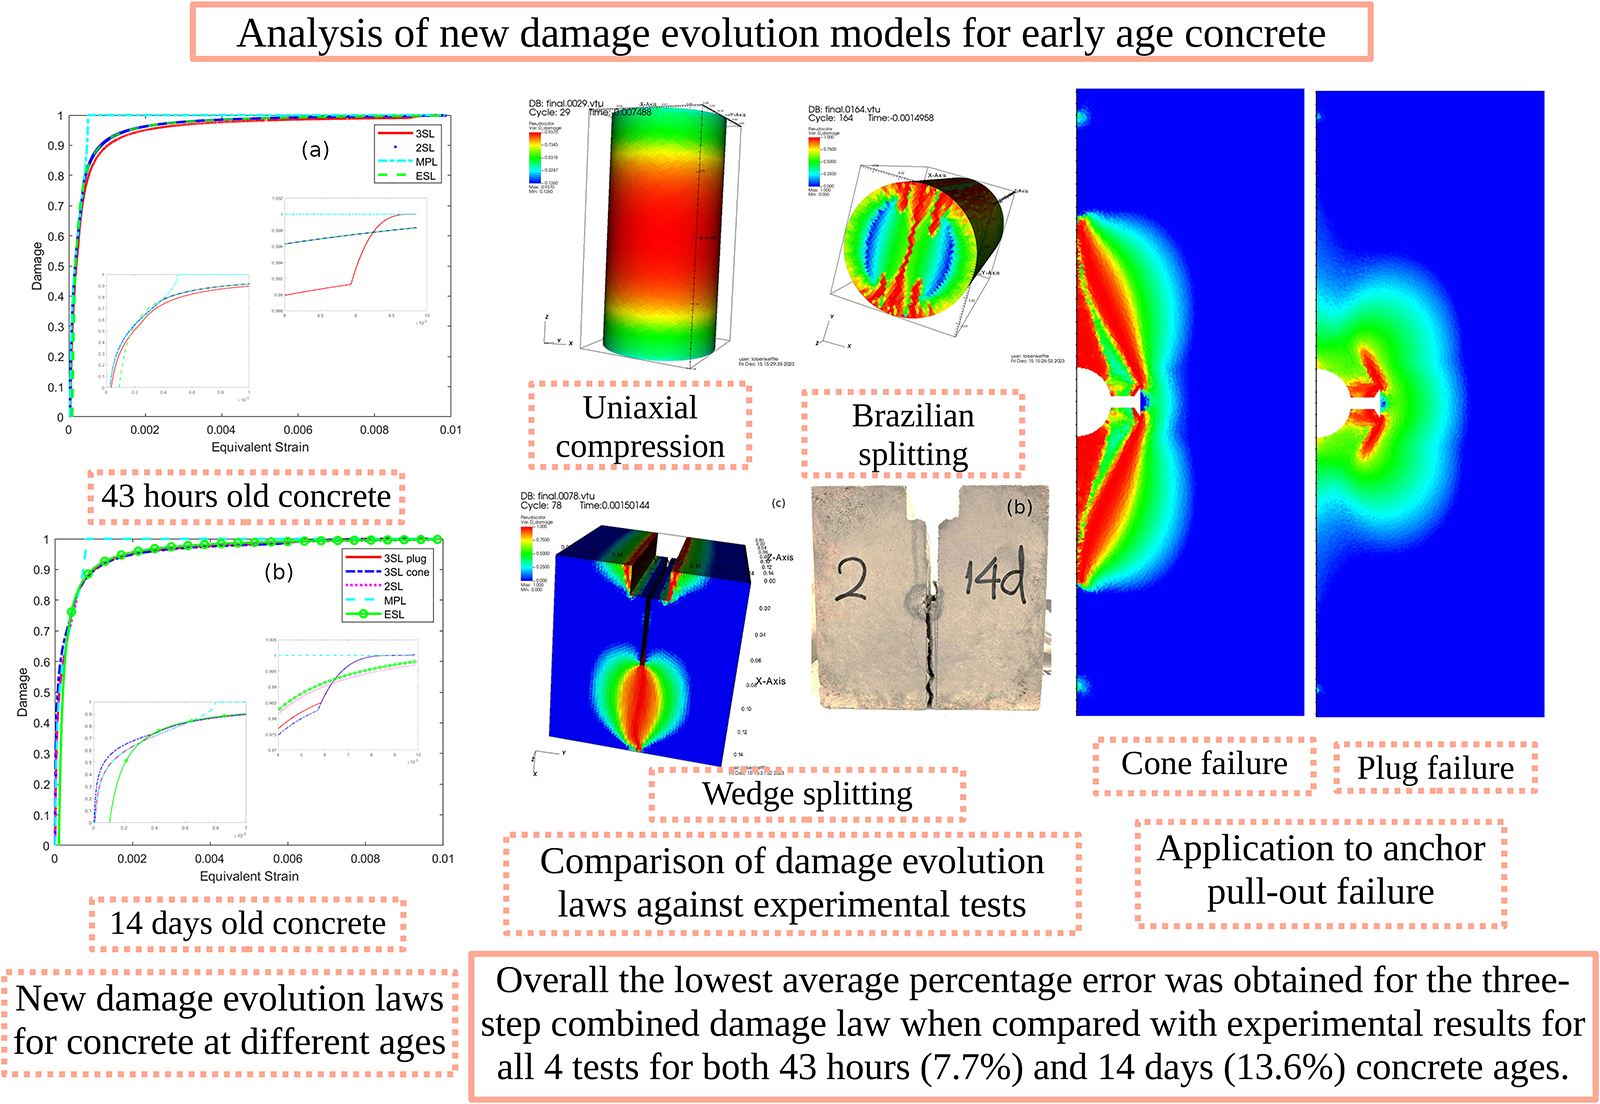
Introduction
Fastening technology to connect different structural elements, assemble precast elements, and the attachment of non-load bearing components is a crucial technology in modern construction with regard to the performance and safety of many structural elements and structures (Boumakis et al., 2018). The potential failure of a single anchor might cause tremendous structural system damage, and anchors can fail from different types of failure or combined failures. The application of anchorage in the construction industry is increasing every year with the demand of increased flexibility in the design of new structures and strengthening of existing ones. There is an increasing use of precast concrete elements in construction that require both lifting means, as well as means of connection to other elements on site. Cast-in headed anchors are commonly used as lifting anchors for precast elements. In many current applications especially for precast lifting purposes, fasteners are loaded at early age around 24 to 28 hours before concrete has aged 28 days. There is a lack of models for predicting the capacity of fasteners for applications when the fasteners are loaded before reaching a concrete age of 28 days. Plug-like or pull-out failure has been shown by Barraclough and Moeinaddini (2017), Obayes et al. (2020) and Obayes et al. (2022) to take place prior to concrete cone failure for anchors with void formers in early age concrete. Although many studies have reported non-concrete cone failure modes the research on the formation mechanism and prediction models of these failure modes are scarce (Chen, 2023). In comparison there is already a rich area of research into concrete cone failure modes in anchors, for example, Eligehausen et al. (2006), Farbák et al. (2021), Li et al. (2021), Nilforoush et al. (2018), Sonoda (2016) and Stehle and Sharma (2021). This important non-concrete cone failure mechanism is studied in the context of new proposed damage evolution laws for early age concrete at two different ages (43 hours and 14 days old). A more refined concrete damage model is proposed which combines existing damage evolution laws, and can simulate both concrete and non-concrete cone failure modes. The numerical simulations using a new combined damage law matches the experimental findings with predominantly pull-out failure for the 43-hour concrete, and cone failure for the 14 days old concrete.
Boumakis et al. (2018) studied time-dependent effects in concrete, this study focussed on the long-term failure behaviour of adhesive anchors using a lattice discrete particle model. Similarly to the validation approach in this article, Boumakis et al. (2018) calibrated their numerical model for concrete with three tests: compression, Brazilian splitting tensile and three-point bending tests. The calibrated concrete models for different ages were then applied to pull-out tests of anchors to specifically study the long-term concrete creep and shrinkage behaviour of adhesive anchor systems. Other analytical and numerical studies have been performed to study non-concrete cone failure modes in anchors under tension including simulations of post-installed bonded anchors by Chen et al. (2020) and Marcon et al. (2017), Wang et al. (2017) simulated expansion anchors and Nassiri et al. (2020) investigated failure modes in screw anchors. As shown by Barraclough and Moeinaddini (2017), Obayes et al. (2020) and Obayes et al. (2022) there is also a need to further expand this research to consider the failure mechanisms of cast-in headed anchors in early age concrete, and develop reliable and accurate prediction models for the pull-out failure mode in early age concrete. This research aims to address these challenges by adopting new damage models implemented using the finite element method (FEM) to analyse both concrete and non-concrete cone failure modes in cast-in headed anchors in early age concrete.
A combination of different damage evolution laws to model early age concrete was demonstrated to reproduce the experimentally measured mechanical and material properties of two different aged concretes more accurately, when compared with using only one of the laws. Other authors have similarly modified existing damage evolution laws where Yu et al. (2022a) modified Mazar’s damage model to account for the creep behaviour of concrete and replicate the long-term effects of sustained loading. Brittle and quasi-brittle material properties are controlled by parametric values in damage evolution laws. In this research the modified power law was used to model the initial softening and onset of damage. The exponential softening damage law was used to model the post-failure phase. The combination of these laws gave the best results for the concrete mixes (aged 43 hours and 14 days) for the uniaxial compression and Brazilian splitting tests. However a third modified power law for the damage was needed to model the damage in the final post-failure stage to obtain more realistic fracture energies and peak forces when simulating the wedge splitting test. Using three-step combined damage laws enabled more parametric values in the damage laws to be varied resulting in more realistic results for all four tests, and a reduction in the average percentage error when compared with the experimental results.
The experimental results of Obayes et al. (2020) and Obayes et al. (2022) are used to calibrate and parameterise damage evolution laws for early aged concrete in three tests: the standard uniaxial compression test, the Brazilian splitting tensile strength, and the wedge-splitting test. The new laws for predicting damage in concrete at different ages are adopted to investigate anchor failure modes for cast-in headed anchors in early age concrete at 43 hours and 14 days old. The significance of this work is a thorough analysis of different damage evolution laws was performed and the simulation results were compared with experimental results for all four experimental tests. Simulations with the combined damage evolution three-step laws were also compared with simulations using existing single existing damage evolution laws to demonstrate the advantage in using the combined laws. Damage evolution laws were evaluated for their accuracy in reproducing all four tests using the same parameter set for each law.
Often studies only report the numerical simulation results of the anchor tension test in isolation, where the model parameters can be adjusted to match the experimental results of a single test. For both concrete ages (43 hours and 14 days old) simulations using a three-step combined damage evolution law reproduced the experimental results of all four tests best. While it is the case that other authors have shown better fits to the experimental data for individual tests, in general these numerical models are only attempting to fit the experimental and material data of one test only at a time (Ahmed et al., 2021; Jahanitabar and Lofti, 2024; Li and Wu, 2018; Zhang et al., 2021). Other authors have considered simulations of compression tests with either a cubic or cylindrical concrete sample (Brünig and Michalski, 2020) or for different size cubes and strain rates (Yu et al., 2023, 2022b). In this work we use the same material parameters for each concrete mix and age to simulate four commonly used tests in order to find a generalised damage model for concrete at different ages that can be used to simulate all four experimental tests accurately. Because we have to choose a general model with the same parameters for all four experimental tests there is some difference in the simulation results with the experimental test data, however the 3SL damage model shows the most consistent comparison with all four tests for both concrete ages.
In the next Section ‘Overview of isotropic scalar damage models’ an overview of continuum damage mechanics using a single scalar damage variable,
Anchor failure is an important failure mechanism in early age concrete, as generally existing models for predicting the capacity of fasteners are based on experimental data where fasteners have been installed in mature concrete (Fuchs et al., 1995). However in many current applications especially in precast lifting purposes, fasteners are loaded before reaching a concrete age of 28 days. To overcome challenges with existing models in predicting capacity of fasteners for early age concrete, a new three-step damage model was developed that can match the experimental findings with predominantly pull-out failure for the 43 hours old concrete, and cone failure for the 14 days old concrete. Finally in Section ‘Comparison with single damage evolution laws’ the best parameters that match the experimental results of all four tests are presented for the existing (single) damage evolution laws: a modified power law and exponential softening law, and a two-step combined damage law. This section shows the advantage of using a three-step damage law where the average percentage error of the simulation results compared with the experimental results is lowest, when compared to the other laws.
Overview of isotropic scalar damage models
Governing equations and damage model
The quasi-static equilibrium equation is solved using the finite element method (FEM), which is given in Einstein notation as

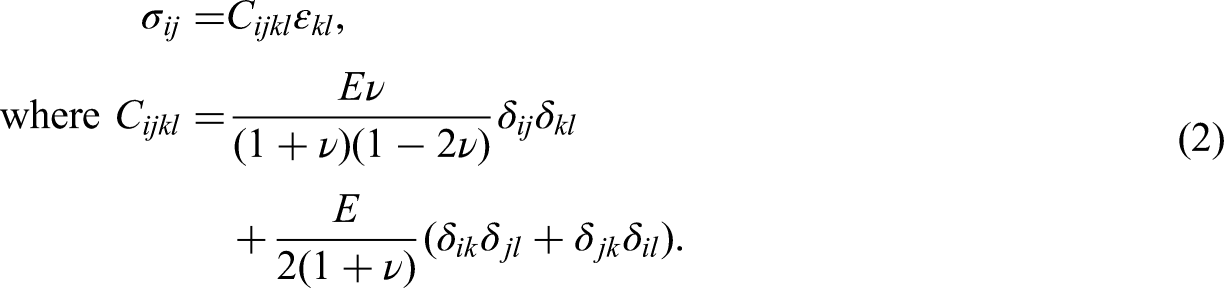

where
The finite element method is used to solve equation 1 for four different specimens and boundary (loading) conditions: uniaxial compression of a concrete cylinder, Brazilian splitting test of a concrete cylinder, a wedge splitting test of a concrete block with notches, and anchor pull-out failure in a rectangular prism containing a headed anchor. The finite element software esys–escript (Mondal et al., 2019, 2020b; Schaa et al., 2016) is used for solving the partial differential equation 1 for the 3D tests outlined above.
A scalar isotropic damage model is employed where the Young’s modulus (

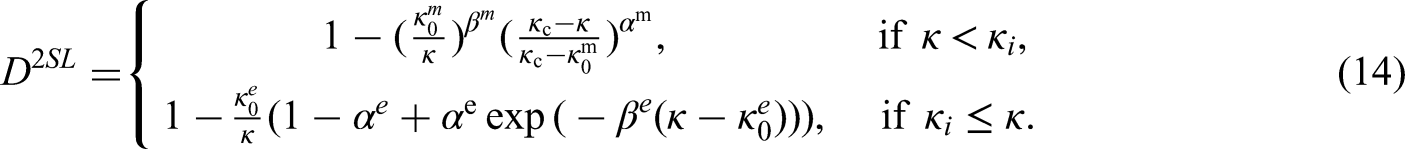
Both the modified power law and the exponential softening law employ a scalar equivalent strain criteria, and adopt failure criteria related to the notion of an equivalent strain. The equivalent strain is defined as a scalar positive equivalent measure of the tensorial strain state. The equivalent strain is defined by re-writing the stress based form of the modified von-Mises failure criteria in terms of strains using Hooke’s law, and given by Peerlings (1999) as:


A scalar isotropic damage model is employed which considers a single equivalent strain variable,

where

Brittle and quasi-brittle material and mechanical properties are controlled by parametric values in damage evolution laws. Previously considered damage evolution laws (modified power and exponential softening laws) considered in this study are outlined in the following subsections. Together these three single damage evolution laws are combined to define the three-step (3SL) damage evolution law detailed in Section ‘A new combined three-step damage evolution law’. The modified power law was used to model the initial softening and onset of damage. The exponential softening damage law was used to model the post-failure phase. The combination of these laws gave the best results for the concrete mixes (aged 43 hours and 14 days) for the uniaxial compression and Brazilian splitting tests. However, a third modified power law for the damage was needed to model the damage in the final post-failure stage to obtain more realistic fracture energies and peak forces when simulating the wedge splitting test.
Modified power law for onset of damage
The modified power law (MPL) was first proposed by Geers (1997) to describe fracture of short glass-fibre reinforced polymers. The modified power law is also used in other studies (Mondal et al., 2020a, 2020b; Peerlings, 1999; Peerlings et al., 1998) for damage analysis.

Exponential softening law for post-failure softening
The exponential softening law (ESL) has been previously used in softening material modelling of concrete (Mondal, 2019; Peerlings et al., 1998).

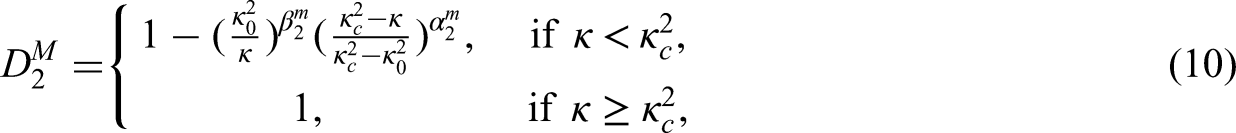
A second modified power law for final fracture
It was necessary to introduce a third damage evolution law for the three-step combined damage law to accurately reproduce the fracture energy in the wedge splitting test. Without this law the exponential softening damage law never reaches full failure where
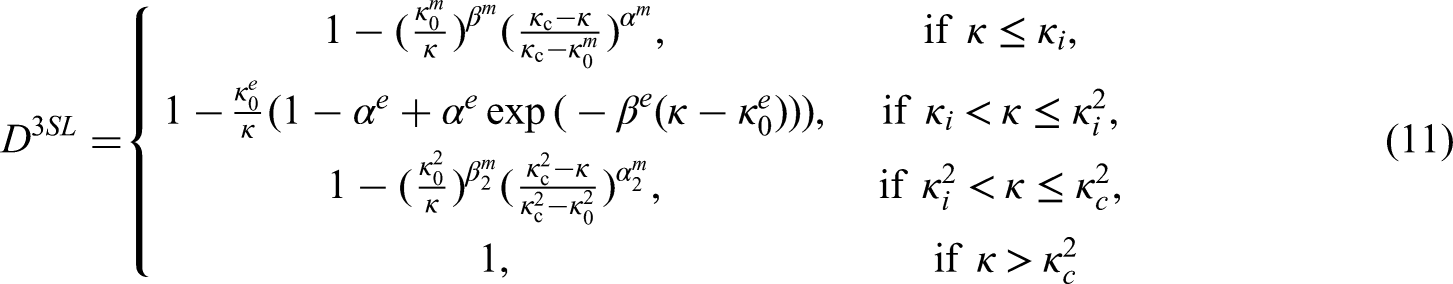
A new combined three-step damage evolution law
Softening in concrete is non-linear and the simulations showed that applying the modified power law to represent the initial strain softening stage before peak failure could represent the pre-peak behaviour well. Whereas the exponential softening law could be applied to represent the post-peak failure and more moderate decrease in stress with increasing strain. To obtain more realistic fracture energies and peak forces for the wedge splitting test a third modified power law was introduced in the final post-failure softening stages. The combination of three laws is shown to more closely reproduce the experimental results of three tests for concrete. Using three-step combined damage laws enabled more parametric values in the damage laws to be varied resulting in more realistic results for all four tests, and a reduction in the average percentage error when compared with the experimental results. Thus the new combined three-step damage evolution law (3SL) became:


Two-step damage evolution law for early age concrete
A two-step law for the 43-hour-old concrete could also accurately reproduce the 3 tests, however it did not perform as well for the 14 days old concrete. The two-step damage evolution law is defined below:
Weibull distribution for initial Young’s modulus (
) to model heterogeneities
In the simulations with different damage evolution laws, unstructured tetrahedral 3D meshes are considered for the specimens for the four tests shown in Figure 1. The tetrahedral elements’ length was restricted to be less than 3mm for each specimen, and considered approximately the same mesh element size for all four tests. For all four tests simulated a Weibull distribution (Liu et al., 2004; Mondal et al., 2019, 2020b; Wang et al., 2014; Weibull, 1951; Wong et al., 2006; Zhang et al., 2018) was employed to simulate a spatially varying initial Young’s modulus, (
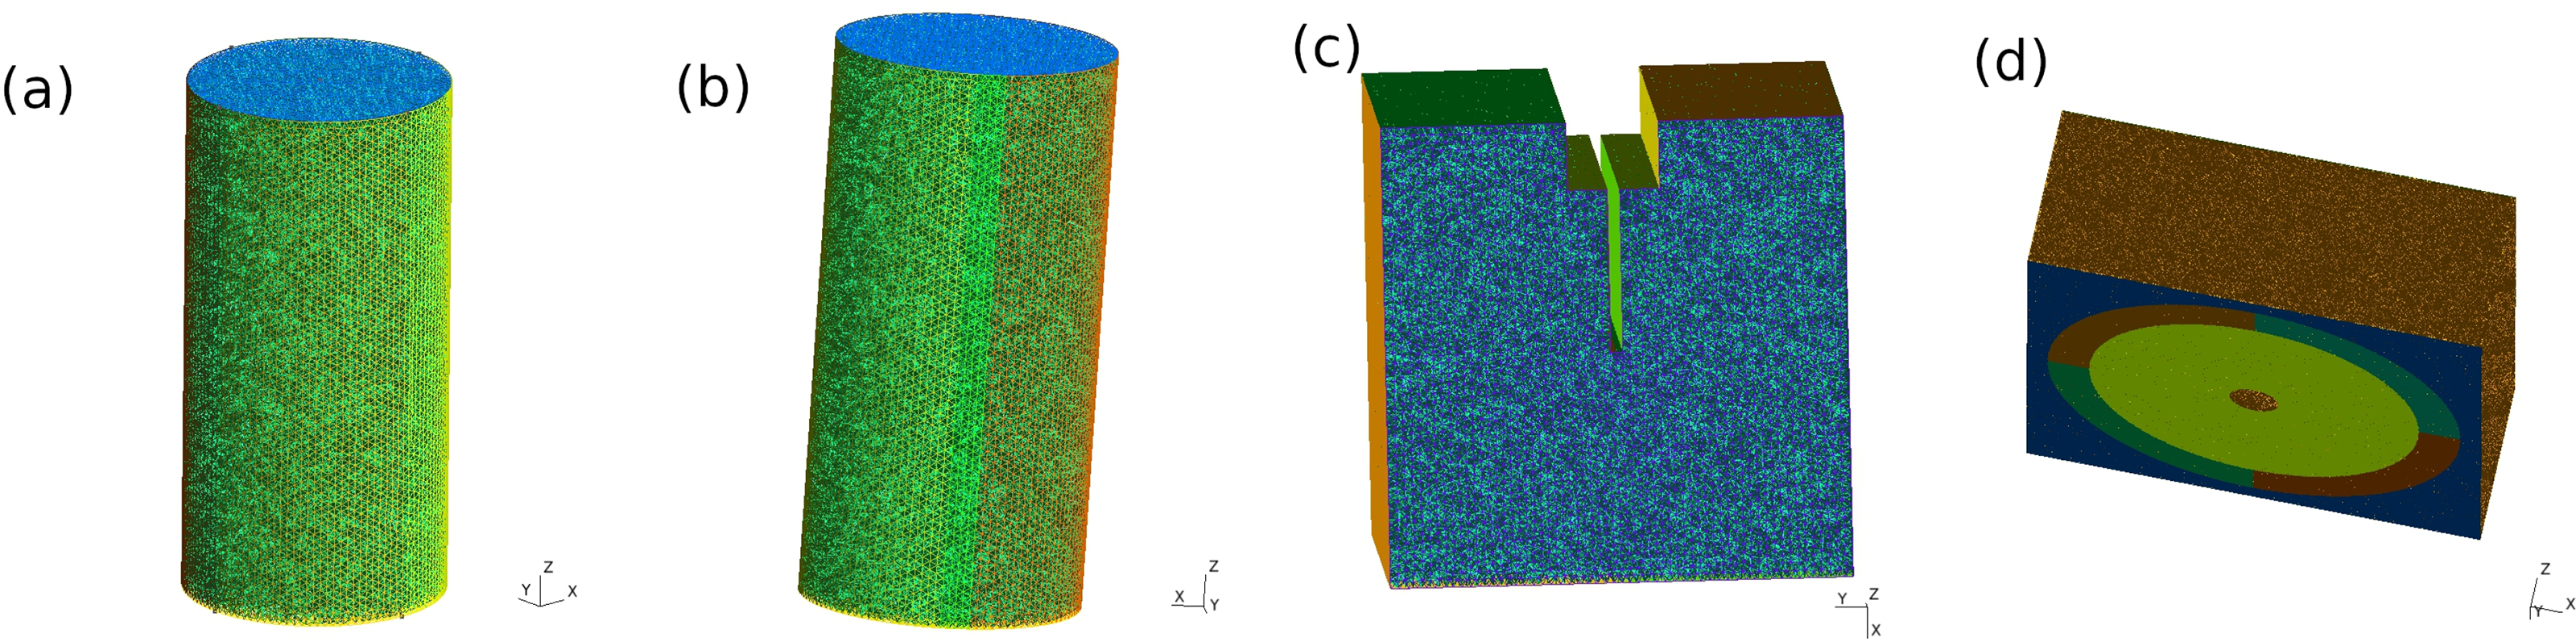
Tetrahedral mesh for (a) uniaxial compression test, (b) Brazilian splitting test, (c) Wedge splitting test and (d) anchor pull-out test.
For all 4 tests the same bulk parameters were considered for the Weibull distribution for the initial Young’s modulus (shape parameter,

where
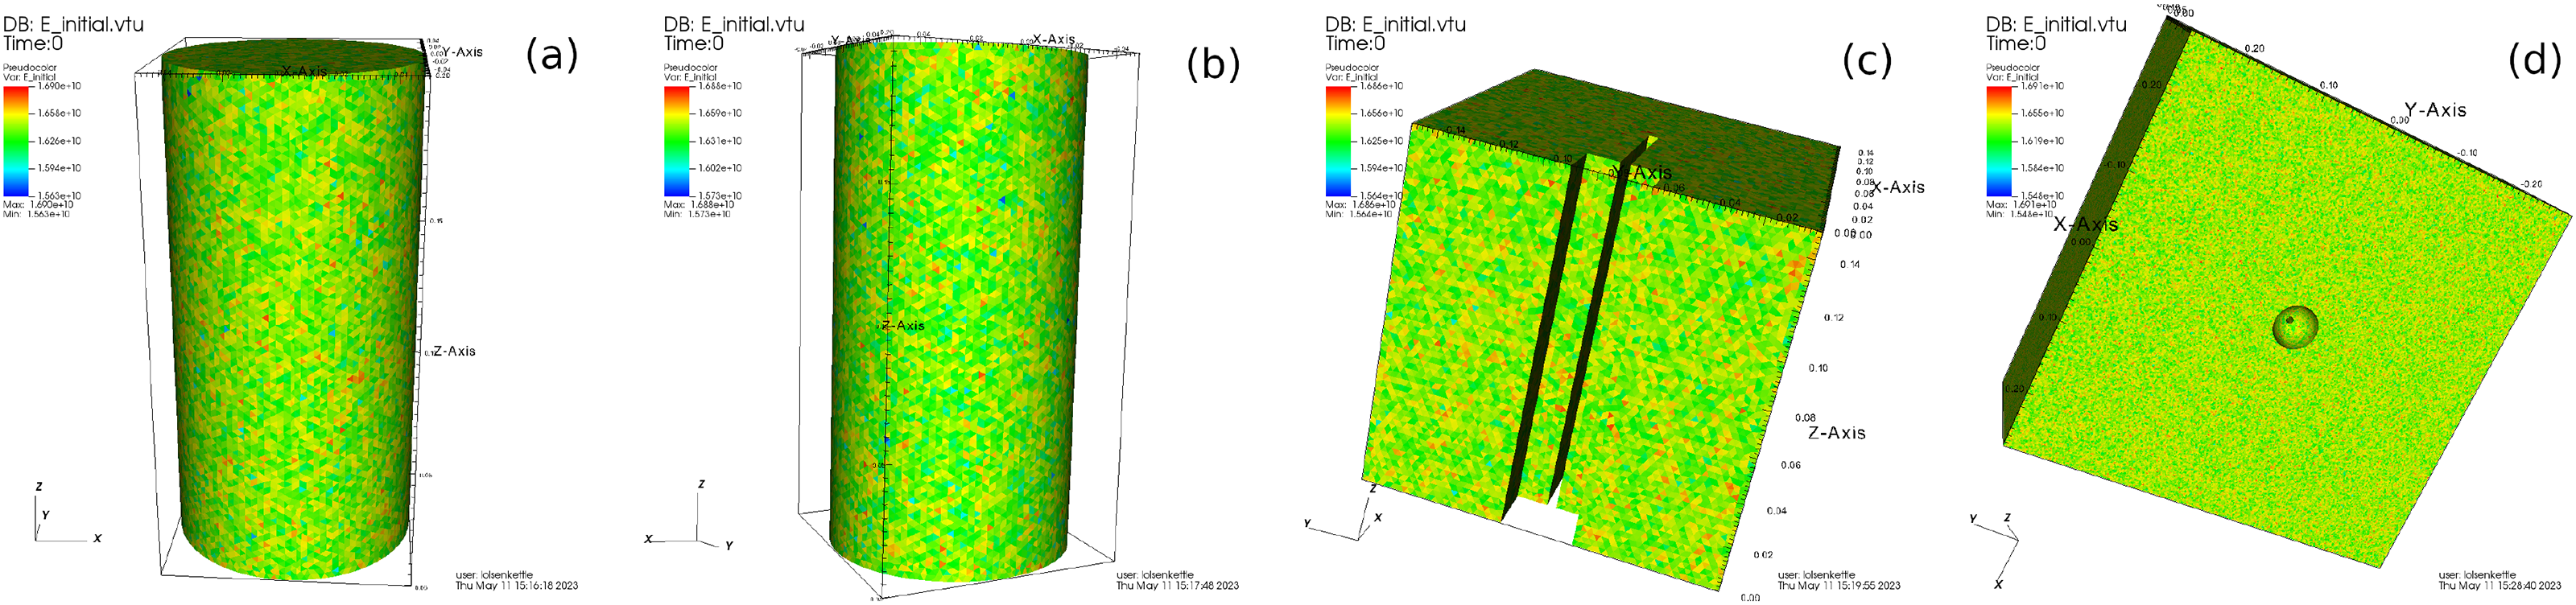
Weibull distribution for the initial Young’s modulus (
To be consistent, the same resolution for the Weibull distribution was used for each volume modelled in the different tests. In contrast to previous studies where values are directly assigned to the finite element mesh elements, the assignment of values for the initial Young’s modulus (
Comparison of experimental results with numerical simulations using new three-step damage laws for 43 hours and 14 days old concrete
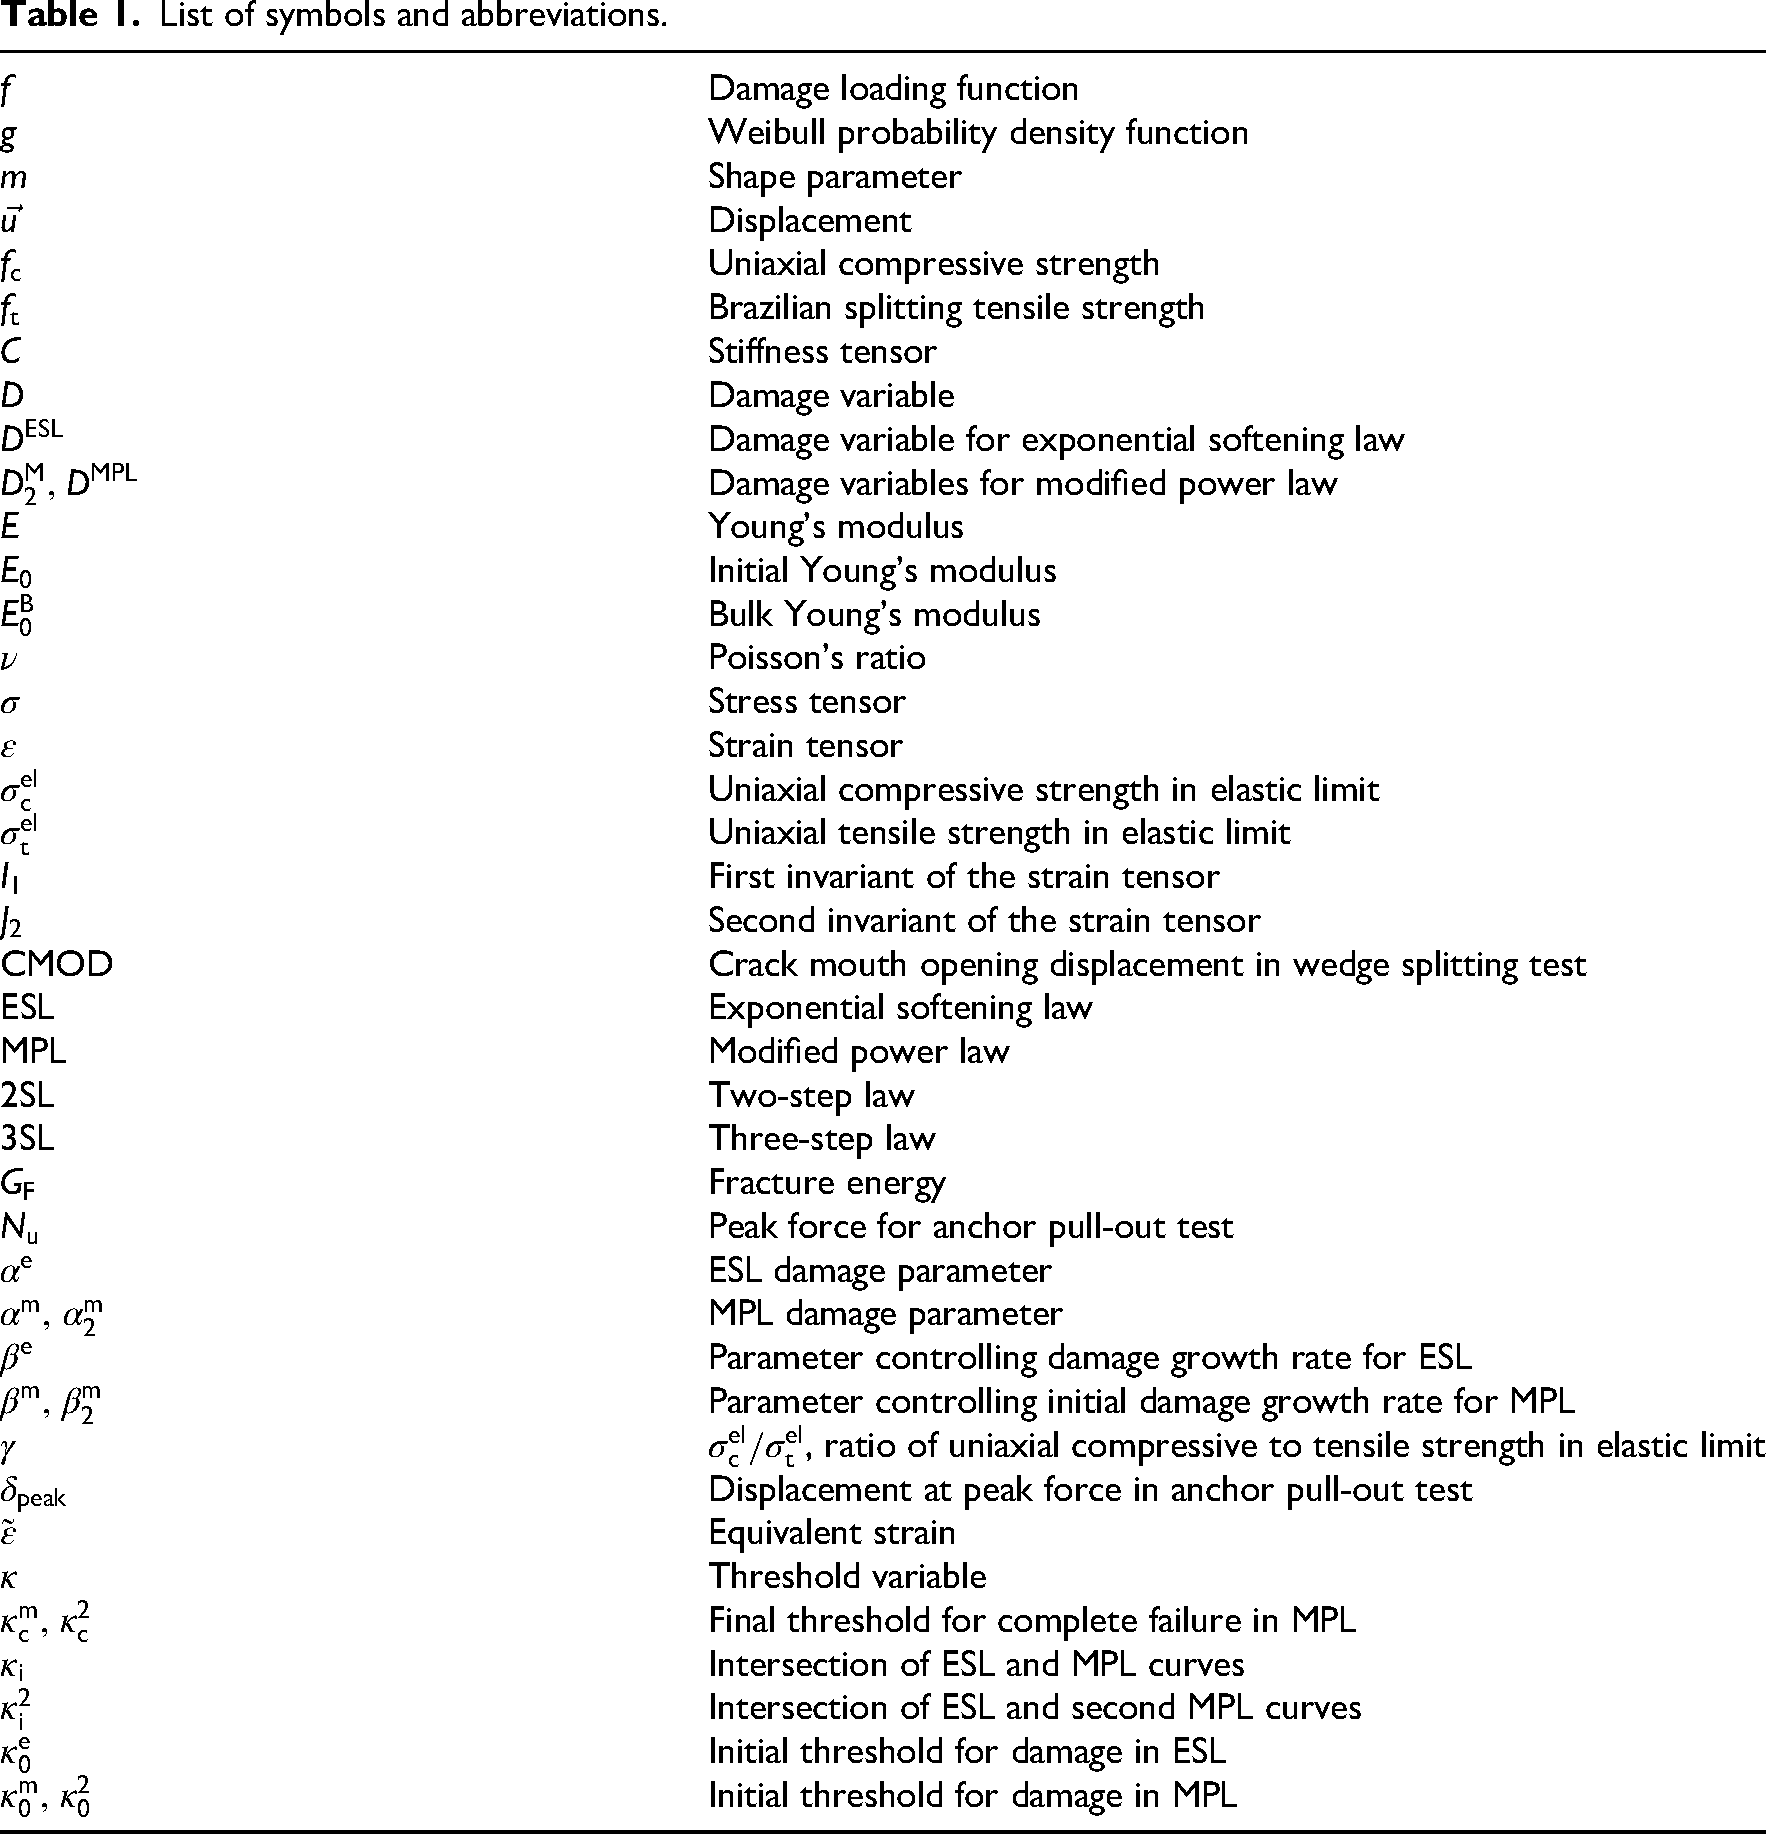
To accurately reproduce the experimental results of three tests: the unconfined compressive strength for the standard uniaxial compression test, the Brazilian splitting tensile strength, and the fracture energy of the concrete for the wedge-splitting test; the combination of two damage evolution laws is considered. The modified power law (Geers, 1997) and exponential softening laws (Peerlings et al., 1998) previously proposed for modelling damage in brittle composites and concrete respectively were combined in order to achieve a closer comparison with experimental results. It is important to note that in all four simulations (3 tests and anchor pull-out) the same parameters are used in the combined damage evolution law to find the best set of parameters that can reproduce the experimental results for 43 hours and 14 days old concrete for all four tests. These ages were chosen to compare with the detailed experimental results of Obayes et al. (2020) and Obayes et al. (2022) (specifically: S1–MIX–B and S4–MIX–B in Tables 1 and 2 in Obayes et al. 2022).
List of symbols and abbreviations.
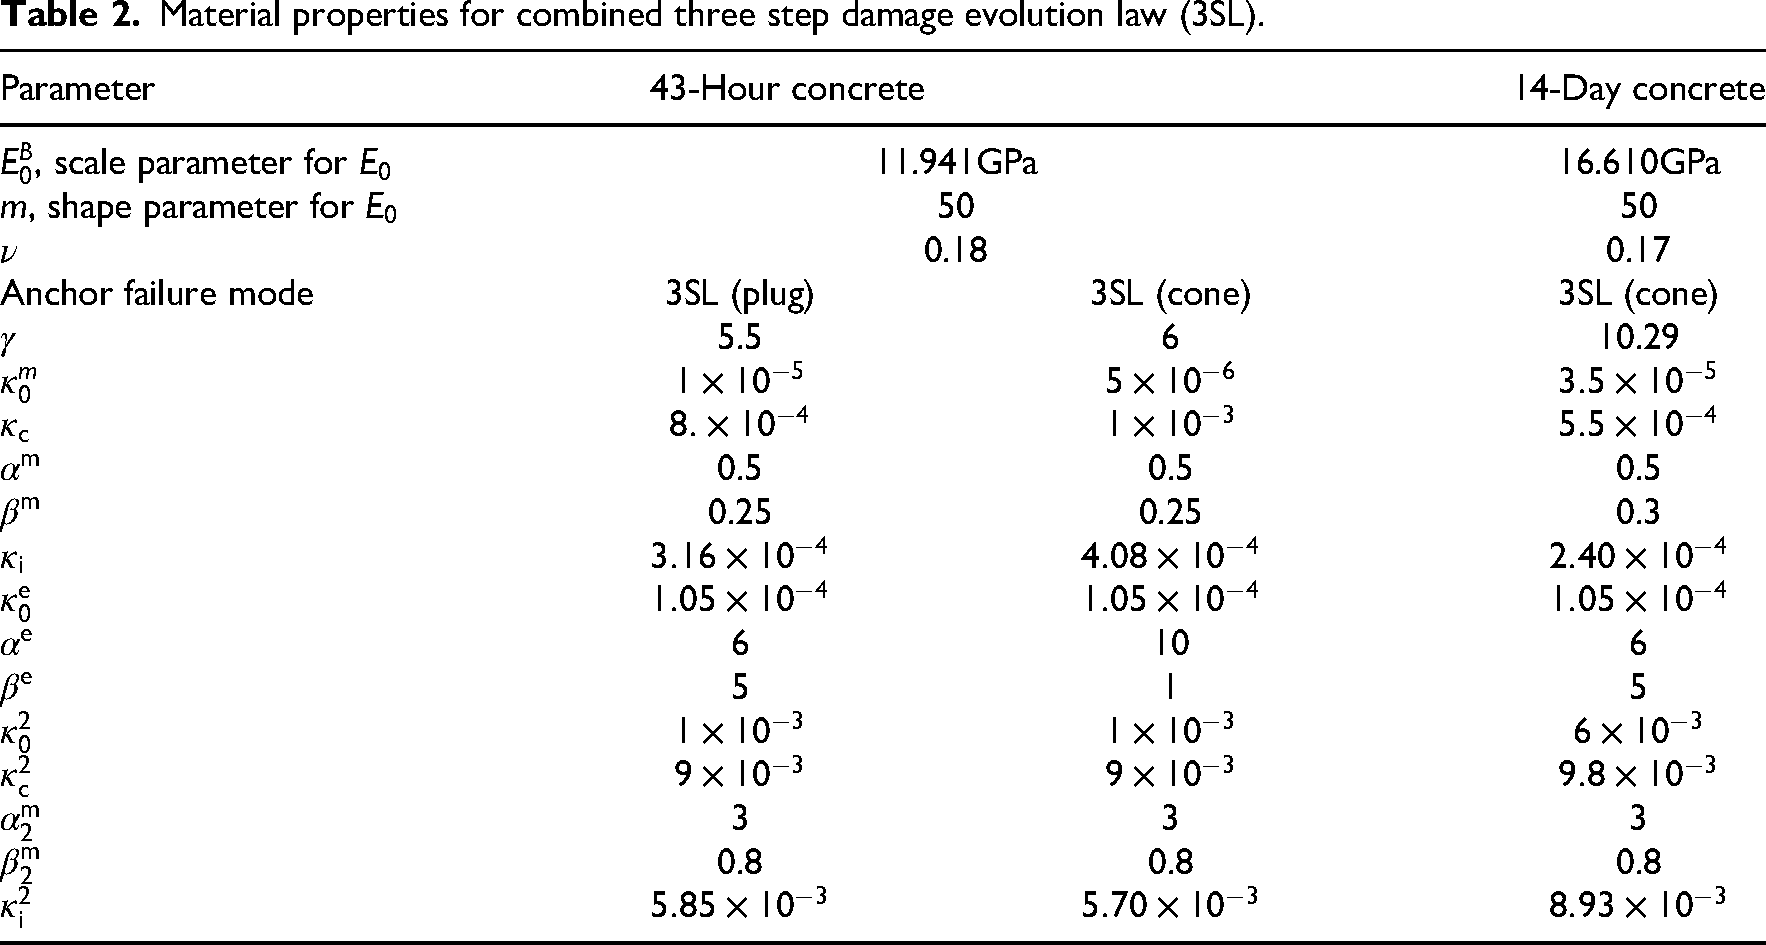
Material properties for combined three step damage evolution law (3SL).
A concrete mix with a slump of 80mm was used in Obayes et al. (2020) and Obayes et al. (2022) where N25 Grade concrete was used, comprised of 255kg general purpose cement, 938kg aggregates, 756kg sand, 174L water and 893mL of water reducing agent and a water to cement ratio of 0.68. Crushed aggregates were used with a maximum size of 14mm and no supplementary cementitious materials were added. For simplicity S1–MIX–B is defined to be the 43 hours old concrete and S4–MIX–B to be the 14 days old (334 hours old) concrete. Concrete cylinders were used to perform the uniaxial compressive and Brazilian splitting tensile strength tests with a length of 200mm and diameter of 100mm (dimensions shown in Figures 1 and 2(a) and (b)), while the cubes to determine the fracture energy from the wedge splitting tests were 100mm
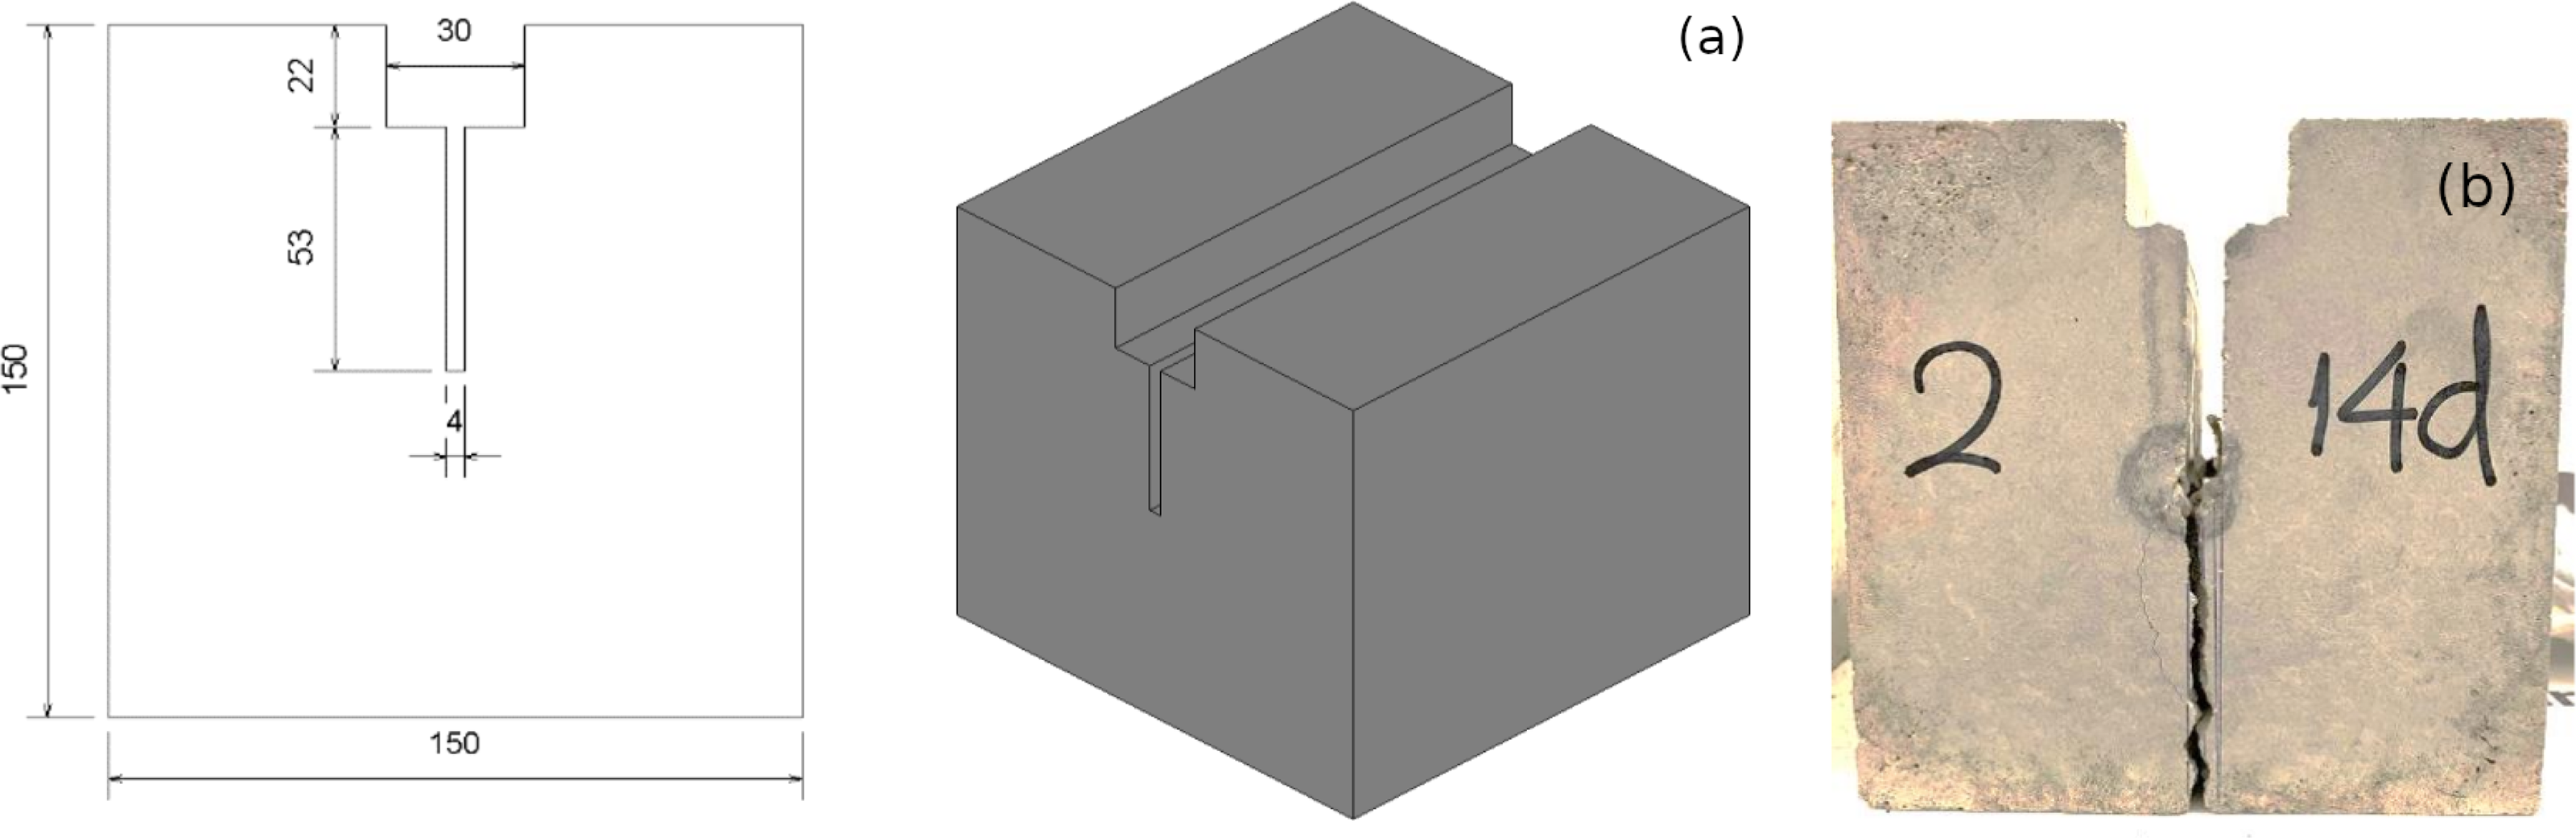
(a) Geometry of the wedge splitting test. (b) Typical wedge splitting crack profile from experiment. Taken from Obayes et al. (2020).
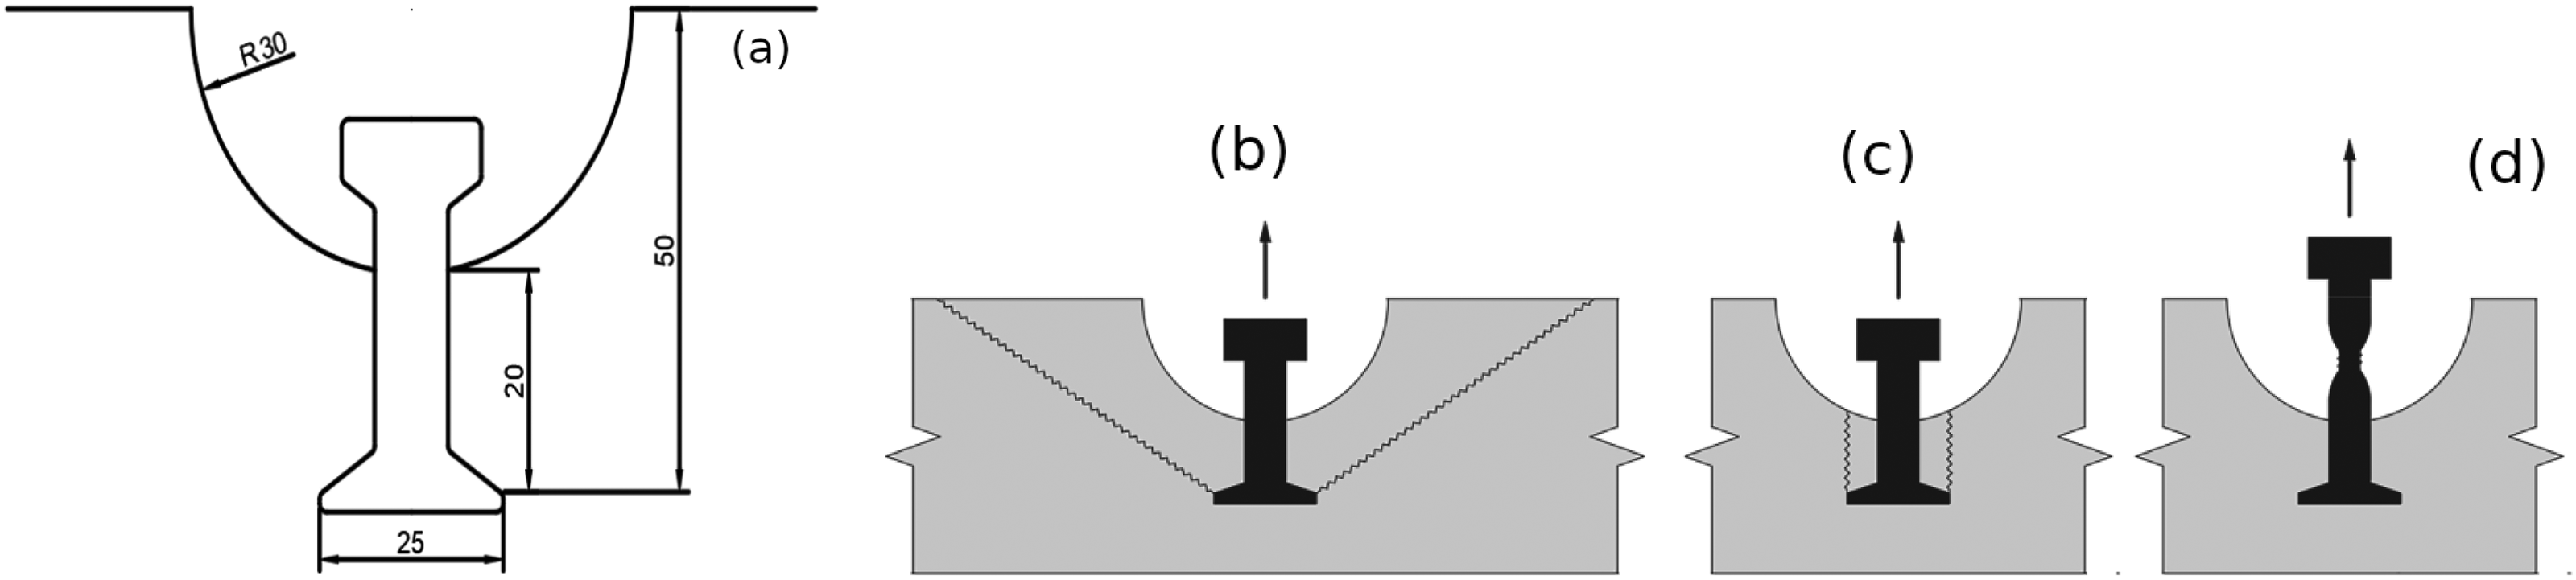
(a) Geometry of the anchor pull-out test. Anchor failure modes observed experimentally: cone failure in (b), plug failure in (c) and steel rupture in (d). Taken from Obayes et al. (2020) and Obayes et al. (2022).
To demonstrate the versatility of the new combined three-step damage evolution law the experimental results of Obayes et al. (2020) and Obayes et al. (2022) are simulated. The results of the three tests in “Uniaxial UC compression analysis”, “Brazilian splitting test analysis” and “Wedge splitting test analysis” for the concrete mixes: S1–MIX–B (43 hours old) and S4–MIX–B (14 days old) in Table 2 in Obayes et al. (2022) are simulated using the dimensions stated above for the different simulations of the three calibration tests and anchor tension test.
Table 2 displays the parameters employed in the combined damage law for concrete at the two different ages: 43 hours and 14 days old. These parameters were chosen after running many hundreds of simulations for all three tests as well as the anchor pull-out test, by selecting the parameters for both concrete ages that matched the experimental mechanical properties for all four experimental tests best. The ranges tested for each parameter defined in Table 2 were:
Comparison of mechanical properties obtained from experiment or numerical simulations for combined three-step damage evolution law (3SL).
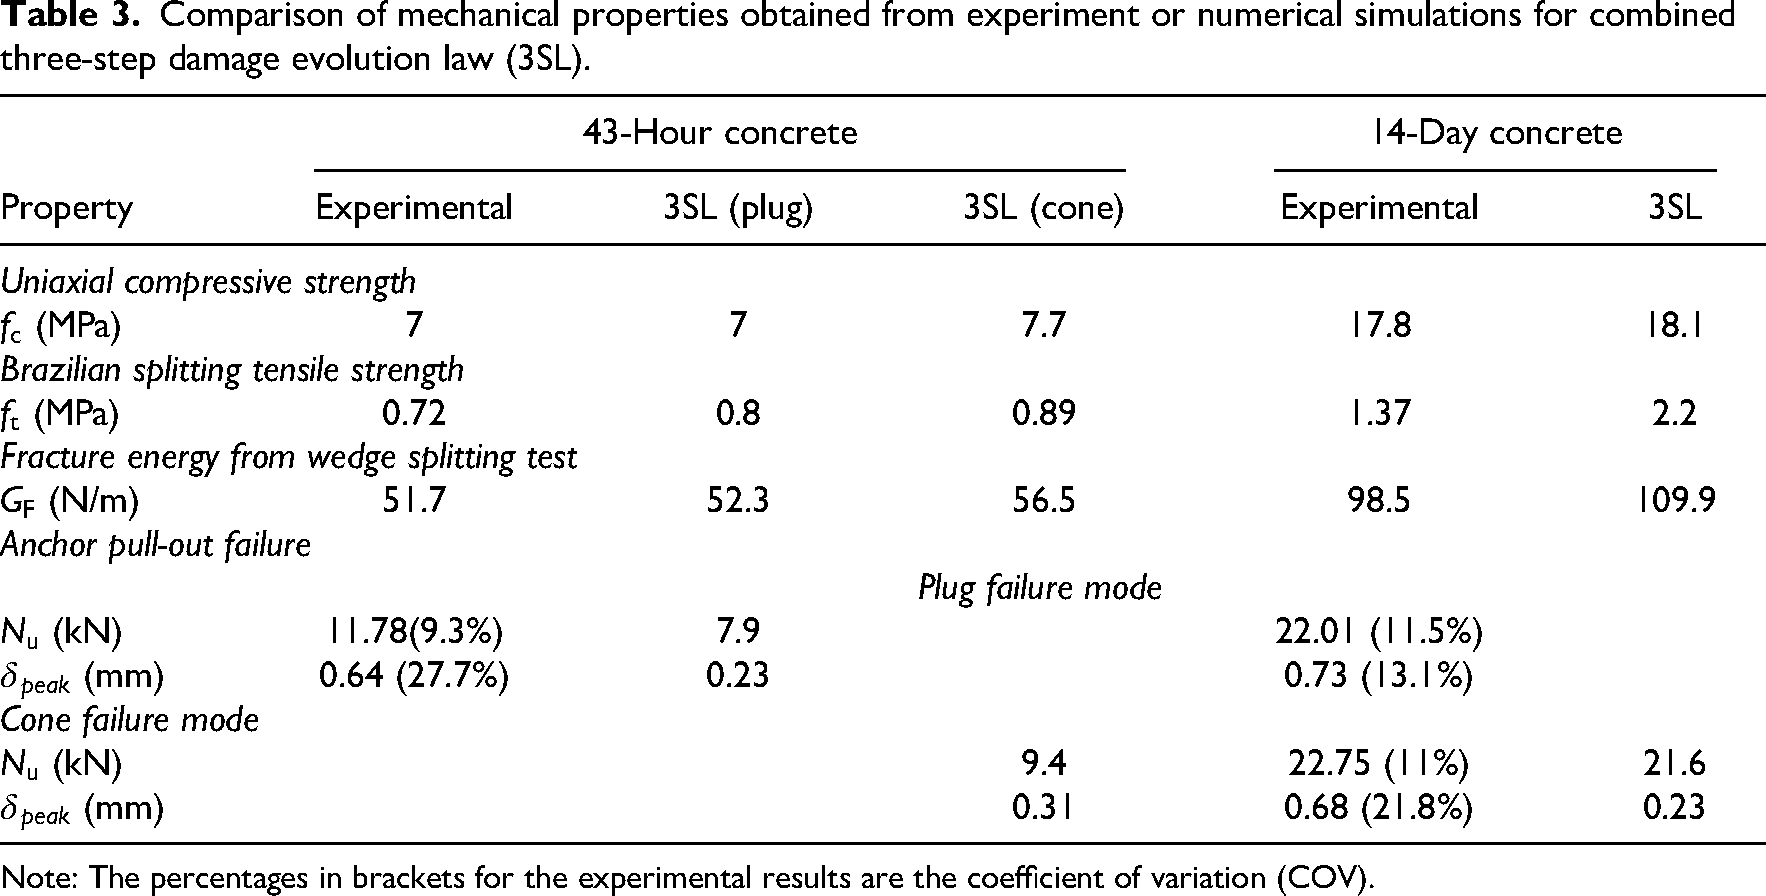
Note: The percentages in brackets for the experimental results are the coefficient of variation (COV).
The next three subsections show how the numerical model is benchmarked to best match the experimental data for the three tests: standard compressive test (AS1012.9), splitting tensile test (AS1012.10) and the wedge splitting test (Obayes et al., 2022, 2020; Østergaard, 2003). In each test the displacement increment is chosen to correlate with the experimental loading rate for each test. This was changed for the different tests as specifically the wedge splitting and anchor pull-out tests involve highly localised strain rates with large magnitudes. The dependence of the results on strain rate has been found experimentally as well, and has been found by many other researchers. Bischoff and Perry (1986) showed that the compressive strength of concrete increases with strain rate, and the numerical simulations also showed an increase in compressive strength, tensile splitting strength, fracture energy and peak load for the anchor with higher strain rates. Because the strain rate is not set automatically in the experiments but manually using a hand jack, the same displacement increment is enforced in the numerical simulations.
Uniaxial compression analysis
A 3D tetrahedral mesh (as shown in Figure 1(a)) was created for a cylindrical concrete sample with diameter of 100mm and height of 200mm as described by Obayes et al. (2020) and Obayes et al. (2022) used in the standard compressive test (AS1012.9). The loading rate for the experiment was 0.33MPa/s. In the initial stages of compression (linear elastic regime) this equates to a displacement loading rate of approximately 0.33mm/min for the 43 hours old concrete and 0.24mm/min for the 14 days old concrete. A displacement increment of
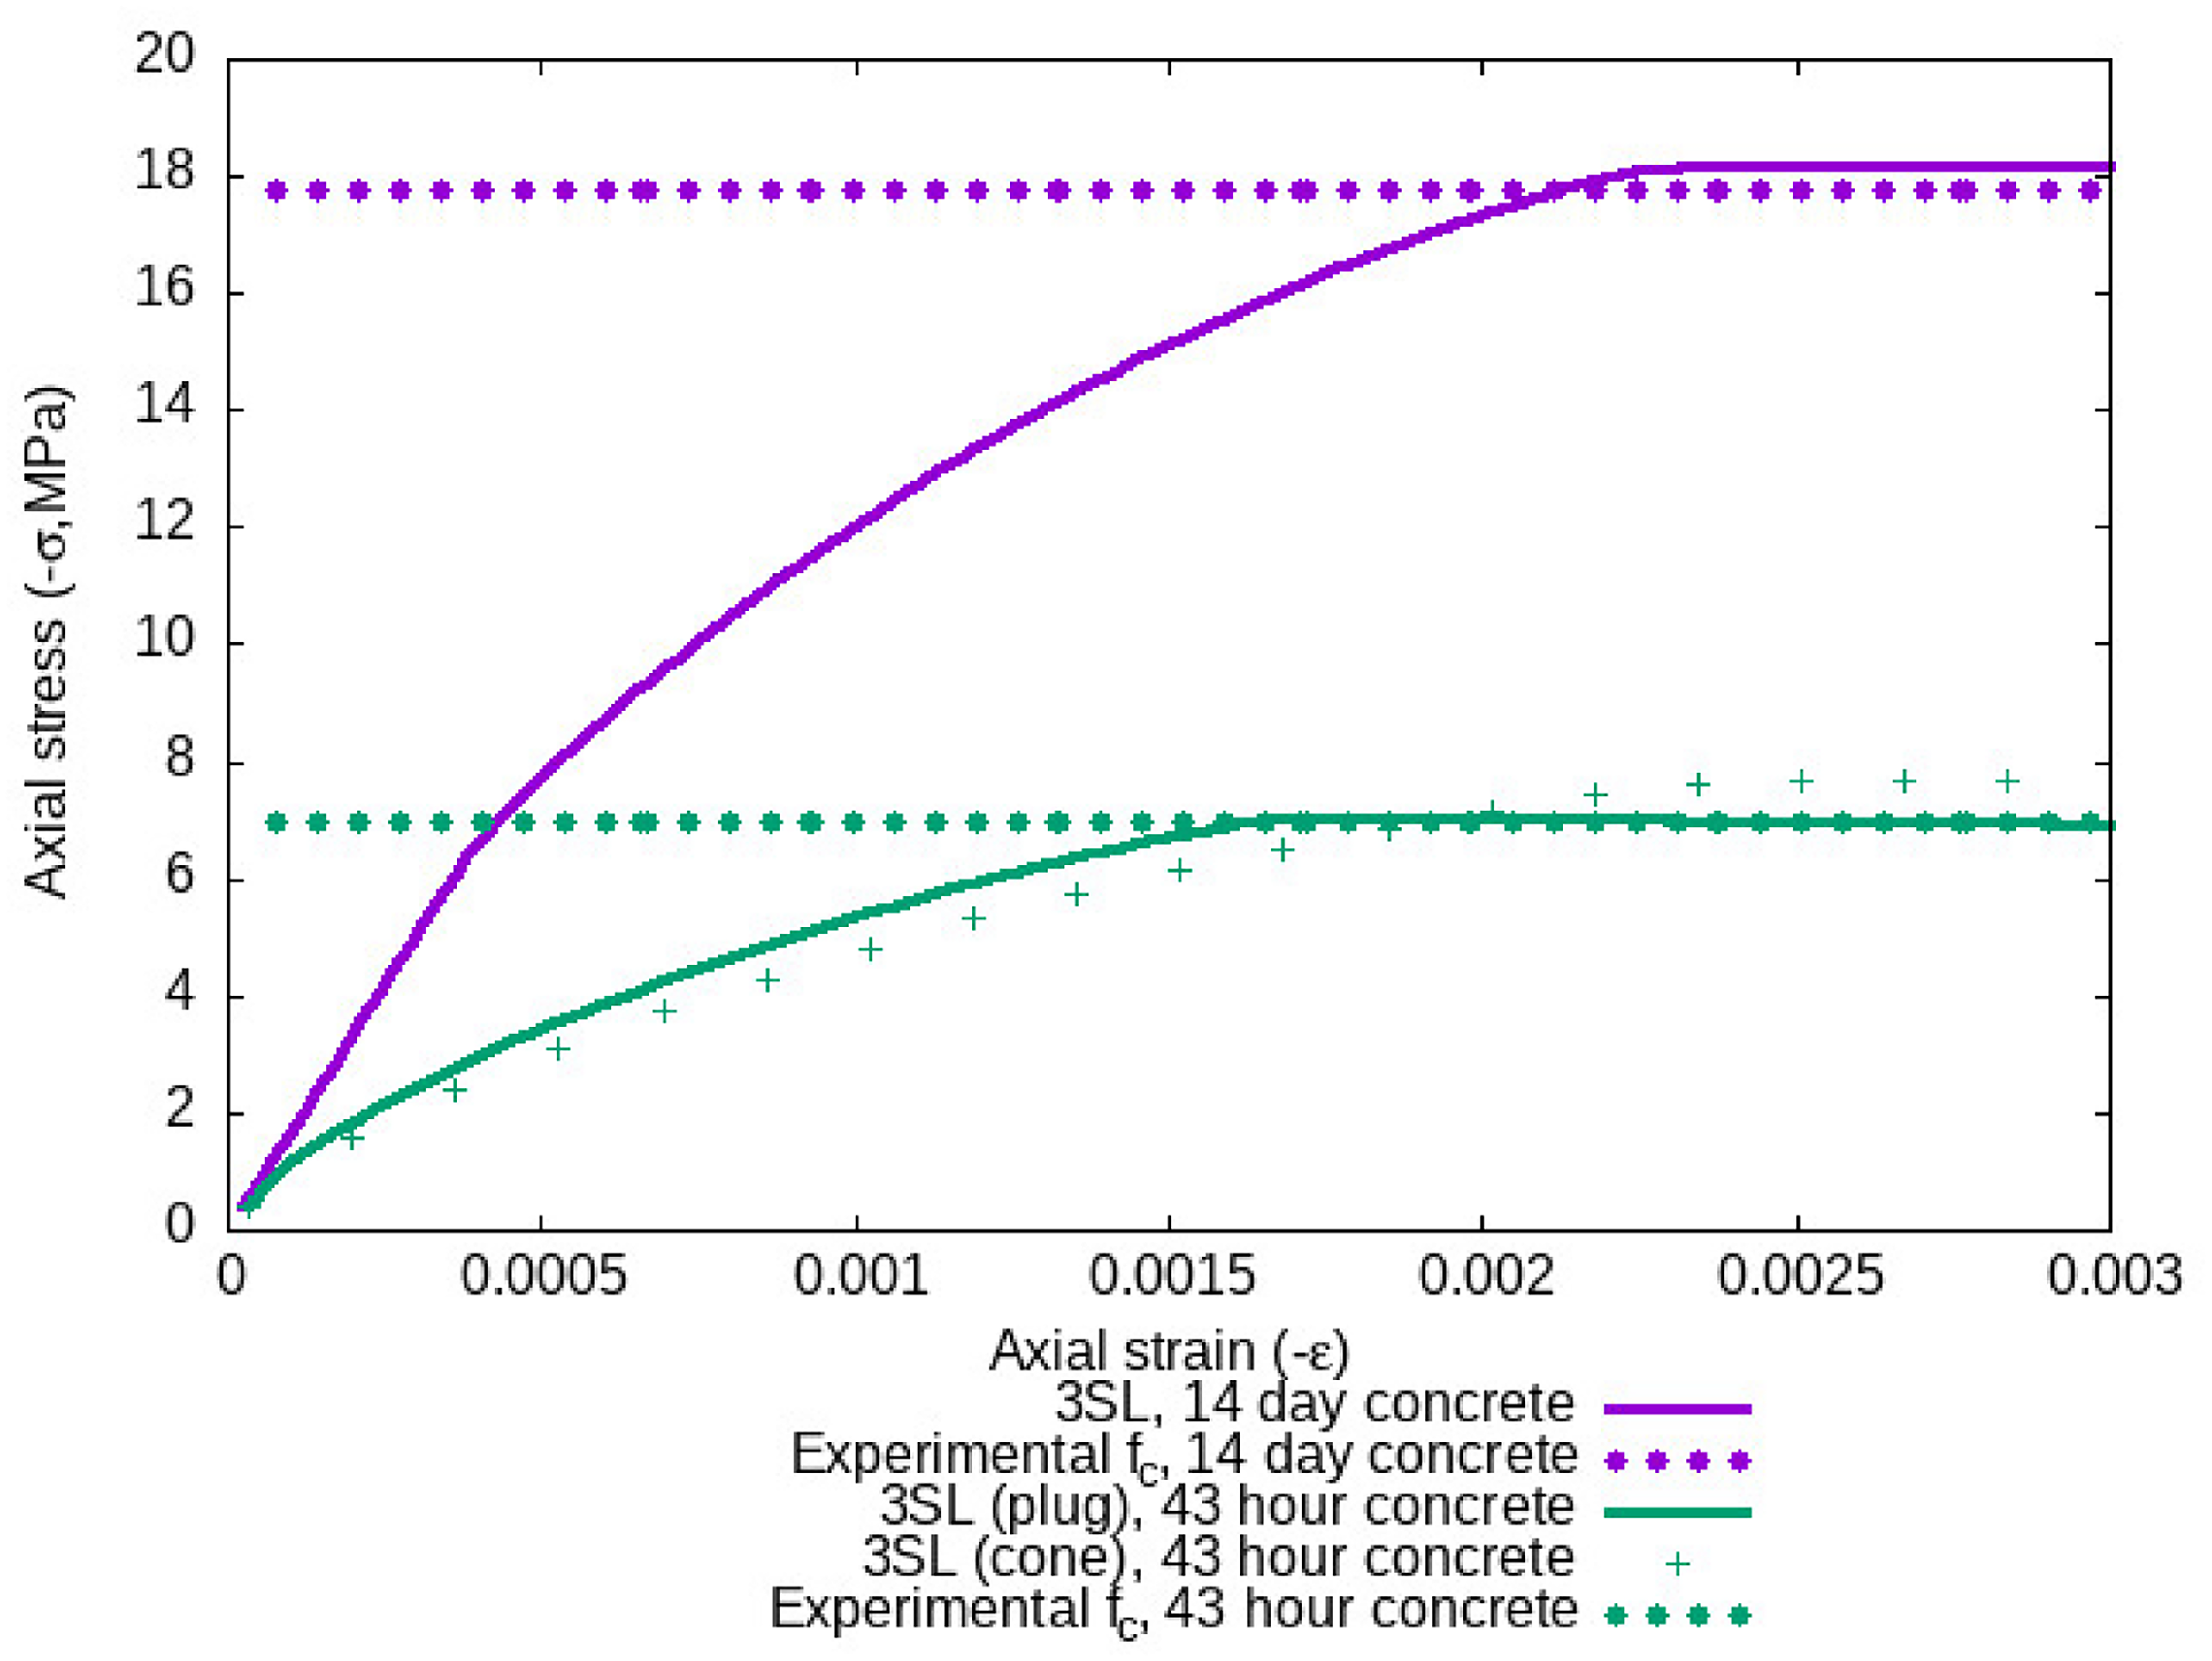
Stress–strain curve under uniaxial compression for both concrete ages.
In the next subsection ‘Mesh dependency analysis’ a mesh sensitivity study is performed to demonstrate the mesh insensitivity of the combined damage law used in the numerical simulations. Because of the high computational resources needed to run mesh sensitivity studies mesh sensitivity studies were only performed for the uniaxial compression test.
Mesh dependency analysis
Figure 6 shows that the stress–strain curves for both concrete ages converge as the mesh resolution increases. The mesh resolution restricted the tetrahedral meshes to have a maximum mesh element size of 3mm for the mesh with 255,321 elements, 1.5mm for the mesh with 1,866,738 elements, 1.1mm for the mesh with 4,660,935 elements (highest mesh resolution able to be achieved for the simulations). The plots show that the peak uniaxial compressive strength only varies by approximately 0.8% for the 14 days old concrete when comparing the uniaxial compressive strengths obtained using the lowest mesh resolution (255,721 elements) and highest mesh resolution (6,158,300 elements), and 1.5-1.6% for the 43 hours old concrete. From these results it is also clear that the mesh sensitivity is predominantly present in the post-failure behaviour.
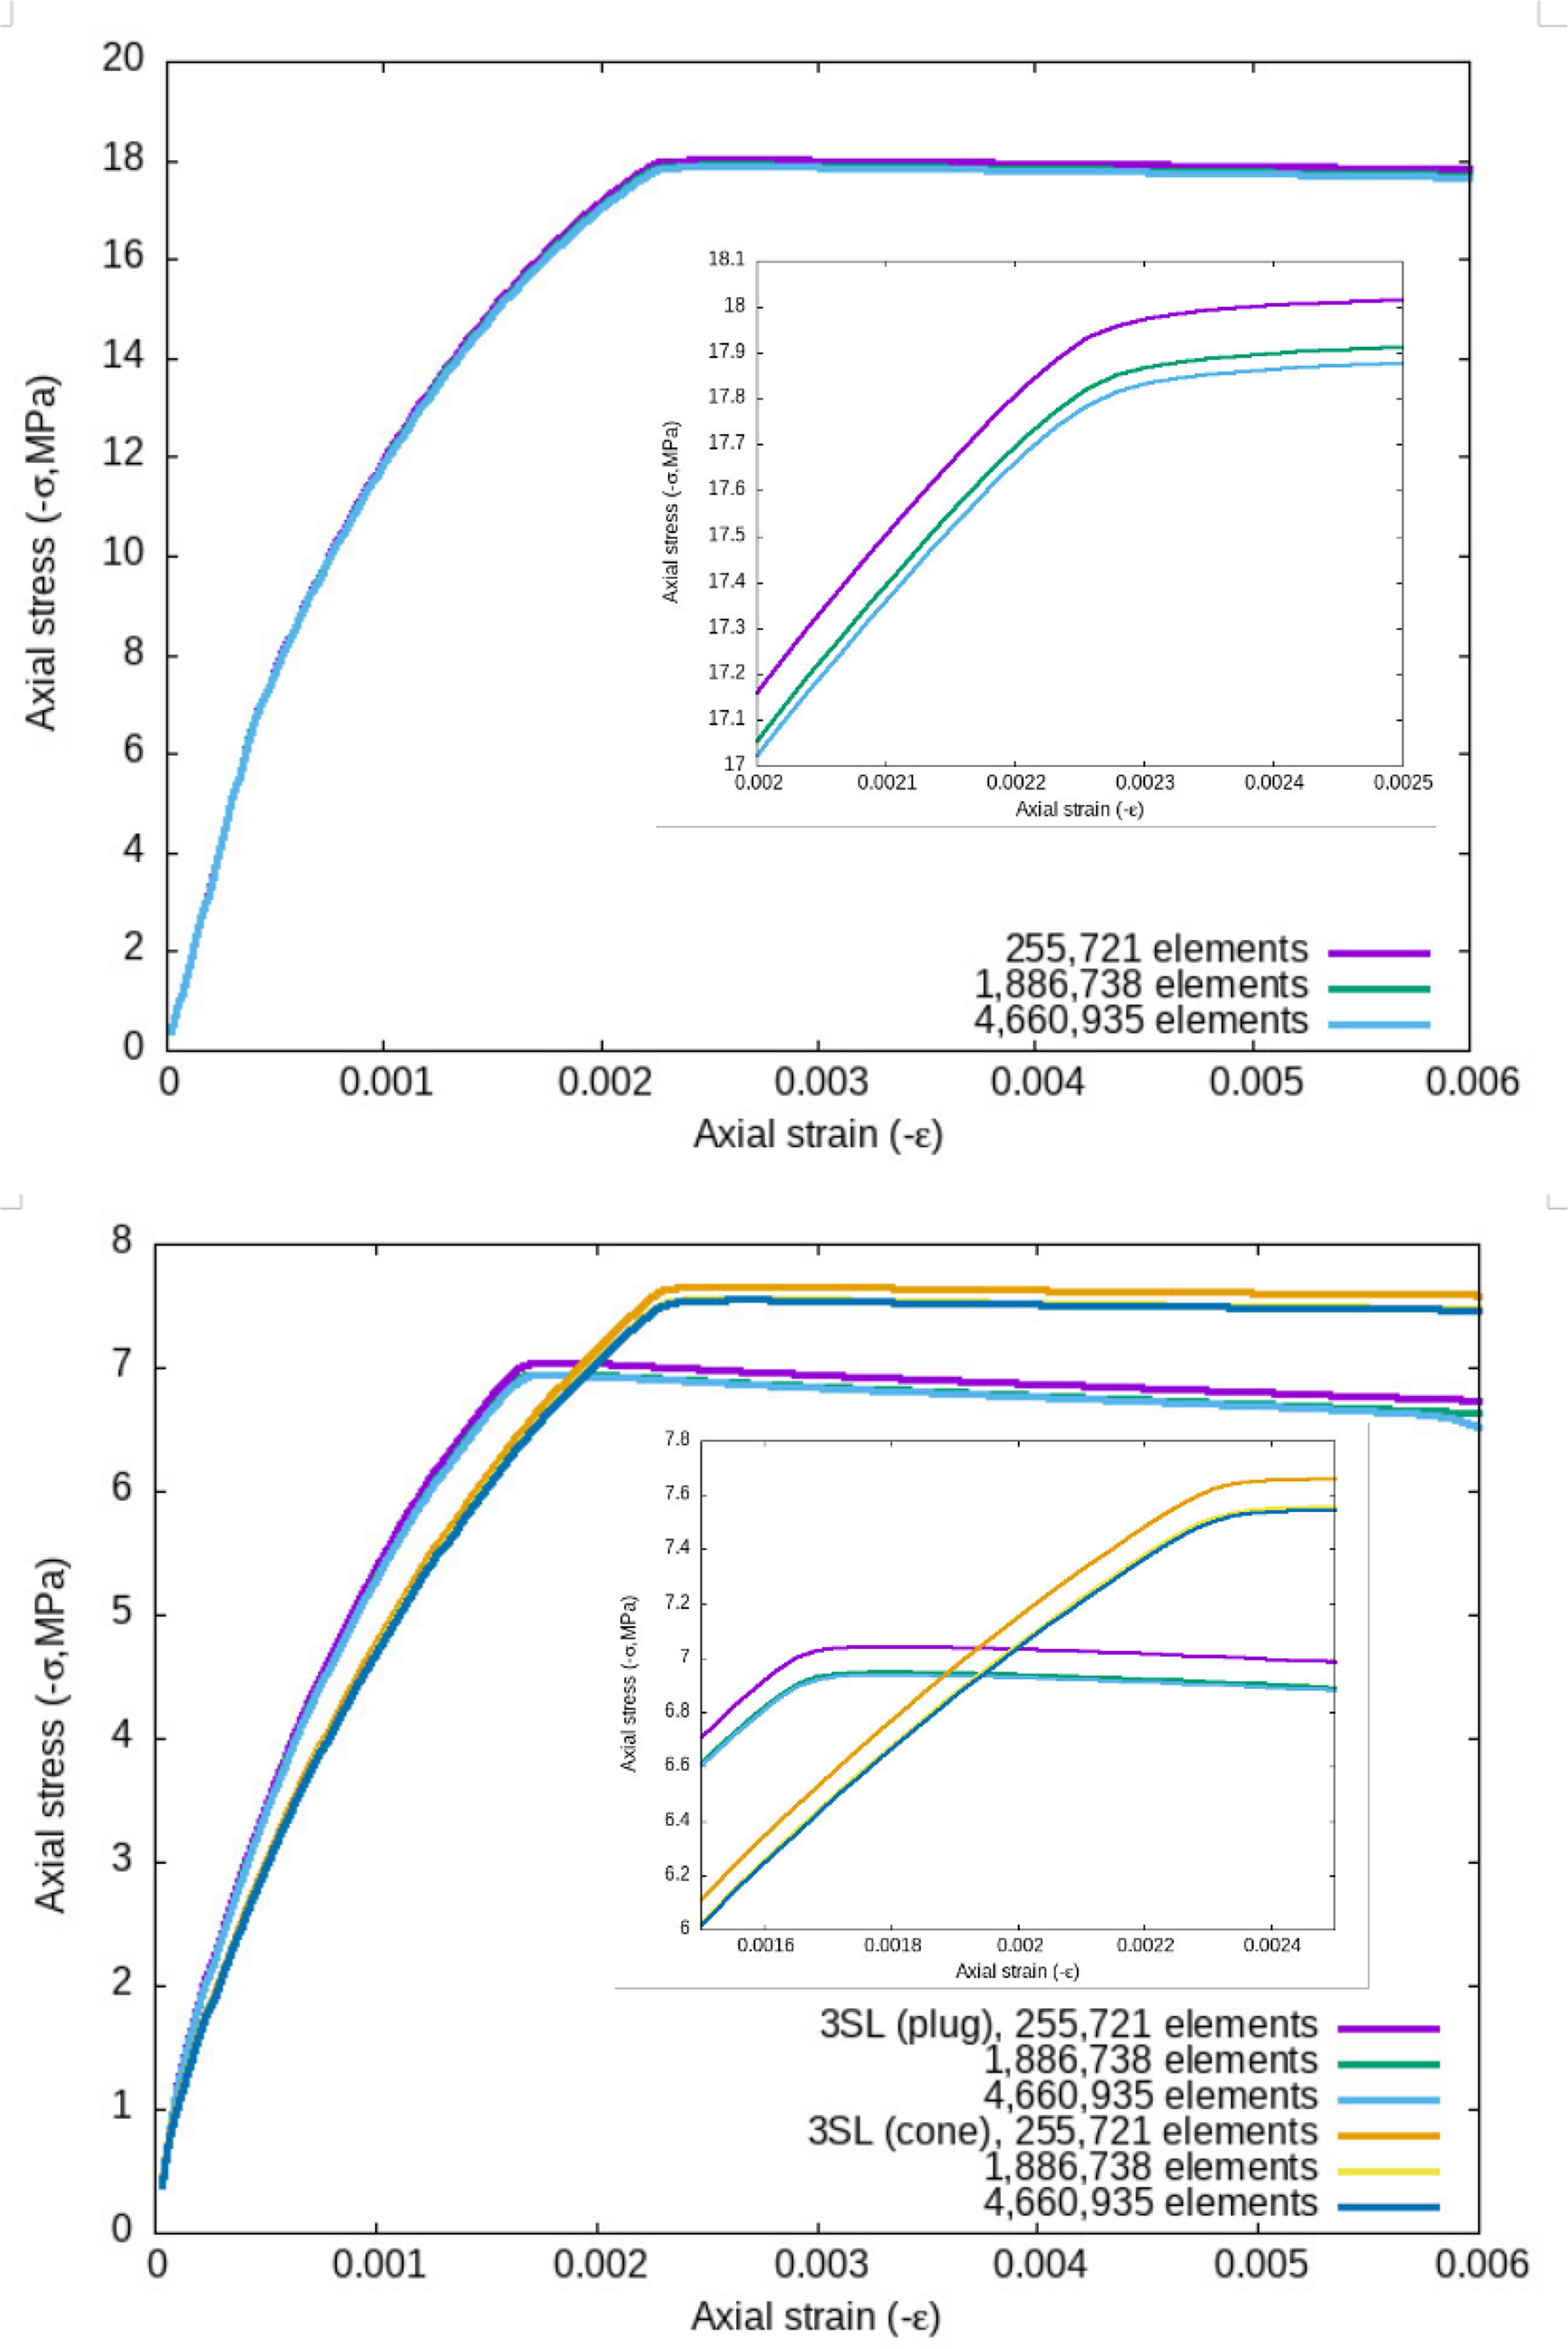
Mesh sensitivity of the stress–strain curve under uniaxial compression for the 14 days and 43 hours old concrete in (a) and (b), respectively.
Mesh sensitivity studies were only performed for the uniaxial compression test. This was partially due to limitations of computational resources for the larger volumes modelled in the wedge splitting and anchor pull-out tests. Because of these computational limitations, for the remaining simulations the finite element tetrahedral meshes are restricted to have a length less than 3mm. To be consistent the same mesh size is maintained for all four tests simulated (maximum length of any tetrahedra was restricted to be under 3mm).
Brazilian splitting test analysis
A 3D tetrahedral mesh (as shown in Figure 1(b)) was created for a cylindrical concrete sample with diameter of 100 mm and height of 200mm as described by Obayes et al. (2020) and Obayes et al. (2022) used in the splitting tensile test (AS1012.10). The loading rate for the experiment was 0.025 MPa/s over a 10mm wide strip down the length of the cylinder. In the initial stages of the test (linear elastic regime) this equates to a displacement loading rate of approximately 0.012mm/min for the 43-hour and 0.009 mm/min for the 14 days old concrete. In the numerical simulations a displacement increment of
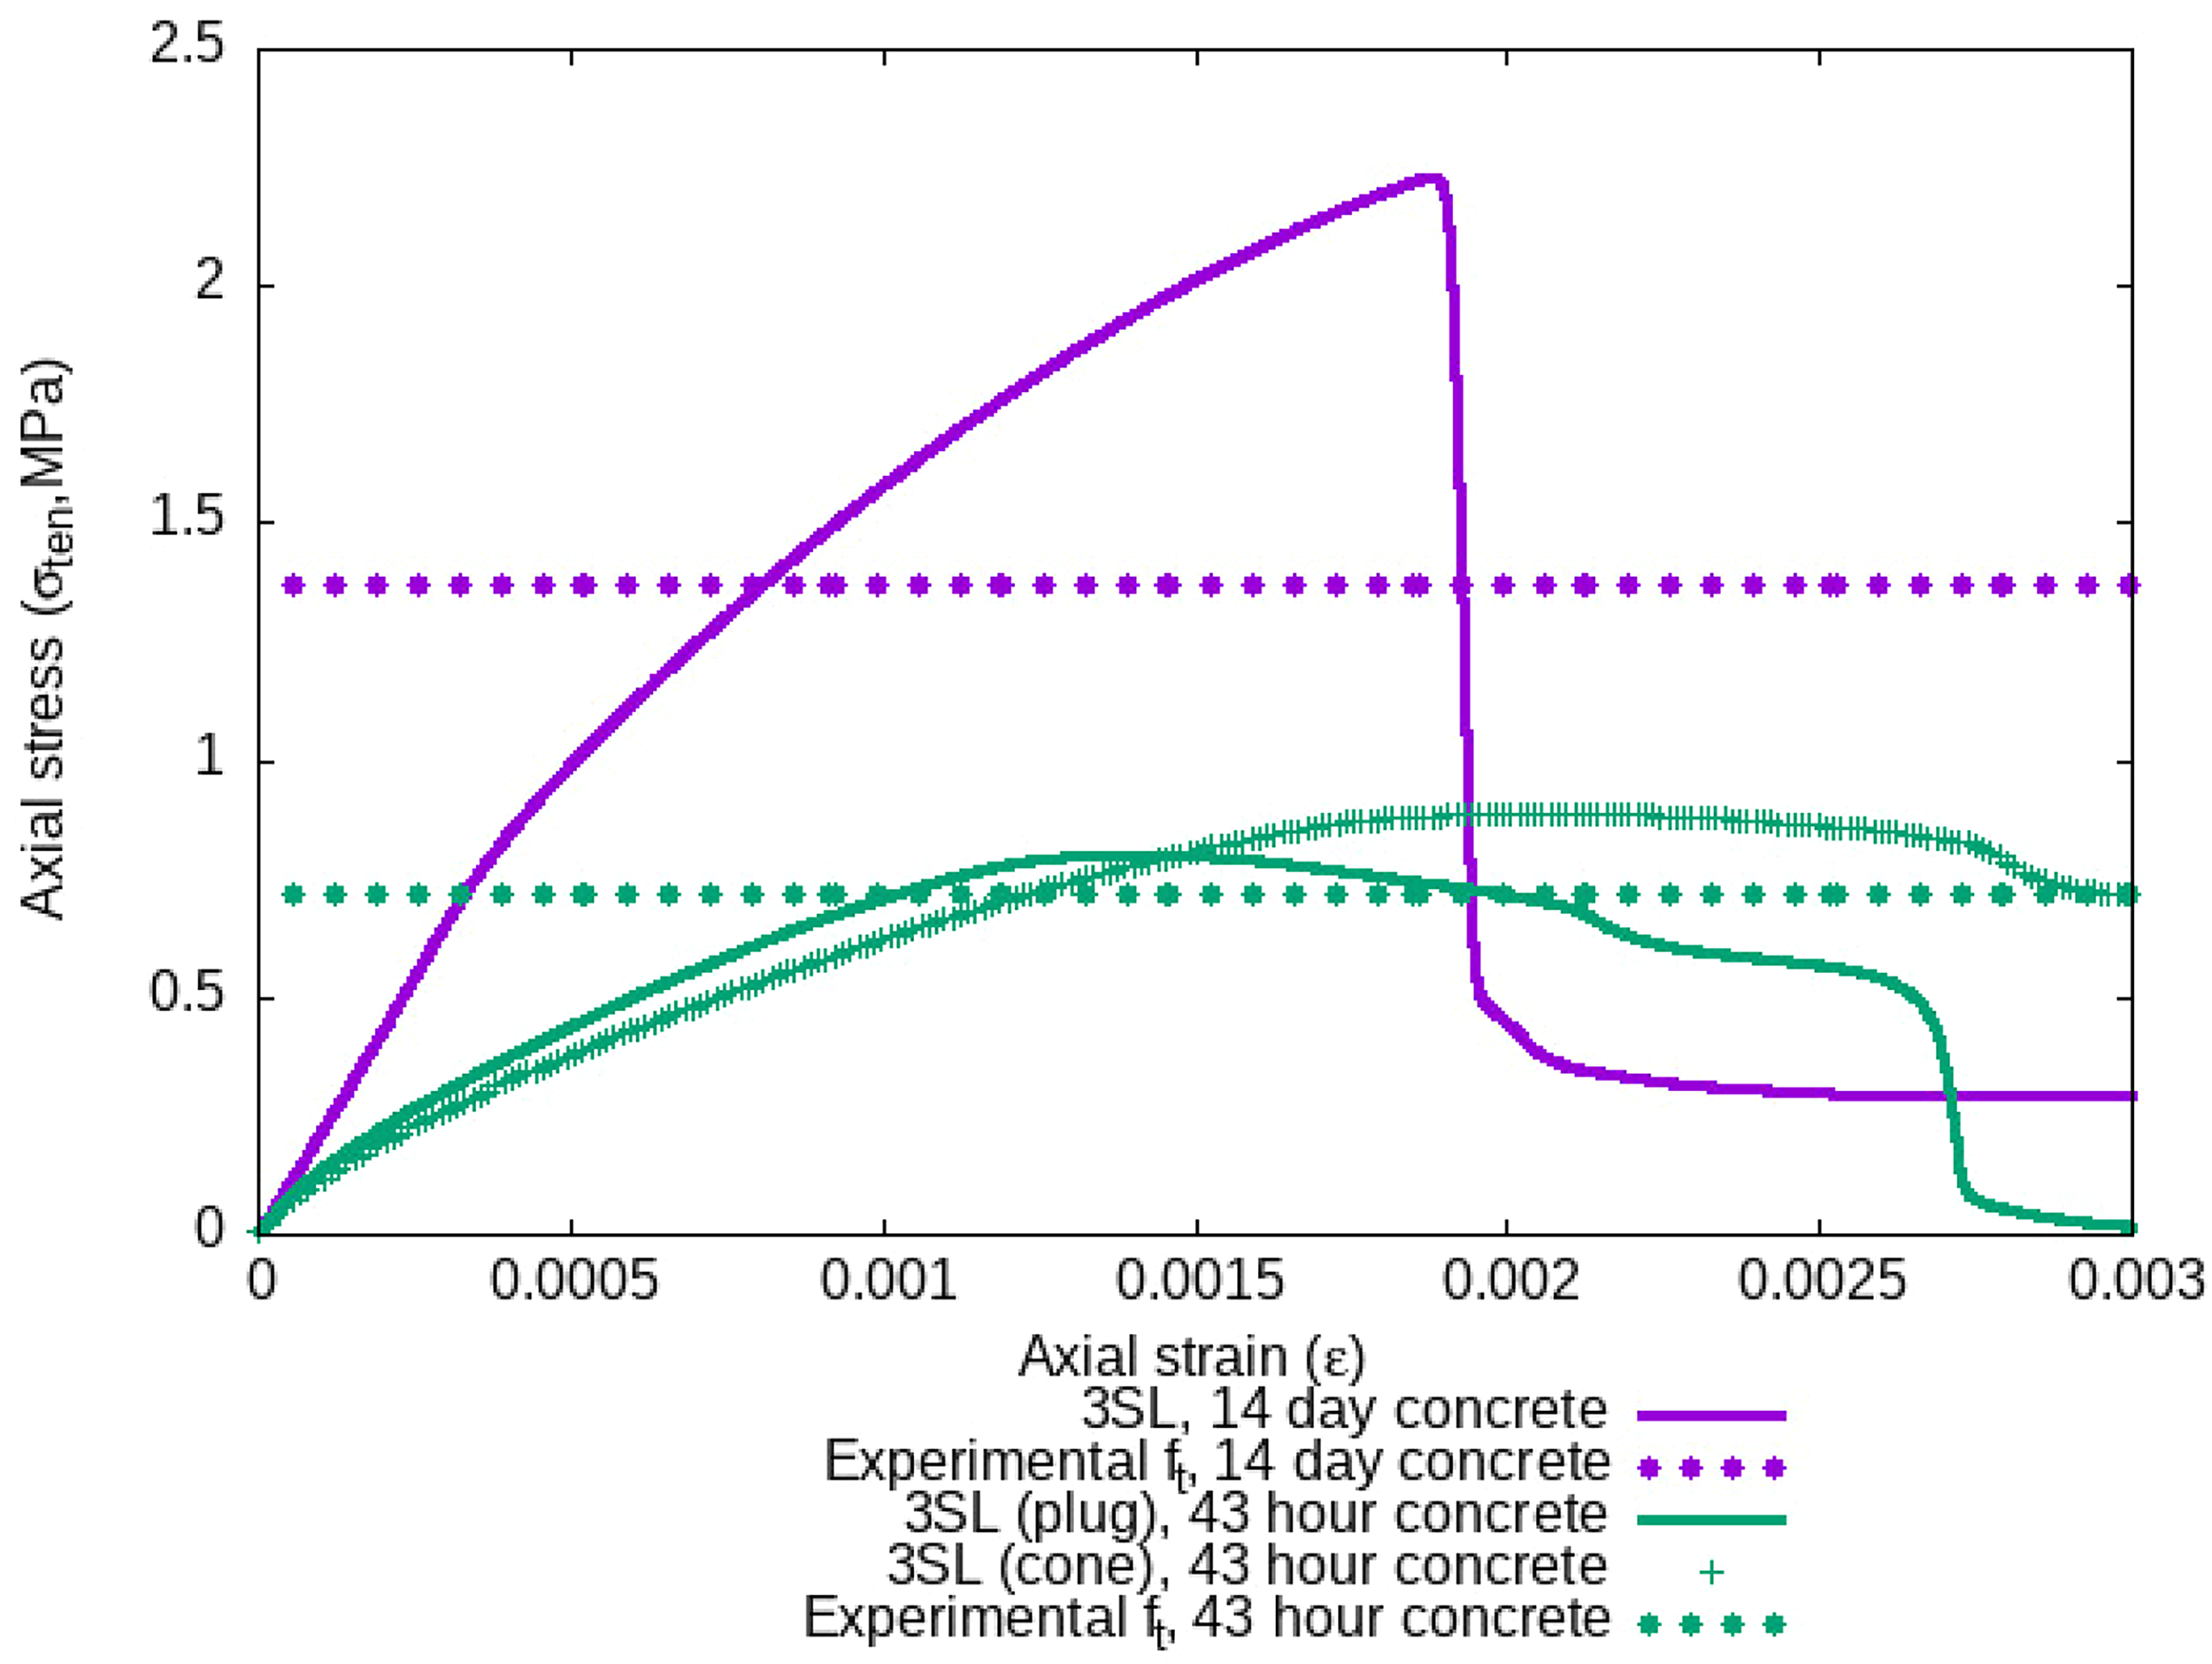
Stress–strain curve for Brazilian tensile splitting test for both concrete ages.
Material properties for the single damage evolution laws.
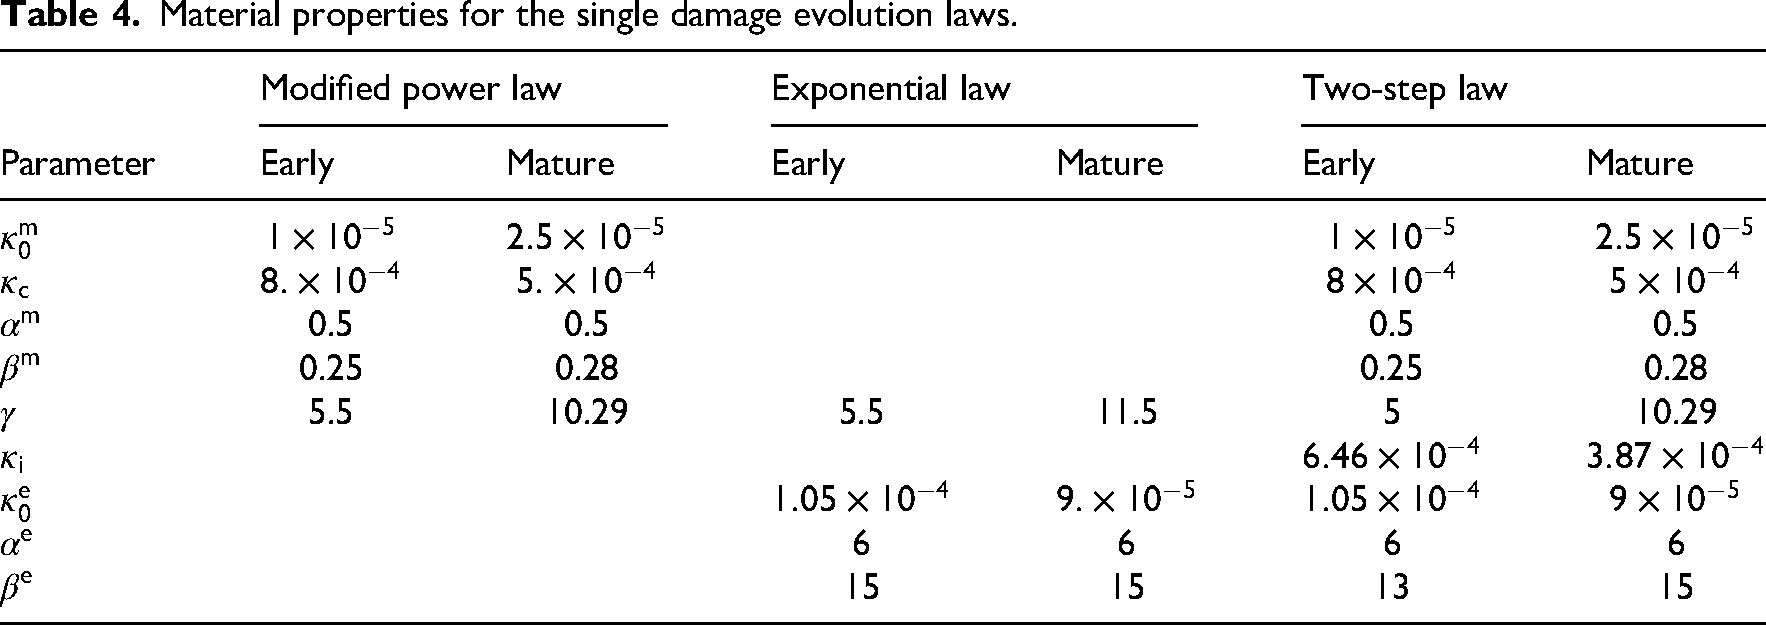
Figure 8 shows the damage plots for the concrete samples after they have failed. Figure 8(a) and (b) shows the surface damage plots for the 43 hours old concrete for the 3SL plug and cone failure laws, respectively, and show that the largest damage values occur at the loading strips at the top and bottom of the cylinder and more diffuse damage occurs down the middle of the sample. In contrast Figure 8(c) and (d) shows the internal and surface damage plots, respectively, for the 14 days old concrete where the crack is highly localised down the middle of the concrete as commonly seen in Brazilian tests experimentally for 28 day concrete as well.
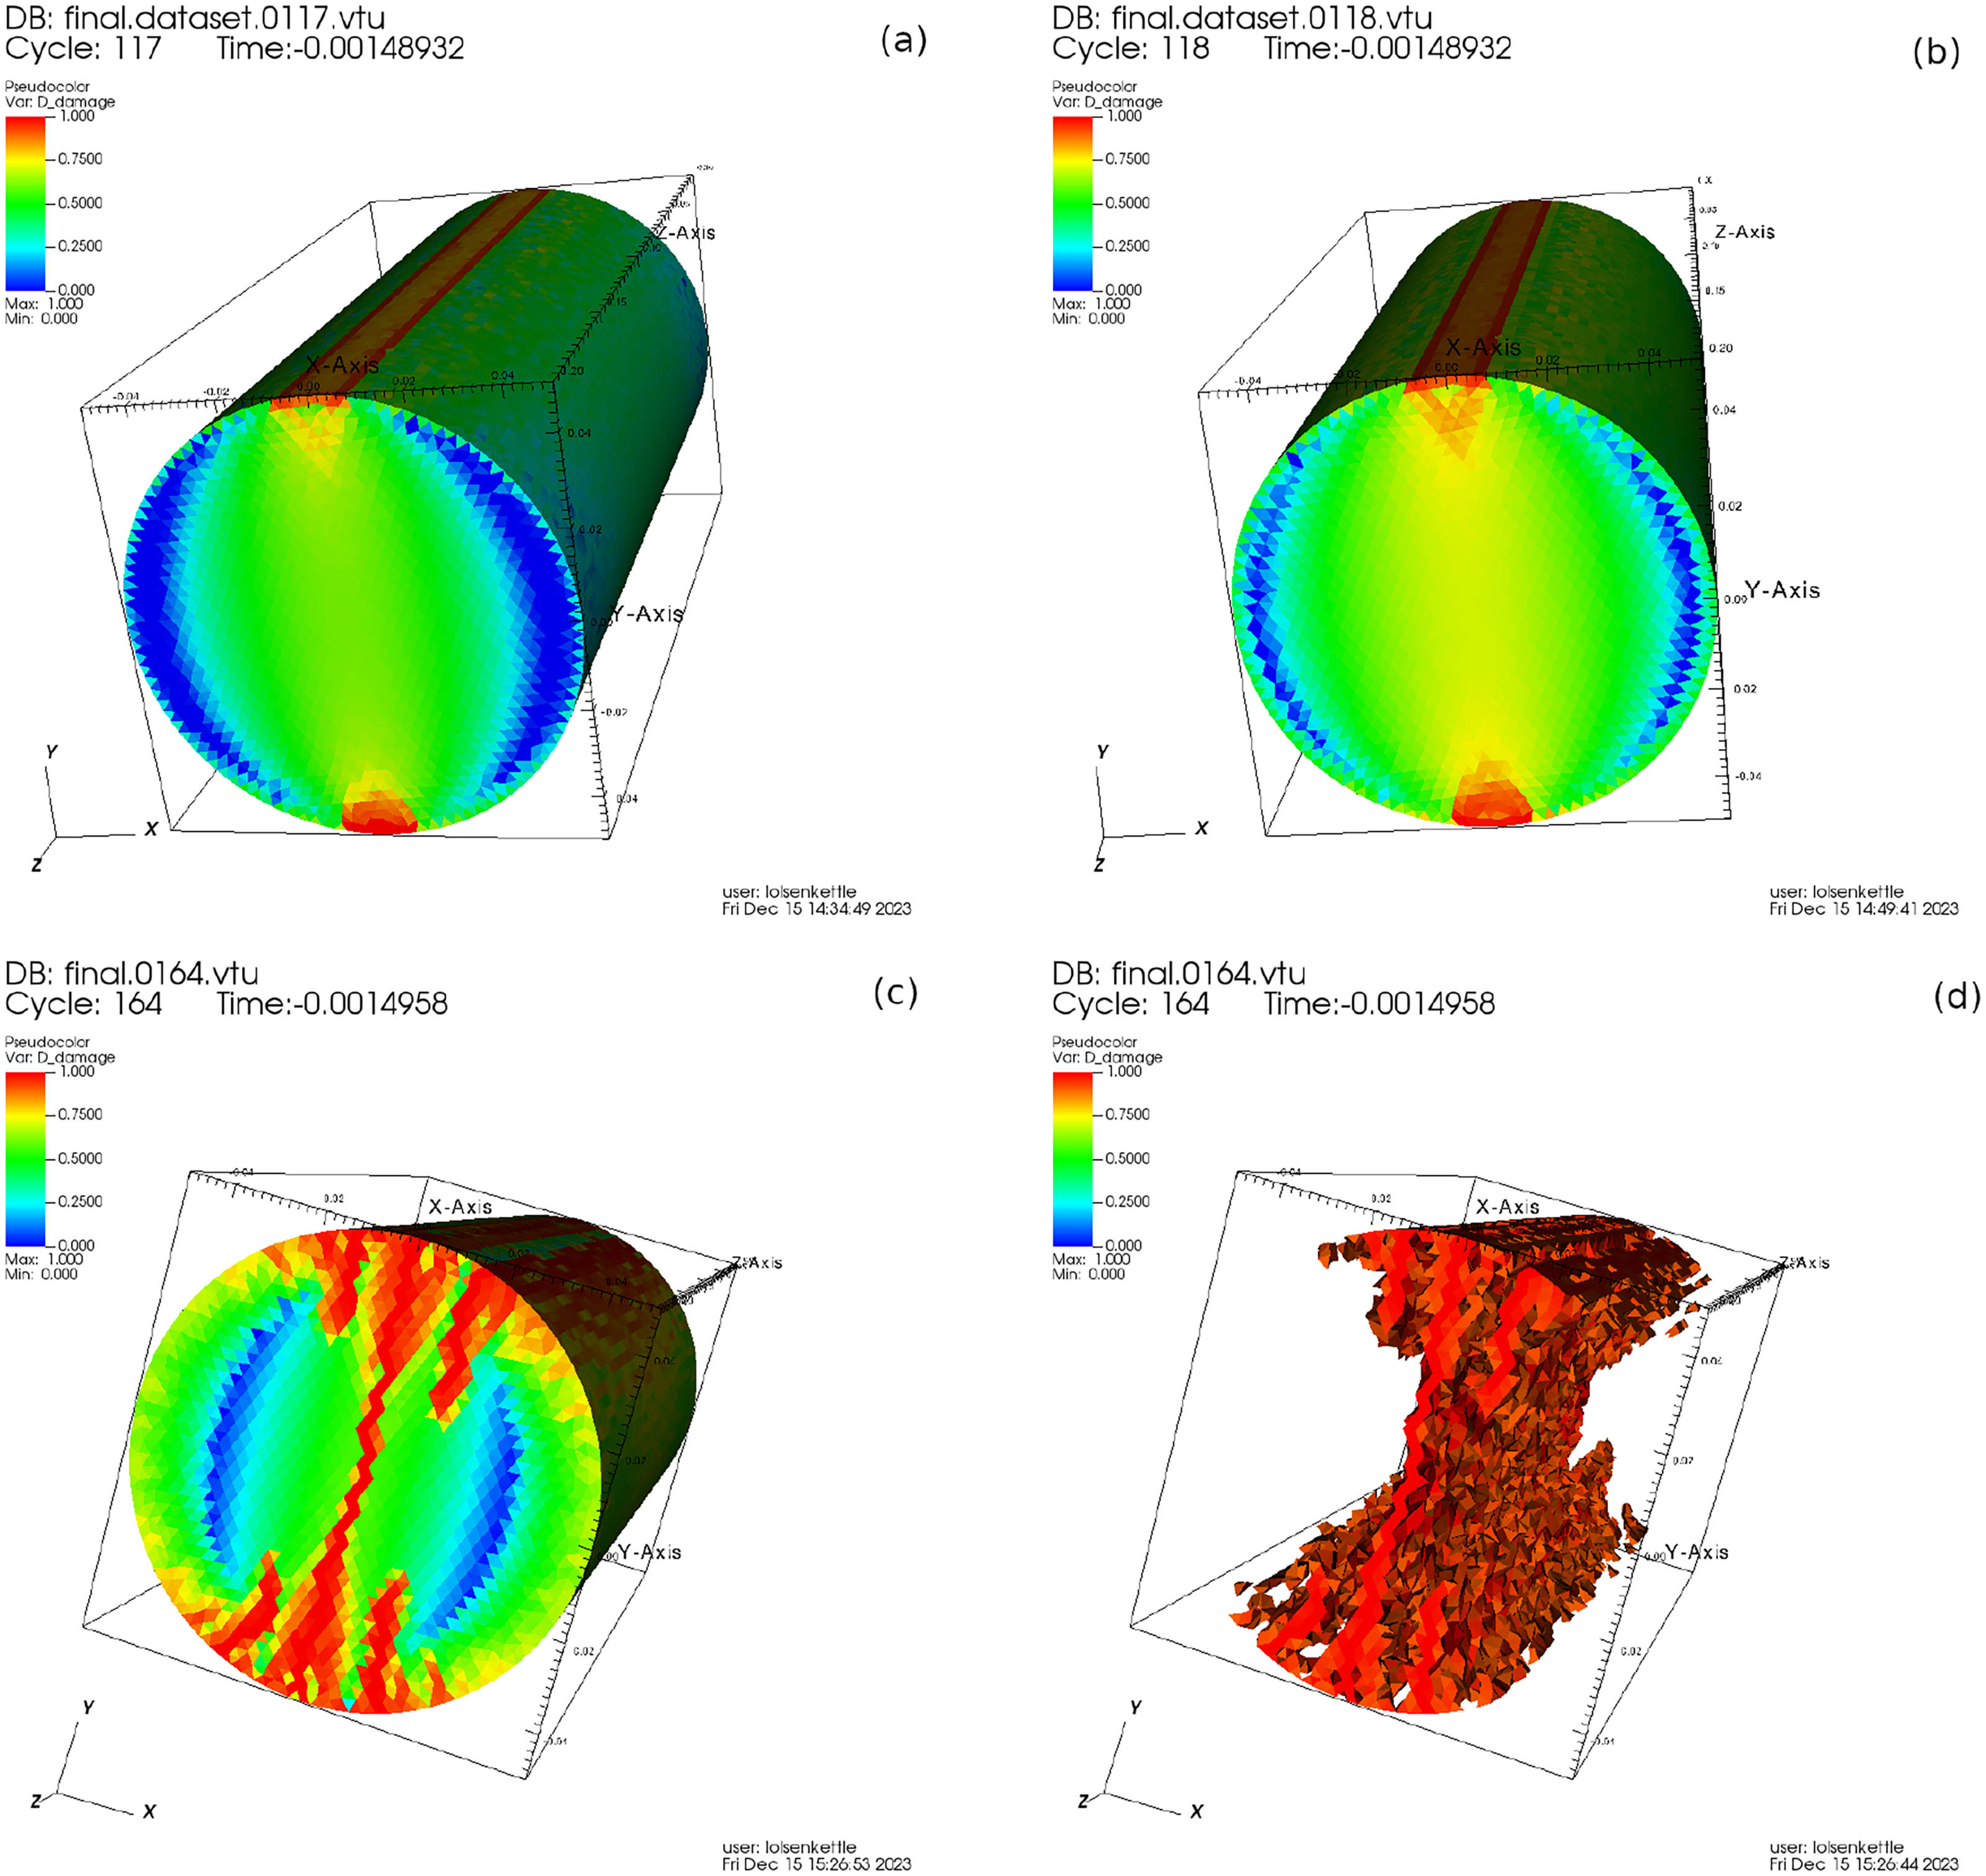
Damage plots for the 43 hours old concrete in (a) and (b), respectively, for the 3SL plug and 3SL cone damage evolution laws. Damage and internal damage post failure for the Brazilian tensile splitting test for the 14 days old concrete in (c) and (d), respectively.
Wedge splitting test analysis
A 3D tetrahedral mesh (as shown in Figure 1(c)) was created for a cube concrete sample with a side length of 150mm as described by Obayes et al. (2020), Obayes et al. (2022) and Østergaard (2003) for the wedge splitting test. Figure 3 shows details of the geometry of the specimen. The loading rate for the experiment was 0.12 mm/minute. In the numerical simulations a displacement increment of
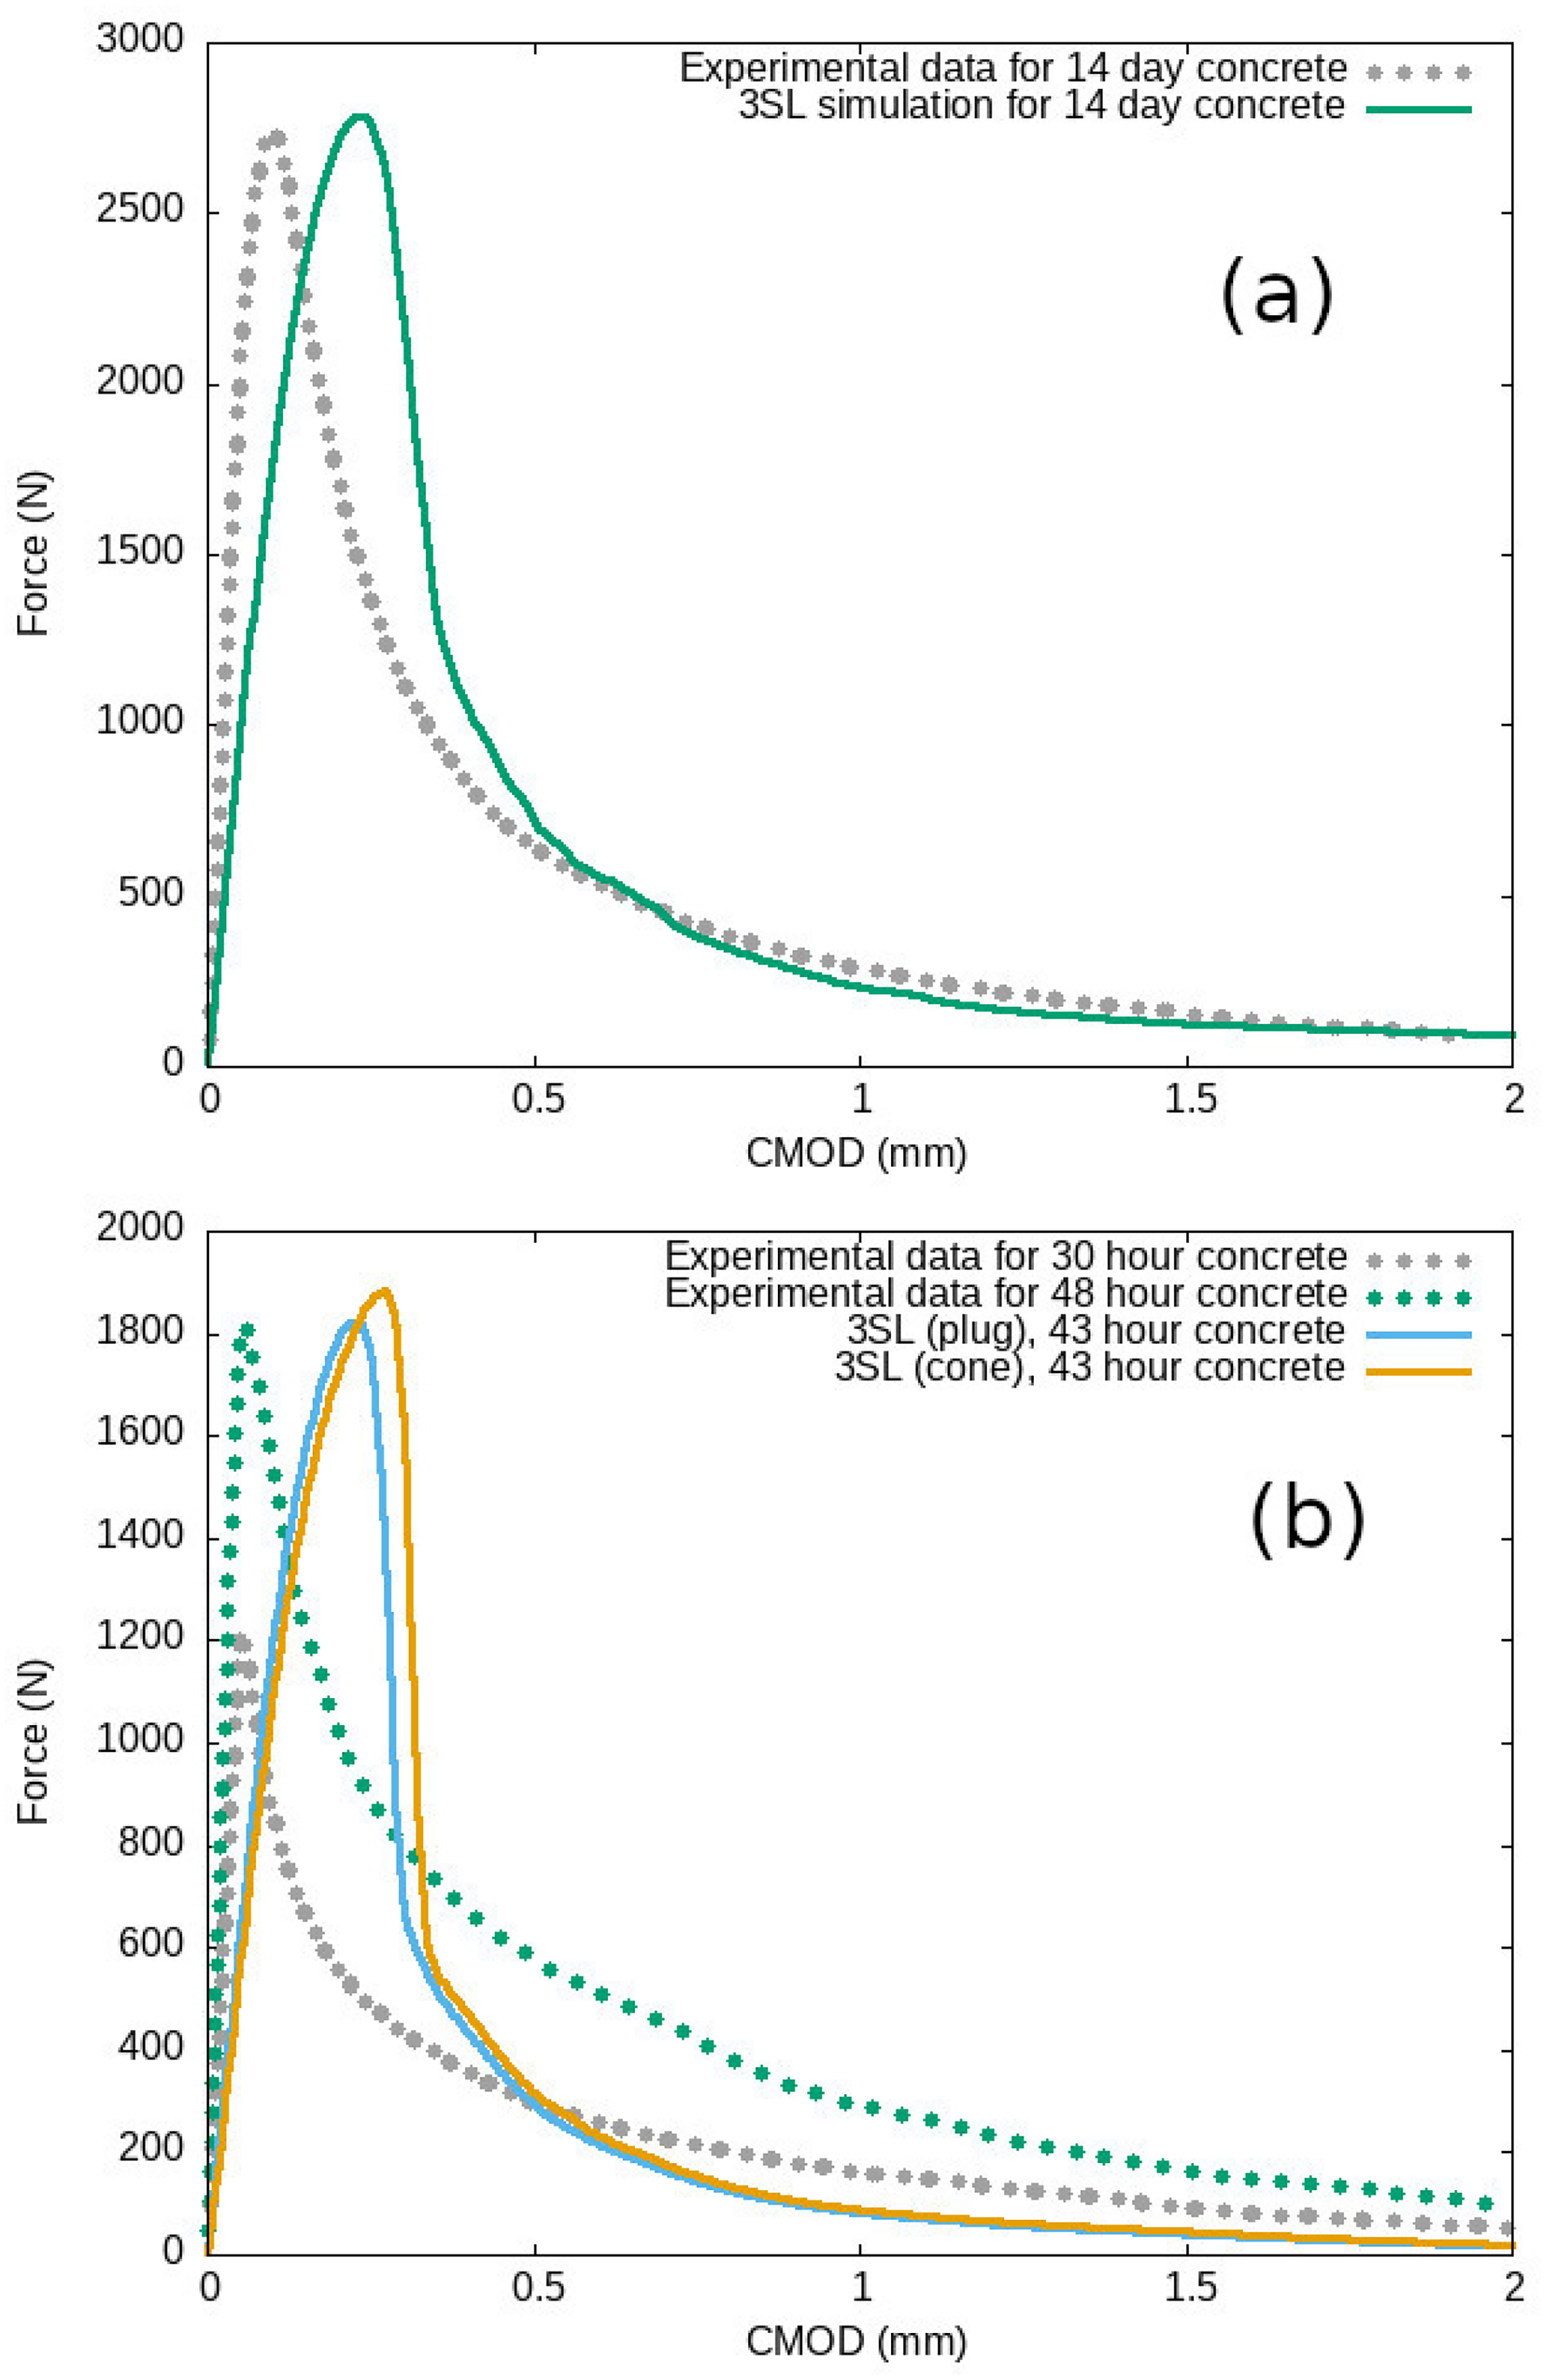
Stress–CMOD (crack mouth opening displacement) curve for the wedge splitting test for 14 days and 43 hours old concrete in (a) and (b), respectively.
Figure 10 shows the damage plots for the concrete samples after they have cracked completely in the wedge splitting test. Figure 10(a) and (b) show the surface damage plots for the 43 hours old concrete for the 3SL plug and cone failure laws respectively. They show more localised cracking occurs down the middle of the sample, however there is also diffuse damage evident elsewhere in the sample. Figure 10(c) and (d) shows the surface and internal damage plots respectively for the 14 days old concrete where the crack is more localised down the middle of the concrete as seen in wedge splitting tests experimentally (see Figure 3(b)) for mature age concrete.
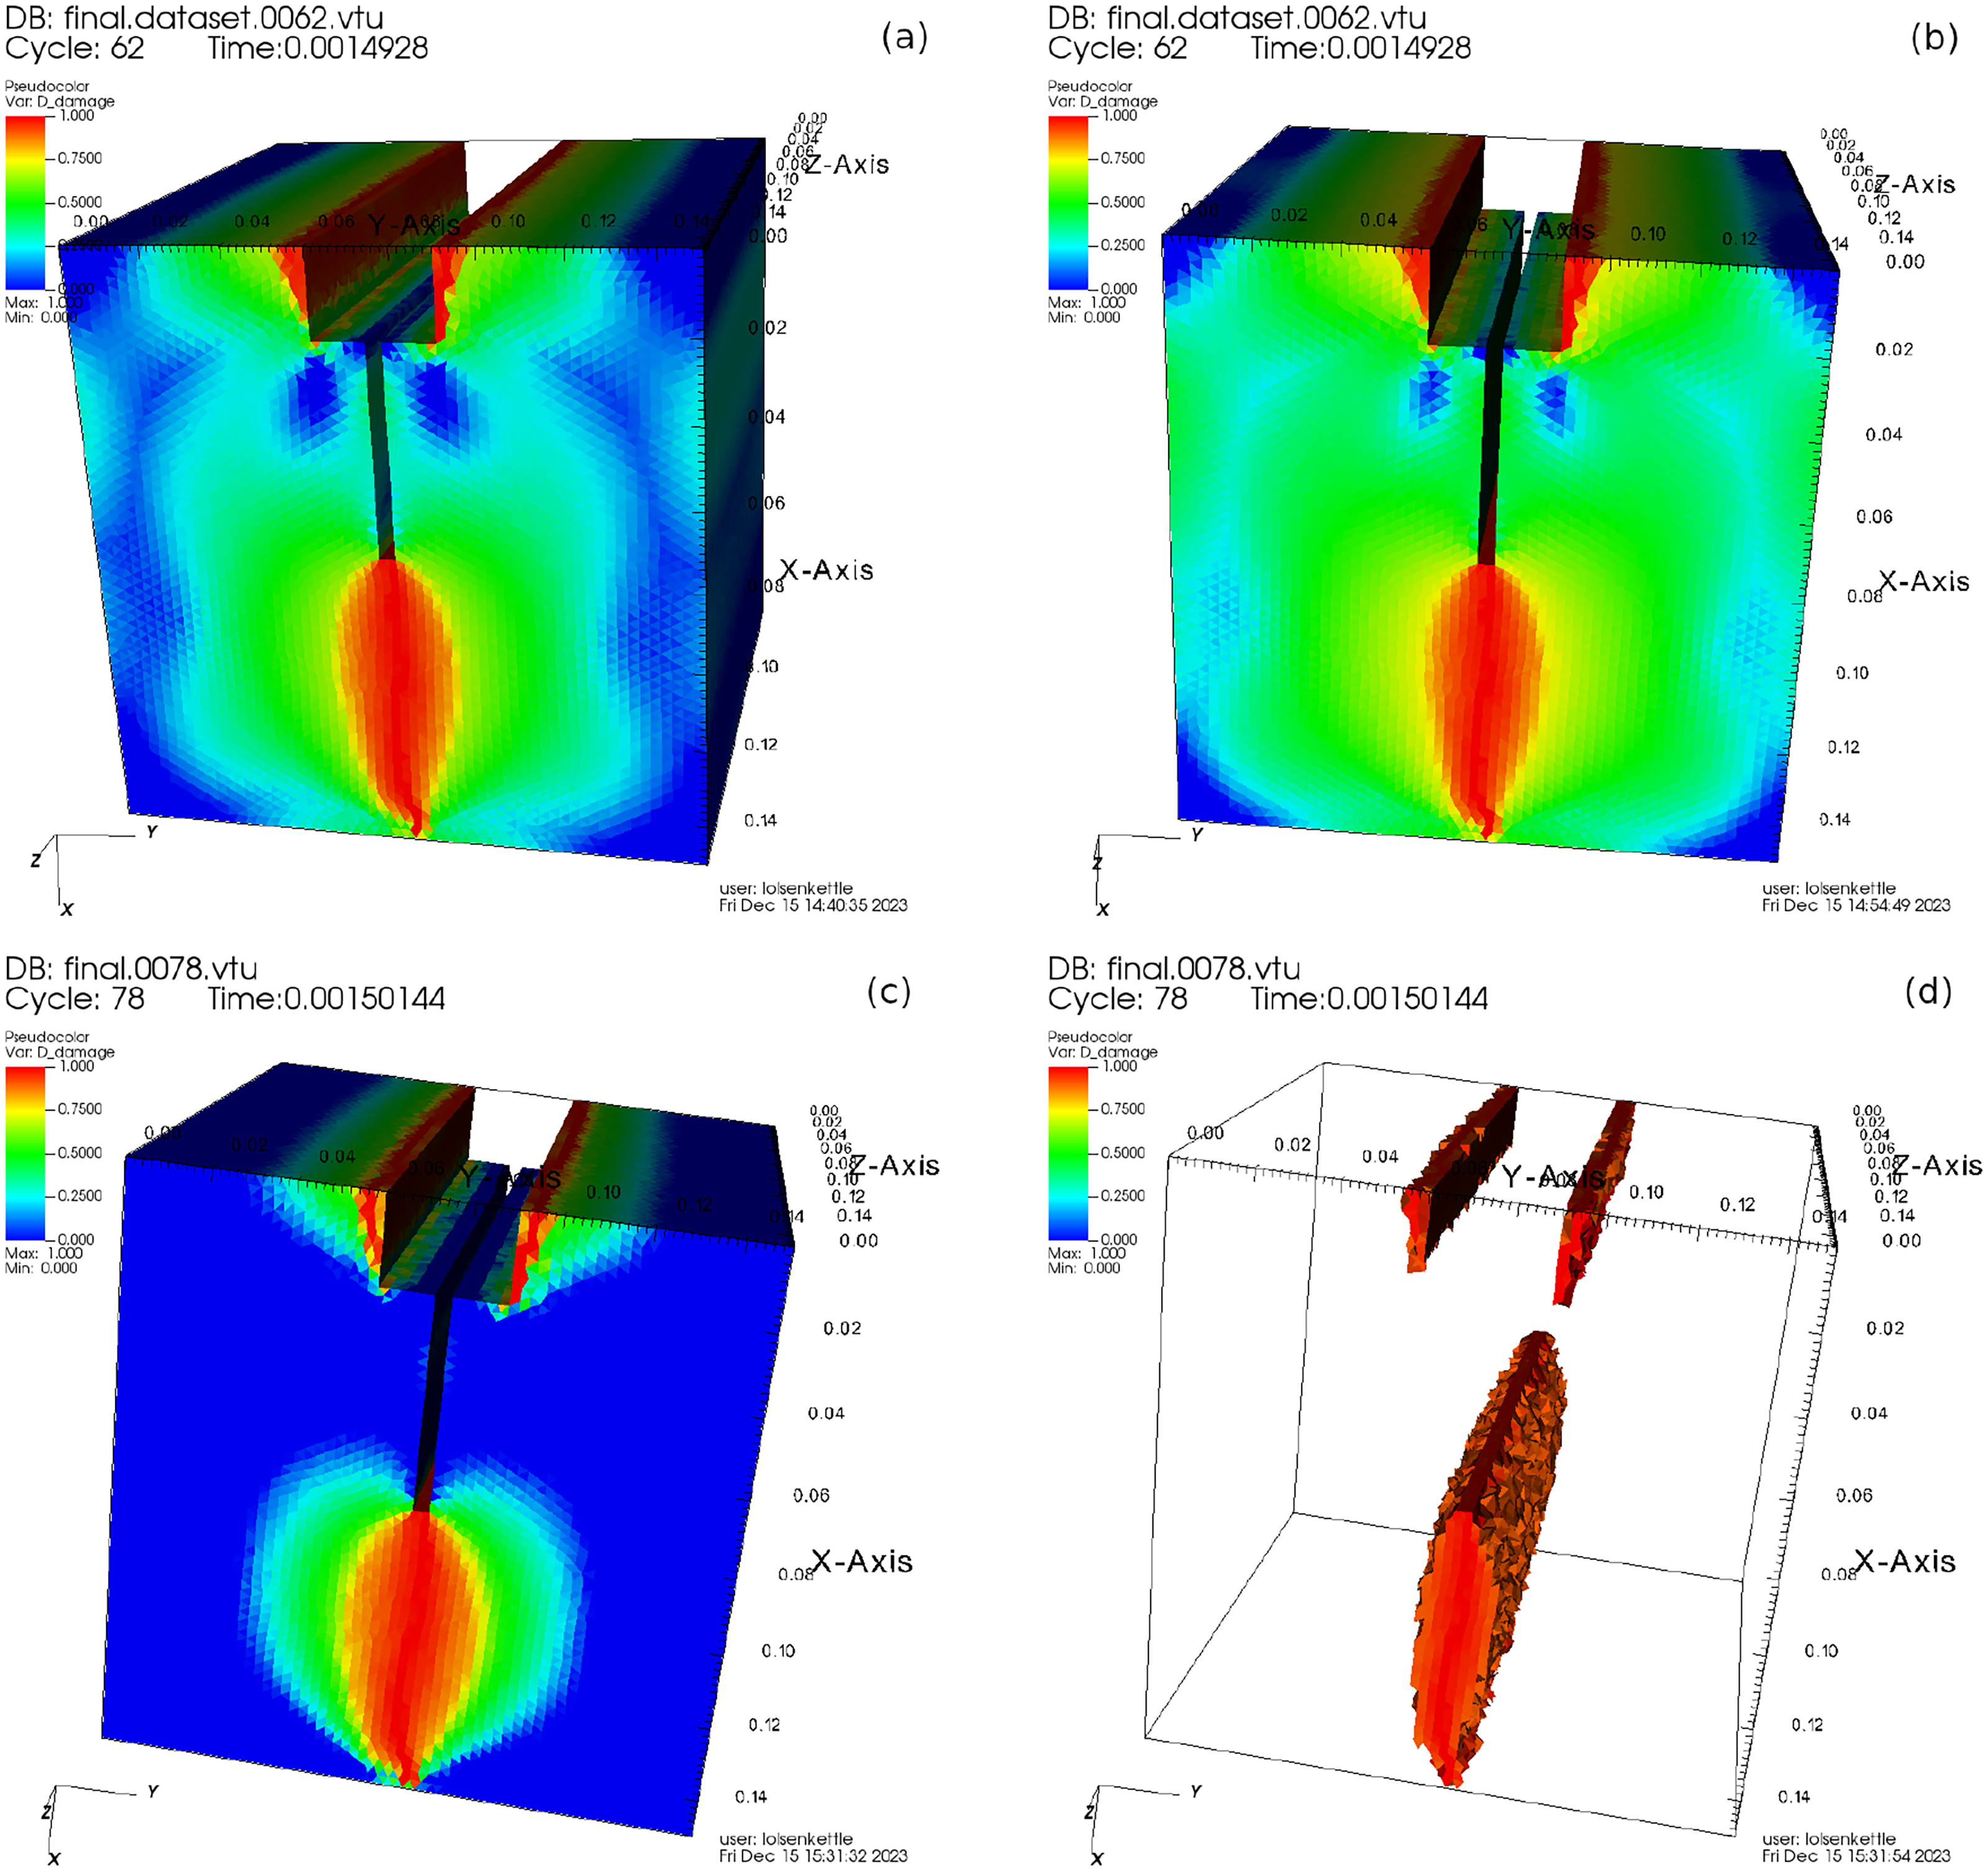
Damage post failure for the wedge splitting test for the 43 hours old concrete in (a) and (b) for the 3SL plug and cone laws, respectively. Damage and internal damage post failure for the wedge splitting test for the 14 days old concrete in (c) and (d), respectively.
Application of new damage law to anchor pull-out failure in concrete
A 3D tetrahedral mesh (as shown in Figure 1(d)) was created for a cast-in anchor in a concrete sample as described by Obayes et al. (2020) and Obayes et al. (2022) for the anchor pull-out test. Figure 4 shows details of the geometry of the specimen. The loading rate for the experiment was approximately 1 to 3 mm/minute. In the numerical simulations a displacement increment of
Figure 11 shows the anchor pull-out test force–displacement curve for both concrete ages. While the anchor force was able to be reasonably predicted by the 3SL model, for all damage evolution laws considered here the anchor displacement was consistently under-predicted. Part of this discrepancy can be explained by the fact that the steel anchor is not modelled and the boundary conditions and force calculated are directly applied to the sloped surface of the headed anchor. Due to the fact that the anchor stretching is not modelled, it is expected that the numerical model will under-predict the peak displacement. In addition, another reason for the discrepancy in peak displacement prediction may be due also to the high coefficient of variation for the peak displacement in the anchor pull-out tests (reported to be as high as 27.7% in Table 3). Other experimental studies have also shown high variability in the anchor peak force and corresponding displacement, see for example, Figure 6 in Nassiri et al. (2020). In general the most important property for anchor design to predict accurately is the peak load, and the 3SL model performs well in simulating the peak load. This was the best set of parameters found to model the anchor pull-out failure, uniaxial compression, Brazilian splitting and wedge splitting test results after performing many hundreds of simulations of all four tests for both concrete ages. Other numerical models of anchor pull-out failure for cast-in headed anchors have also predicted an under-estimation of the peak displacement (Obayes et al., 2020). Often studies only report the numerical simulation results of the anchor tension test in isolation, where the model parameters can be adjusted to match the experimental results of a single test, for example the numerical simulations of Nassiri et al. (2020), Obayes et al. (2020), Obayes et al. (2022) and Ožbolt et al. (2007). However this research aims to find a single set of damage evolution parameters that can match the experimental results of all four tests simultaneously for each concrete age (43 hours and 14 days).
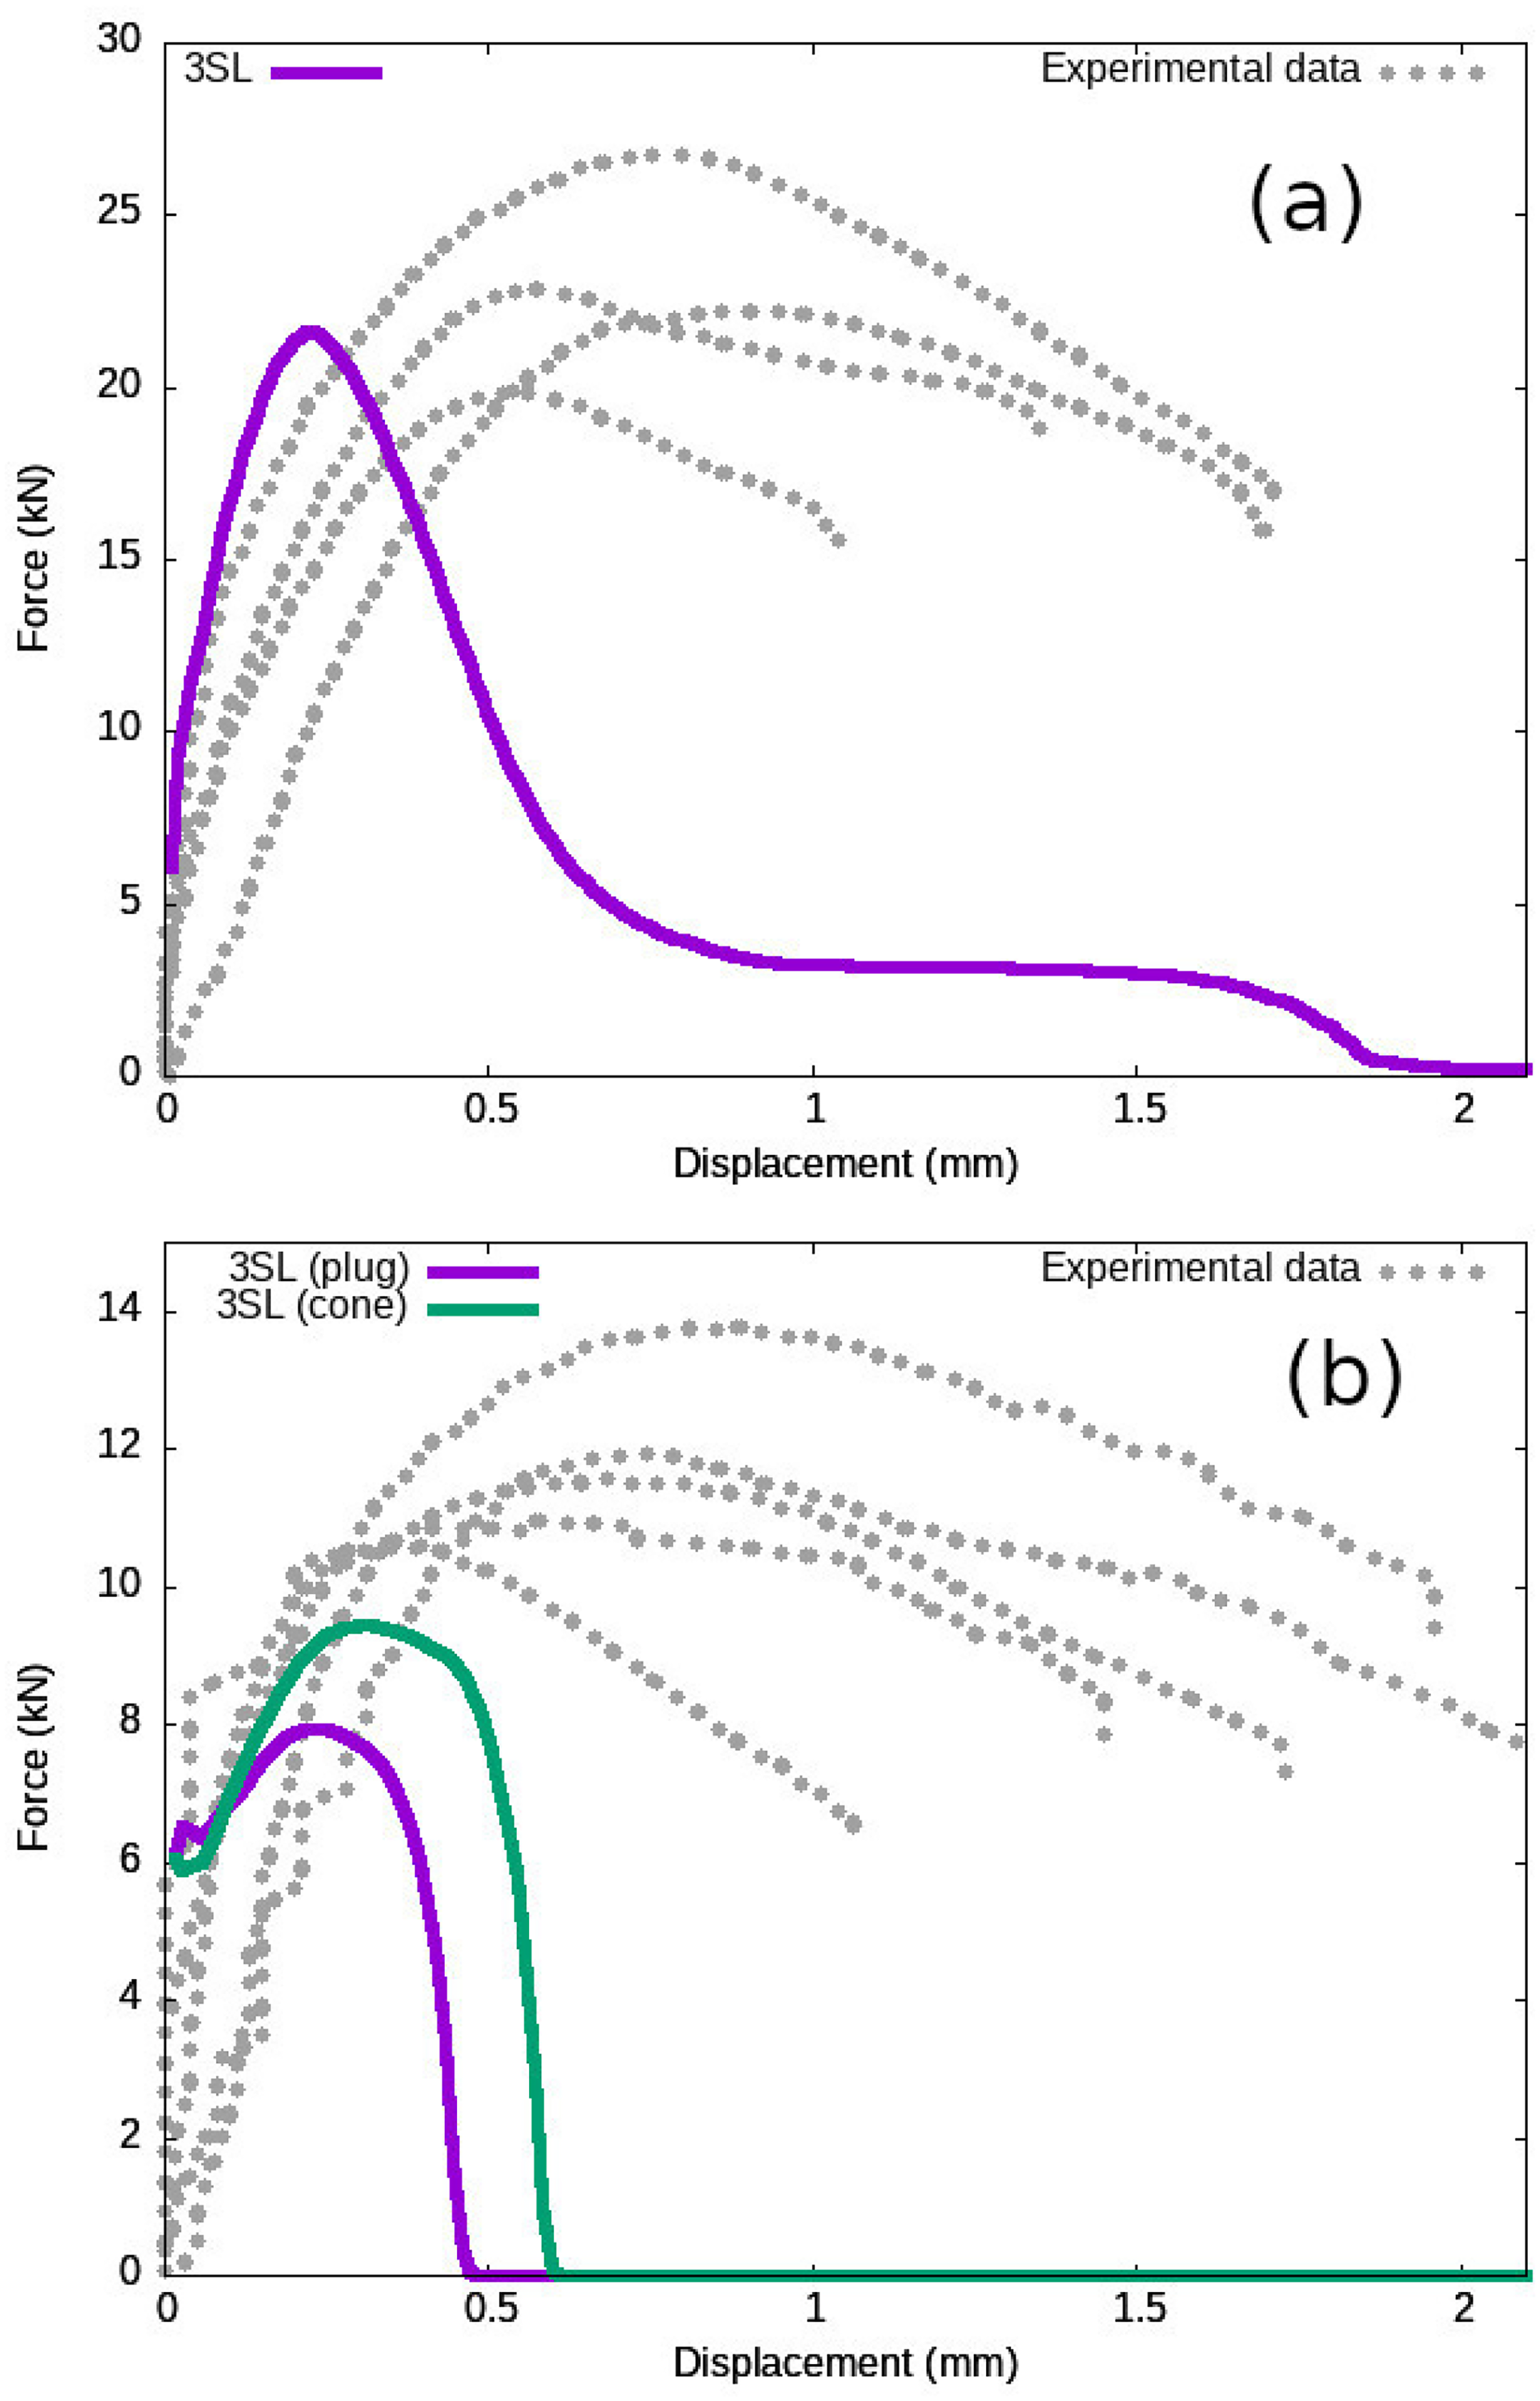
Force–displacement curve for the anchor pull-out test for 14 days and 43 hours old concrete in (a) and (b). In both plots the experimental data from Obayes et al. (2020) (Figure 12(a) Mix A 43-hour-old concrete and (d) Mix D 14-day-old concrete) is shown for comparison.
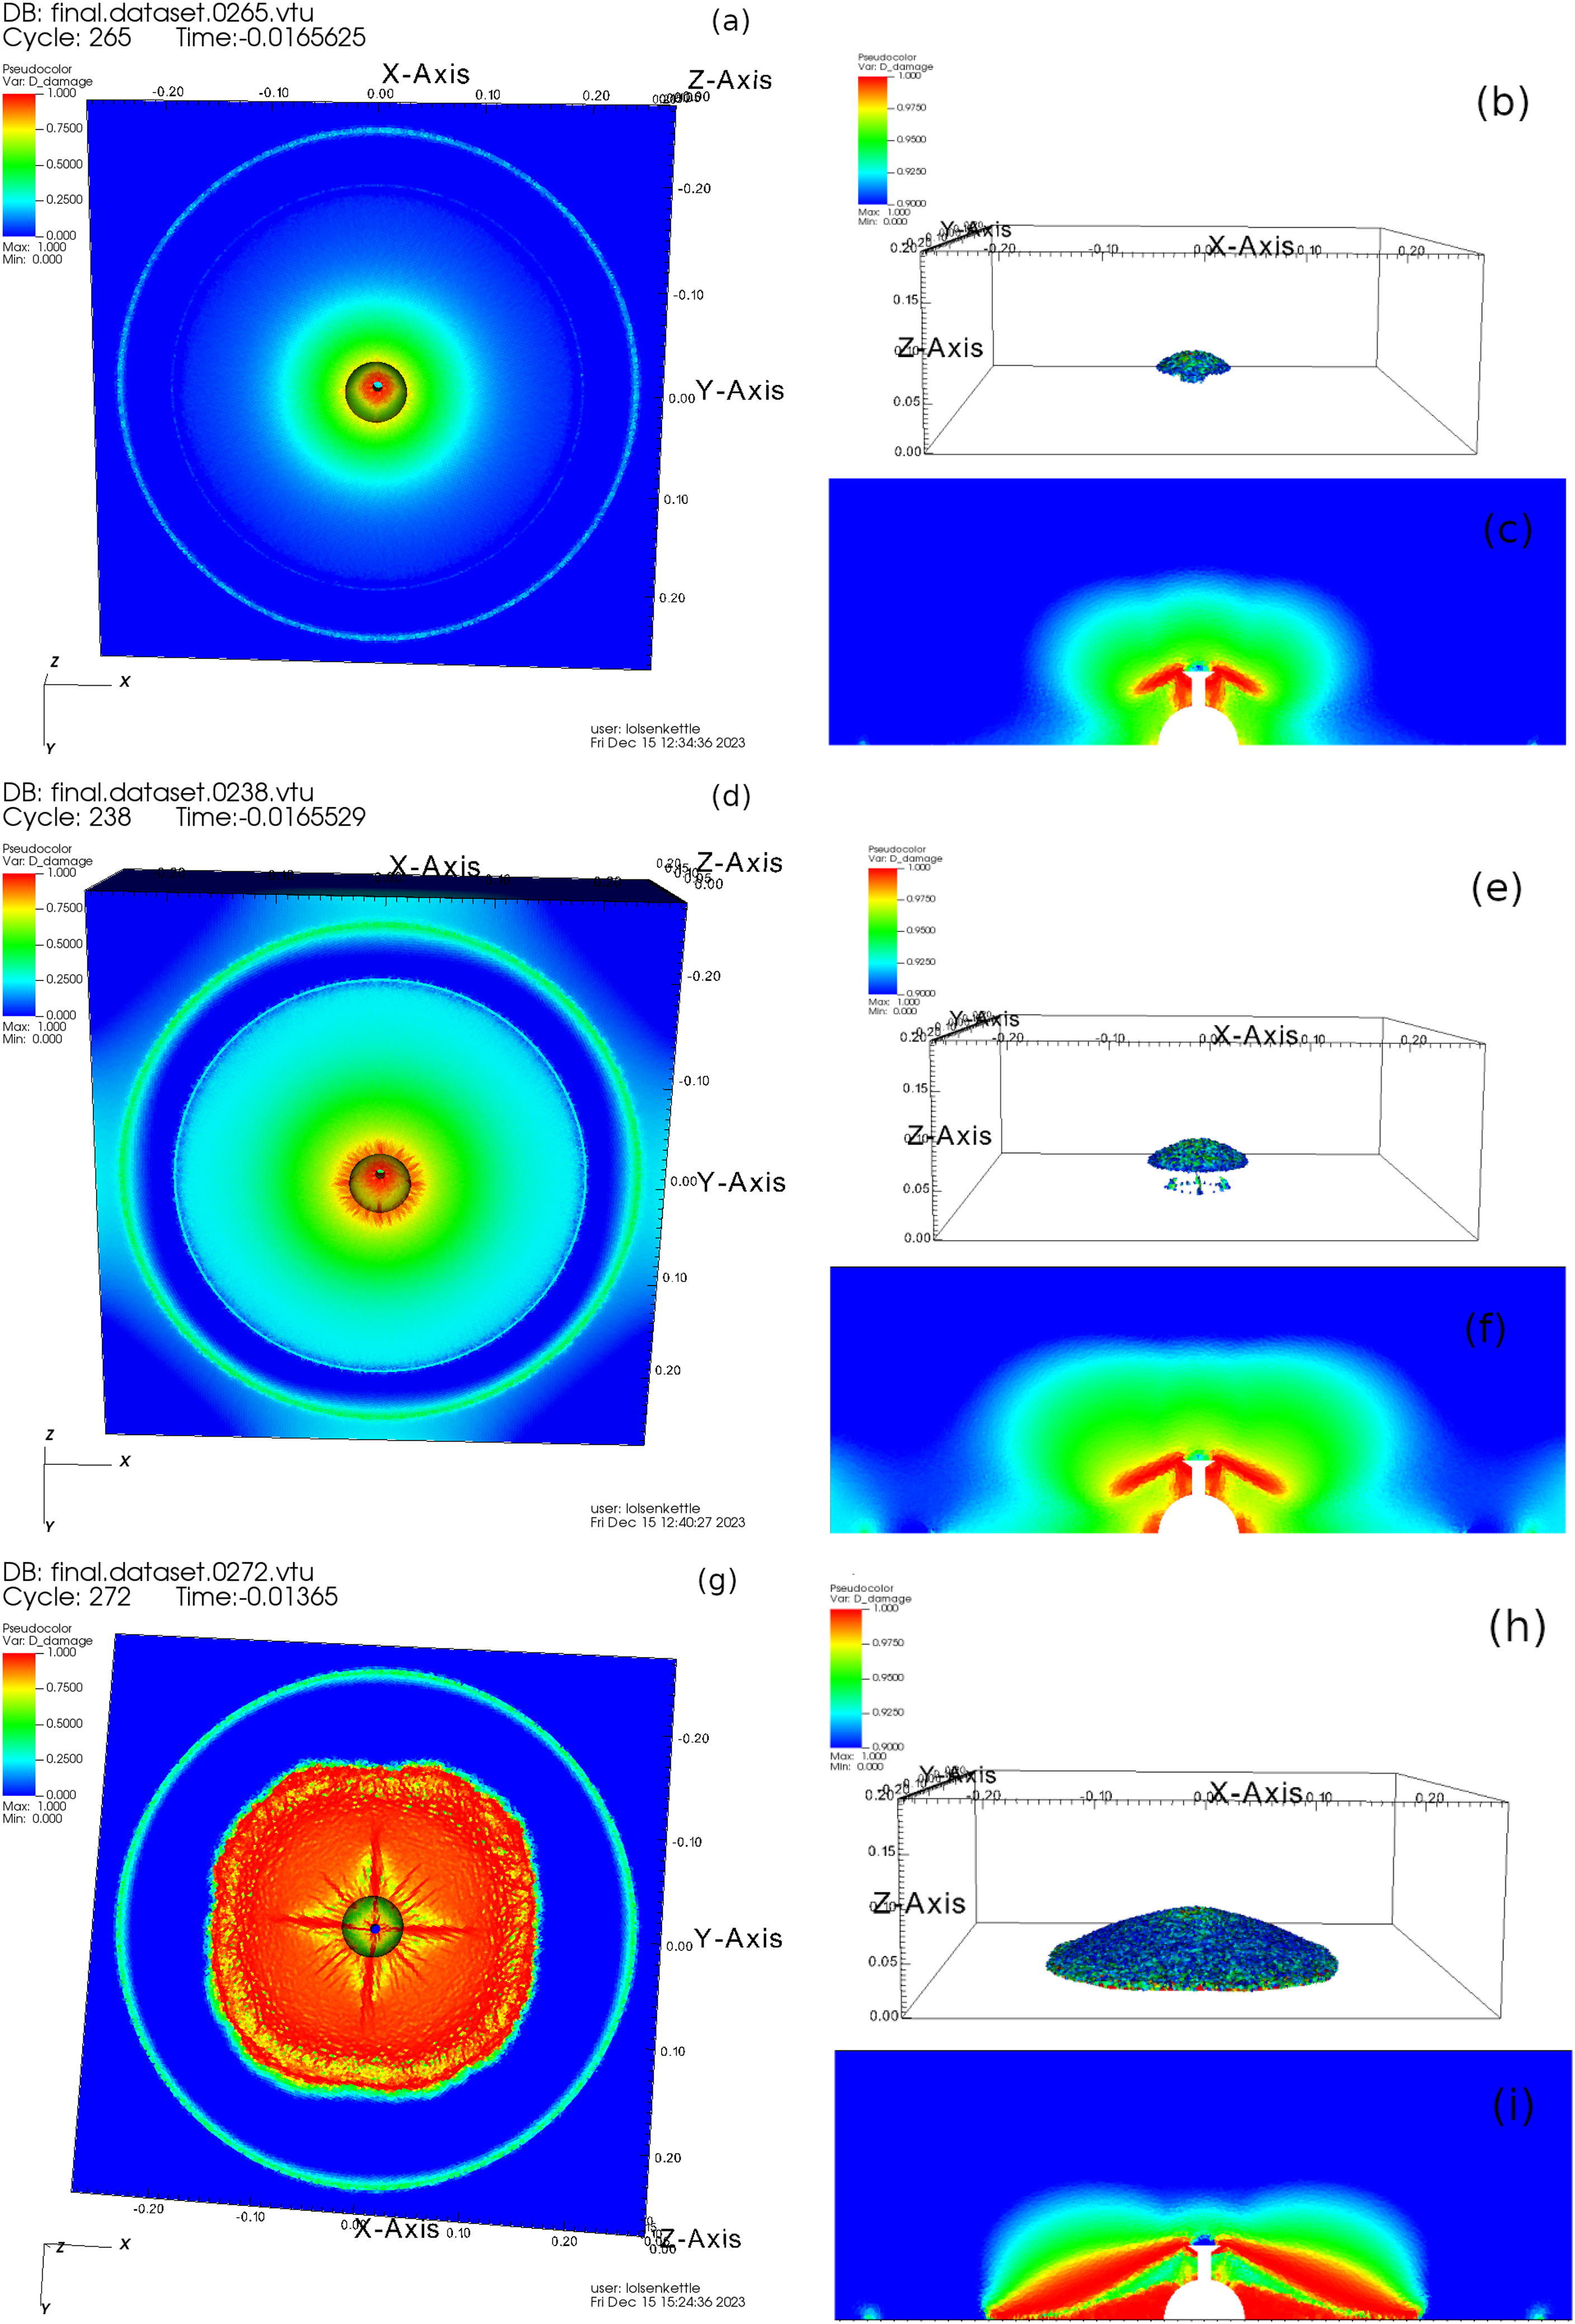
Damage, internal damage and slice of damage (through
Figure 12 shows the damage and internal damage failure modes predicted by the combined damage 3SL for both the 43 hours and 14 days old concrete. The 43 hours old concrete can give either predominantly pull-out failure for the 3SL plug damage evolution law, or a combined failure modes with a pull-out failure combined with a secondary breakout small cone breakout failure for the 3SL cone damage evolution law. Combined failure mode have also been reported by other authors for non-concrete cone anchor failure modes by Chen (2023).
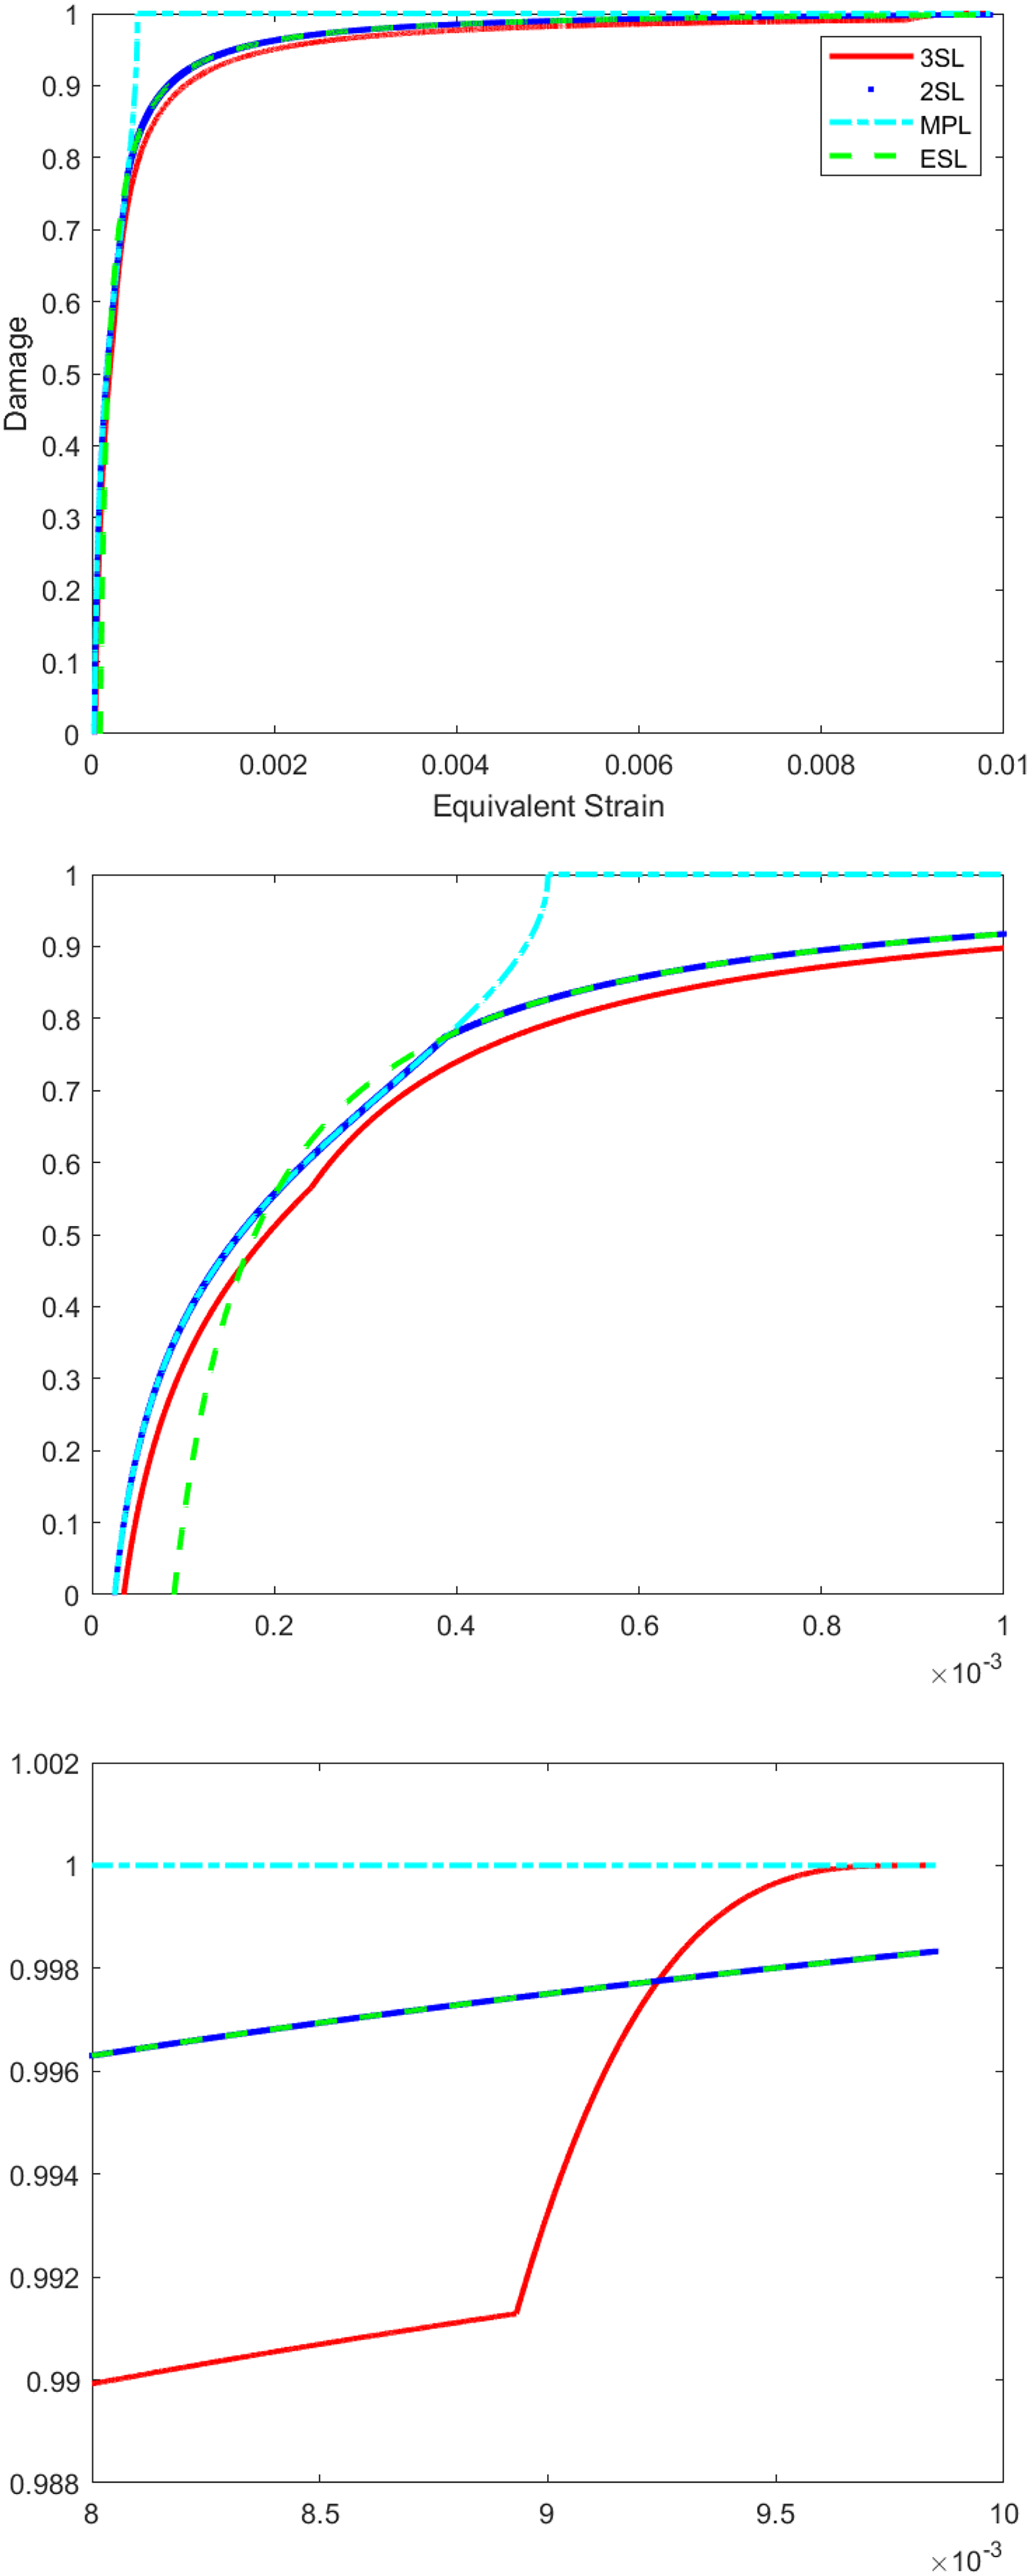
Comparison of different damage evolution laws for the 14 days old concrete at different stages of strain evolution. 3SL is the three-step combined damage law detailed in the previous sections, 2SL denotes the two-step combined damage law, MPL denotes modified power law, and ESL denotes exponential softening law.
The next Section “Comparison with single damage evolution laws” demonstrates how the combined damage laws employed here is advantageous over just using existing single damage evolution laws. In general over all four tests the 43-hour-old concrete displays more ductile behaviour and gives rise to non-concrete cone failure modes in anchor tests, this relationship between ductility and non-concrete failure modes has also been reported by Chen (2023).
Comparison with single damage evolution laws
Parameterisation of the individual damage laws
To be consistent with the previous section the same scale and shape parameters are employed for the Weibull distribution for the Young’s modulus,
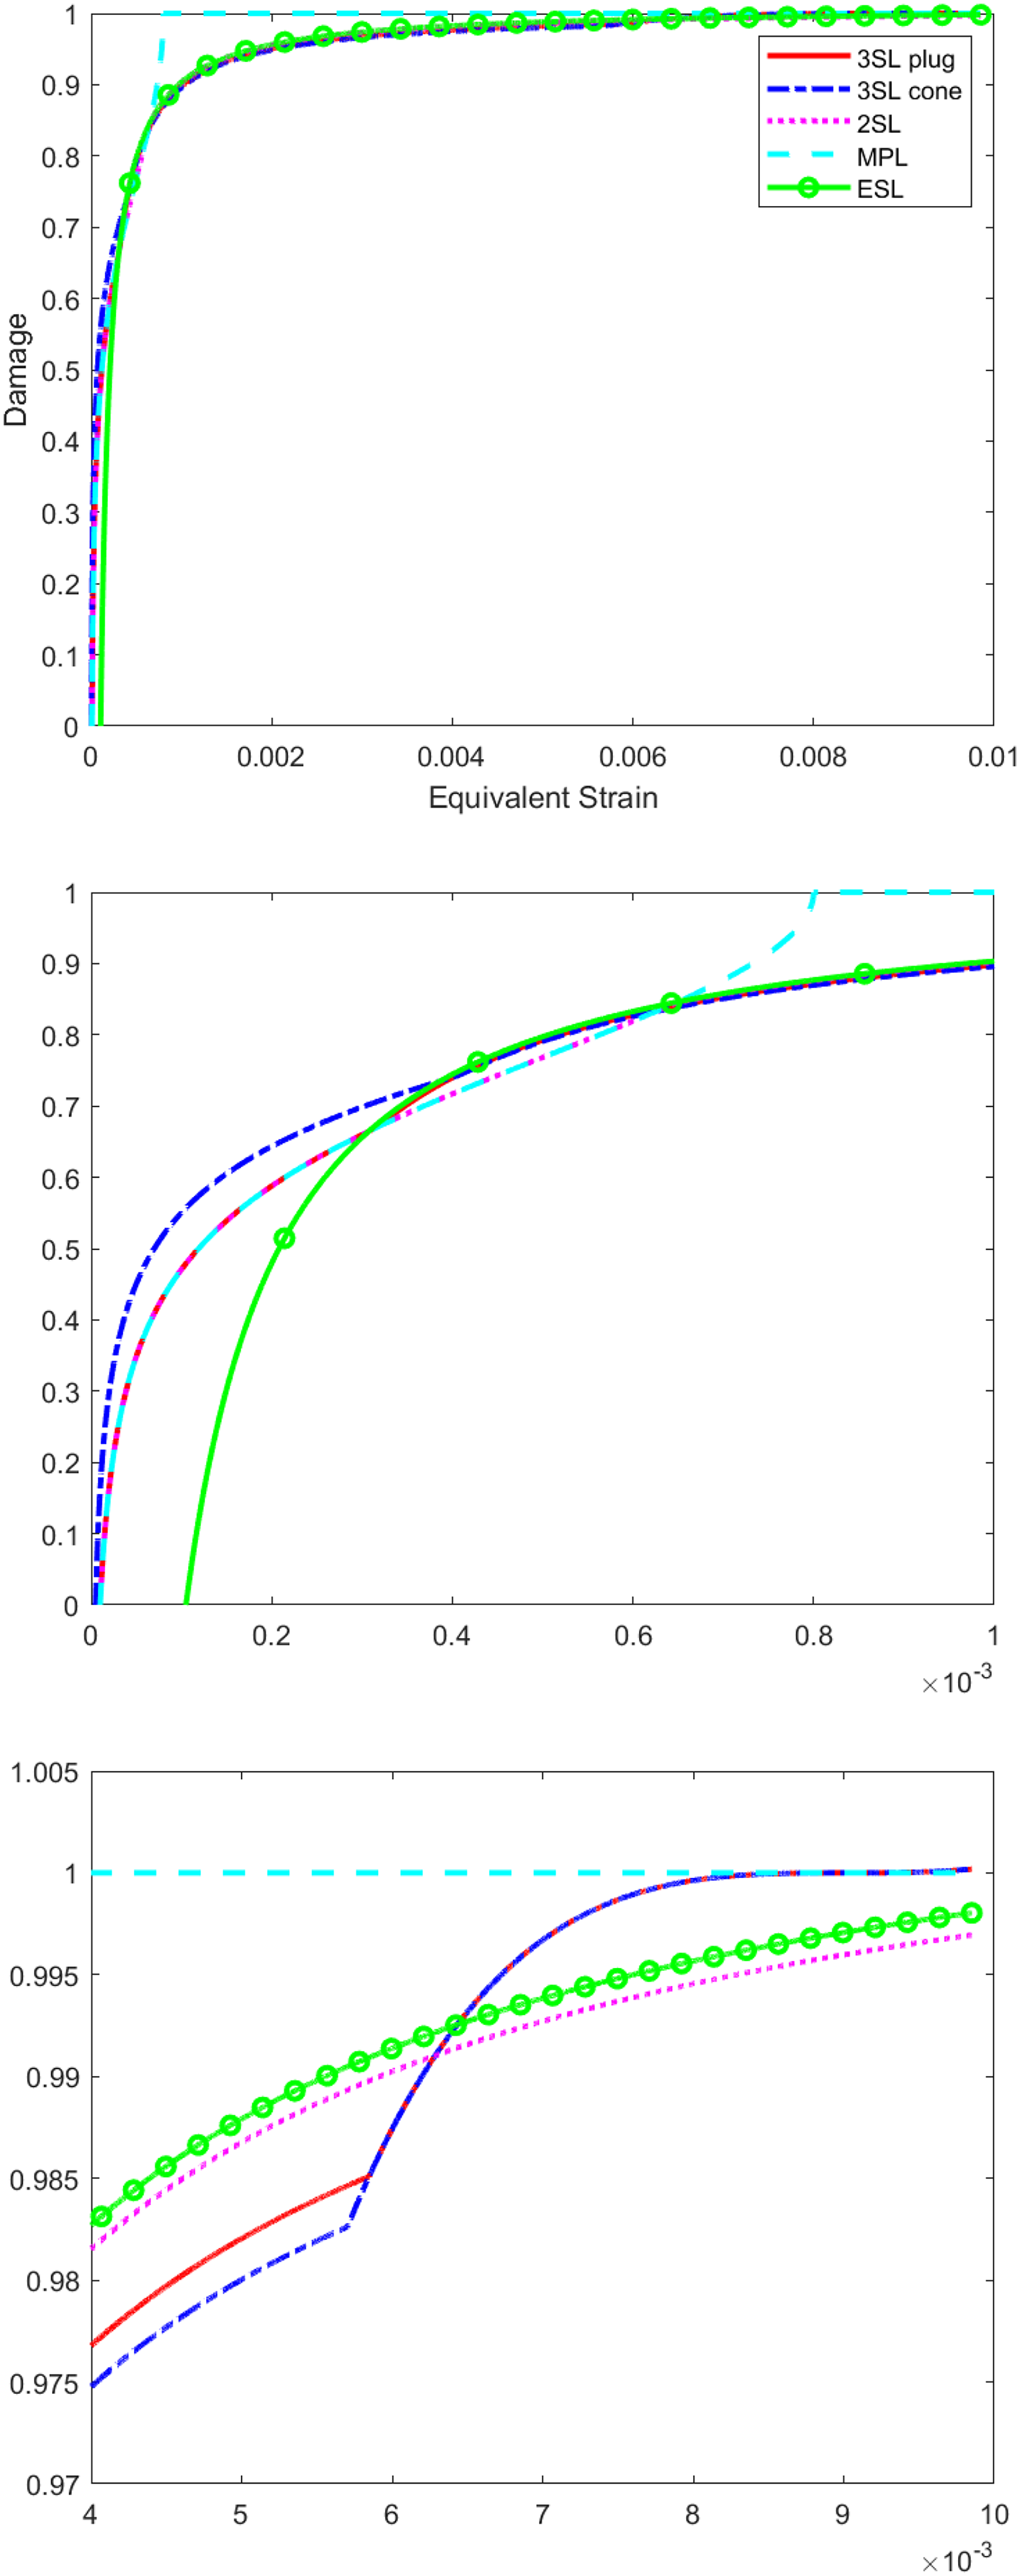
Comparison of different damage evolution laws for the 43 hours old concrete at different stages of strain evolution.
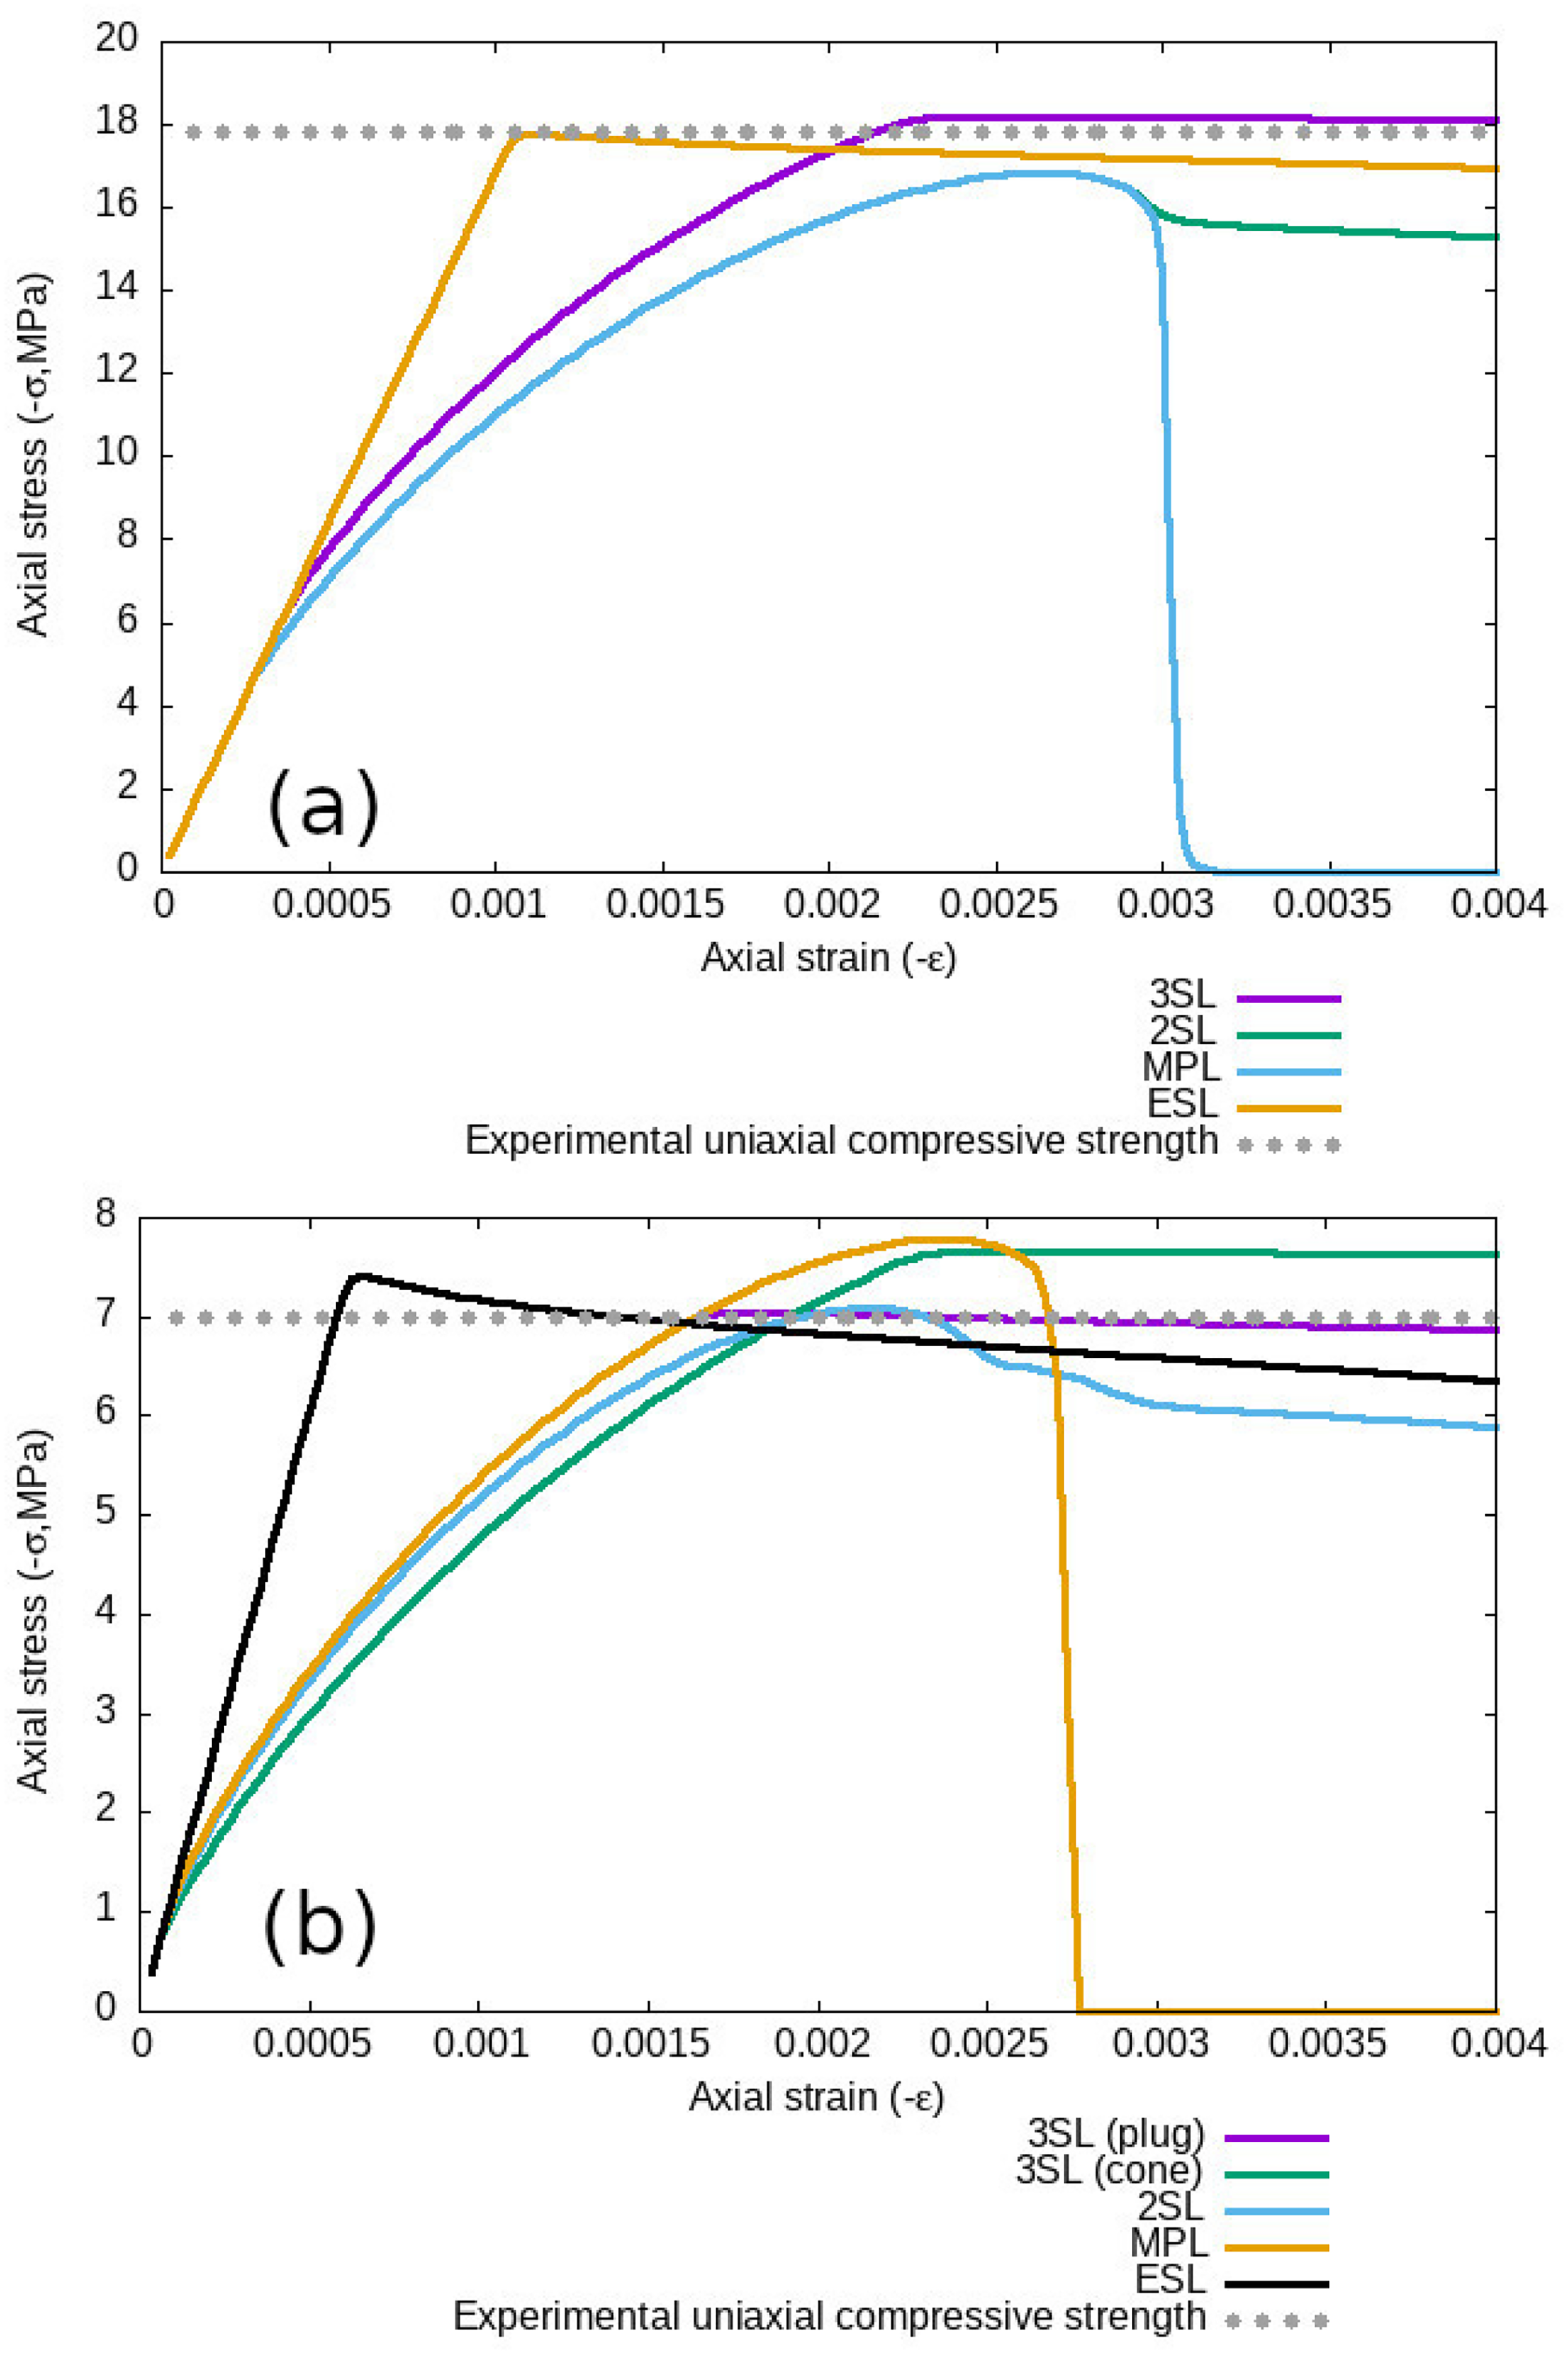
Comparison of stress–strain curves for uniaxial compression test for different damage evolution laws for the 14 days and 43 hours old concrete in (a) and (b), respectively.
Table 4 compares the results for the numerical simulations using the parameters detailed in Tables 3 and 5 for each law and both concrete ages with the experimental results for the corresponding age concrete. Table 4 clearly shows that the 3SL performs best in matching the experimental results for the four tests for both the 43 hours (3SL plug) and 14 days old concrete (3SL). The average percentage error (absolute values) of the simulations from the experimental results for the Young’s modulus, uniaxial compressive strength, Brazilian tensile splitting strength, fracture energy, the anchor and wedge splitting peak forces and Young’s modulus was 13.6%, 21.2%, 21.2%, and 35.3% for the 3SL, 2SL, ESL and MPL laws respectively for the 14 days old concrete; and average percentage error (absolute values) of the simulations was 7.7%, 11.6%, 12.4%, 8.4% and 24.4% for the 3SL (plug), 3SL (cone), 2SL, ESL and MPL laws respectively for the 43 hours old concrete. Clearly the MPL law does not fit the experimental data well, however the 3SL law is clearly the best for matching the 14 days old concrete, and both 3SL (plug) and ESL damage laws are close to the experimental data for 43 hours old concrete. In the next subsections the stress–strain and force–displacement curves are examined more closely to show how the different laws produce different mechanical responses during the loading cycle.
Comparison of uniaxial compression test results for combined damage law with single damage evolution laws
Figure 15 shows the stress–strain curve for the uniaxial compression test for the different laws. It is clear that the exponential softening law (ESL) shows very different behaviour to that expected from concrete for both concrete ages in the softening stage. While all the laws can predict the expected uniaxial compressive strength relatively accurately it is clear that the ESL model does not predict the pre-peak softening behaviour of concrete well. The MPL model shows more brittle post-peak softening behaviour. However the 3SL laws show a broadening of the stress–strain curve after the peak compressive strength has been reached. This broadening of the stress strain curve has also been reported for low-strength concretes by Neville (2012) (Figure 10.4). Figure 16 displays the percentage error difference of the uniaxial compressive strength for the different laws when compared to the experimental results. The damage plots are also shown to compare the different damage evolution and fracture paths of the different laws. The MPL and 2SL simulations display more brittle behaviour and the emergence of shear bands of the samples under uniaxial compression as expected for more brittle damage laws. The ESL simulations shows more localised deformation around the middle of the sample for both concrete ages, but the 43 hours old concrete shows the emergence of shear bands as well. The 3SL simulations show more ductile behaviour with the deformation also centred around the middle of the samples. This localisation of damage around the middle of the sample was due to the no slip boundary conditions applied at the top and bottom of all the samples. These trends in deformation patterns for shear banding in brittle to more distributed deformation in ductile materials has also been observed by Scott et al. (1993) (see Figures 6 and 7).
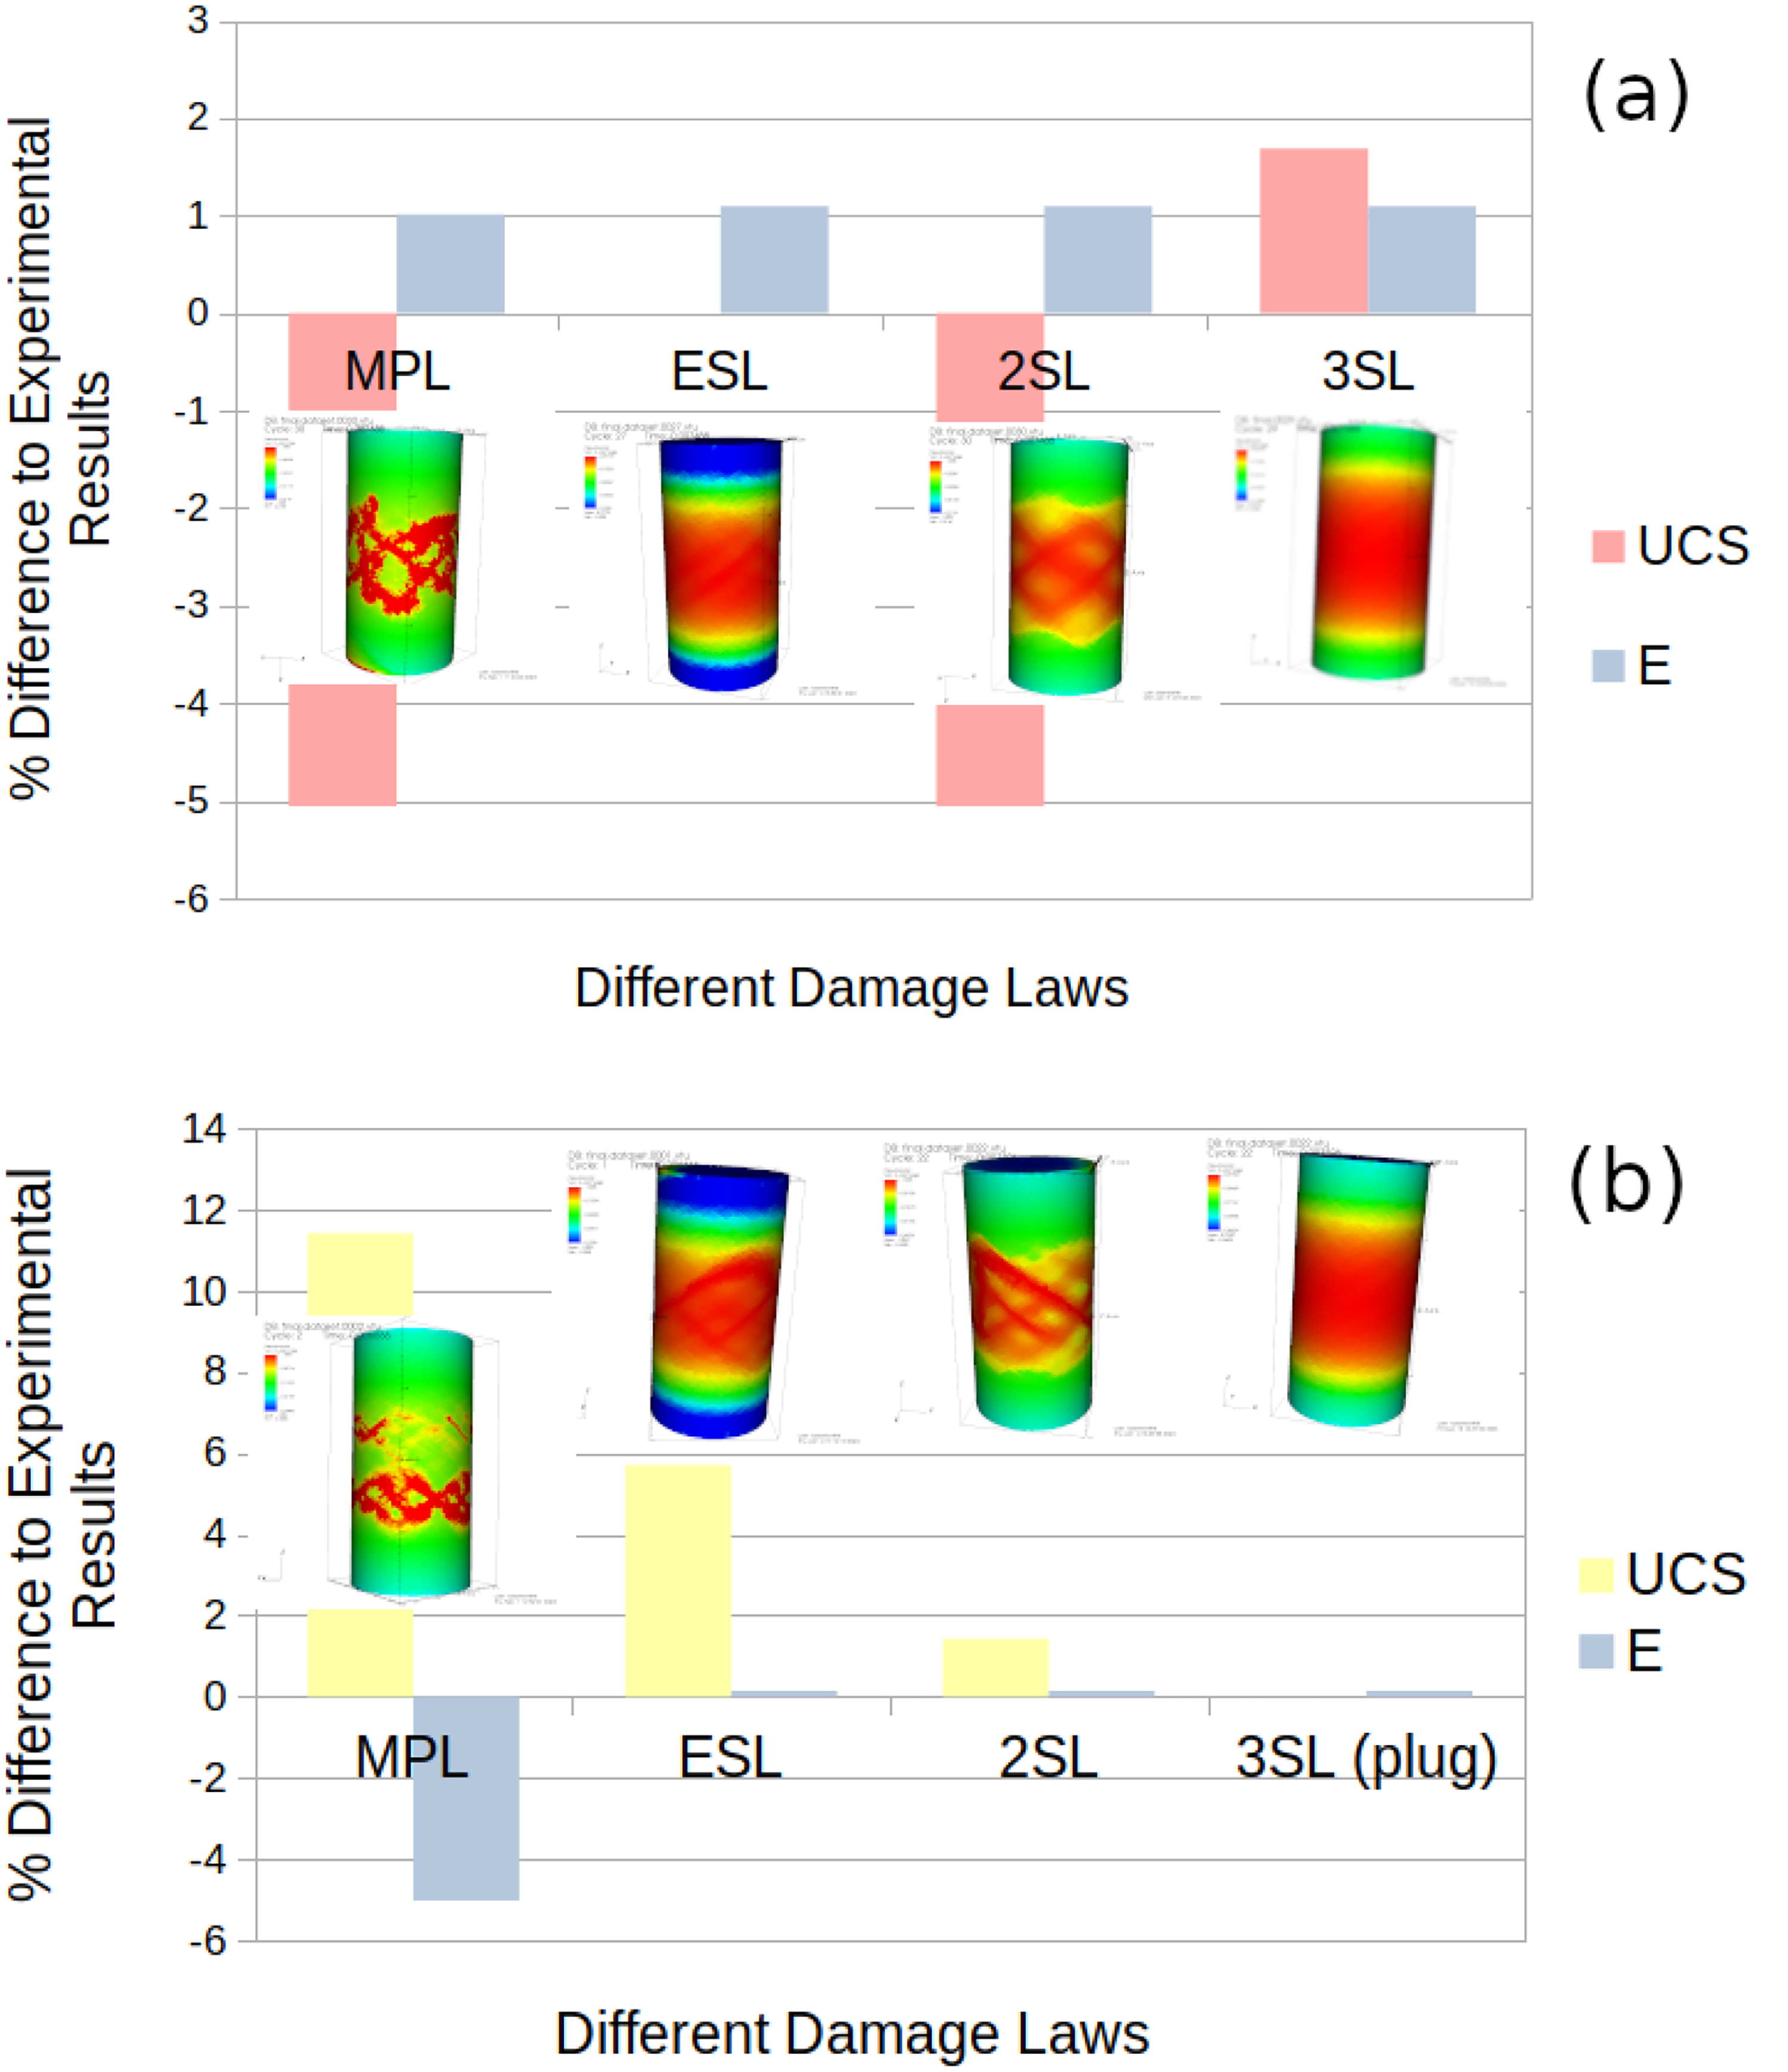
Comparison of percentage errors for the uniaxial compressive strength (UCS), Young’s modulus (
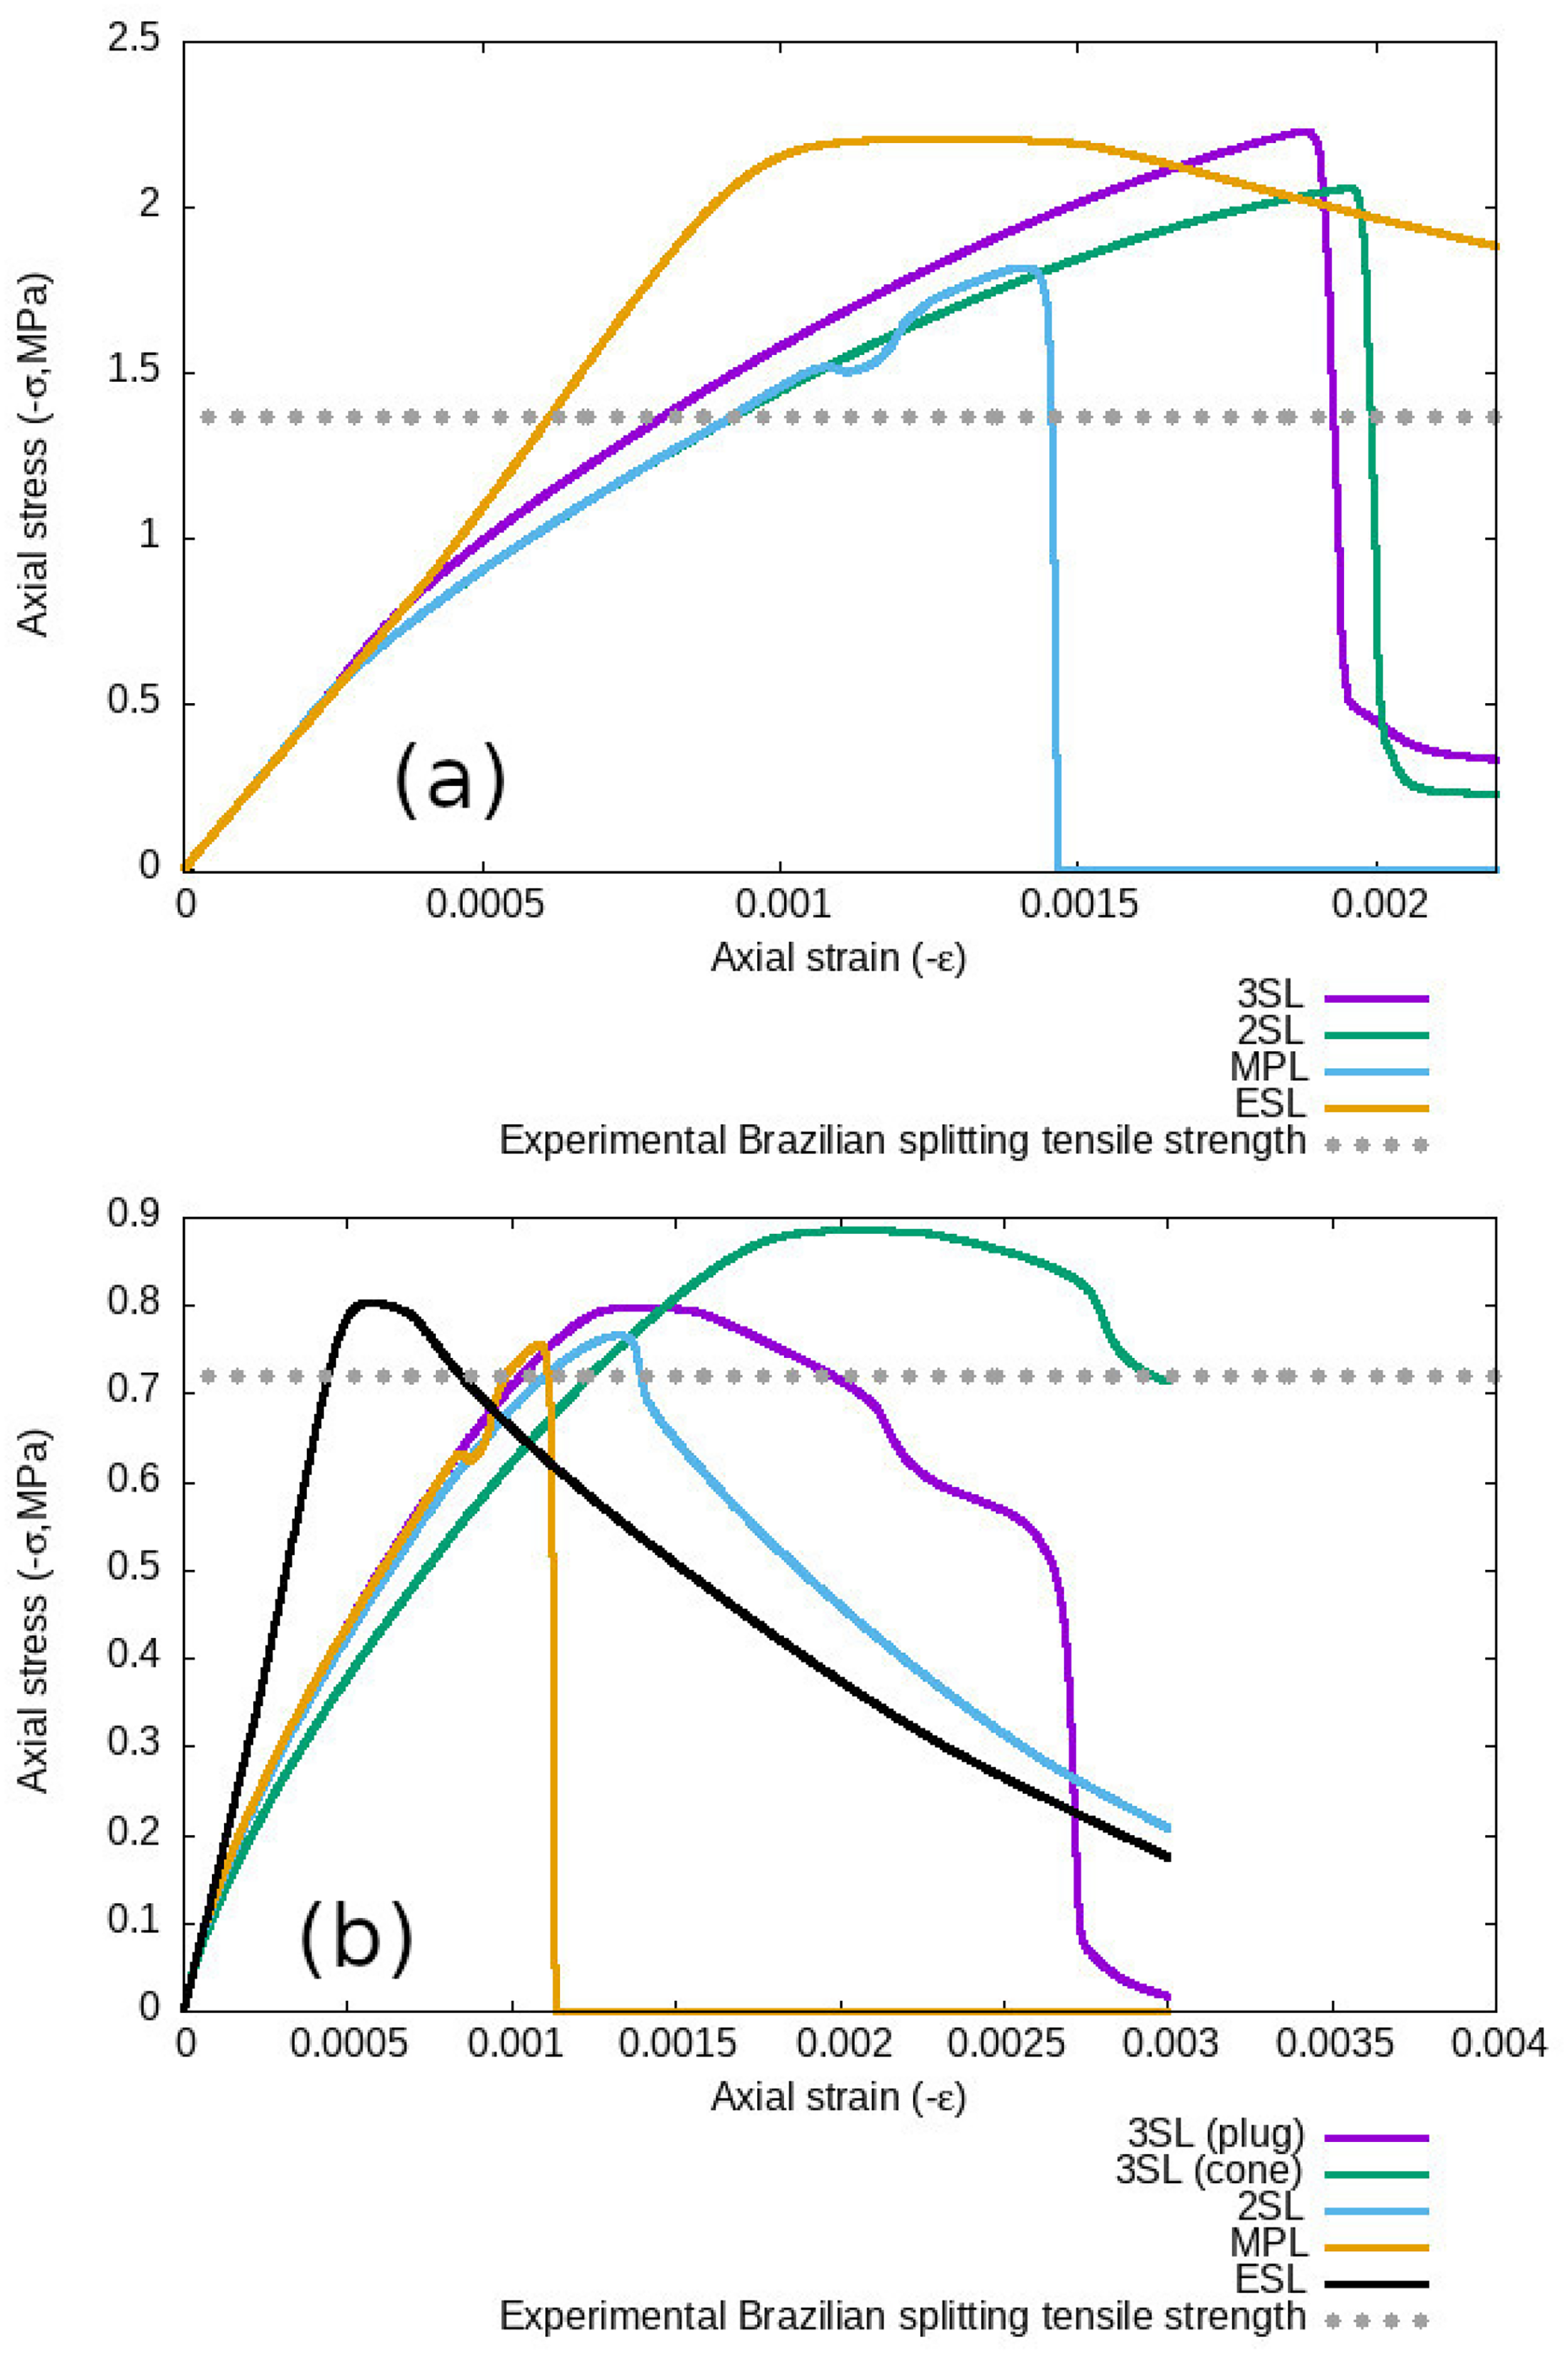
Comparison of stress–strain curves for Brazilian splitting test for different damage evolution laws for the 14 days and 43 hours old concrete in (a) and (b), respectively.
Comparison of Brazilian splitting test results for combined damage law with single damage evolutions laws
Figure 17 shows the stress–strain curve for the Brazilian splitting tensile test for the different laws. It is clear that the ESL model shows different behaviour than the other laws and has relatively little softening behaviour prior to the peak tensile strength. Unfortunately the experimental stress–strain time-series data for these tests was not available to compare with the numerical simulations. While all laws tend to over-estimate the tensile strength, it is clear that the over-estimation for the 14 days old concrete has a larger margin of error. For the 14-day old concrete all the laws show brittle post-peak behaviour under tension except the ESL simulations which display more ductile post-peak softening. For the 43-hour concrete only the MPL simulations display brittle post-peak behaviour, and the rest of the laws display more ductile post-peak softening. Figure 18 displays the percentage error difference of the Brazilian splitting tensile strength for the different laws when compared to the experimental results. It is important to note that in general the percentage error of a measurement will increase as the reference value gets closer to zero, and this is the case for the tensile strength which is much less than the uniaxial compressive strengths. Table 5 shows that the absolute difference in the simulated tensile strength to experimental tensile strength ranges from 0.53 to 0.83 MPa for the 14 days old concrete for all laws, and 0.03 to 0.17 MPa for the 43 hours old concrete for all laws. In comparison the absolute difference in the simulated uniaxial compressive strength ranges from 0 to 1.1 MPa for the 14 days old concrete and 0 to 0.8MPa for the 43 hours old concrete for all laws. The damage plots are also shown to compare the different damage evolution and fracture paths of the different laws. All the laws show similar fracture patterns as expected for the Brazilian splitting tensile test with a crack propagating down the middle of the specimen. However the MPL, 2SL and 3SL simulations show more diffuse damage occurring elsewhere in the specimen as well for both concrete ages, and more delocalised damage for the 43-hour concrete.
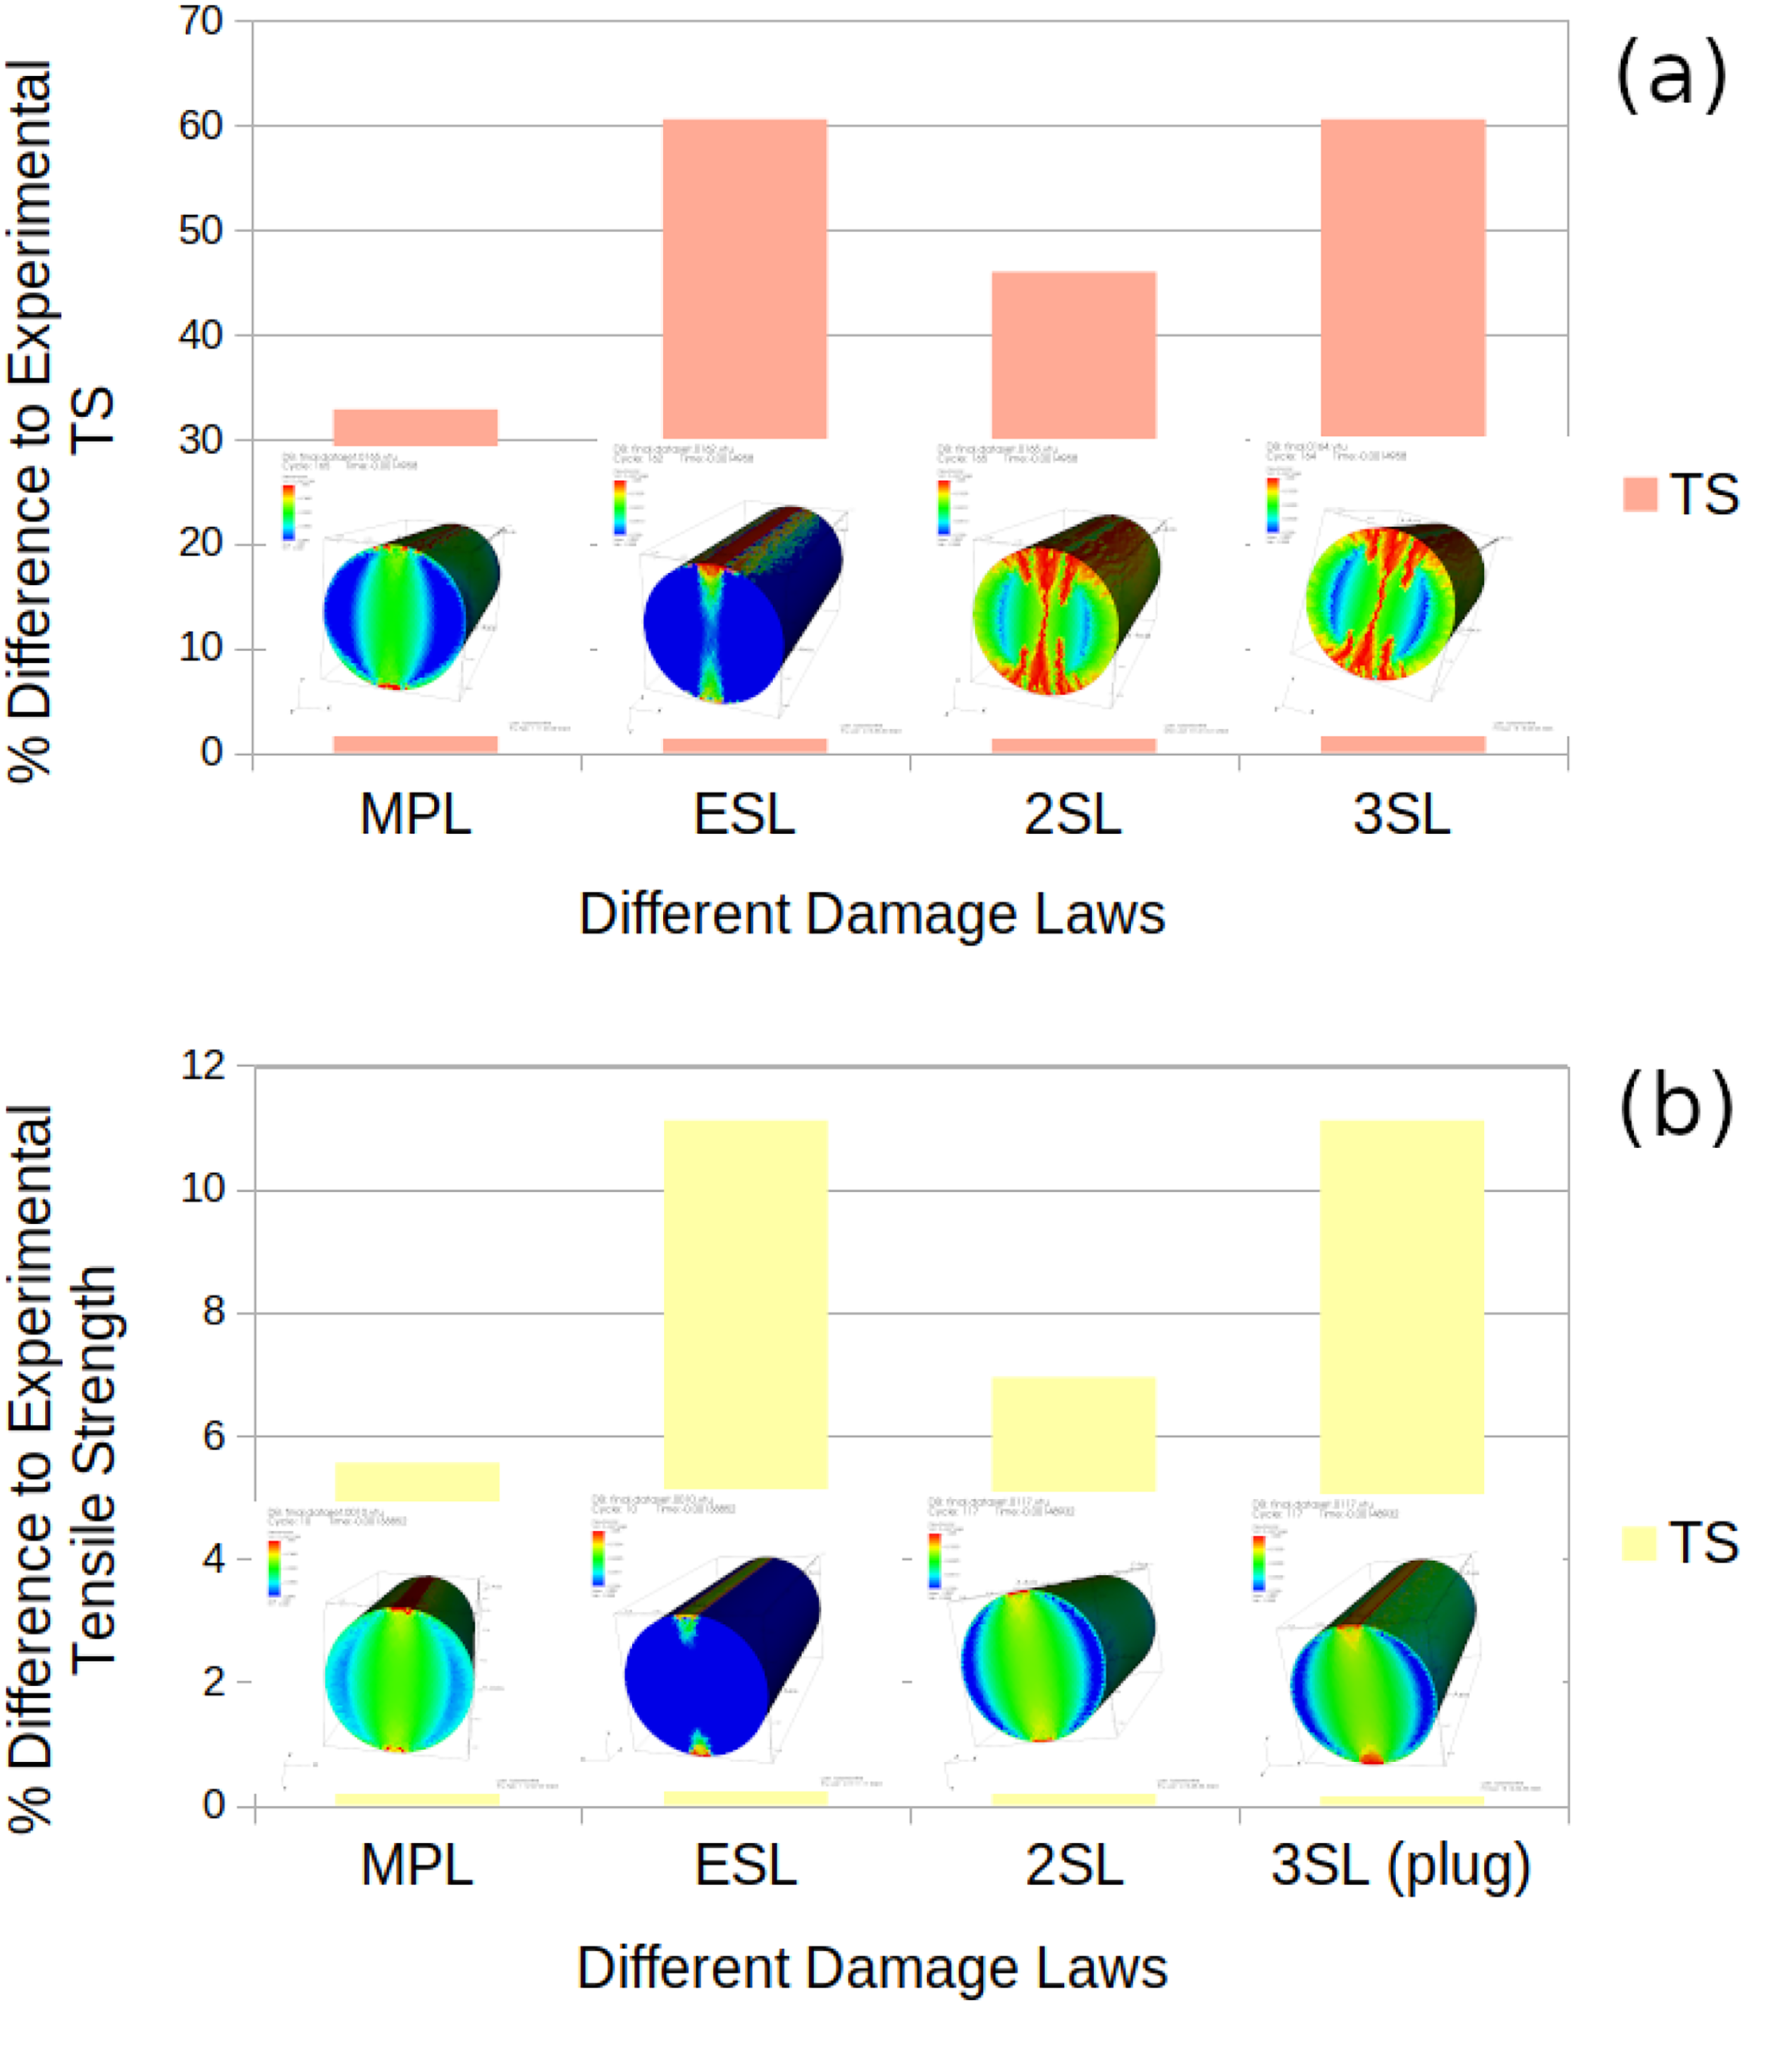
Comparison of percentage errors for the Brazilian splitting tensile strength (TS) and final damage plots at the end of simulation and post-failure after Brazilian splitting test for different damage evolution laws for the 14 days and 43 hours old concrete in (a) and (b), respectively.
Comparison of stress–CMOD curves for wedge splitting test for different damage evolution laws for the 14 days and 43 hours old concrete in (a) and (b), respectively.
Comparison of mechanical properties obtained from experiment or numerical simulations for three damage evolution laws (CDL, MPL and ESL).
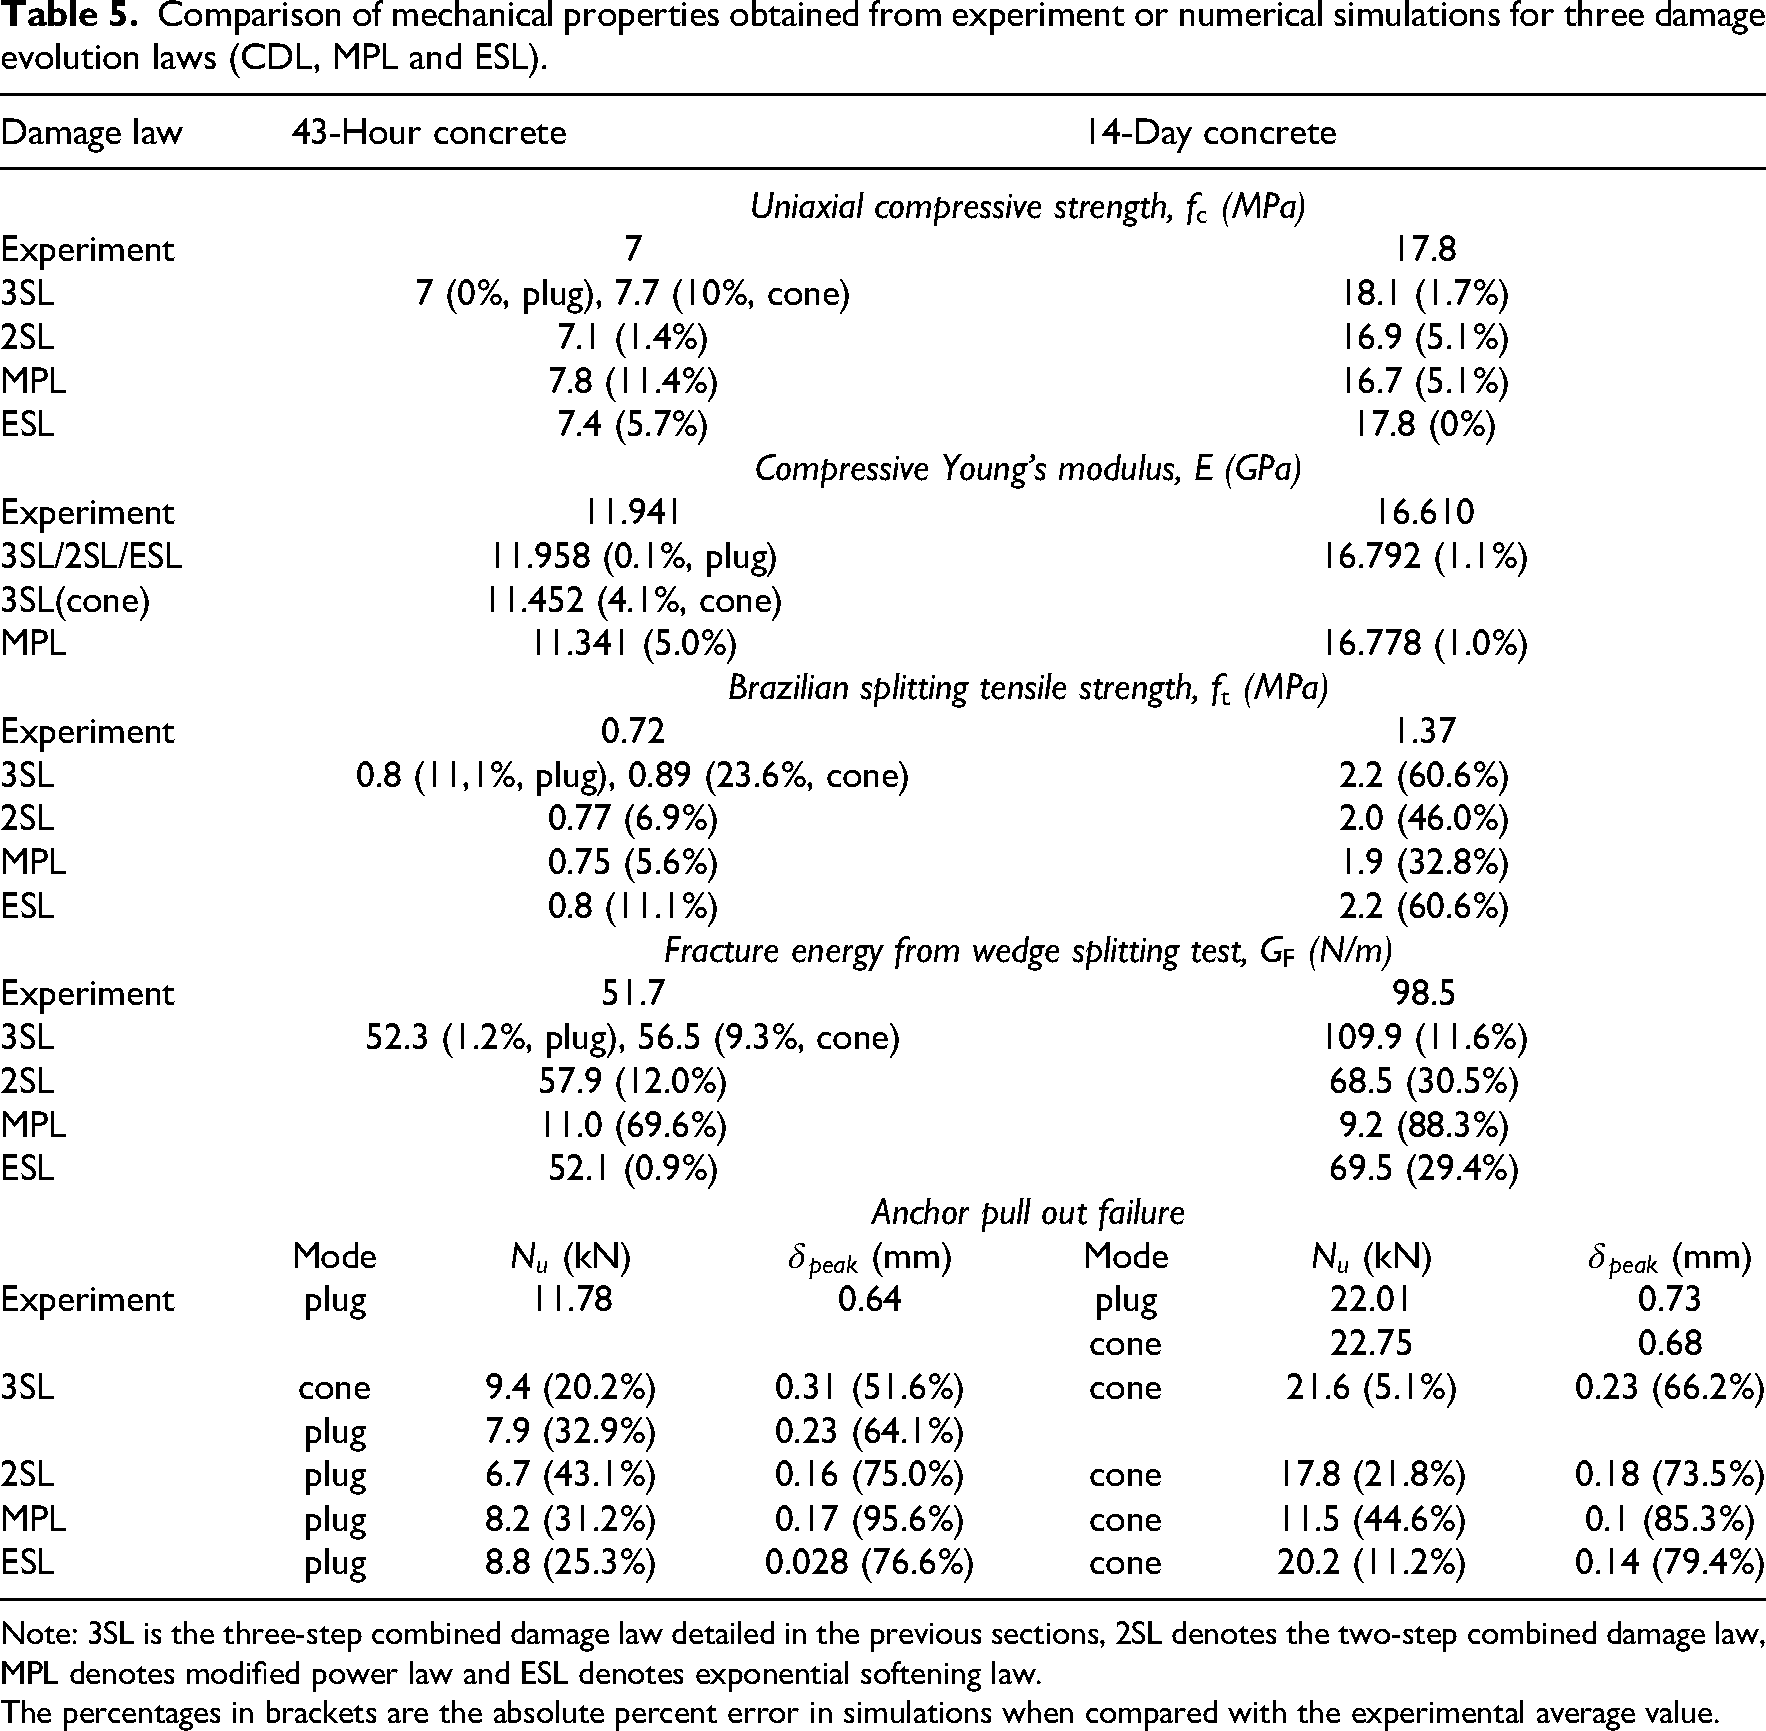
Note: 3SL is the three-step combined damage law detailed in the previous sections, 2SL denotes the two-step combined damage law, MPL denotes modified power law and ESL denotes exponential softening law.
The percentages in brackets are the absolute percent error in simulations when compared with the experimental average value.
Comparison of wedge splitting test results for combined damage law with single damage evolutions laws
Figure 19 shows the stress–CMOD curve for the wedge splitting test for the different laws. For the wedge splitting test the calculations of the fracture energy from these curves was very sensitive to the damage law applied, especially with regard to the post-peak softening behaviour defined by these models. In general the more brittle MPL model under-estimated the fracture energy quite significantly (9.3% and 21.3% of experimental value for the 43 hours and 14 days old concrete, respectively). For the 14 days old concrete only the 3SL law gave an accurate fracture energy, whereas for the 43 hours old concrete 3SL, 2SL and ESL all gave relatively accurate fracture energies. Despite running multiple simulations using both single damage evolution laws (MPL and ESL) parameters which matched the experimental data for all four tests as well as the 3SL model were not able to be found. Figure 20 displays the percentage error difference of the fracture energy for the different laws when compared to the experimental results, as mentioned earlier the MPL simulations were not able to reproduce the fracture energy accurately. Figure 20 show qualitatively similar damage evolution and fracture paths for all the different laws for both concrete ages, and they all replicate the experimental results showing a crack propagating down the middle of the specimen. Again the 3SL, 2SL and MPL simulations shows more diffuse damage than the ESL models, with the 43 hours old concrete displaying even more delocalised regions of diffuse damage. In contrast the ESL law shows more brittle localised cracks.
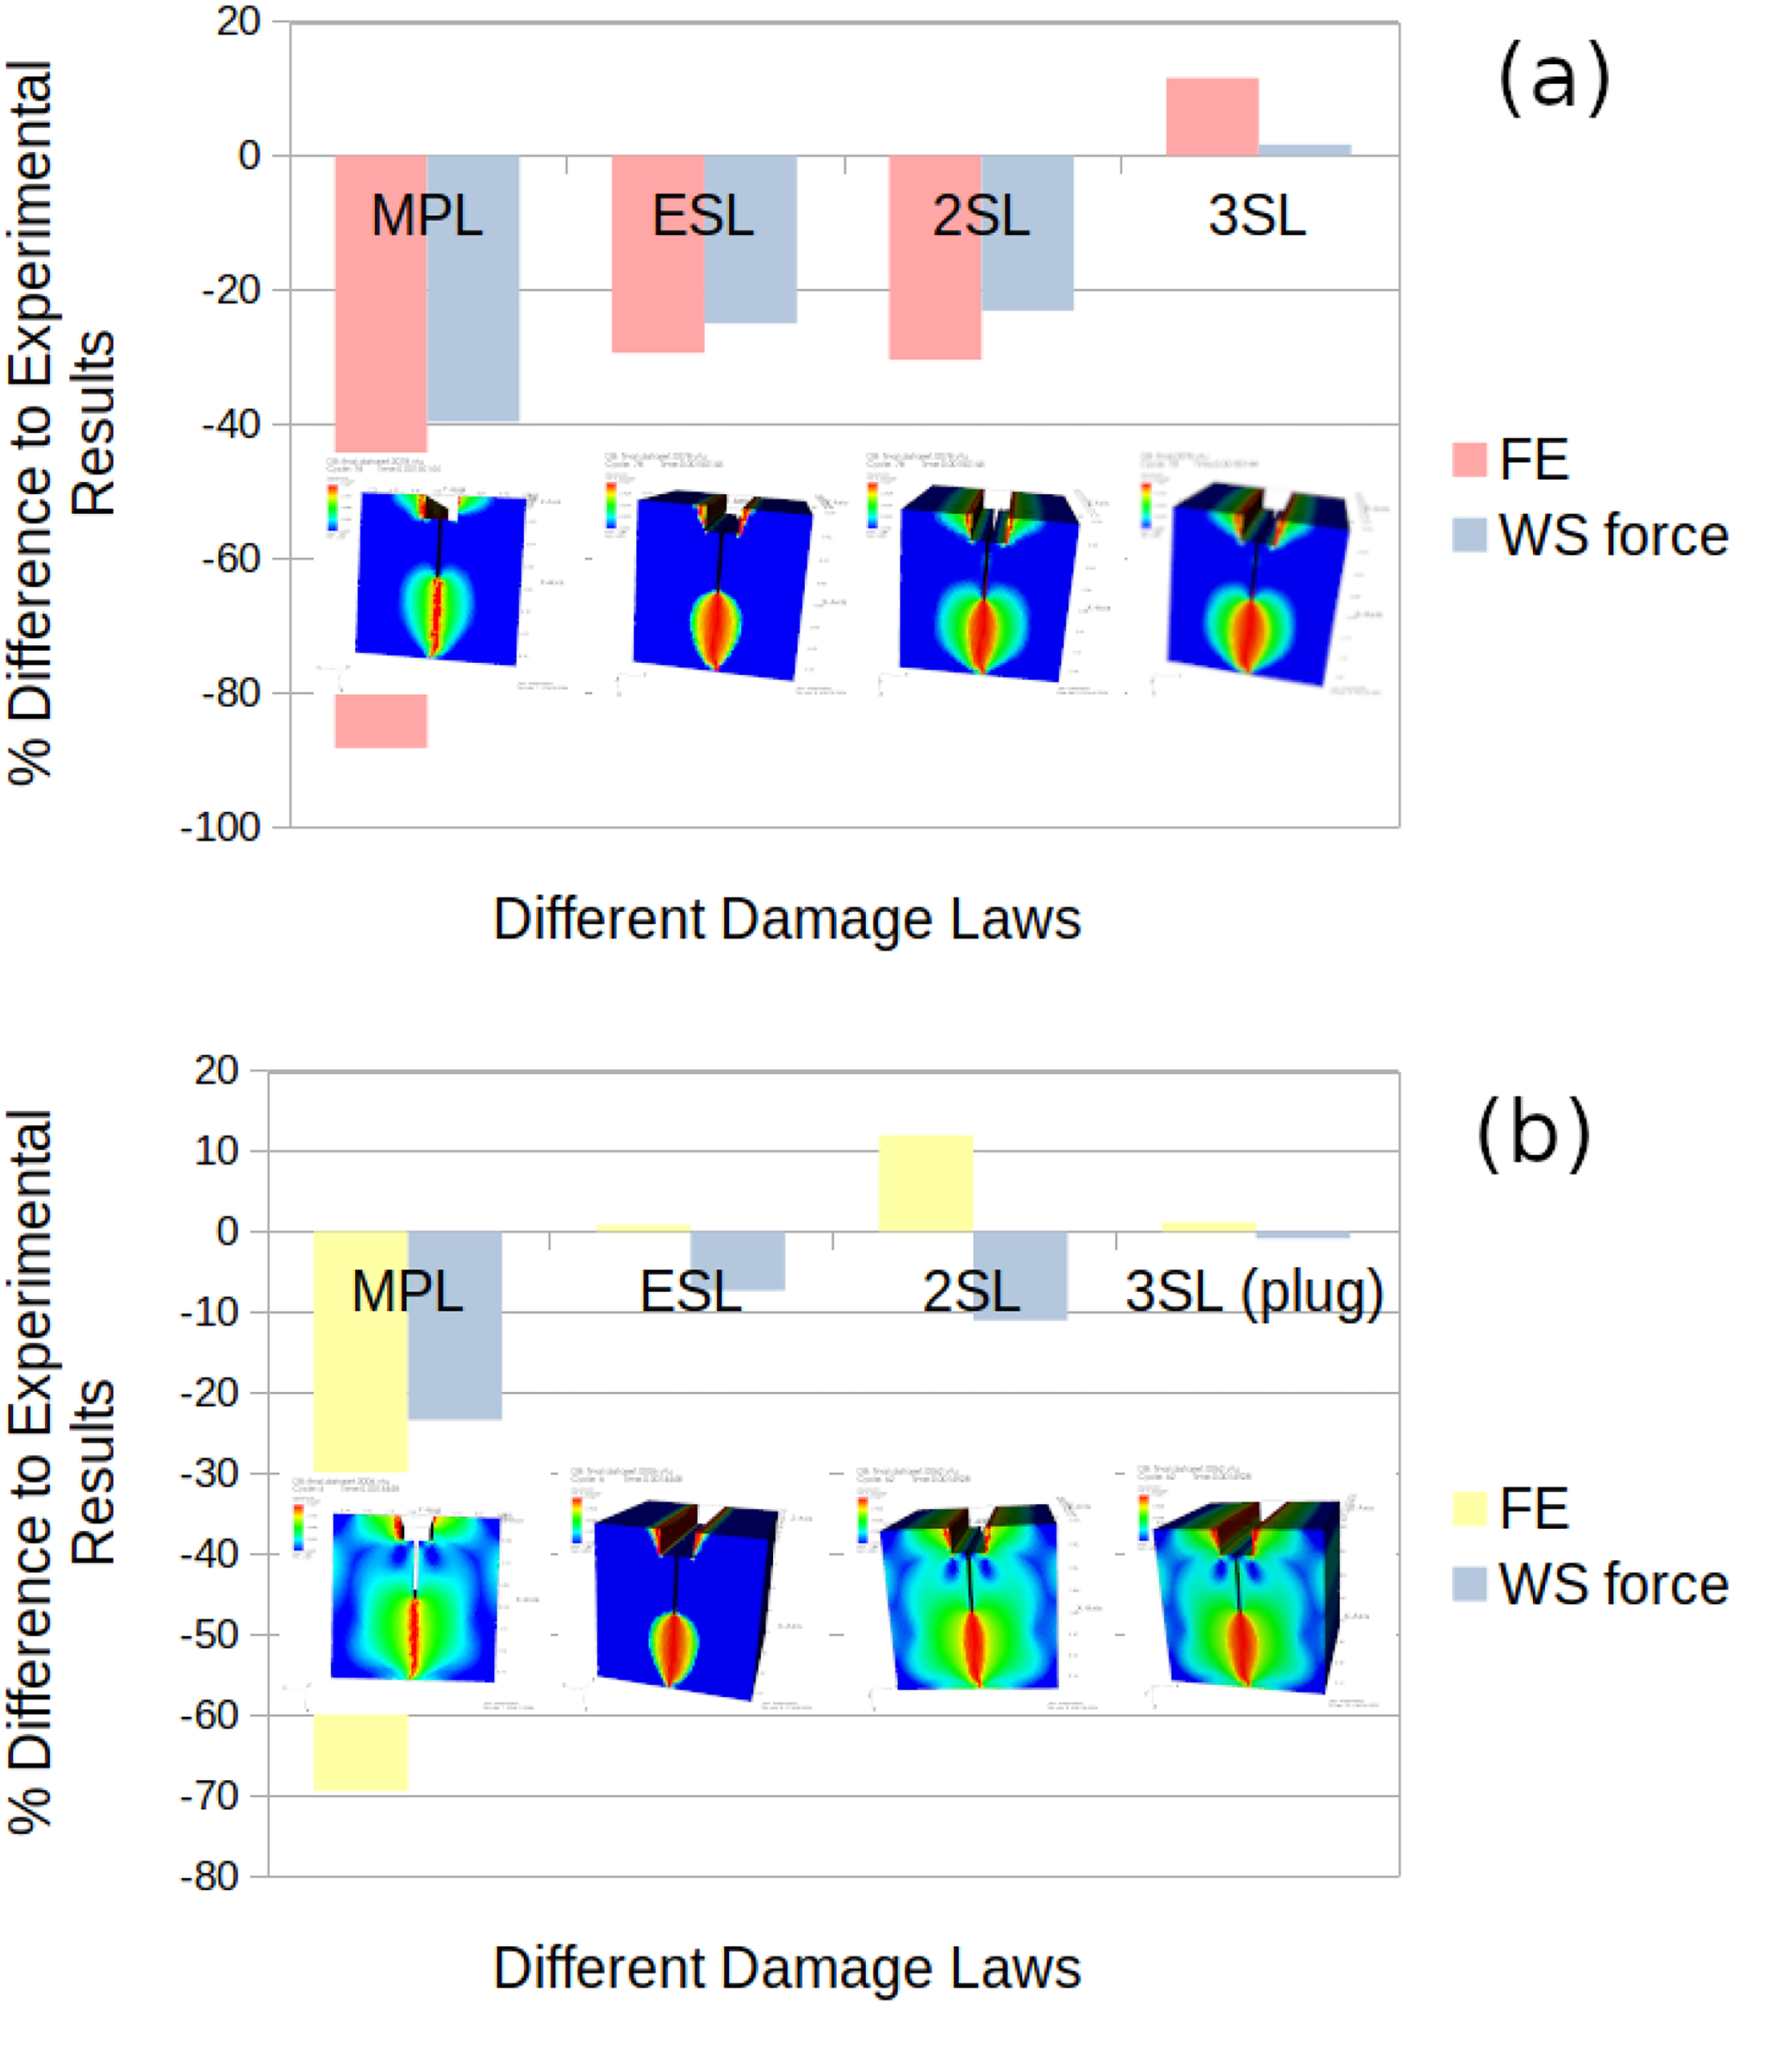
Comparison of percentage errors for the fracture energy (FE), wedge splitting (WS) force and final damage plots at the end of simulation and post-failure after wedge splitting test for different damage evolution laws for the 14 days and 43 hours old concrete in (a) and (b), respectively.
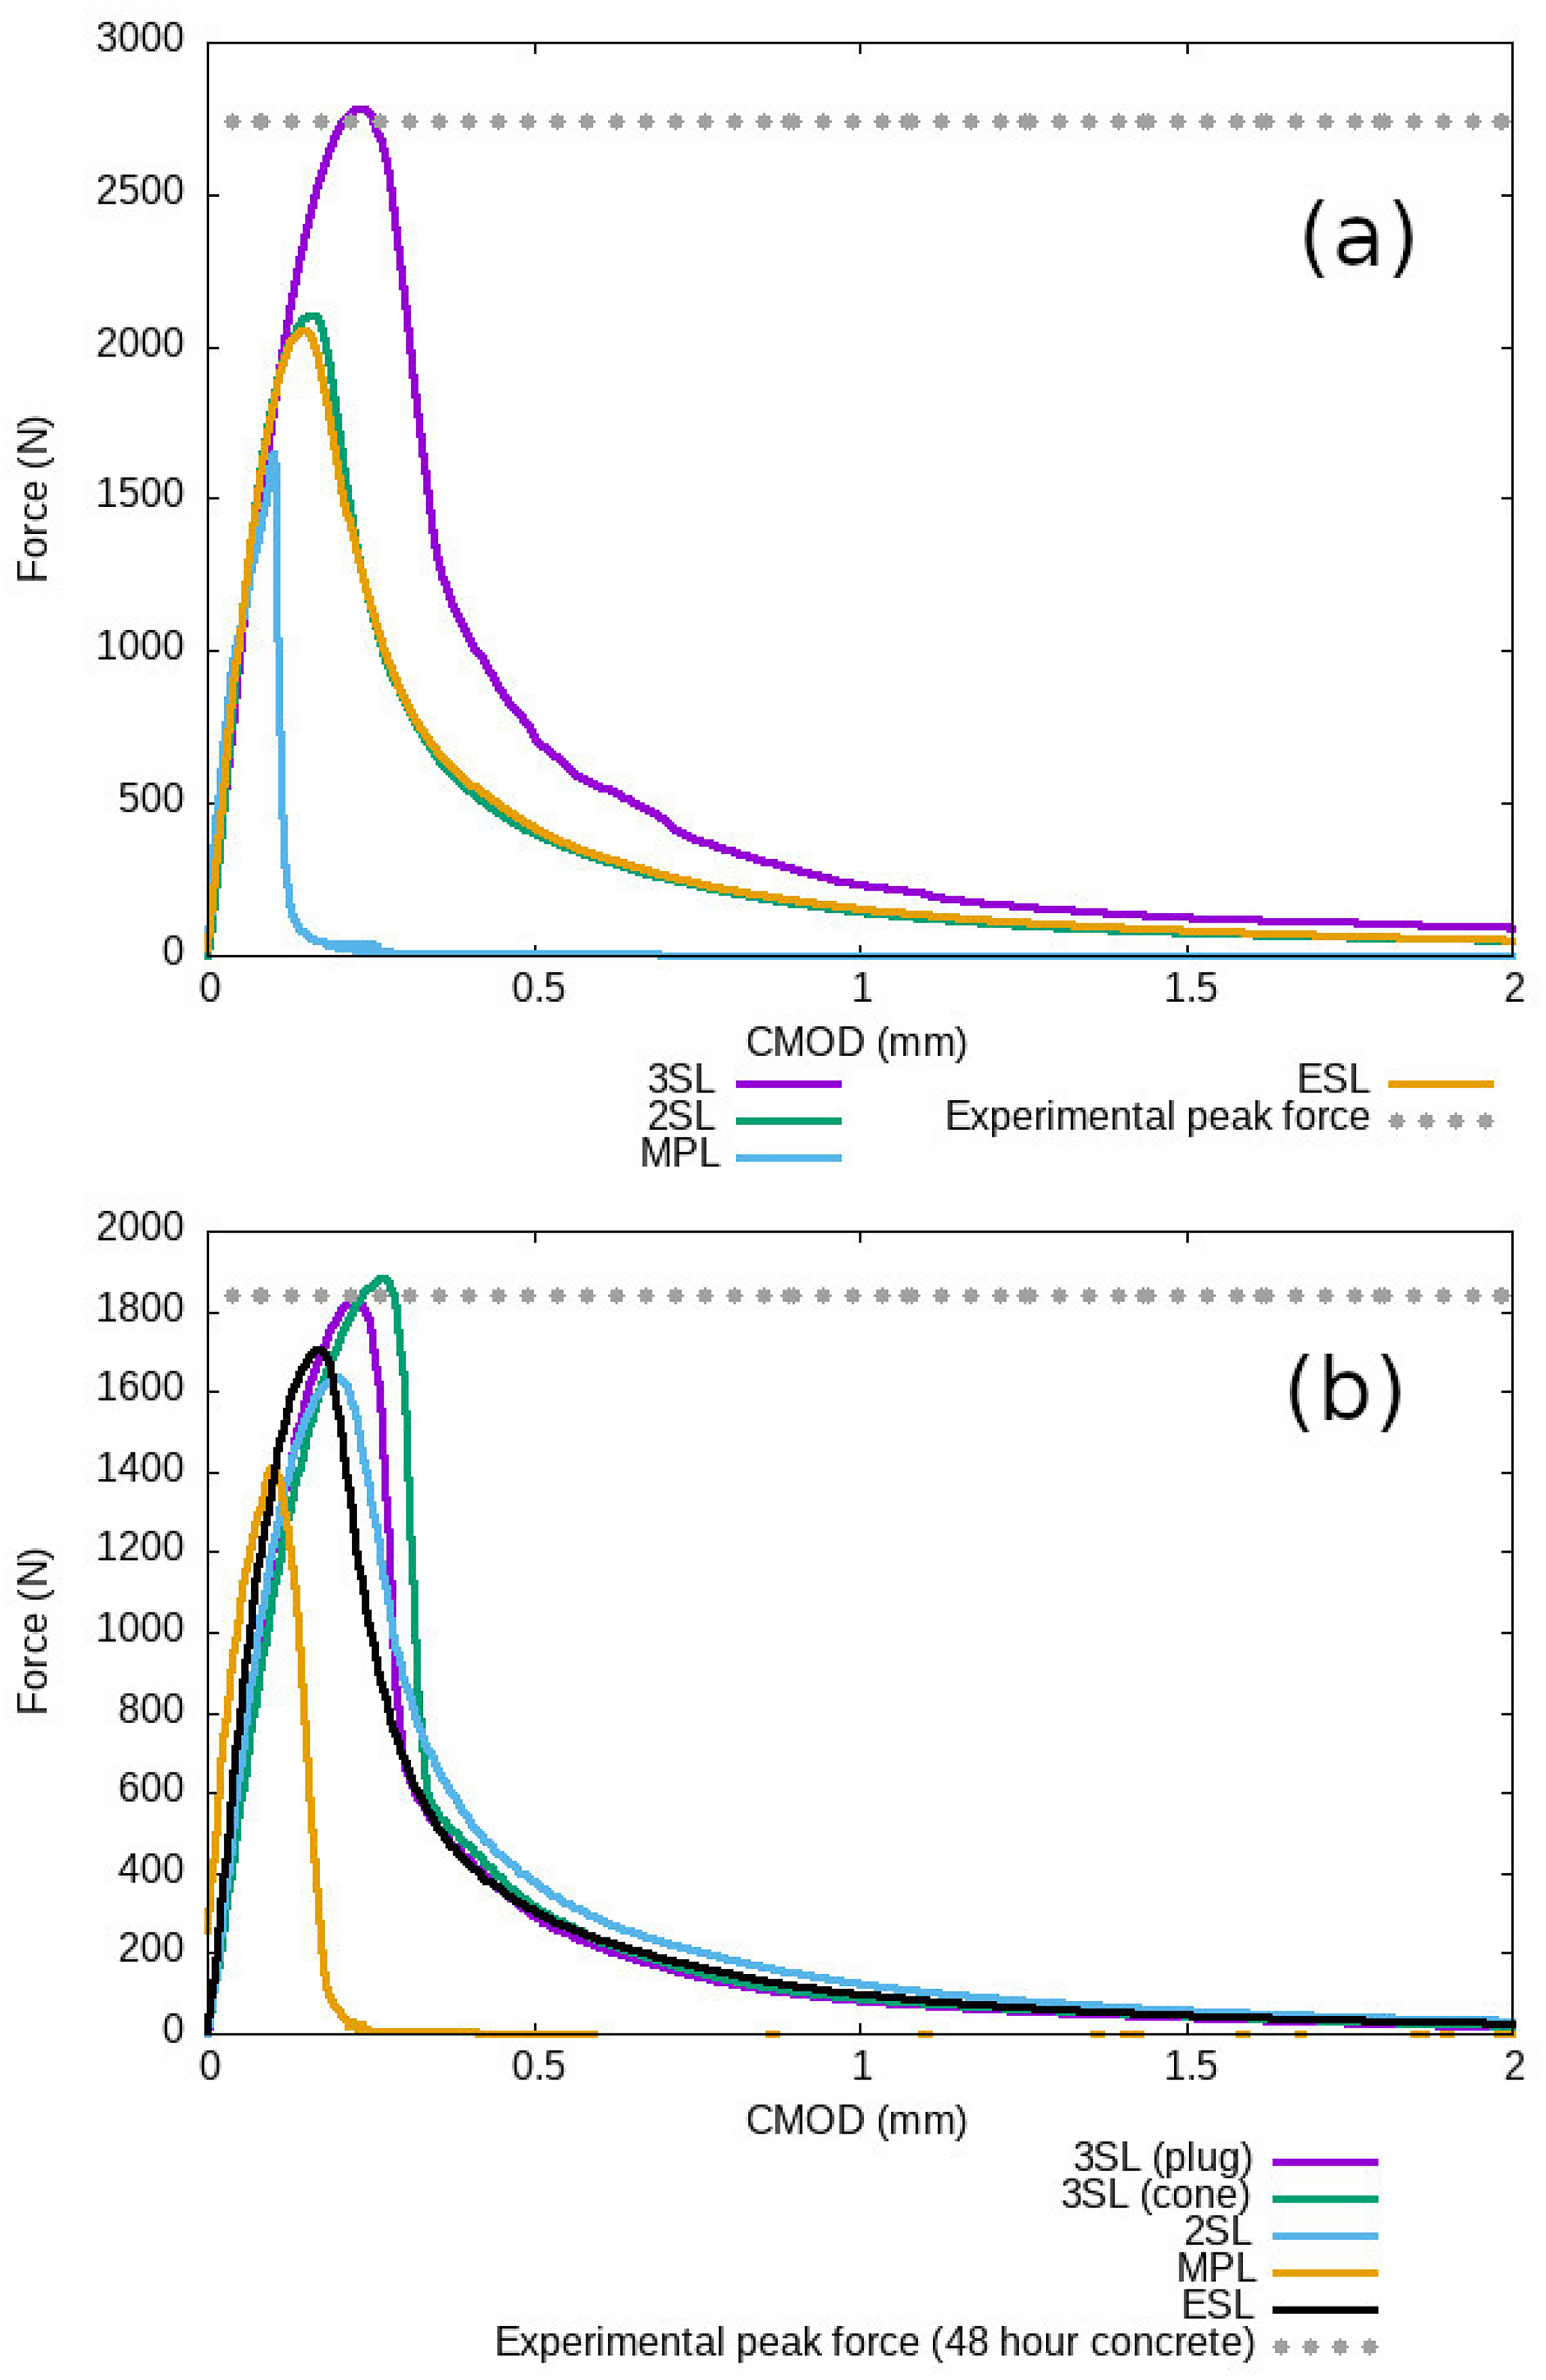
Comparison of force–displacement curves for anchor pull-out test for different damage evolution laws for the 14 days and 43 hours old concrete in (a) and (b), respectively.
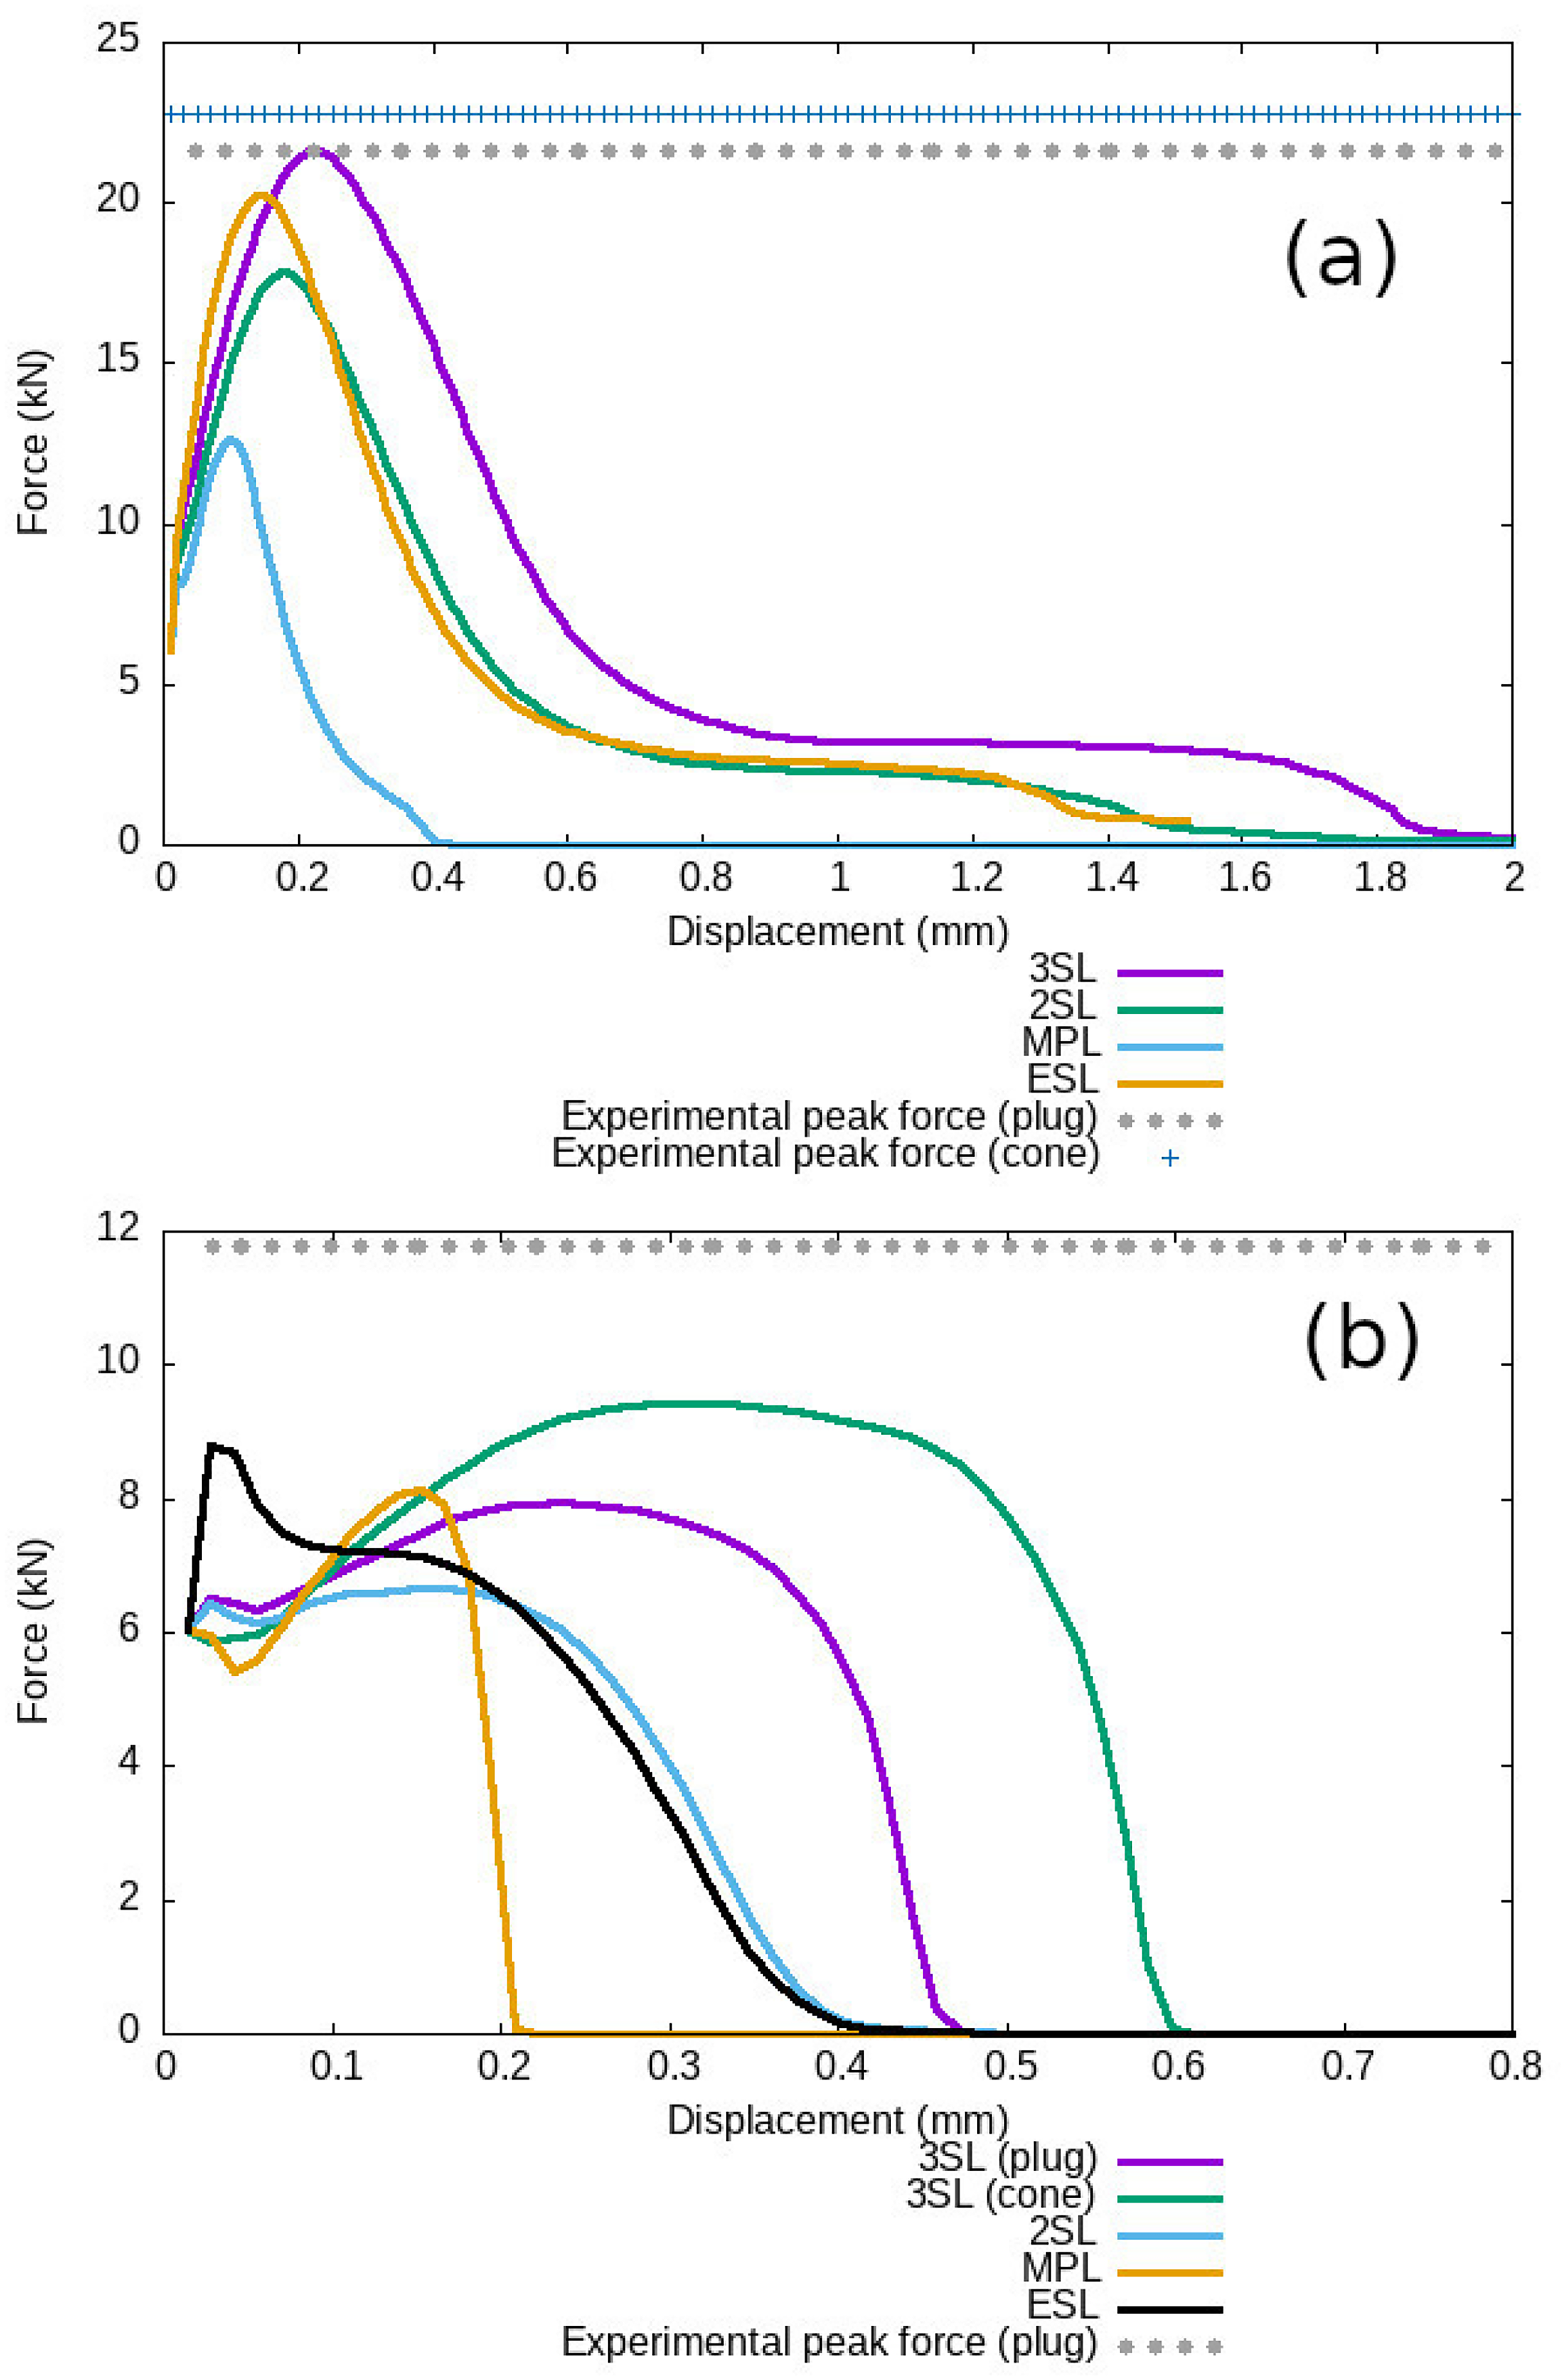
Comparison of anchor pull-out test results for combined damage law with single damage evolutions laws
Figure 21 shows the force–displacement curve for the anchor pull-out test for the different laws. In all the simulations with different damage laws the results were very sensitive to parameters in their respective damage evolution laws. Overall the 3SL models estimated the peak force closest to the experiment. Figure 22 displays the percentage error difference of the anchor peak force for the different laws when compared to the experimental results. The damage plots in Figure 22 show qualitatively similar damage evolution and fracture paths for the different laws for both the 14 days old concrete with cone-like failure, and 43 hours old concrete with plug-like failure, replicating the experimental results well. Again the damage is more diffuse for the 3SL, 2SL and MPL simulations.
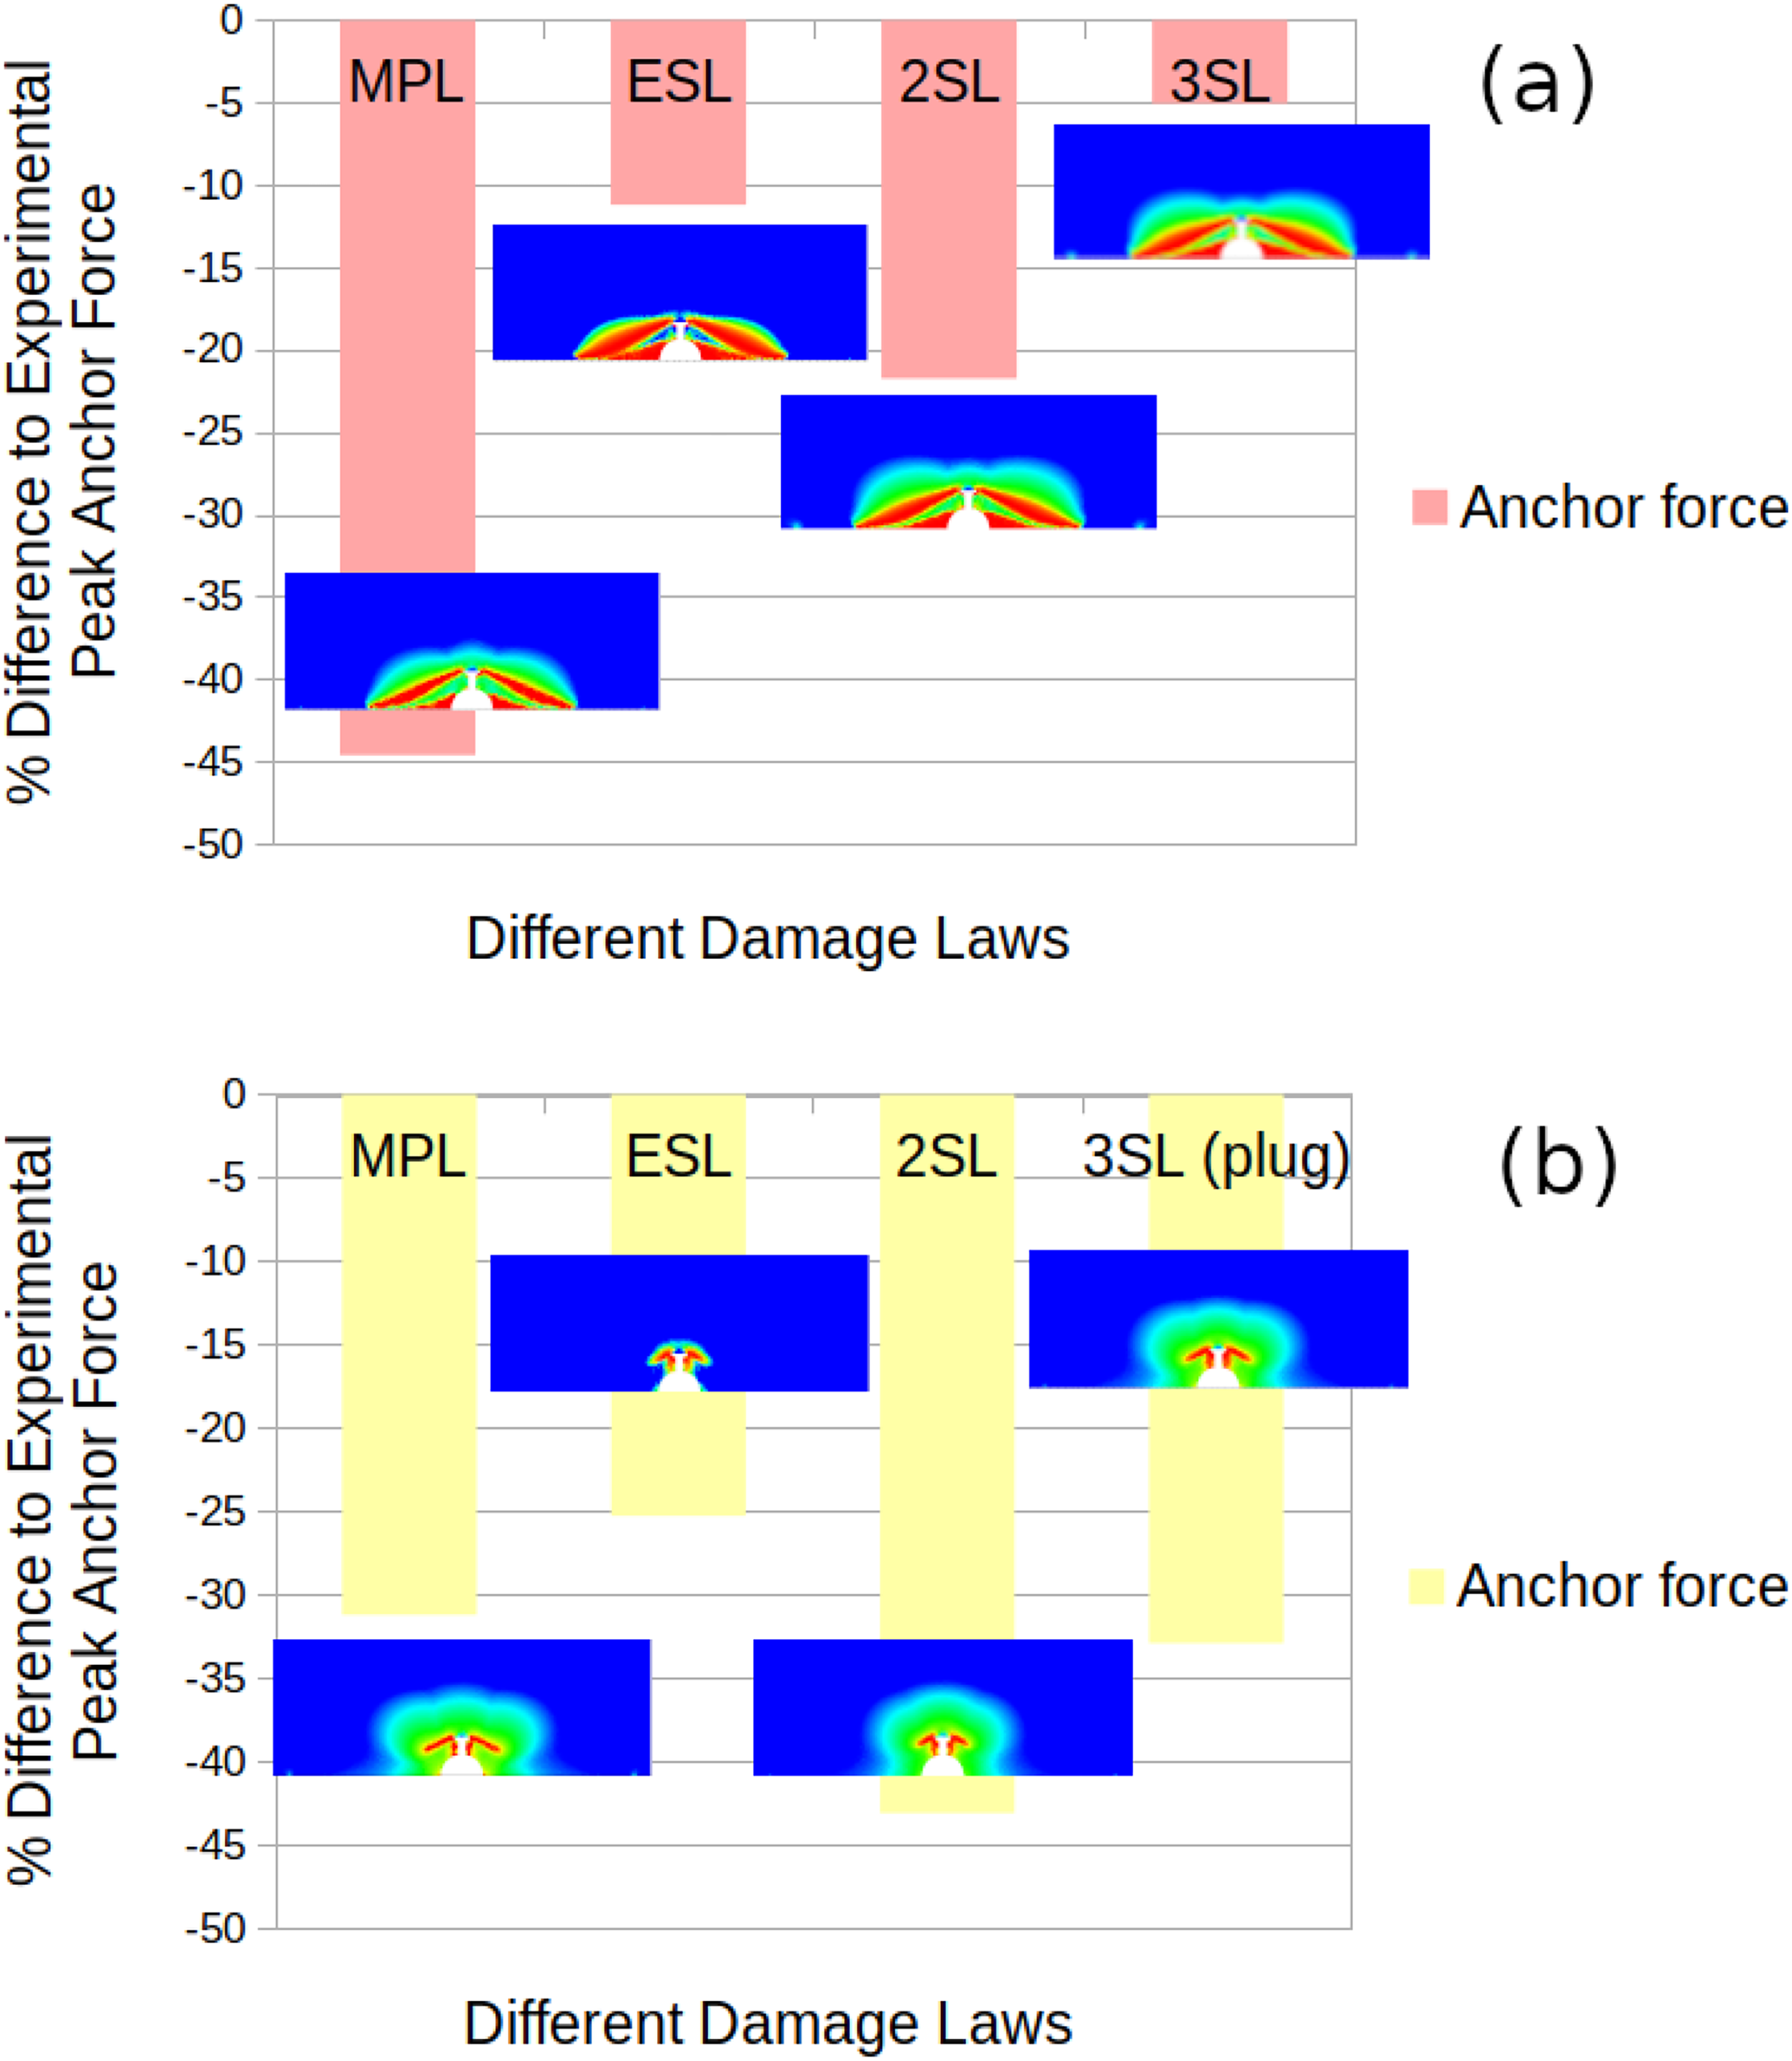
Comparison of percentage errors for the peak anchor force and final damage plots at the end of simulation and post-failure (in
Conclusions
For concrete anchors in tension, different failure modes can occur including concrete cone (or concrete breakout), pull-out, and steel failure modes. Whilst in mature concrete (older than 28 days) the concrete cone failure mode typically dominates for cast-in headed anchors in ordinary concrete, this may not apply in early age concrete where anchors with shallow embedment are used with void formers, which is a common practice in lifting applications for precast concrete panels. In many current applications especially for precast concrete panel lifting purposes, fasteners are loaded as early as 24-48 hours before reching a concrete age of 28 days. As different failure modes such as the plug failure may occur, which is not addressed by current design standards, there is a need to predict the occurence of this failure mode to address a potential knowledge gap in the safety of lifting precast concrete panels at early age. This was the purpose of this research and the main findings are summarised below:
Numerical simulations are an efficient method to study concrete failure modes in anchor tension tests. FEM simulations of anchor failure which can simulate both concrete cone and non-concrete cone failure modes are needed to complement experimental tension tests of anchors which are costly and time-consuming. Developing new models of damage evolution in early aged concrete which are validated against standard tests, can allow variations in anchor design parameters to be simulated in anchor tension tests with ease and in a timely manner. This numerical study provides support for a new three-step damage evolution law (3SL) for concrete at different ages which combines the modified power law for the onset of damage with an exponential softening law for the post-peak strength softening stage, and a second modified power law for the final fracture. The new combined three-step damage law was calibrated through extensive simulations of three concrete tests (uniaxial compression, Brazilian, wedge splitting) by varying the parameters in the three laws to most accurately reproduce the uniaxial compressive strength, tensile strength and fracture energy found in the experimental tests. The versatility of the new combined damage law is demonstrated in accurately reproducing the experimental results in the four tests including the anchor tension test. In contrast, a parameter suite for either of the single damage law (ESL or MPL models) was not able to be found that could reproduce the experimental measurements as well. A comprehensive comparison of the damage modes, fracture paths and stress–strain or force–displacement for all four tests is performed, and where possible a comparison with experimental results is also provided. For the two concrete ages simulated the results showed that the 3SL damage evolution laws defined in this paper gave the lowest average percent error over the mechanical properties measured in the four tests, namely the compressive Young’s modulus, uniaxial compressive strength, Brazilian tensile strength, wedge splitting fracture energy and peak force, and peak force and mode observed in the anchor pull-out tests.
This work has made inroads in developing continuum damage models for concrete that are able to predict four experimental tests simultaneously. Different damage models are investigated with the same parameter set employed for each concrete age and compared with experimental results for four tests. The wedge splitting and anchor tests are the most difficult to test experimentally, and have the highest COV when compared to the compression and Brazilian splitting tests. In general the 3SL model performed best overall, however, there is still some limitation with its prediction of peak displacement in the anchor pull-out test. However, the peak displacement is not an important factor for anchor design, whereas the peak load is the most important factor in anchor design and the 3SL damage model performs well in this regard. Future work to advance these models further would be to explicitly include a strain rate dependence in the damage evolution law and explicitly model the steel anchor. Another useful avenue to explore would be to use a statistical or machine-learning approach to investigate the parameter space and inform the choice of parameters for each of the damage evolution laws to match the experimental values better. Future applications of this research would be to predict non-concrete cone failure modes found in early age concrete for applications with lifting anchors.
Footnotes
Acknowledgements
This work was supported by the Swinburne University of Technology Vice Chancellor Women in STEM fellowship and the Swinburne University of Technology Academic Carer’s financial assistance program.
Funding
The authors received no financial support for the research, authorship and/or publication of this article.
Declaration of conflicting interests
The authors declared no potential conflicts of interest with respect to the research, authorship, and/or publication of this article.