
Abstract
In this work, a novel method for damage evolution analysis of concrete under uniaxial compression is proposed based on the multi-feature acoustic emission (AE) and the Gaussian mixture model (GMM) clustering. The hierarchical clustering algorithm is adopted to select optimal AE parameters, while multiple features of these parameters are generated through the principal component analysis (PCA). Then the concrete damage signals are separated by using the GMM clustering with multiple features. Meanwhile, the waveform signals associated with concrete damage in each cluster are validated using the Fast Fourier transform (FFT) and the continuous wavelet transform (CWT). Finally, the damage evolution process of concrete under uniaxial compression is divided based on the variation of AE characteristics. The results show that the frequency ranges of signals for micro-cracks, mixed cracks and friction of concrete under uniaxial compression are 20–30 kHz, 20–65 kHz, and 100–120 kHz, respectively. The damage process of concrete under uniaxial compression is divided into three stages according to the inflection points of the cumulative energy curve, namely the initial compaction stage, the crack formation stage and the failure stage.
Introduction
Concrete has been widely recognized as a typical heterogeneous material, which has significant brittle damage characteristics under various loads and extreme conditions (Zhou and Ju, 2021). Consequently, regular assessments of the safety and serviceability of concrete structures hold great importance. The Acoustic Emission (AE) technique is renowned for its non-destructive testing (NDT) capabilities, contributing to the non-invasive and passive detection of concrete damage (Alimirzaei et al., 2022). The mechanical energy generated by the cracking and deformation of the material is transferred from the acoustic source to the surface in the form of elastic waves (Ju et al., 2006). While the magnitude of P-wave velocity may vary among specimens for arbitrarily exciting frequencies, it remains unaffected by the grain (aggregate) size within the tested frequency range. Consequently, NDT methods prove instrumental in accurately assessing the condition of existing structures and obtaining information regarding potential sources of damage (Ju and Weng, 2000). AE sensors incorporate highly sensitive piezoelectric elements capable of detecting elastic waves and converting them into electrical signals (Tian et al., 2023). However, traditional AE signal analysis methods encounter challenges in unveiling the intricate damage mechanisms of concrete. Therefore, it is crucial to employ effective analysis methods to enhance the precision of damage assessment of concrete structures.
At present, AE signal analysis methods can be generally categorized into two approaches: parameter-based and waveform-based analyses (Yang et al., 2021). Traditional approaches, known for their simplicity and high efficiency, are suitable for the qualitative assessment of crack development and damage evolution (Su et al., 2023). Researchers have employed various AE parameters to characterize the damage evolution process in CFRP-strengthened and reinforced concrete structures, including amplitude, energy, count, peak frequency (Nair et al., 2020; Zhang and Li, 2020). Chen et al. (2020) conducted an investigation into the fracture characteristics of concrete under compression loading. The damage evolution was analyzed based on the inflection points of the cumulative curve of hits and ring count. Carpinteri et al. (2016) introduced a classification method for concrete crack modes based on the AE waveform parameters. The feasibility of fracture mode recognition was validated through the analysis of average frequency (AF) and rise angle (RA). Aggelis (2011) proposed AE indices to describe the damage mechanism of concrete under bending tests. The damage mechanism of microcracking, macrocracking and fiber pull-out of concrete was characterized. It is important to note that AE parameters are related to material properties, specimen geometry and acquisition system settings (Jiao et al., 2020). In addition, AE waveforms are affected by high attenuation rates and spreading loss in heterogeneous materials (Zhang et al., 2020). Describing the correlation between damage degree and AE signals poses a significant challenge when using traditional approaches (Barile et al., 2019). Presently, machine learning techniques are widely employed in several research fields, demonstrating the ability to enhance performance through the utilization of previous experience (Galanopoulos et al., 2023). The correlation between input features and variables features can be established. AE-based machine learning methods have found wide adoption for tasks such as damage degree estimation, crack model recognition and acoustic source location in concrete structures (Omar et al., 2022; Yu et al., 2022). Machine learning-based pattern recognition falls into two major categories: supervised clustering and unsupervised clustering (Yu et al., 2023). In the absence of prior knowledge regarding AE signals, an unsupervised clustering algorithm was employed for the categorization of damage modes (Yue et al.,, 2021). Qiu et al (2021) distinguished the AE signals associated with damage evolution in asphalt mixtures through the application of the k-means algorithm. The fracture mechanisms were analyzed by identifying the characteristics of recorded AE signals. Das et al. (2019) identified the crack modes in reinforced concrete beams using a machine learning-based method, with RA and AF as input features for clustering unlabeled AE data. Li et al. (2022) predicted the damage evolution of hydraulic concrete based on the gray wolf optimization (GWO) algorithm, selecting six AE parameters as input features for clustering. It is worth noting that AE parameters collected in experiments often contain redundant and irrelevant features, which can result in discrepancies between the real damage behaviors and AE responses (Li et al., 2014). From a clustering perspective, too few input features will decrease the clustering accuracy, as the algorithm may lack sufficient information to identify meaningful damage modes. On the other hand, an excess of features will introduce noise to complicate the clustering, making it challenging for the clustering algorithm to discern relevant damage types from irrelevant ones (Al-Jumaili et al., 2015). In previous studies, two approaches have been employed for the determination of input features. One approach involves the direct utilization of existing AE parameters, while the other entails the extraction of features from all AE parameters. For instance, Harizi et al. (2022) introduced a multivariate analysis approach for evaluating the damage mechanisms of composites. The most relevant descriptors were selected as input features for clustering using k-means algorithms and principal component analysis (PCA). Barile et al. (2022) identified optimal features for assessing the damage state using the Laplacian score. The k-means algorithm was utilized to cluster AE signals based on the two selected features. Peng et al. (2020) examined the correlation between damage accumulation and multivariate AE signals using PCA. The fracture energy of stone blocks was evaluated by analyzing the dominant AE parameters. Despite data processing methods for AE features have been extensively explored, a notable controversy exists in the selection of the input features, and specific criteria for attaining optimal clustering have yet to be proposed.
The characteristics of AE signals are widely acknowledged for their pivotal role in improving the interpretability of clustering. As reported by Chen et al. (2023), although all AE activities in concrete are attributed to damage events, the classification of AE signals often demonstrates nonlinear separability due to the involvement of multiple mechanisms. Consequently, it is vital to consider the distribution characteristics of AE signals in clustering. The Gaussian mixture model (GMM) considers the probability distribution of data, and the GMM clustering algorithm was widely employed to categorize crack modes in reinforced concrete. For example, the crack modes of tension and shear were classified based on the clustering of AE signals (Farhidzadeh et al., 2013). Similarly, Prem and Murthy (2017) examined the deterioration progress in reinforced concrete, and assessed the feasibility of crack classification using the GMM clustering. It is worth noting that the choice of input features for GMM clustering often depends on the subjective judgment of researchers, which brings challenges to the classification of concrete damage mechanisms. The hierarchical clustering algorithm is a feature selection method that identifies optimal features by arranging AE parameters into a dendrogram (Soltangharaei et al., 2021). Furthermore, the PCA serves as a quantitative dimensionality reduction technique, which regroups numerous features with certain correlations into a more concise set of unrelated indicators (Tayfur et al., 2018). Consequently, it becomes possible to reduce the number of input features without sacrificing critical parameter characteristics by combining the advantages of hierarchical clustering and PCA.
In this study, a novel method for damage evolution analysis of concrete under uniaxial compression is proposed. The methodology includes several steps: Firstly, the hierarchical clustering algorithm is employed to identify optimal AE parameters. Then multiple features are extracted from these parameters using the PCA. Meanwhile, the AE signals are separated using the GMM clustering algorithm. To validate the waveform signals associated with concrete damage in each cluster, the Fast Fourier transform (FFT) and the continuous wavelet transform (CWT) analysis are applied. Finally, the damage process of concrete is divided based on the variations of AE characteristics of different damage mechanisms. The primary objective of this study is to estimate the damage evolution of concrete under uniaxial compression. This research also provides valuable insights for the detection and evaluation of concrete structures.
Methodology for feature selection and clustering of AE
In this study, the methodology is founded on the Gaussian mixture model (GMM) clustering with multi-feature AE. The approach involves three essential components: feature selection, feature extraction and unsupervised clustering. The first step is feature selection, where the hierarchical clustering algorithm is adopted to identify AE parameters with low correlation. Subsequently, the PCA is adopted to reduce the dimensionality of the AE data. Finally, the GMM clustering is applied to separate AE signals into several clusters, corresponding to various damage modes observed in concrete under uniaxial compression.
Feature selection using hierarchical clustering
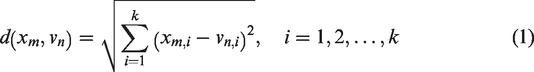
There is a correlation among specific AE parameters, which can be evaluated quantitatively by either the time domain or frequency domain. In the application of clustering algorithms, parameter selection plays a crucial role in improving the classification accuracy of AE signals. The hierarchical clustering algorithm is a widely employed feature selection method for critical AE parameters (Soltangharaei et al., 2021). In this approach, AE parameters are initially regarded as individual clusters, and a matrix of the AE signals is constructed. Then the similarity among AE signals within each category is evaluated based on the proximity matrix. Next, the sub-clusters are iteratively grouped into higher-level clusters, and the process continues until all clusters are combined into a single cluster. Finally, representative AE parameters are selected. The similarity between AE signals is calculated as follows:
Feature extraction using principal component analysis
Visualizing AE data requires addressing the issue of dimensionality. Low-dimensional features can be obtained through the feature extraction. The PCA creates a new set of variables from a linear combination of parameters. The steps involved can be summarized as follows: Firstly, a dataset is constructed where columns represent the number of AE parameters, and rows correspond to the number of data points. Then the AE data are standardized through the mean subtraction. The covariance matrix


The eigenvalue corresponds to the variance of the principal component (PC). The AE eigenvector with the largest variance is selected to calculate the ordered orthogonal basis. The basis vectors of these orthogonal bases represent all eigenvectors of the covariance matrix. The new coordinates of the n-th observation in the orthogonal coordinate system are defined by the eigenvectors, as depicted in equation (4).

Gaussian mixture model clustering of AE signals
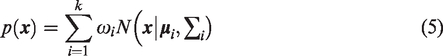
The GMM clustering is an unsupervised clustering algorithm based on probability estimation. It assumes that the data points consist of multiple Gaussian distributions, which can effectively approximate the density distributions of various shapes and sizes. These distribution characteristics of AE signals facilitate the classification of concrete damage modes into different clusters (Vidya Sagar, 2018). Since each AE signal represents the damage mode of concrete, multi-features AE parameters were adopted as inputs for GMM clustering. The mixture density can be expressed as follows:
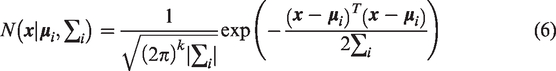
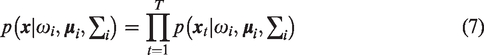
Multiple Gaussian probability density distributions are adopted to quantify the AE signals, which allow the maximum likelihood probability of the data points under these distributions to be maximized. For a set of training vectors
The expectation maximum (EM) method is utilized to estimate the optimal parameters of the GMM and obtain new model parameters. These parameters include the weight factor
The new model is estimated by the EM algorithm with the initial model
The posterior probability of the data point for the i-th component of the GMM is calculated as follows:

The cluster assignment for each input is obtained by selecting the component that corresponds to the maximum value of the posterior probability

Experiment procedure
Raw materials and specimen preparation
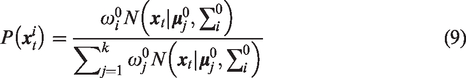
The P.O. 42.5 Portland cement was adopted as the binder of concrete mixtures. The fine aggregate consisted of river sands with a fineness modulus of 3.0, while the coarse aggregates comprised gravel with particle sizes ranging from 5 to 25 mm. To enhance the workability of the mixture, a polycarboxylate superplasticizer with a solid content of 13% and a water reduction rate of 33% was incorporated. Three different mixes were formulated with water-cement (W/C) ratios of 0.4, 0.45 and 0.5. For each mixture, a set of standard cube specimens was cast and then demolded after 24 hours. Subsequently, these specimens were cured for 28 days under standard conditions, including a relative humidity exceeding 95% and a temperature ranging from 20 ± 2 °C. The concrete mixture proportions and mechanical properties are provided in Table 1.
Concrete mixture proportions and mechanical properties of concrete.
Compression test procedure and AE signals acquisition
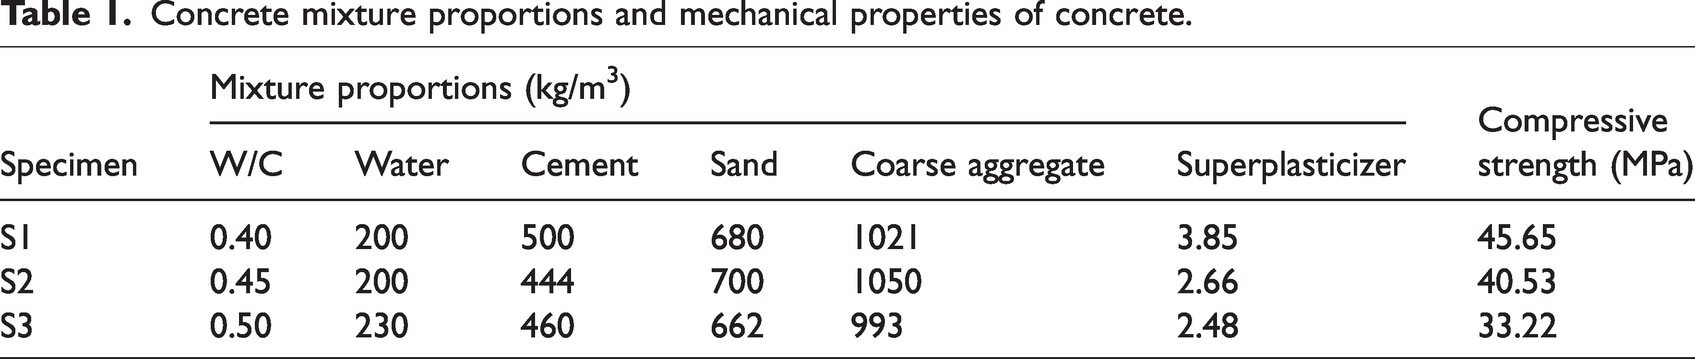
The samples were subjected to uniaxial compression using an RMT universal testing machine with a loading rate of 0.03 mm/min. The displacement and load of specimen was carried out using a displacement sensor with an accuracy of 0.5% and a force transducer with an accuracy of 0.2%, respectively. The strain of concrete was monitored in real-time by affixing two 80 mm strain gauges to the surface of each specimen. Simultaneously, an eight-channel AE monitoring system was utilized with a sampling rate of 1 MHz and a threshold value of 45 dB. The parameters of AE monitoring system were configured as follows: a peak definition time (PDT) of 35 µs, a hit definition time (HDT) of 150 µs, a hit lockout time (HLT) of 300 µs and a maximum duration of 1000 µs. In this study, AE signals were recorded utilizing R3α resonant sensors, featuring an operating frequency range of 20–100 kHz and a resonance frequency of 30 kHz, respectively. These sensors were securely affixed to concrete surfaces using adhesive tape. Silicone grease was employed as a coupling agent on the sensor surface to enhance the attachment and facilitate signal recording. The AE signals were pre-amplified by six preamplifiers with a gain of 40 dB. A schematic diagram of the compression test is provided in Figure 1(a), the detailed view of the specimen is shown in Figure 1(b), the layout of the AE sensors is illustrated in Figure 1(c), while the loading control system and AE monitoring system are displayed in Figure 1(d).
Experiment set-up: (a) testing system, (b) specimen, (c) layout of AE sensors and (d) signals acquisition.
Results and discussions
Feature selection and extraction of AE
To analyze the collected AE signals effectively, a total of eleven parameters were extracted from AE waveforms. These parameters include rise time (RT), count (C), energy (E), duration (D), amplitude (A), average frequency (AF), root mean square (RMS), average signal level (ASL), signal strength (SS), absolute energy (ABS), and peak frequency (PF), which characterize the relationship between all AE signals and the damage behaviors. The definition of these parameters was provided in Ref. (Barile et al., 2022). Due to the extensive volume of data generated for each specimen, the sensor with the highest signal activity was selected. Consequently, one of the channels in sample S1 was chosen as an example for optimal feature selection, establishing an AE dataset with all AE parameters.
In this study, logarithmic transformations were applied to exponential distribution features, such as energy, duration and signal strength, instead of using their original values. The hierarchical clustering algorithm is adopted to select optimal AE parameters from the perspective of data distribution. The hierarchical clustering diagrams of the AE dataset are shown in Figure 2. It should be noticed that lower distance values indicate strong correlations among descriptors, while higher distance values suggest weaker correlations among descriptors. The cut-off criterion is achieved by determining the ratio between the current and preceding validity index, indicating the degree of variation between classification levels. A cut-off distance of 130 was selected from a subset of four features (Moevus et al., 2008). AE parameters within the same category exhibit similarities. Consequently, energy, AF, RMS and count were separately chosen to form a new AE dataset for further analysis.
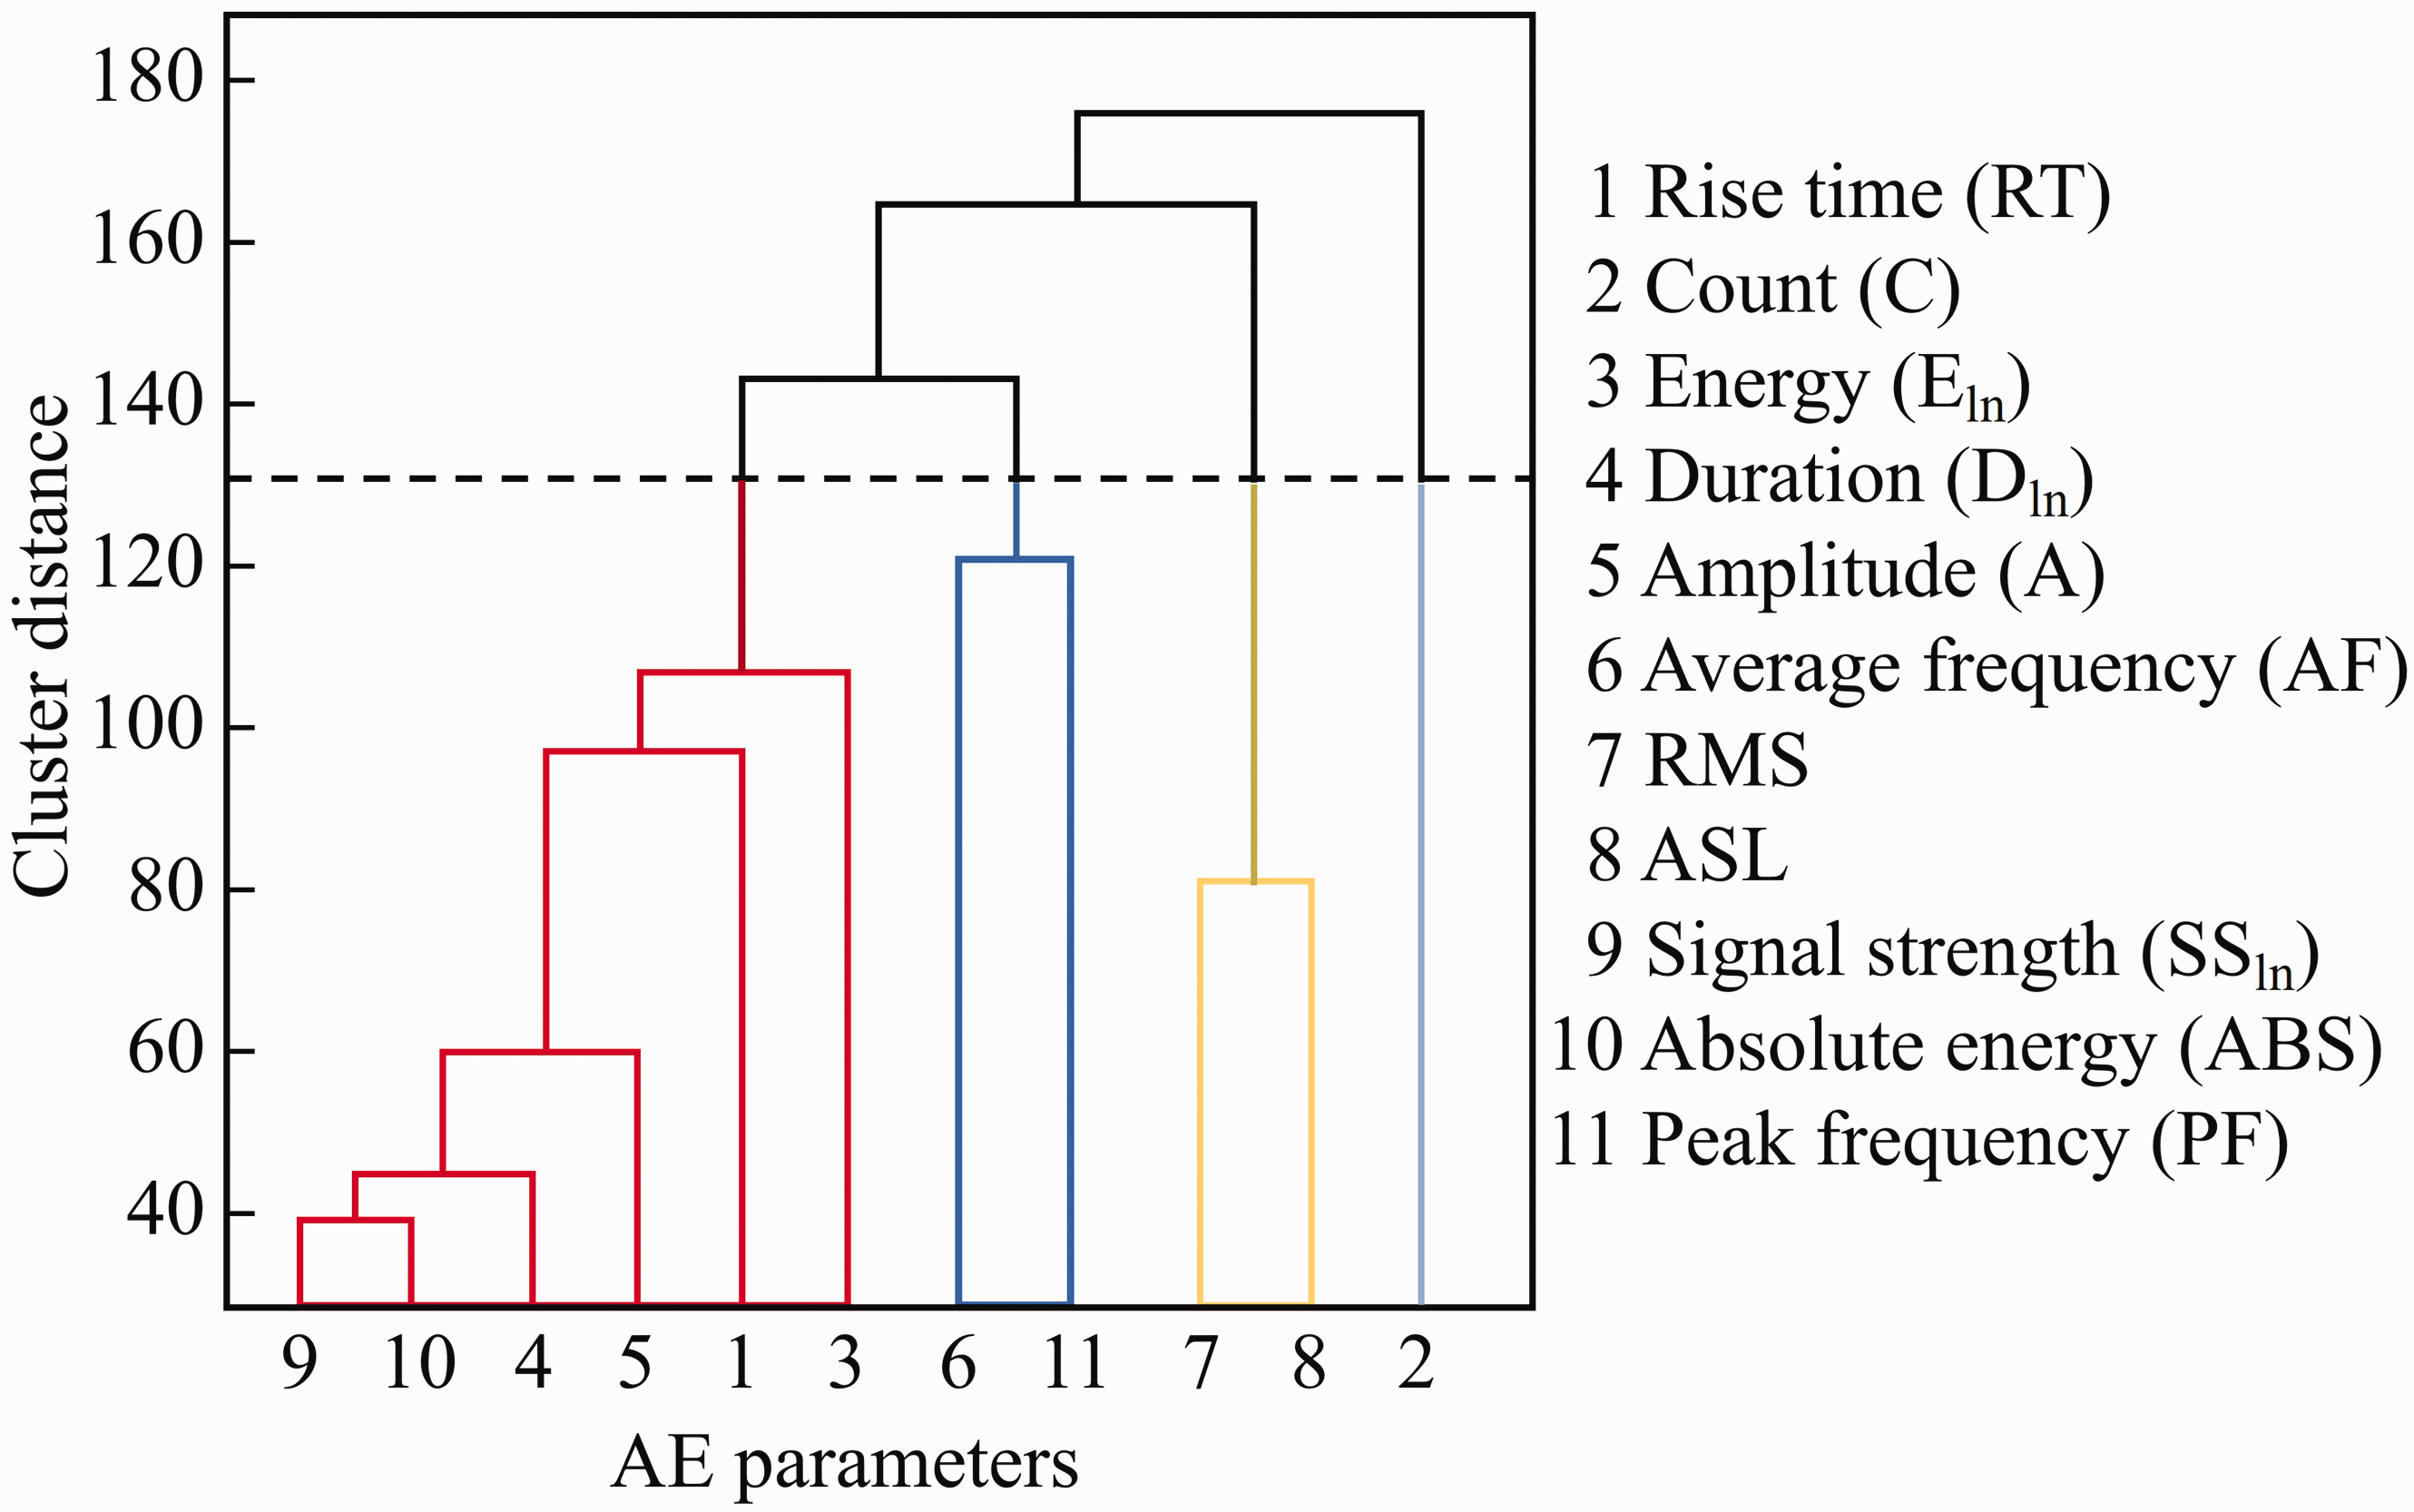
Hierarchy clustering diagrams of original AE dataset.
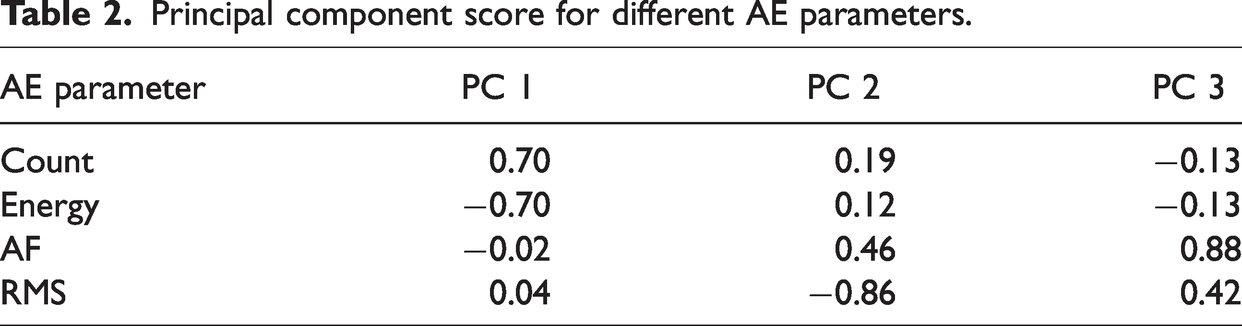
The PCA is adopted to extract descriptors from high-dimensional data. The eigenvalues of the PCs in the new AE dataset are arranged based on their significance. The first three PCs account for 95% of the total variance in the AE dataset. This observation implies that these three PCs can completely characterize the original dataset. Therefore, a high-dimensional AE dataset can be transformed into a lower-dimensional space using only three descriptors. Each PC is derived as a linear combination of the original variables and is then represented as a single axis in the newly defined coordinate space.
The principal component score for different AE parameters is displayed in Table 2. Notably, there is a strong correlation between the three PCs and AE parameters. PC1 shows a positive correlation with count and a negative correlation with energy, with no significant correlation with AF and RMS. The results show that PC1 can reliably indicate count and energy. PC2 displays a positive correlation with AF and a negative correlation with RMS, while it shows weaker correlations with count and energy. Therefore, PC2 effectively characterizes AF and RMS. Furthermore, PC3 exhibits a significant positive correlation with AF and RMS, while no correlation with count and energy. This allows PC3 to serve as a descriptor for AF and RMS. In summary, the PCA method proves effective in reducing data dimensionality by eliminating redundant information while retaining the distinctive attributes of the original AE signal.
Principal component score for different AE parameters.
Unsupervised clustering and cluster quality
The clustering of mixture models requires the utilization of criteria to determine the optimal number of clusters. To achieve this, the Bayesian information criterion (BIC) and the Akaike information criterion (AIC) are employed to evaluate clustering performance. These criteria provide quantitative measures for achieving a balance between model complexity and goodness of fit (Ramasso et al., 2022). The optimal number of clusters can be determined by evaluating changes in BIC and AIC values. In the context of cluster analysis, lower BIC and AIC values typically indicate greater similarity among data points within the cluster, whereas higher values indicate the potential misclassification of certain data points into incorrect clusters. The computation of BIC and AIC values is based on equations (12) and (13), respectively.


The relationship between the cluster number of specimens and their corresponding BIC and AIC values is depicted in Figure 3(a) to (c). BIC and AIC values decrease gradually with the increase of the number of clusters, reaching a global minimum for optimal clustering accuracy. Notably, the rate of decline in both BIC and AIC values slows significantly beyond three clusters, consistently exhibiting an “elbow” shape across various specimens. This implies that clustering performance no longer experiences significant improvement when the number of clusters exceeds three. Therefore, the optimal number of clusters was set to three to achieve satisfactory separation of AE signals.
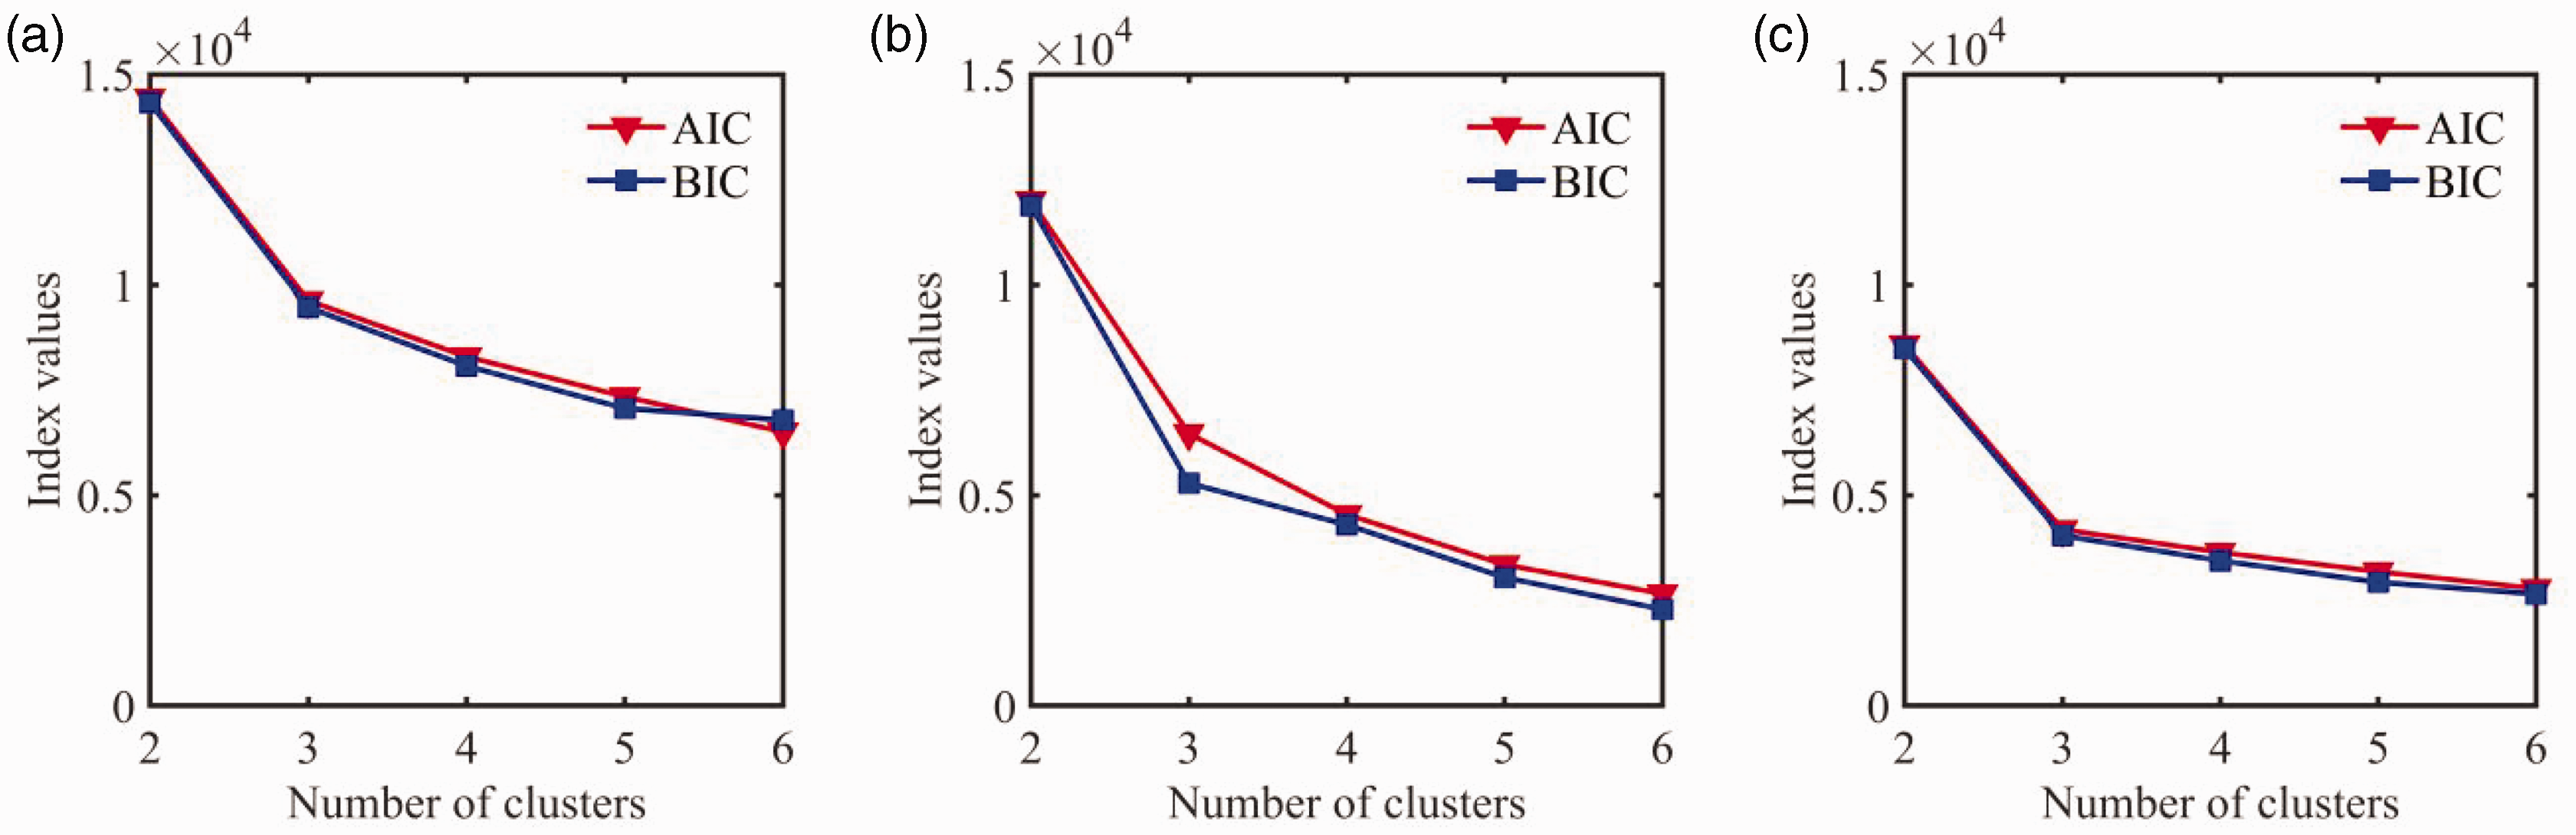
Index values of each model number at different specimens: (a) S1, (b) S2 and (c) S3.
The clustering of AE signals by GMM are presented in Figure 4(a) to (c). These clusters display distinct separation, corresponding to various damage modes of concrete under uniaxial compression. The clear boundaries among clusters are clear, which is helpful to distinguish the different AE signals of concrete damage. It is well known that the strength of the concrete matrix primarily relies on the internal friction among coarse aggregates, while the adhesion effect between cement and aggregates playing a secondary role (Ahmed et al., 2023). Consequently, there are three potential damage mechanisms in the process of concrete compression evolution: micro-cracks, mixed cracks and friction. Each damage mechanism exhibits unique characteristics in AE signals.
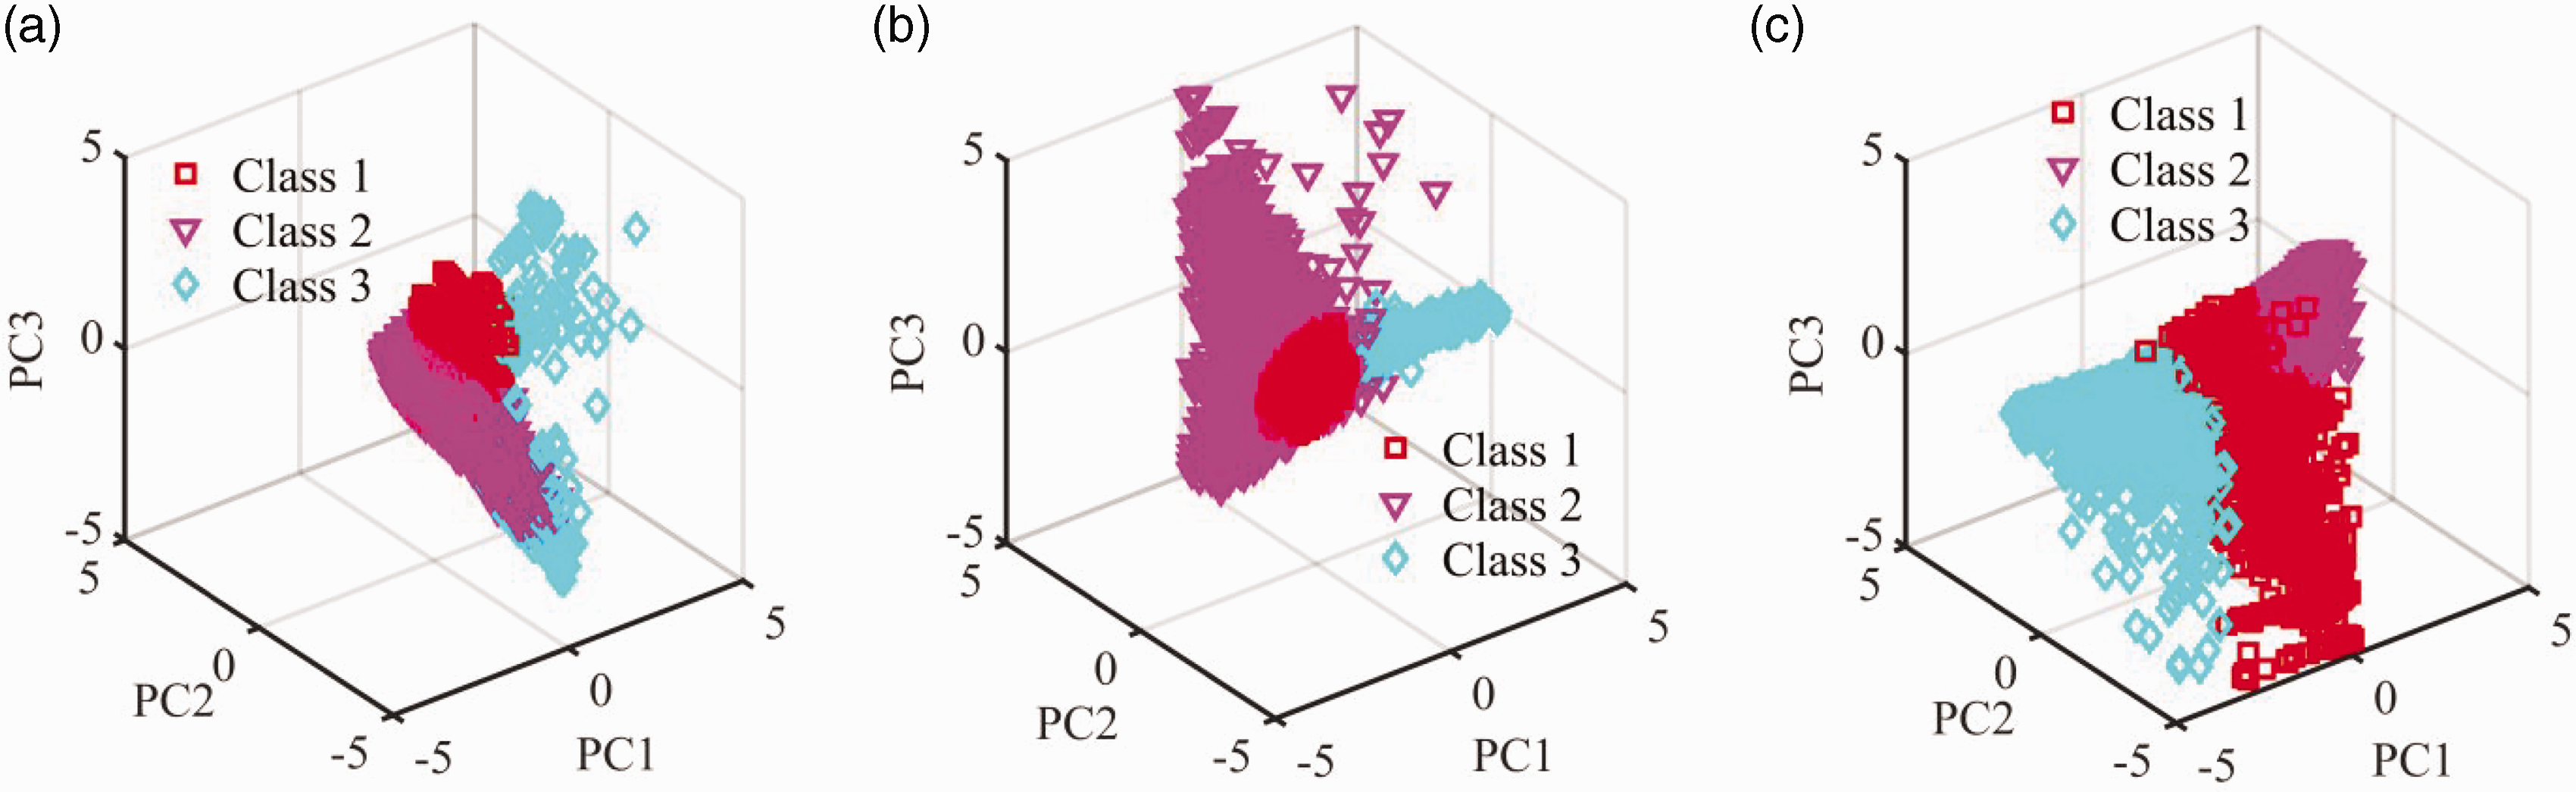
The clustering of AE signals by GMM at different specimens: (a) S1, (b) S2 and (c) S3.
Wavelet analysis of clustered AE signals
The amplitude and peak frequency of AE signals at different specimens are presented in Table 3. Notably, the distribution ranges and mean values of AE amplitude in cluster 1 and cluster 2 are similar, indicating that these two clusters share the same damage mechanism. In terms of frequency, cluster 1 exhibits a high peak frequency, which is related to micro-cracks. Cluster 2 displays a low peak frequency, representing a combination of tensile and shear cracks. In contrast, cluster 3 exhibits significantly higher amplitude than both cluster 1 and cluster 2, attributed to friction between the specimen and the loading instrument. The magnitude of AE events reflects the severity of concrete damage, while the proportion of AE signals remains consistent in three specimens. It is evident that the number of signals in cluster 2 has the largest proportion, while the number of signals in cluster 3 has the smallest proportion. By analyzing the amplitude range related to the characteristics of the damage mechanisms, it can be concluded that non-crack failures generate higher magnitude signals compared to crack failures. Therefore, the AE signals related to the damage mechanisms can be distinguished effectively by using the GMM clustering with multi-feature AE.
Clustering boundary and the percentage of AE events at different specimens.
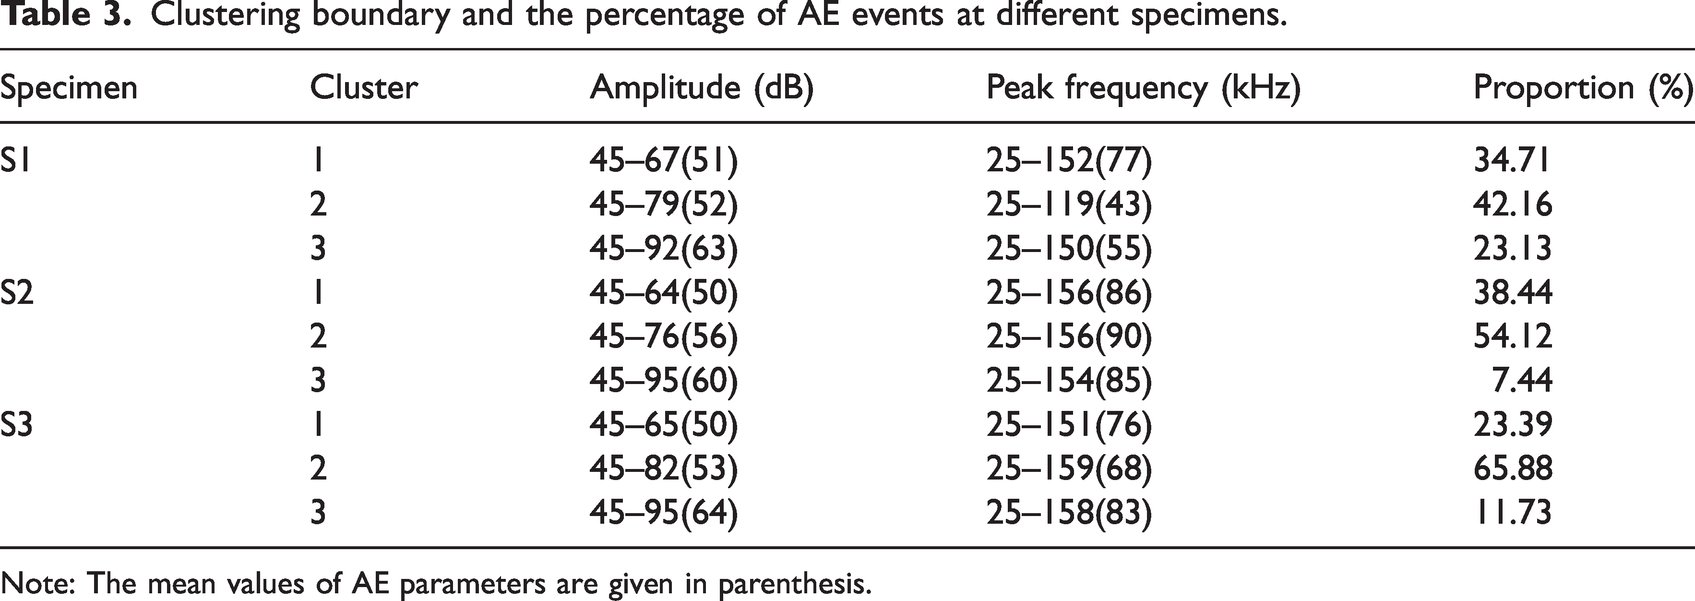
Note: The mean values of AE parameters are given in parenthesis.
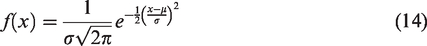
A frequency distribution of the AE hits amplitude for each cluster was established to identify the damage modes. The statistical Laplace-Gaussian model was employed to fit the hits amplitude of different clusters, as discussed in Ref. (Saliba et al., 2014). The Laplace-Gaussian model can be expressed as follows:
As shown in Figure 5(a) to (c), the AE hits amplitude distribution in each cluster is significantly different. Cluster 1 exhibits an average amplitude of 50 dB, ranging from 45 dB to 65 dB, which is related to micro-cracks in the matrix. Cluster 2 displays an average amplitude of 55 dB, with a range of 45 to 80 dB, indicating the presence of mixed cracks. In contrast, cluster 3 features an average amplitude of 63 dB, with a range extending from 45 dB to 95 dB, and is related to friction signals generated between the specimen and the pressure plates.
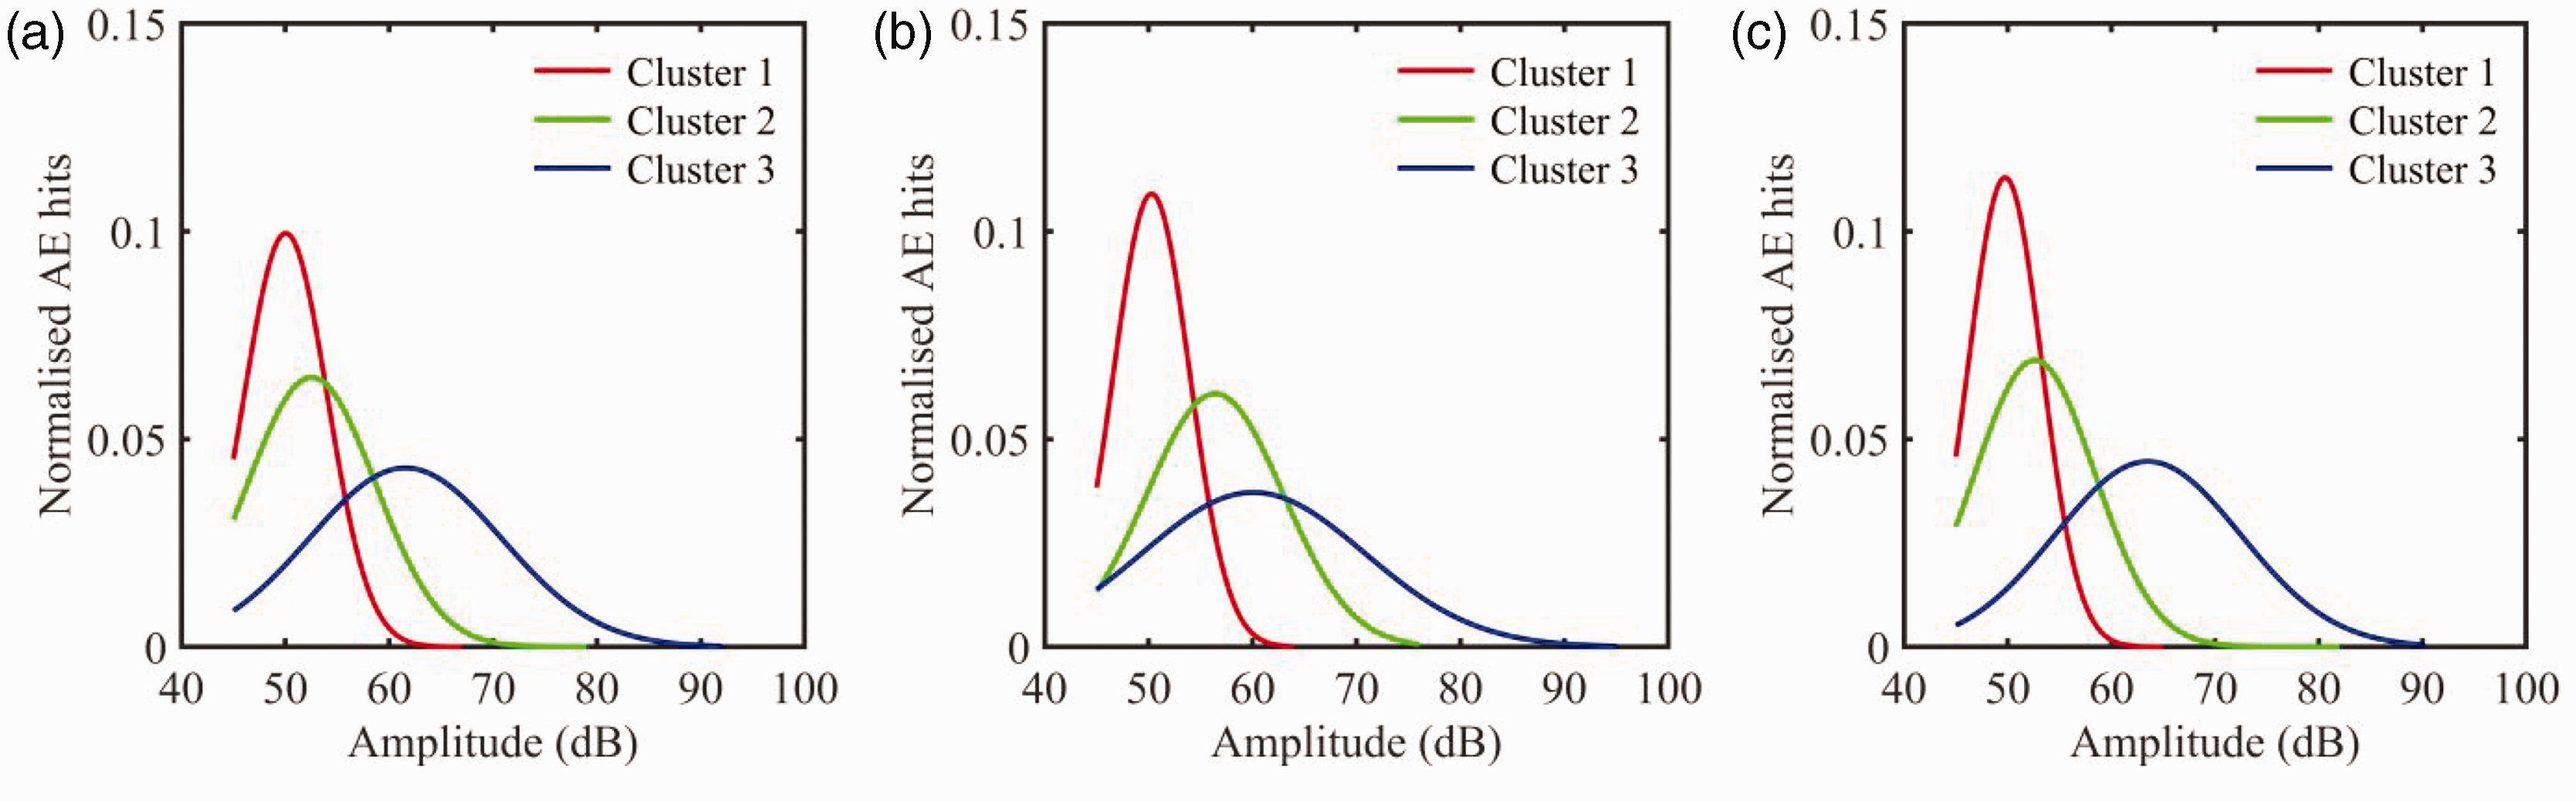
Statistical distributions of AE hits amplitude for each cluster fitted by the Laplace-Gaussian model: (a) S1, (b) S2 and (c) S3.
The validation of waveform signals associated with concrete damage within each cluster is essential. Signal-based analysis emphasizes waveforms over a limited set of parameters, providing a comprehensive approach to identify AE sources. This approach enables the validation of correlations between the number of AE hits and the quantity of cracks, as well as the relationship between AE energy and the magnitude of crack events (Moradian et al., 2016). Furthermore, the utilization of frequency spectrum analysis of AE waveforms has become a widely employed method for confirming the damage mechanisms of concrete (Saha and Sagar, 2021).
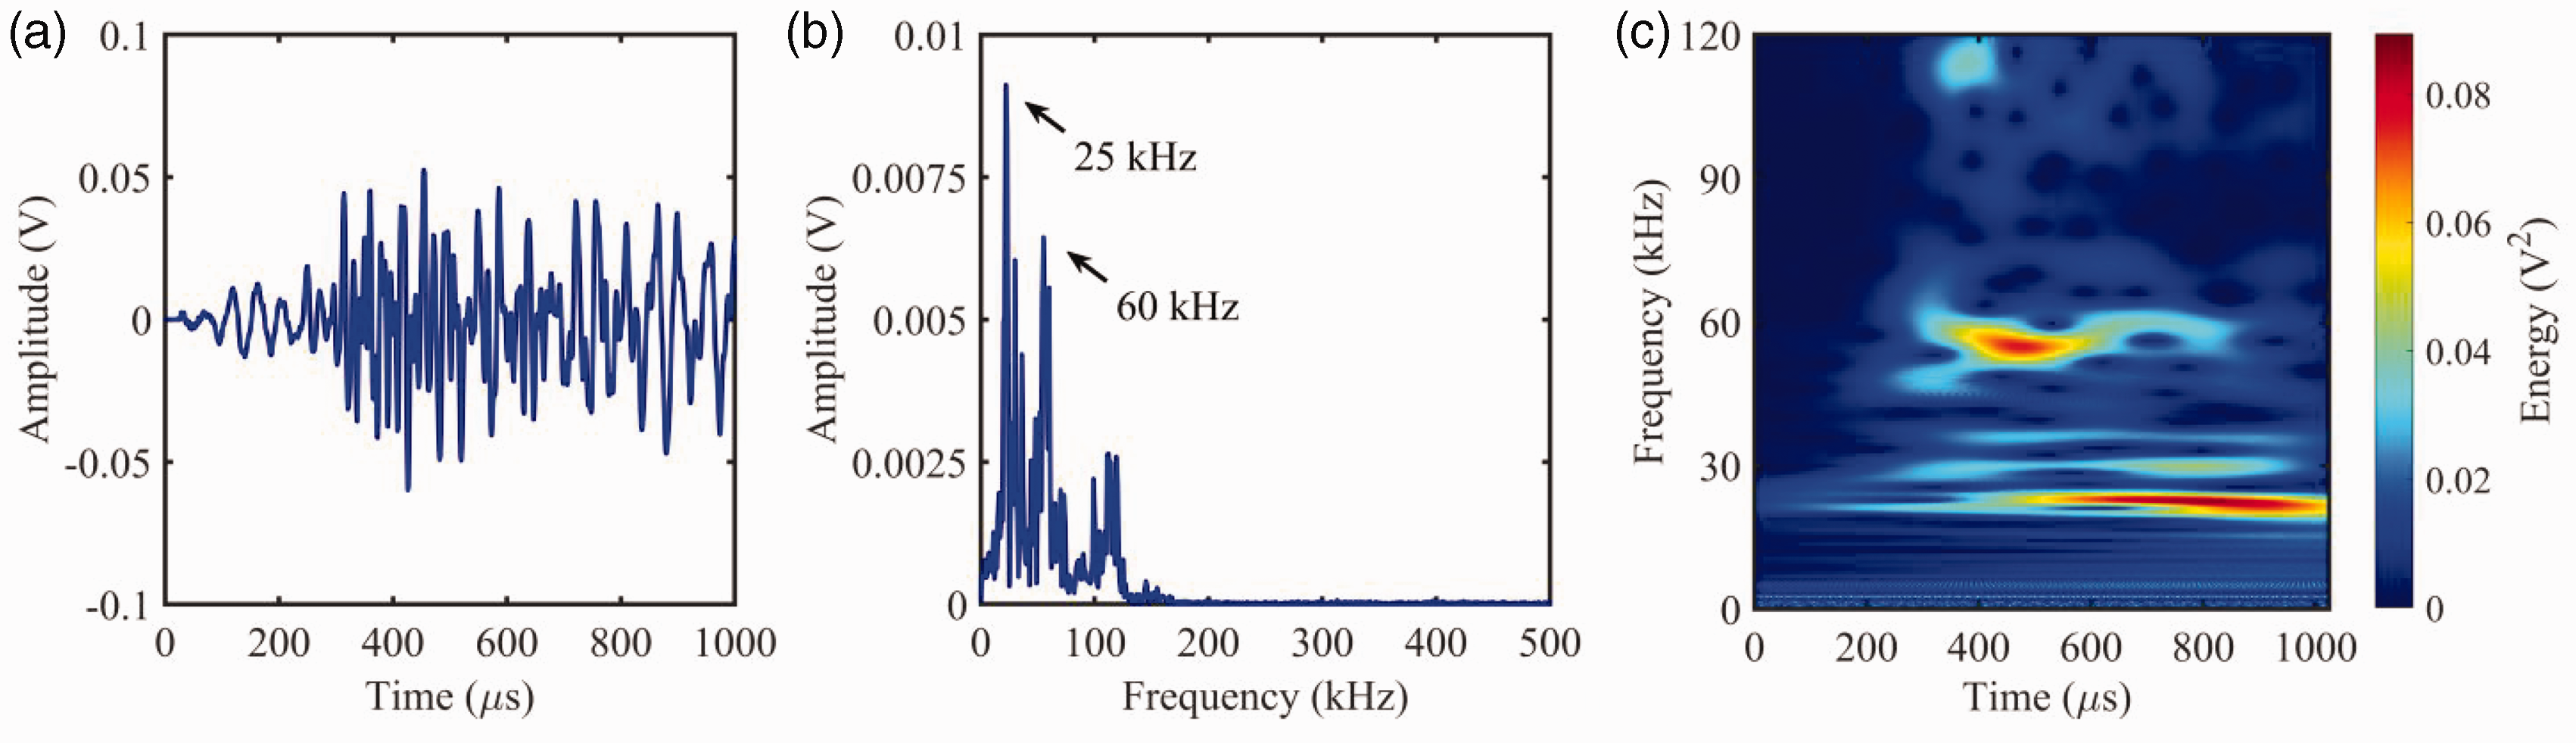
Detailed information regarding AE waveforms in the frequency domain and time-frequency domain can be obtained through the application of FFT and CWT (Zitto et al., 2015). The waveform signals in each cluster are illustrated in Figures 6(a), 7(a) and 8(a). Additionally, the frequency domain diagrams of these waveforms associated with concrete damage in each cluster are presented in Figures 6(b), 7(b) and 8(b). Notably, AE signal characteristics of each damage mechanism exhibit significant differences. Cluster 1 exhibits a low frequency of 25 kHz, related to micro-cracks. Cluster 2 displays two peak frequencies related to mixed cracks. The primary dominant frequency is concentrated at 25 kHz, while the secondary dominant frequency is concentrated at 60 kHz. Cluster 3 exhibits high-frequency signals of 120 kHz, related to friction. Furthermore, the time-frequency distribution of the waveforms associated with concrete damage in each cluster is presented in Figures 6(c), 7(c) and 8(c). Cluster 1 has lower frequency bands ranging from 20 kHz to 30 kHz. The frequency distribution of cluster 2 ranges from 20 kHz to 65 kHz. In contrast, cluster 3 contains higher frequency components within the ranges of 100 kHz to 120 kHz. In conclusion, both frequency domain and time-frequency domain analysis enable the quantitative verification of distinctive damage characteristics at different types of concrete.
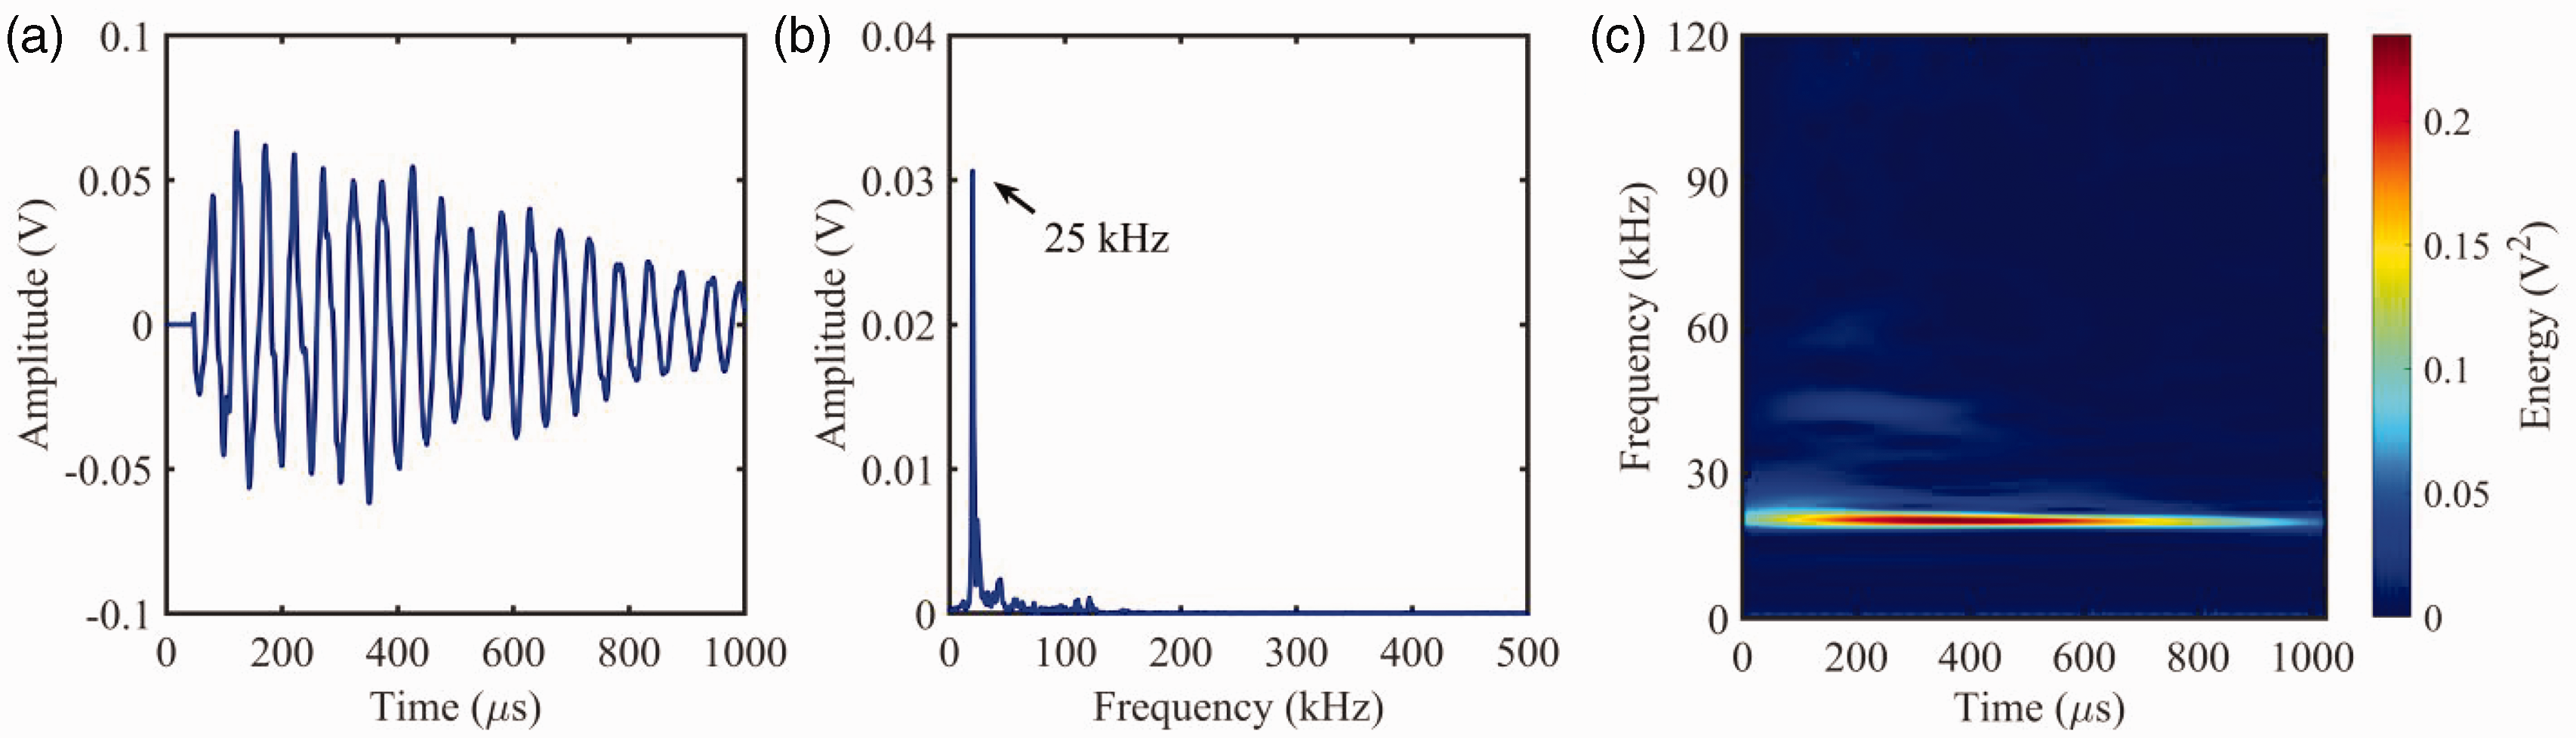
AE signal corresponding to micro-cracks of concrete: (a) waveform, (b) frequency domain and (c) time-frequency.
AE signal corresponding to mixed cracks of concrete: (a) waveform, (b) frequency domain and (c) time-frequency.
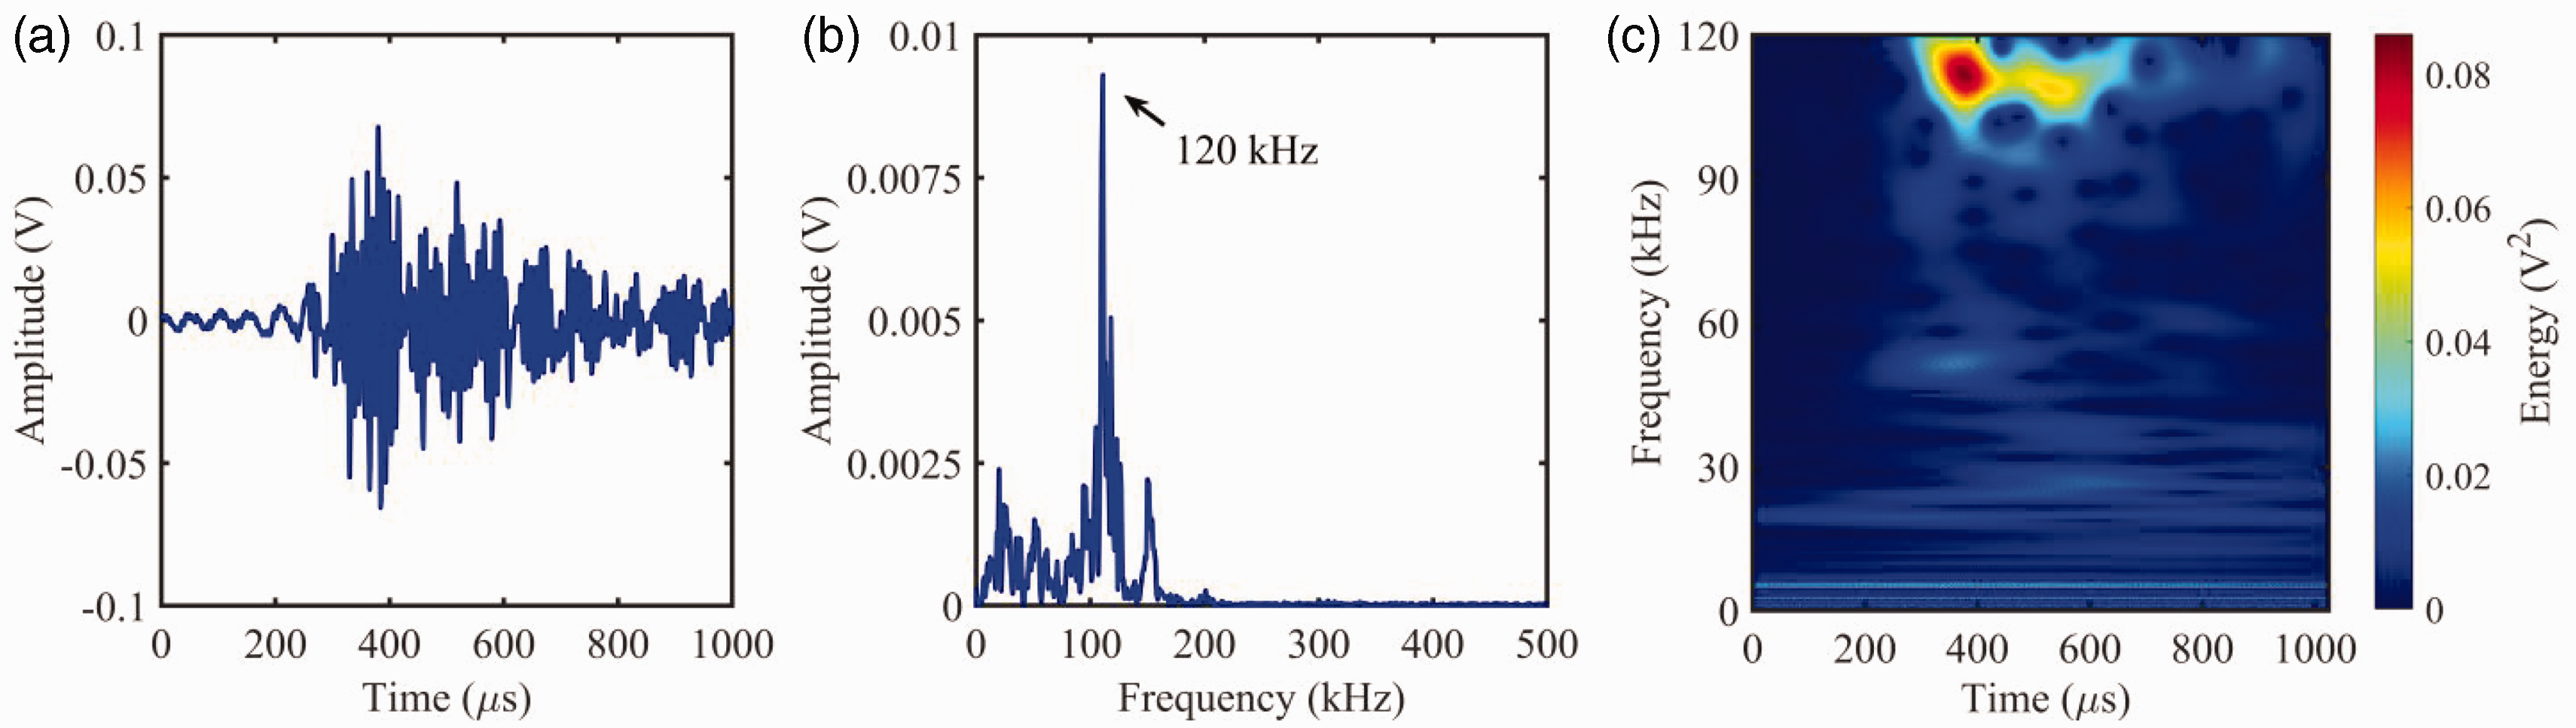
AE signal corresponding to friction of concrete: (a) waveform, (b) frequency domain and (c) time-frequency.
Damage evaluation process division based on characteristic of AE parameters
The evolution of concrete damage can be effectively characterized through the analysis of AE energy. The cumulative energy curves for the three damage modes are rendered in Figure 9(a) to (c). The mechanical properties of concrete are closely related to its mixture ratio. The compressive strengths of concrete specimens present a decreasing trend with increasing w/c ratios. Notably, the trend of cumulative energy curve exhibits consistency with stress curves in different specimens. The damage process of concrete under uniaxial compression is divided into three stages based on the variation of cumulative energy stress curves during the whole compression process: the initial compaction stage, the crack formation stage and the failure stage. In the initial compaction stage, the cumulative energy curves for different damage modes exhibit minimal growth, primarily due to the relatively dormant period of AE activity. In the crack formation stage, the strain energy within the concrete increases as shear and tensile cracks propagate, leading to a linear increase in the cumulative energy curve. As these cracks penetrate the aggregate and cement paste, the release of strain energy results in a sudden upsurge in the cumulative energy curve. The failure stage is characterized by friction signals generated between the specimen and the pressure plates of the loading machine. The energy released due to the sliding of the aggregate-mortar interface accelerates the cumulative energy. In conclusion, the variation in the cumulative energy curve closely related to the damage modes of concrete under uniaxial compression. The inflection points on the cumulative energy curve provide reliable markers for the classification of concrete damage. This approach offers a quantitative means to delineate the process of concrete damage evaluation.
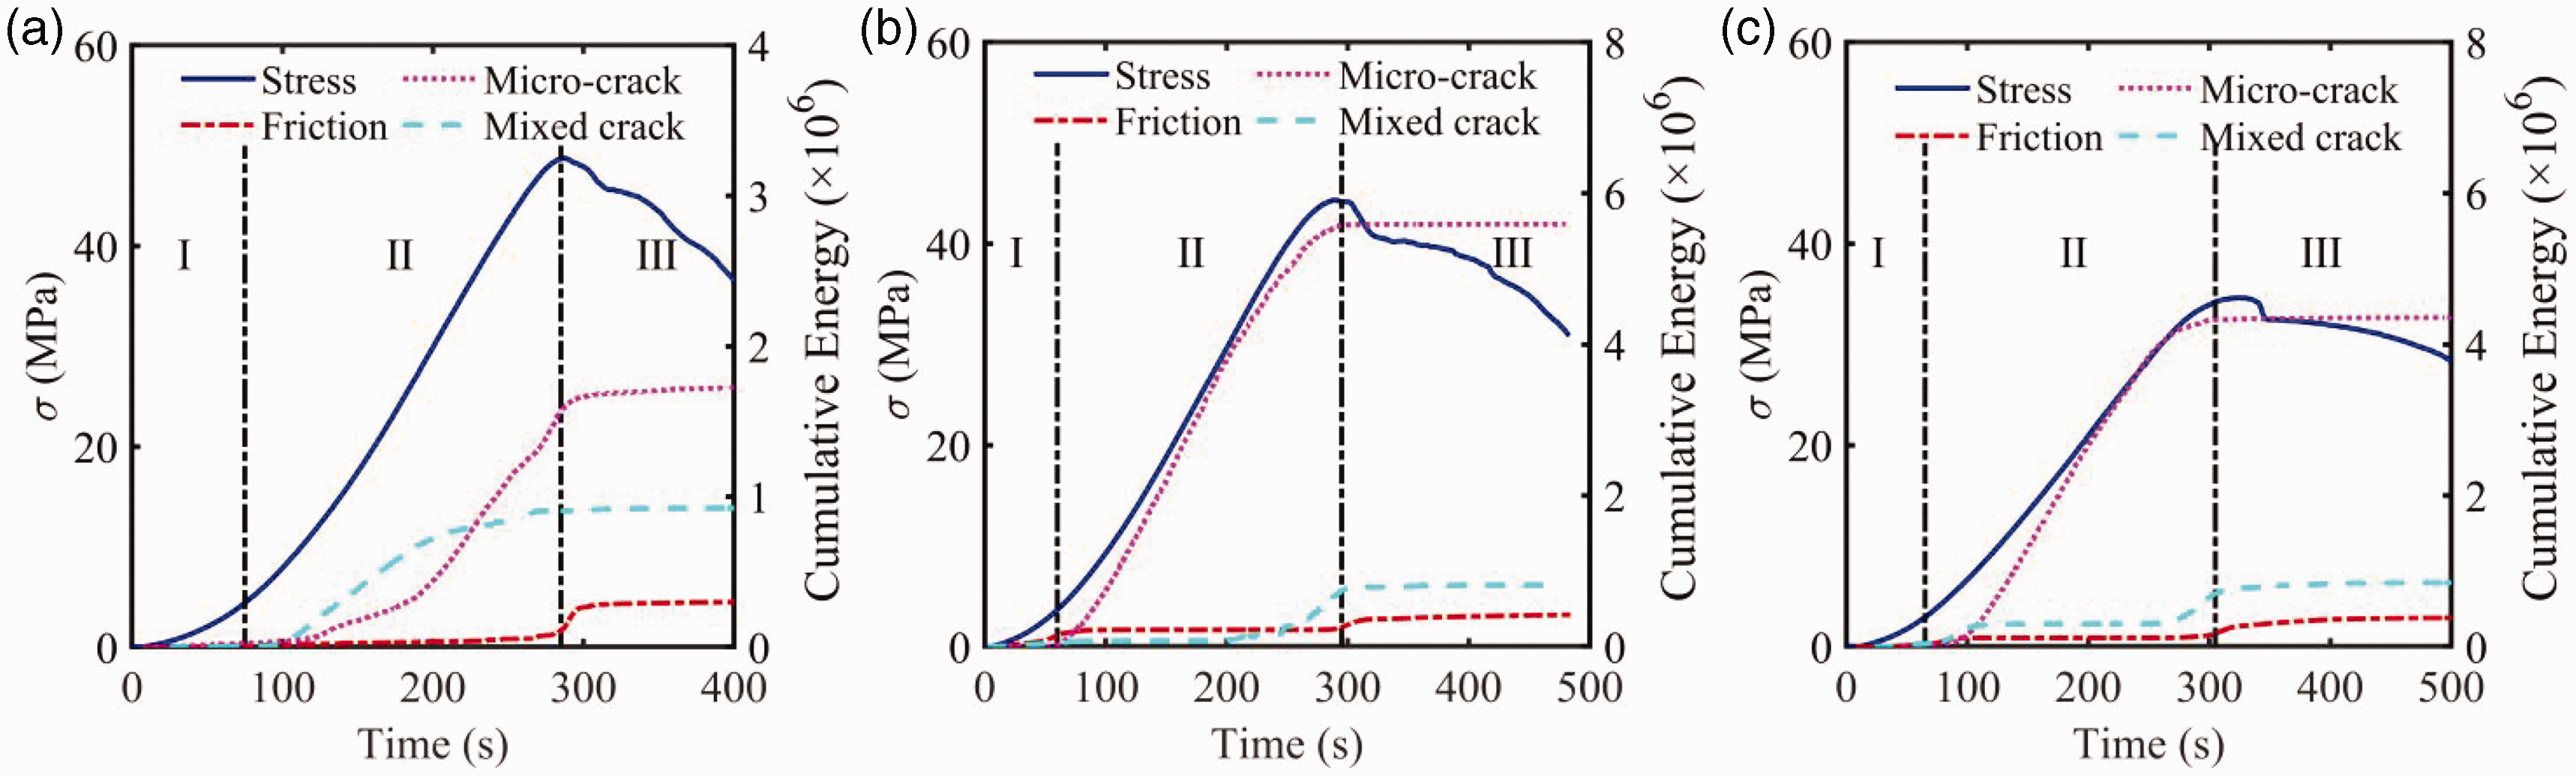
Evolution of cumulative energy and stress versus time at different specimens: (a) S1, (b) S2 and (c) S3.
The damage observed in concrete under load primarily results from the initiation and propagation of micro-cracks at the interface between the aggregate and cement slurry within the matrix (Bai et al., 2022). The cracks and deformation of specimens are depicted in Figure 10(a) to (c), revealing the significant damage characteristics of concrete across different stages. During the initial compaction stage, no visible cracks appear on the surface of the specimens. The presence of initial cracks and voids contributes to the development of micro-cracks within the concrete. During the crack formation stage, the specimen undergoes deformation upon reaching the initial crack load, and the emergence and expansion of tensile cracks on the concrete surface signify the onset of concrete failure. In the failure stage, the specimen experiences substantial deformation, resulting in a significant area collapse. Tensile and shear cracks intersect within the specimen, culminating in the failure of the concrete. It becomes evident that the divided concrete damage stages using this method align with the actual process of damage evolution.
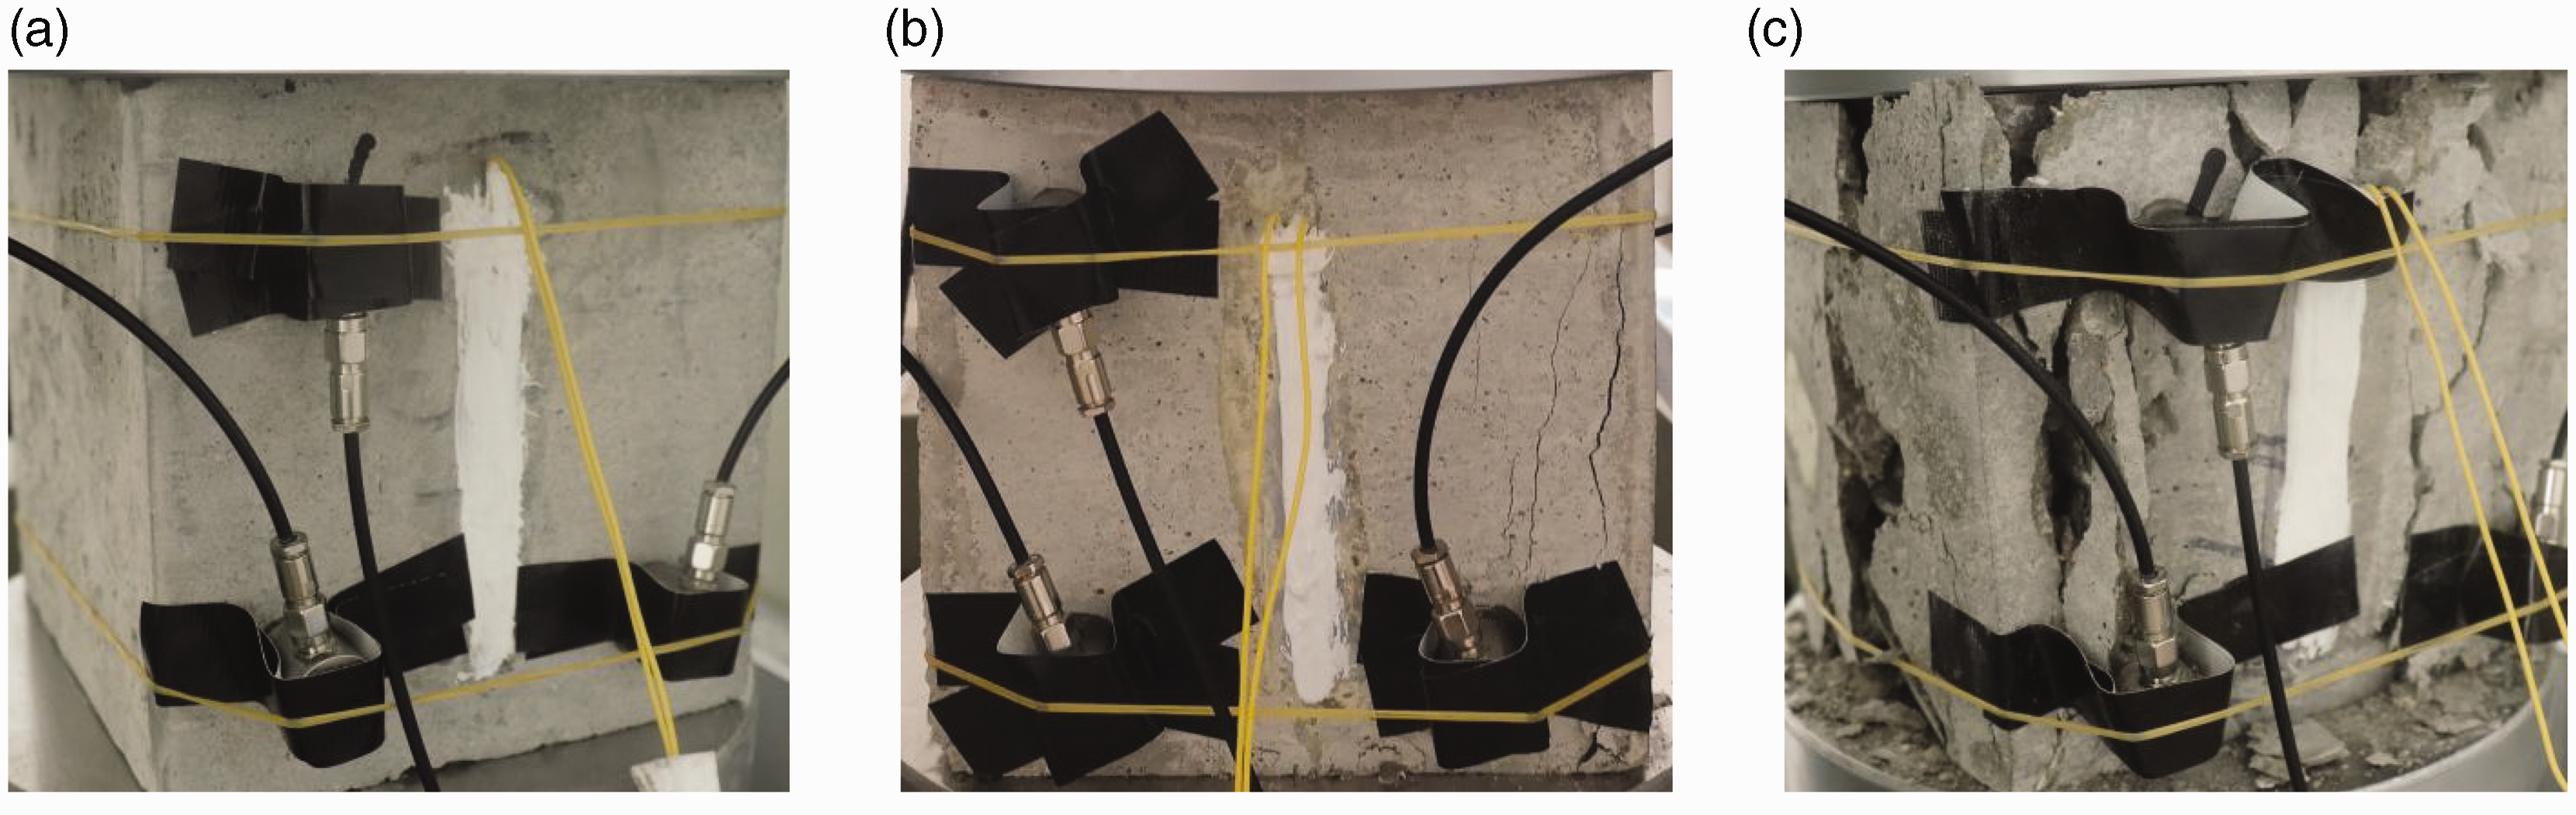
Cracks and deformation of concrete at different stages: (a) the initial compaction stage, (b) the crack formation stage and (c) the failure stage.
Performance comparison of traditional AE analysis
The efficacy of classifying concrete damage modes is assessed through a comparative analysis involving traditional AE parameters-based clustering, parameter analysis and b-value analysis. Different categories of damage signals are classified by employing two AE parameters as input features for GMM clustering. The progression of concrete damage stages during compression is described through parameter-based analysis and b-value analysis.
The b-value originally derived from seismological applications in accordance with the Gutenberg-Richter law (GBR), serves as a quantitative tool for characterizing the relationship between the frequency of AE signals and their corresponding amplitude (Kurz et al., 2006). The b-value as a valuable indicator for assessing crack propagation, enabling it a measure of crack growth scale in the analysis of the crack evolution process (Shi et al., 2023). The classification of the evolution process of concrete becomes feasible by employing the qualitative measurement of crack scale through the b-value analysis. The formula for calculating the b-value is as follows:

In this research, a dataset composed of RA and AF is constructed, and the data points are classified based on the GMM algorithm. As presented in Figure 11(a) to (c), AE signals are distinctly divided into two categories. Following the JCMS-III B5706 code (Ashraf et al., 2023), data points along the x-axis represent shear cracks, while those along the y-axis as tensile cracks. The distribution of these cracks in different specimens is notably distinct. However, concrete failure is dominated by shear cracks. With the increase of w/c ratios, the distribution proportion of shear cracks increases during the compression process of specimens, indicating that the increase in specimen strength leads to more shear cracks.
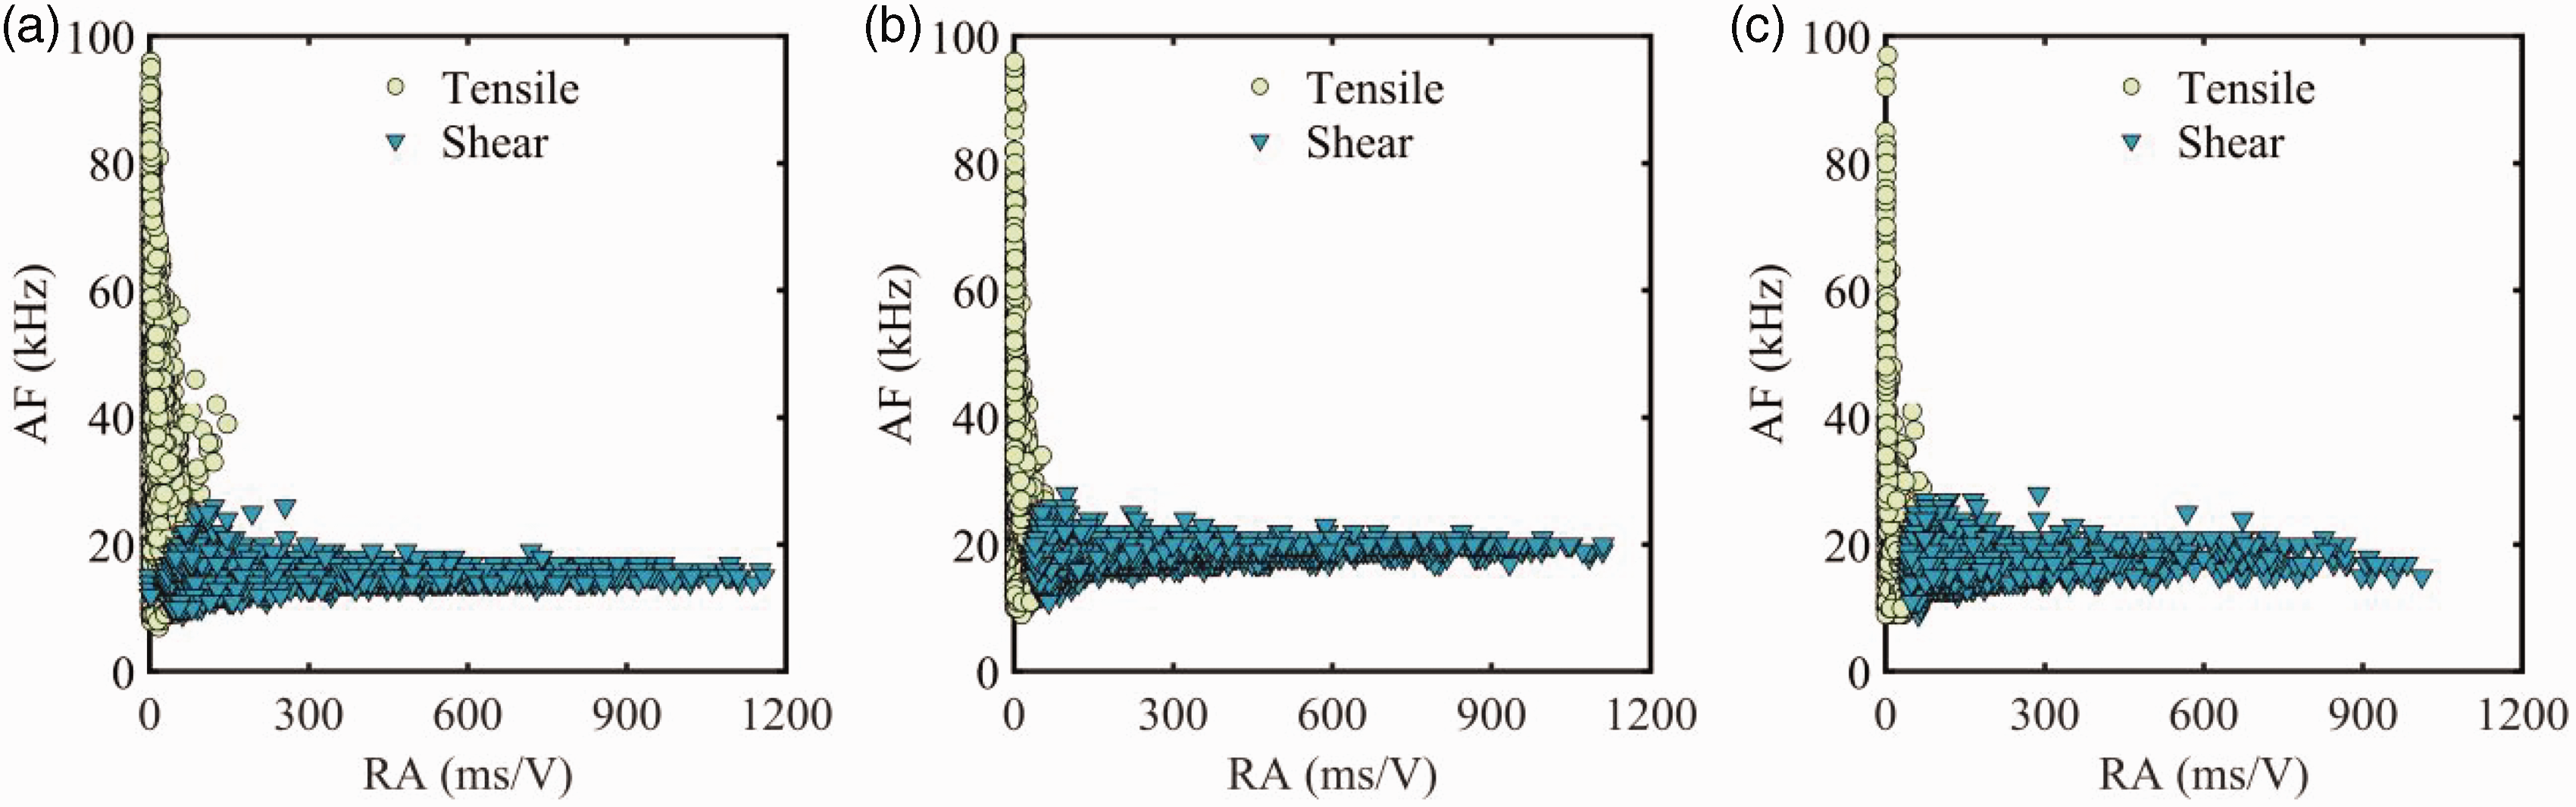
GMM clustering results separated by RA and AF: (a) S1, (b) S2 and (c) S3.
The elastic energy released during an AE event is recognized as AE energy. Moreover, AE count serves as an indicator of the intensity of AE event. Temporal changes in cumulative energy and count are depicted in Figure 12(a) to (c). In the initial compaction stage, fluctuations in the count value become apparent as stress increases, primarily due to the release of strain energy. During the crack formation stage, the cumulative energy curve exhibits a linear increase that aligns with the stress curve, attributed to the compression of initial voids. The count gradually decreases at the end of this stage with the increases of stress, due to the plastic deformation of concrete. Upon nearing the peak stress, the count experiences significant fluctuations, due to the propagation of both macro-cracks and micro-cracks. At the peak stress of the specimen, there is a rapid decrease in the count, correlating with the fracture of the concrete matrix. In the failure stage, the cumulative energy curve tends to stabilize, reflecting the diminishment of strain energy release. The effect of the w/c ratio on the damage mode is revealed through an analysis of AE characteristic parameters. A positive correlation between the w/c ratio and cumulative energy is observed. The cumulative energy increases with an increase in the w/c ratio during the failure stage. Concrete specimens with a higher w/c ratio are generally weaker in plastic deformation, leading to earlier failure. Moreover, a higher w/c ratio implies higher porosity, resulting in more pronounced stress concentration and facilitating crack generation. Therefore, higher AE hits are detected. The increase in AE counts is more significant for high w/c ratio concrete compared to low one. Specimens with higher strength generate a few AE hits at a low stress level, but more AE counts are generated in the entire damage process. The AE count of other channels of each specimen can be found in Appendix I. It is important to note that while the damage evolution of concrete can be roughly categorized based on the evolution law of AE parameters, the distinguish between damage behavior and noise remains a challenge. Therefore, to establish a close relationship between the AE response and the damage behavior of concrete, it is essential to investigate AE signals with specific mechanisms.
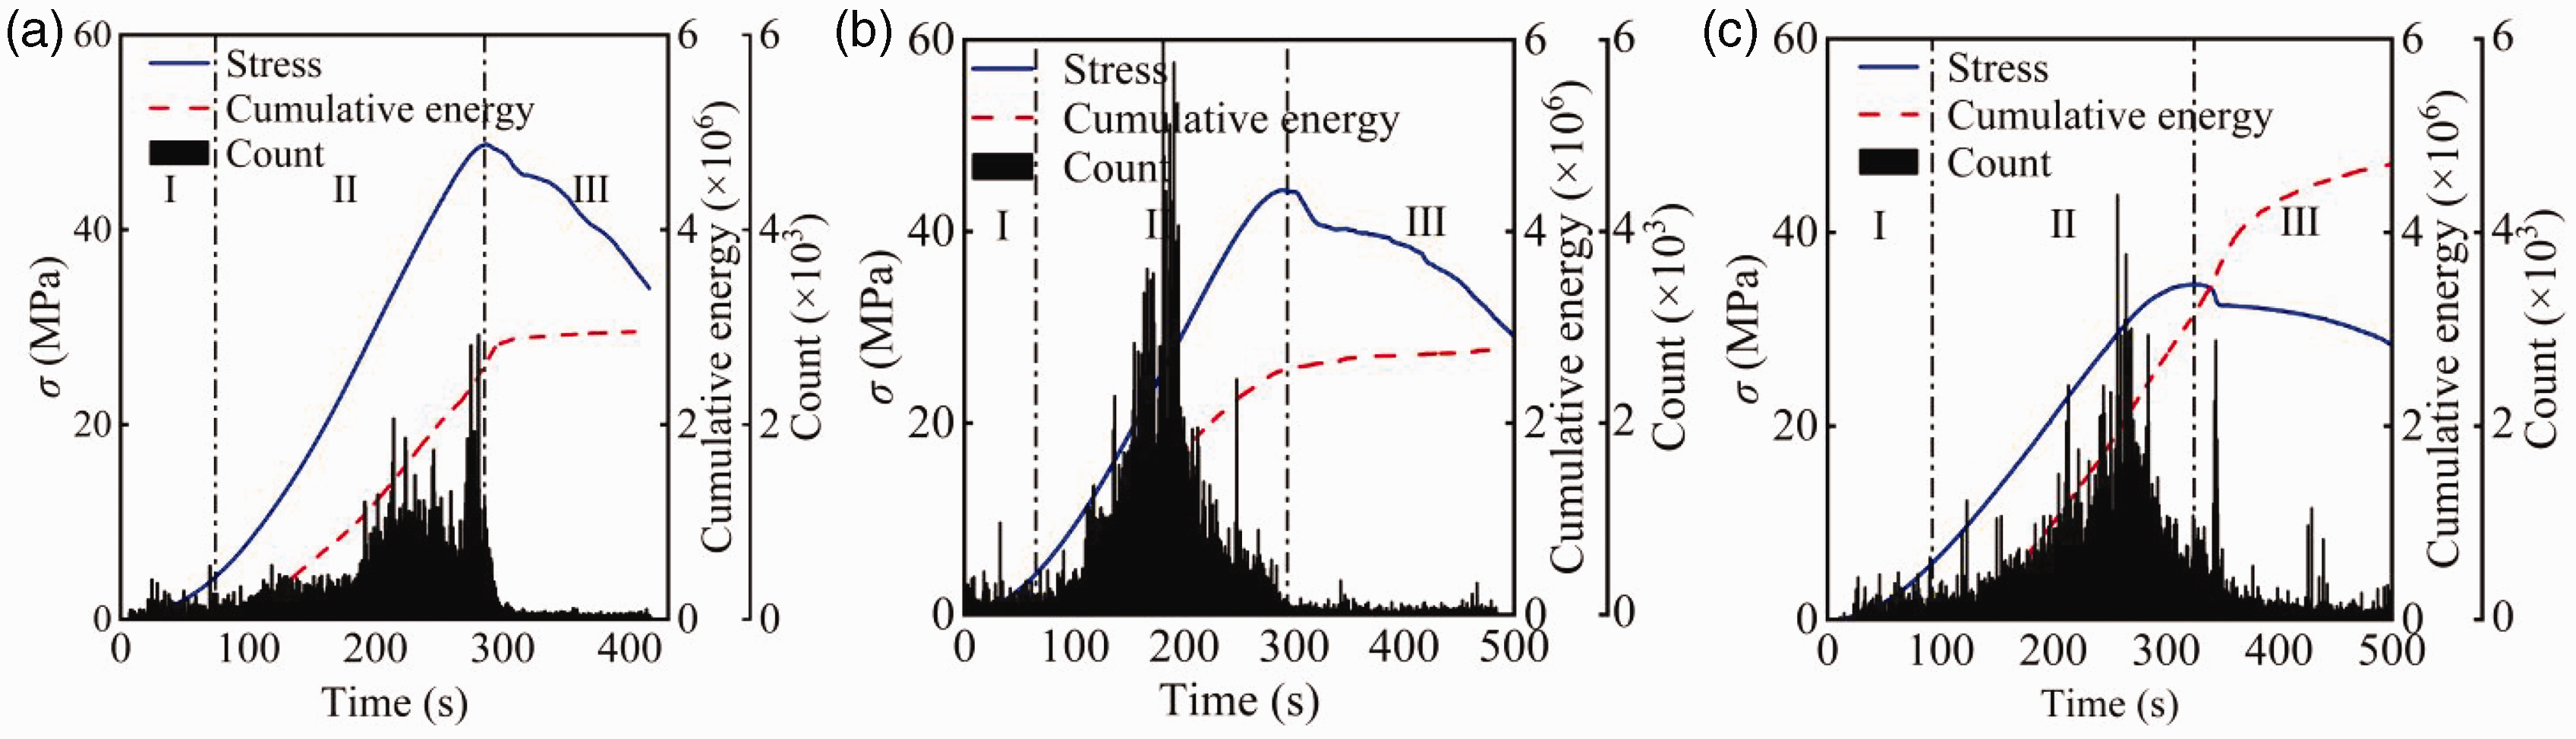
Stress-cumulative energy-count versus time at different specimens: (a) S1, (b) S2 and (c) S3.
The variation of the b-value with stress across different specimens is depicted in Figure 13(a) to (c). It is worth noting that a low b-value may signify crack initiation, while a high b-value may be related to crack propagation and sliding. The damage process is divided into three stages based on the inflection points observed in the b-value curves. In the initial compaction stage, a significant increase in the b-value is observed, which can be attributed to the compression of initial voids. As these voids gradually close, the b-value experiences a gradual decrease, corresponding to a reduction in the number of AE events. During the crack formation stage, the b-value oscillates within a narrow range due to the elastoplastic deformation of concrete, indicating a relatively stable progression of damage. As the specimen approaches its peak stress, the extension of tensile and shear cracks triggers a sharp increase in the b-value. In the failure stage, substantial fluctuations in the b-value occur, corresponding to the sporadic appearance of both macro-cracks and micro-cracks. However, it is important to acknowledge that there are certain limitations in b-value analysis. For instance, the lack of a uniform threshold may lead to an overly subjective assessment of the severity of damage. Additionally, the calculation of the b-value depends on the AE amplitude and is susceptible to outliers, leading to an inaccurate division of stages.
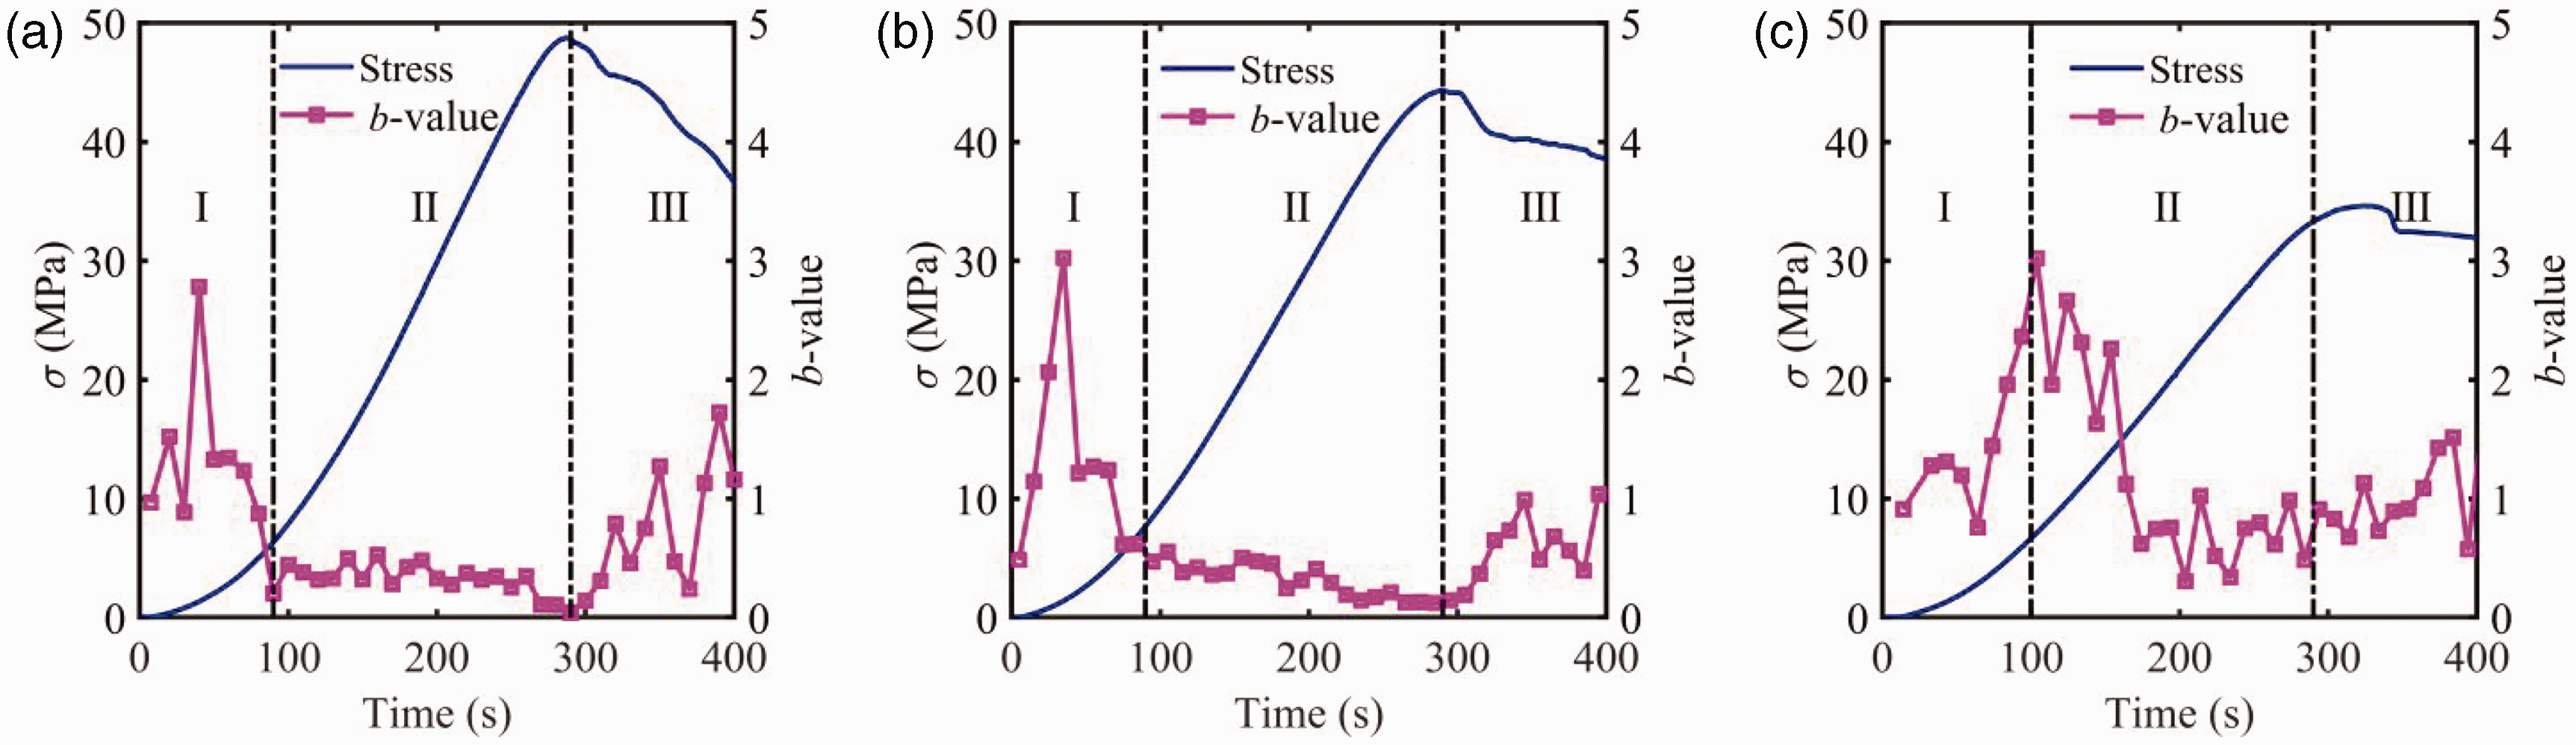
The variation of b-value with stress at different specimens: (a) S1, (b) S2 and (c) S3.
Conclusions
In this study, a novel method for damage evolution analysis of concrete is presented based on the Gaussian mixture model (GMM) clustering and the multi-feature acoustic emission (AE). The objective of this analysis is to provide a more accurate estimation of the damage evolution of concrete under uniaxial compression. The main conclusions are as follows:
The proposed multi-feature AE clustering method effectively discriminates AE signals related to different damage mechanisms. Non-crack failures produce higher magnitude AE signals compared to crack failures. Specifically, the AE amplitude for micro-cracks, mixed cracks and friction in concrete ranges from 45–65 dB, 45–80 dB and 45–95 dB, respectively. The characteristics of AE signals were verified through both the Fast Fourier transform (FFT) and the continuous wavelet transform (CWT). The frequency of the AE signal is associated with different damage behaviors in concrete. Specifically, the frequency ranges for micro-cracks, mixed cracks and friction in concrete are 20–30 kHz, 20–65 kHz and 100–120 kHz, respectively. The combination of frequency domain and time-frequency domain analysis allows for the quantitative verification of the characteristics associated with different types of concrete damage. There is a clear correlation between the stress curve and the cumulative energy curve of concrete. The inflection points on the cumulative energy curve are associated with changes in damage evolution. The damage process of concrete under uniaxial compression can be divided into three stages: the initial compaction stage, the crack formation stage and the failure stage. The optimal AE parameters were selected using the hierarchical clustering algorithm. Additionally, low-dimensional AE features were obtained through the principal component analysis (PCA). Three principal components (PCs) exhibit strong correlations with the original AE parameters, and these parameters are suitable as input features for clustering.
Footnotes
Declaration of conflicting interests
The author(s) declared no potential conflicts of interest with respect to the research, authorship, and/or publication of this article.
Funding
The author(s) disclosed receipt of the following financial support for the research, authorship, and/or publication of this article: The authors acknowledge the financial support provided by the National Natural Science Foundation of China (Grant Nos. 52278162 and 62266005), the Guangxi Science Fund for Distinguished Young Scholars (2019GXNSFFA245004), the Guangxi Key Research and Development Project (GKAB23026026), the Guangxi Science and Technology Major Project (GKAA23023018), the 111 Project (D23021) and the Innovation Project of Guangxi Graduate Education (YCSW2022046).
Appendix 1
The AE counts from other sensors were presented in Figures 14 to 16.