
Abstract
Higher-order theories have a broad range of successful applications but also suffer from localization instability and mesh-size dependency when modeling quasi-brittle materials such as concrete with strain-softening behavior. To overcome the above difficulties, this paper proposes a fracture energy regularization method with a unified, consistent crack bandwidth specifically tailored for higher-order beam theories. The Carrera unified formulation (CUF) is applied to develop scalable structural theories and related finite elements. To evaluate the accuracy of the new crack bandwidth, three typical experimental quasi-static benchmarks of pure concrete structures are utilized. A modified Mazars damage model with tensile and compressive softening laws is implemented in these benchmarks. The comparison between numerical and experimental results demonstrates that the proposed method can accurately determine the correct crack bandwidth and preserve the dissipated energy per unit area of a fracture surface. Moreover, this robust estimation of crack bandwidth reduces the mesh dependency in general, ensuring the high efficiency of the CUF model.
Keywords
Introduction
Quasi-brittle materials such as concrete, rock, and composites are widely applied to many engineering practices. At the microscopic level, the growth and coalescence of cracks or voids can result in a strain-softening constitutive response in these materials. Strain-softening, in which the stress decreases as the strain increases, is one of the most significant reasons that lead to localization instability. Within the continuum damage mechanics (CDM), the localization instability will lead to a high sensitivity of numerical solutions to the way the problem is discretized using finite element (FE) methods, which is observed as mesh dependency.
Over the past decades, various sophisticated remedies have been proposed to improve the objectivity of FE simulations of quasi-brittle materials. One well-known approach is the use of nonlocal models (Aifantis, 1992; Pijaudier-Cabot and Bažant, 1987). These models incorporate the states of not just the point of interest, but also its neighboring points, into a nonlocal variable. A simpler remedy is the crack band model or fractures energy regularization, proposed by Bažant and Oh (1983). This approach involves adjusting the material constitutive law by rescaling the post-peak part of the stress-strain curve in inverse proportion to the crack bandwidth once the material reaches the damage threshold. Then the area of the rescaled curve represents the fracture energy density, and the fracture energy regularization helps to preserve the dissipated fracture energy during the fracture process by the product of the crack bandwidth and fracture energy density. Without this regularization, the fracture energy would disappear as the crack bandwidth approaches zero.
The crack bandwidth is influenced by various aspects of mesh discretization, including element dimensions, element shapes (quadrilateral or triangle), interpolation functions (linear, quadratic, or cubic), integration scheme (full or reduced Gauss quadrature), and the crack or element orientation. In the past, three types of formulations have been widely used to determine the correct crack bandwidth, as partially reviewed in (Jirásek and Bauer, 2012).
The first type is taking the square root of the element area in a two-dimensional (2D) problem or cubic root of the element volume in a three-dimensional (3D) problem as the characteristic length (Arruda et al., 2022; Bažant and Oh, 1983; Shen et al., 2022a). Coefficients are sometimes added to account for the element type and integration scheme (Rots, 1988). However, this method is only accurate if the elements are squared or cubical, as recommended in (Bažant and Oh, 1983). Otherwise, incorrect energy dissipation and a non-objective softening behavior may result. To satisfy this strict requirement, the mesh may need to be very dense, leading to high computational costs in certain models (Shen et al., 2022a).
The second type of formulation is based on element projection, which can be applied to elements of arbitrary shape (Cervenka, 1995). It involves projecting the element onto a direction perpendicular to the major principal strain direction. This projection represents the distance between the two most distant element corner nodes in the crack normal direction. When the crack band is not parallel to the mesh lines, an orientation factor between 1 and 1.5 is also introduced to multiply the bandwidths obtained using this method, as described in (Cervenka, 1995). This method takes into consideration the dimensions, shape, and orientation of both the element and the crack.
The third type of crack bandwidth formulation was initially proposed by Oliver Oliver (1989) and later modified by Govindjee et al. (1995). The Oliver’s formulation calculates the crack bandwidth as the distance between the boundary edges of the element in the direction normal to the crack, while the Govindjee’s formulation is similar to the projection method. Both of these methods take into account the dimensions, shape, and orientation of the element and the crack. Building on these earlier works, He et al. (2019) developed an improved method that calculates the crack bandwidth as the distance between the most distant edge middle points in the crack direction, capable of computing both compressive and tensile crack bandwidths. However, these methods are only applicable to linear finite elements and standard Gauss quadrature. To investigate the influence of the integration scheme, Jirásek and Bauer (2012) found that strain softening may only localize on a part of the element width if a quadratic interpolation function is used, as also reported in Slobbe et al. (2013). To account for this strain localization effect caused by the numerical integration scheme and interpolation function, Slobbe et al. (2013) introduced two parameters to modify the Govindjee’s method, but this was only validated for 2D problems.
Currently, the simplicity and computational efficiency of one-dimensional (1D) theories compared to heavier 2D and 3D models are attracting more interest from researchers and engineers. Classic 1D beam models such as the Euler-Bernoulli beam model (EBBM) (Oldfather et al., 1933) or Timoshenko beam model (TBM) (Timoshenko, 1921) do not take into account the stresses and strains that act in directions other than the main axis of the beam, leading to inaccurate predictions of the behavior of the beam. To address those limitations, many advanced beam theories (Berdichevsky et al., 1992; El Fatmi and Zenzri, 2002; Silvestre and Camotim, 2002) have been put forward in the past years, including Carrera Unified Formulation (CUF) proposed by Carrera and Giunta (2010). This higher-order 1D model allows for the use of different cross-sectional expansion polynomials, such as Taylor polynomials (Carrera et al., 2013), Lagrange expansion (Pagani et al., 2021), and Jacobi polynomials (Carrera et al., 2023), to evaluate 3D displacement field. The CUF beam theory allows for the selection of the desired beam and expansion order, providing higher efficiency and lower computational costs.
So far, the beam theory based on CUF has been applied to study the vibration analysis (Carrera and Petrolo, 2012; Dan et al., 2016; Pagani et al., 2013; Shen et al., 2022b) and static behavior (Carrera et al., 2021; Shen et al., 2022b) of various structures. However, few researchers have applied the fracture energy regularization technique to CUF. Recently, the 2D CUF model was used to study the progressive damage analysis of composite structures (Nagaraj et al., 2020, 2021) and the 1D CUF model was used to study the damage analysis of concrete structures (Arruda et al., 2018; Shen et al., 2022a), where the fracture energy regularization technique was employed. All of these studies computed the crack bandwidth based on the cubic root of the element volume, but this approach is not suitable for situations with irregular meshes or arbitrary crack directions.
Therefore, it is important to improve the method for estimating the crack bandwidth for the higher-order beam theory based on CUF. The improved method should have two main features. First, it should be able to provide a reasonable crack bandwidth based on mesh characteristics and crack direction during the numerical analysis process, resulting in more objective results. Second, it should be able to handle small notches in some structures, as reported in (Shen et al., 2022a), without requiring a large number of elements. This will allow the advantages of CUF, such as higher efficiency and lower computational costs, to be utilized. For simplicity, this study will consider a simple isotropic damage model (Mazars, 1984) with one damage variable driven by the equivalent strain. Once mesh-size dependence is resolved in the isotropic damage model, it is expected that the same trend will be observed for other constitutive frameworks.
The structure of this paper is as follows: (1) The higher-order beam theory with Lagrange polynomials expansion in CUF and its finite element approximation are introduced. (2) A modified Mazars damage model that includes tensile and compressive damage evolution laws from (Arruda et al., 2022; Shen et al., 2022a) to capture the tension-compression behavior of concrete is briefly presented. (3) The crack bandwidth is discussed in detail and a new estimation method is proposed. (4) Numerical results from three experimental concrete benchmarks with notches are presented and compared to the experimental results directly. (5) Finally, some main conclusions are drawn.
Unified higher-order beam theories
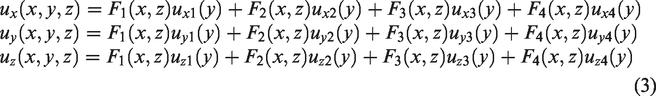
The higher-order beam theories based on CUF have a broad range of applications (Carrera et al., 2015, 2021; Petrolo et al., 2014). The 1D CUF model represents the displacement field of a structure using equation (1) and allows for the evaluation of 3D displacement fields through various cross-sectional expansions, while still maintaining the efficiency of 1D models.

The current work will utilize Lagrange interpolation polynomials as the cross-sectional expansion. This method, referred to as Lagrange expansion (LE) in CUF, effectively describes the feature of any cross-section shape through the use of isoparametric transformation of quadrilateral elements. More information on LE CUF models can be found in (Petrolo et al., 2014). For this work, three different orders or numbers of expansions from (Petrolo et al., 2014) will be used: four-point bilinear (L4), nine-point quadratic (L9), and sixteen-point cubic (L16). An example of the interpolation functions for the four-point (L4) bilinear polynomial element is shown below:

Then, the kinematic field of an L4 element can be described as:
where
The generalized displacements

From equation (4), the choice of beam elements, such as two nodes linear element (B2), three nodes quadratic element(B3), and four nodes cubic element(B4), is entirely independent of the choice of expansion functions. The governing equation for static problems derived from the Principle of Virtual Displacements (PVD) that is shown as:


For the sake of simplicity, the virtual work done by the external loads can be written as:

Finally, the governing equation can be achieved by combining equations (7), (9) and (5), which can be expressed as:

Damage model with consistent crack bandwidth
Mazars damage model
In this section, a simple class of isotropic damage models proposed by Mazars (1984) is introduced shortly, which is written in the form of the stress-strain equation:

In the framework of the Mazars damage model, only positive principal strains can make contributions to damage evolution in both tension and compression. As illustrated in Figure 1, when the concrete is subjected to compression strain
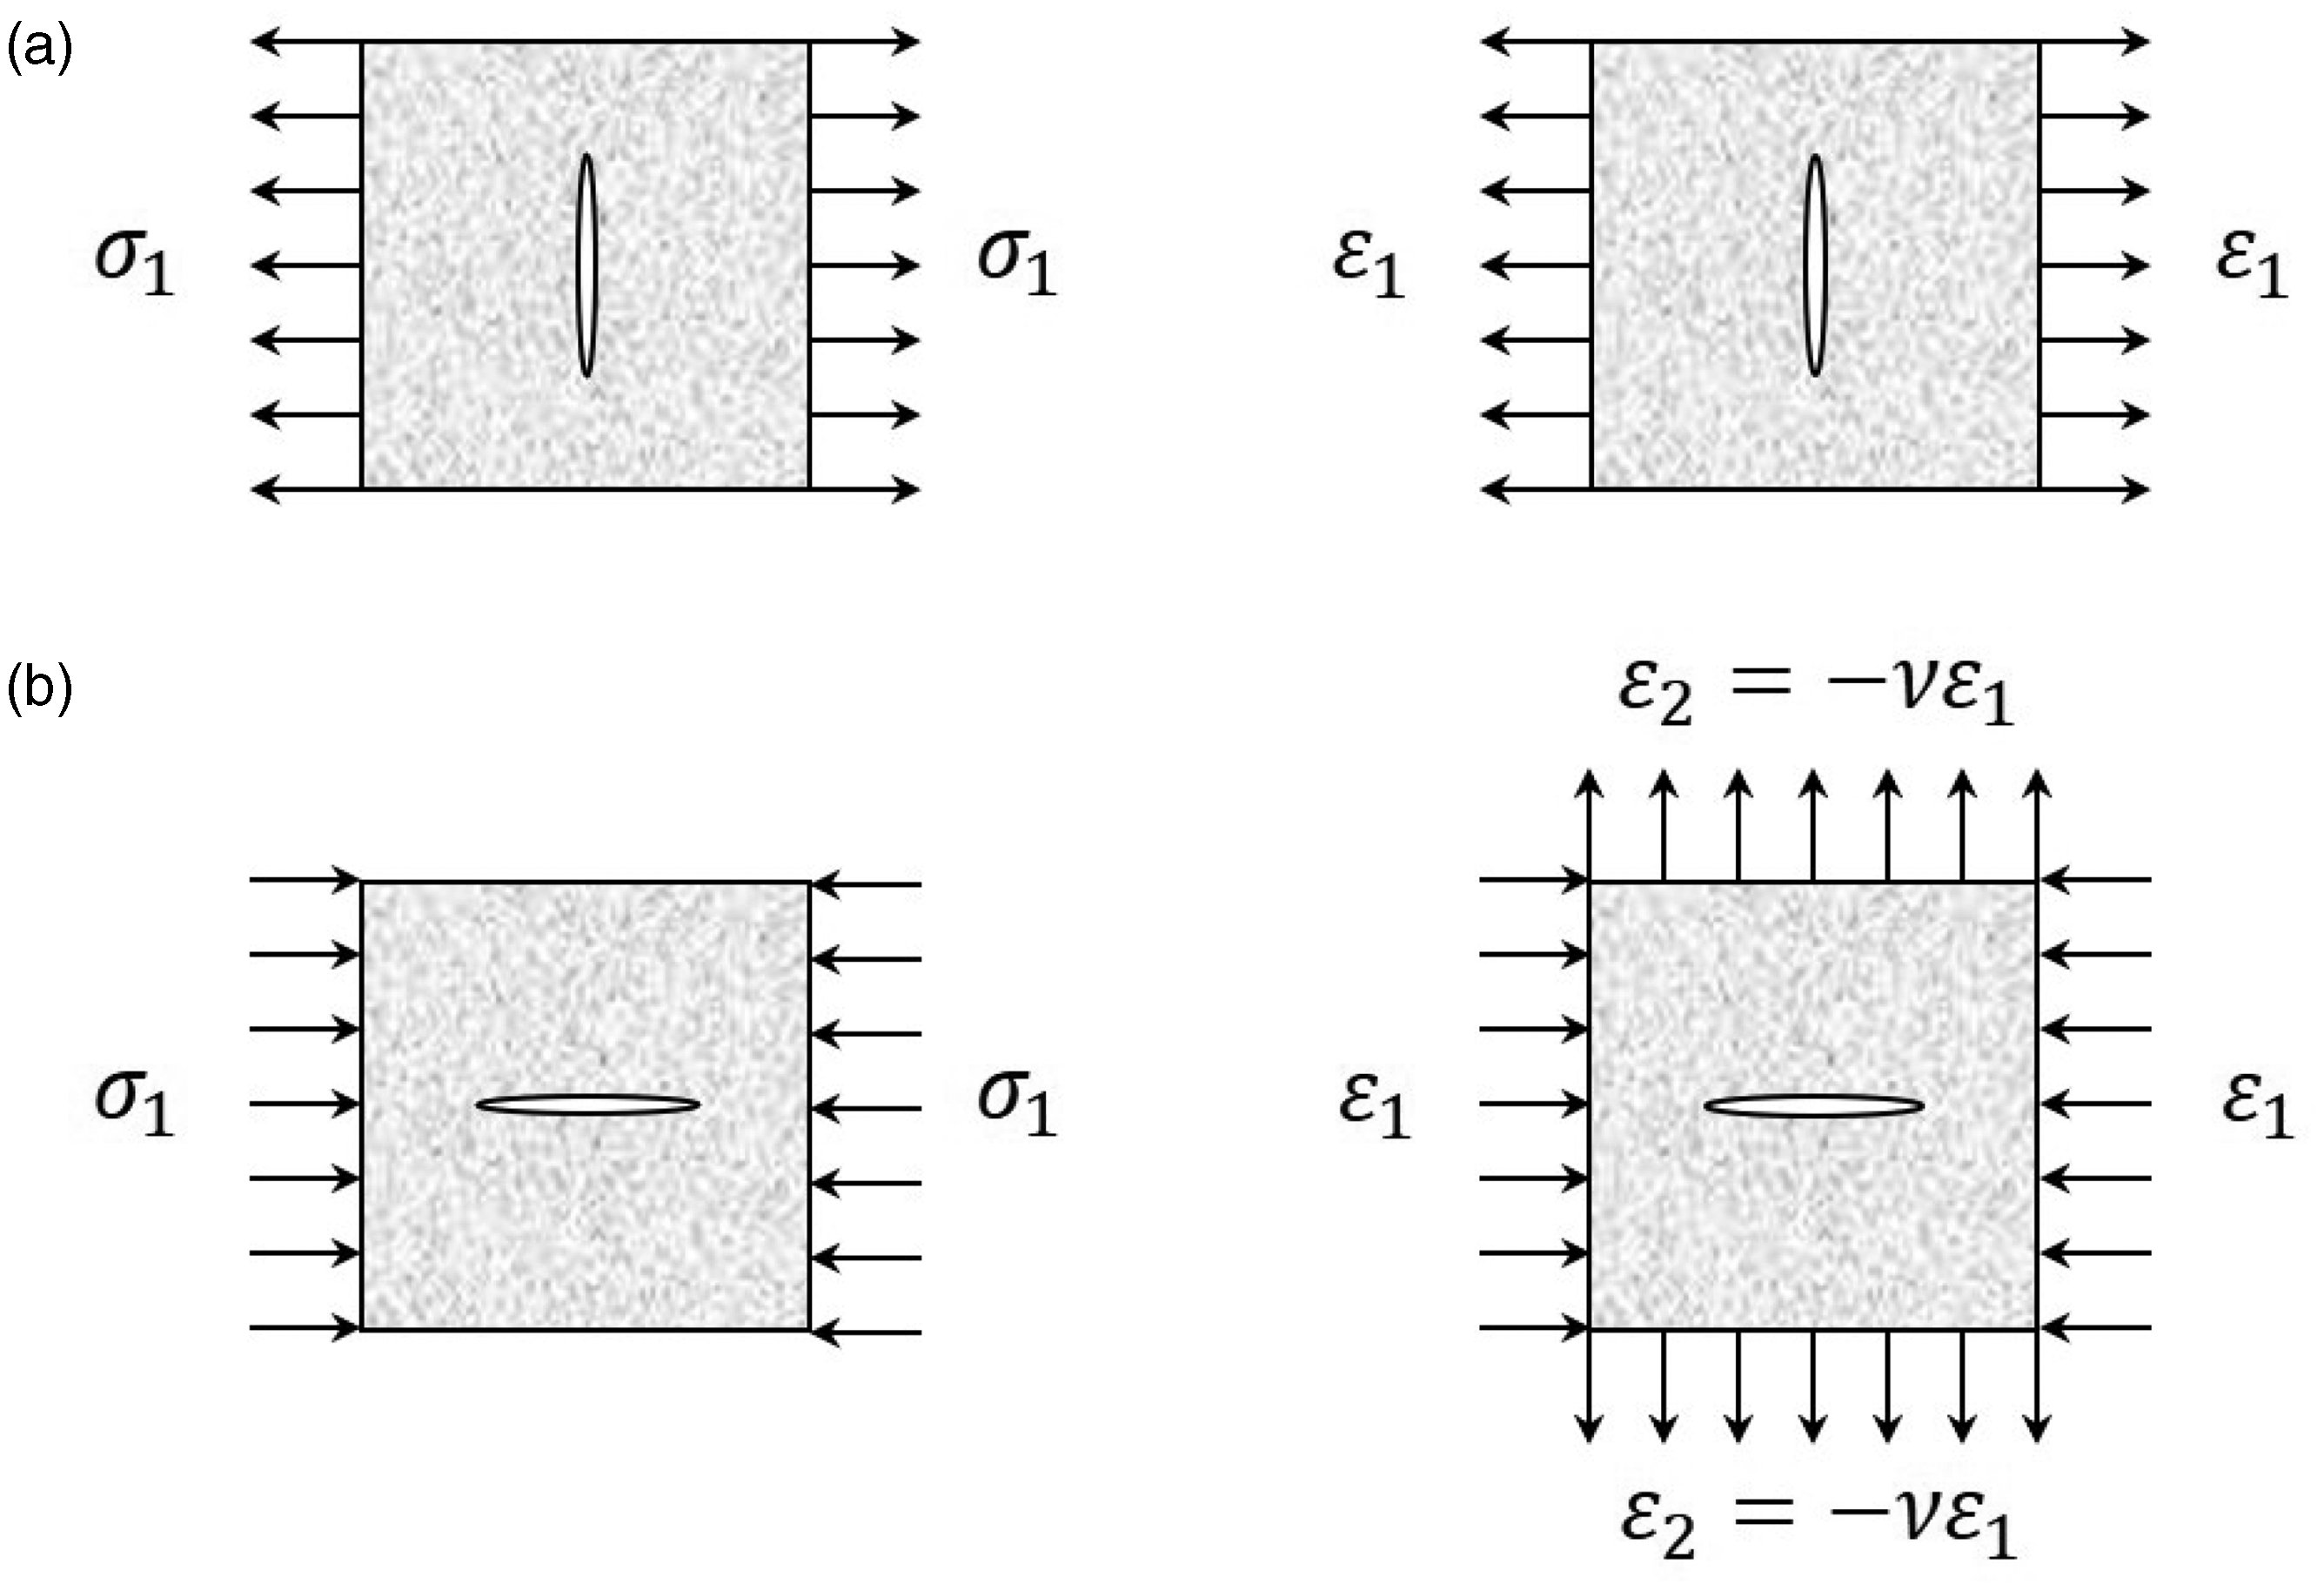
Damage behavior in Mazars damage model for (a) tensile and (b) compressive behavior.
with
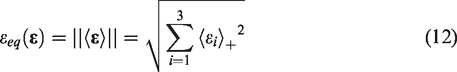
The maximum level of the equivalent strain achieved in the load history denoted as


The damage d in equation (11), used to describe the material degradation, is controlled by the loading function equation (15). Once


with
Evolution laws with fracture energy regularization
Mazars (1984) also proposed original damage evolution laws of
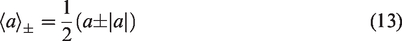
The constitutive law for concrete is defined by a function that relates the damage variable d to the internal variable
Stress-strain constitutive laws and damage evolution laws: (a) Tension and (b) Compression.
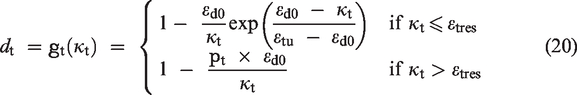
For tension shown in Figure 2(a), the softening stress-strain curve of concrete is usually characterized by a long tail which can be approximated by a classical exponential softening law (Shen et al., 2022a). Then the tensile damage evolution law is defined explicitly as:

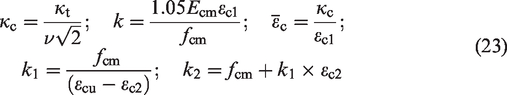
As shown in Figure 2(b), the compressive stress-strain curve from (Shen et al., 2022a) shows nonlinear before the peak, and then it experiences a hardening stage where the stress remains at its peak as the strain increase. After that, a linear strain softening occurs. Therefore, the corresponding compressive damage evolution law is expressed explicitly as:
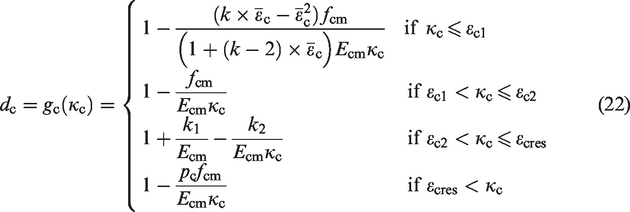
with
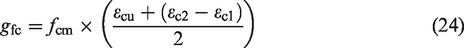
For a continuum damage model with damage localized into a band of width
The tensile and compressive fracture energies are material properties that can be measured from experimental tests. The crack bandwidth is also a material constant, relevant to the maximum aggregate size in concrete (Bažant and Oh, 1983). After introducing the bandwidth
Crack bandwidth formulation
In finite element simulations, the strain-softening modulus needs adjustment once the element size is adjusted to preserve the same fracture energy, which further leads to the objective results independent of element choice. Therefore, the crack bandwidth is modified and relevant to mesh characteristics, which is also named as characteristic element length (Arruda et al., 2022).
As mentioned before, the classical calculation of crack bandwidth was based on the square root of the element area or the cubic root of the element volume, which is adopted by many commercial finite element packages because of its simplicity. However, this rule is only constructed for square or cube elements and will lead to an inaccurate estimate of the bandwidth in a general situation.
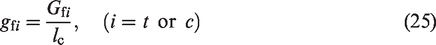
Another estimation for a consistent crack bandwidth based on the crack band direction was first studied by Oliver (1989) who proposed the following equation:
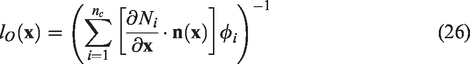
A few years later, Govindjee et al. (1995) found equation (26) would lead to a discontinuous function if it was extended to 3-D problem using 8-node brick element. To remove the continuity problems, a simple modification was introduced to the crack indicator:
with
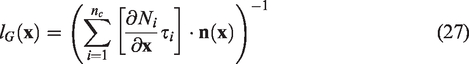
Inspired by the previous studies, He et al. (2019) developed an improved method based on projecting elements onto the direction normal to the crack direction:

with
All the above-mentioned methods are only applicable to linear finite elements and standard Gauss quadrature. However, Jirásek and Bauer (2012) found the strain softening may only localize on a part of the element width if a quadratic interpolation function is adopted, which was also reported in (Slobbe et al., 2013). Therefore, to consider the effect of strain localization that is resulted from the numerical integration scheme and interpolation function, Slobbe et al. (2013) introduced two parameters to modify Govindjee’s method:

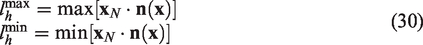
Given the aforementioned summary, it is necessary to propose a new consistent crack bandwidth for higher-order beam theories. Figure 3 shows the procedure of this new bandwidth estimation. First, one beam element with Lagrange expansion can construct a volume element. In Figure 3, one B4 element with L9 expansion is utilized. Then, the idea from (Shen et al., 2022a) is referred to here, where the assembled volume element is divided into small volumes according to the order of beam and Lagrange element. In this case, twelve small volumes are obtained and the highlighted one with green containing the target point in Figure 3 is taken out for illustration. Next, conducting the projection method of He et al. (2019) on the highlighted volume with green after obtaining the middle points of each edge and the unit vector of major principal strain on the target point.
Proposed estimation of crack bandwidth.
The steps for crack bandwidth computation are presented in Algorithm 1. The general idea is to select eight nodal points around the target point to create an eight-point volume element. After that, extending the projection method of He et al. (2019) in three dimensional and the corresponding crack bandwidth can be computed based on the projection method of He et al. (2019).
Algorithm 1 Proposed estimation of crack bandwidth
Target point location
Crack bandwidth
1 Obtain the corresponding beam element and LE of target point;
2 Obtain 8 nodal points
3 Assemble a small volume element with the above 8 nodal points;
4 Obtain 8 middle points
5
6 Compute projection on crack direction, l:
7 end for
8 Save the maximum projection
9 Evaluate the crack bandwidth:
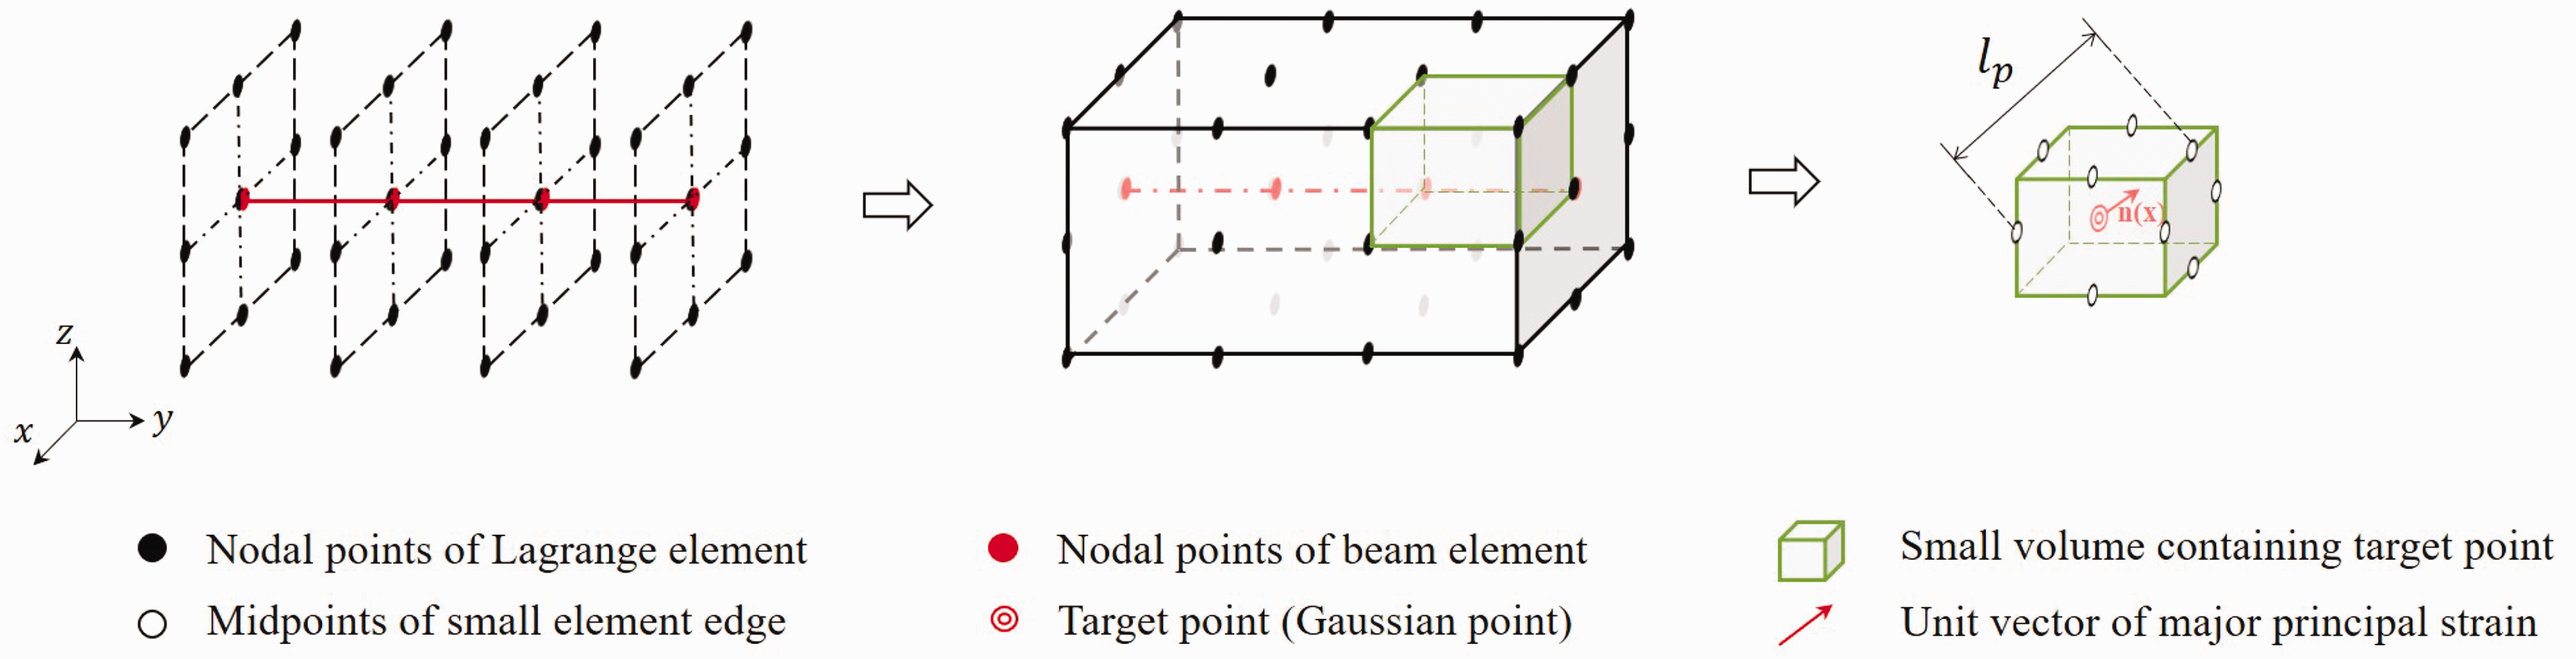
Figure 4 displays the crack bandwidths of one linear element, consisting of one B2 element with length of 1.0 and one L4 element with side length of 2.0, estimated by the proposed method and Govindjee et al. (1995). The direction of major principal strain can be characterised by azimuthal angle
Comparison of crack bandwidths for a linear eight-nodes element: (a) relations of crack bandwidths to azimuthal angle and polar angle and (b) geometrical meaning of crack bandwidths estimated by the proposed method and Govindjee et al. (1995).
Numerical results
Previously, Shen et al. (2022a) has demonstrated the effectiveness of higher-order beam theories using a simplified crack bandwidth formulation that can be named as the previous method. In this session, three typical experimental benchmarks with small prefabricated notches, hard to model in (Shen et al., 2022a), are taken to evaluate the new crack bandwidth formulation. Similarly, all benchmarks are modelled by displacement-control method. The numerical analyses were conducted using in-house code and commercial software ABAQUS was only employed for the visualization of results.
The Hassanzadeh test
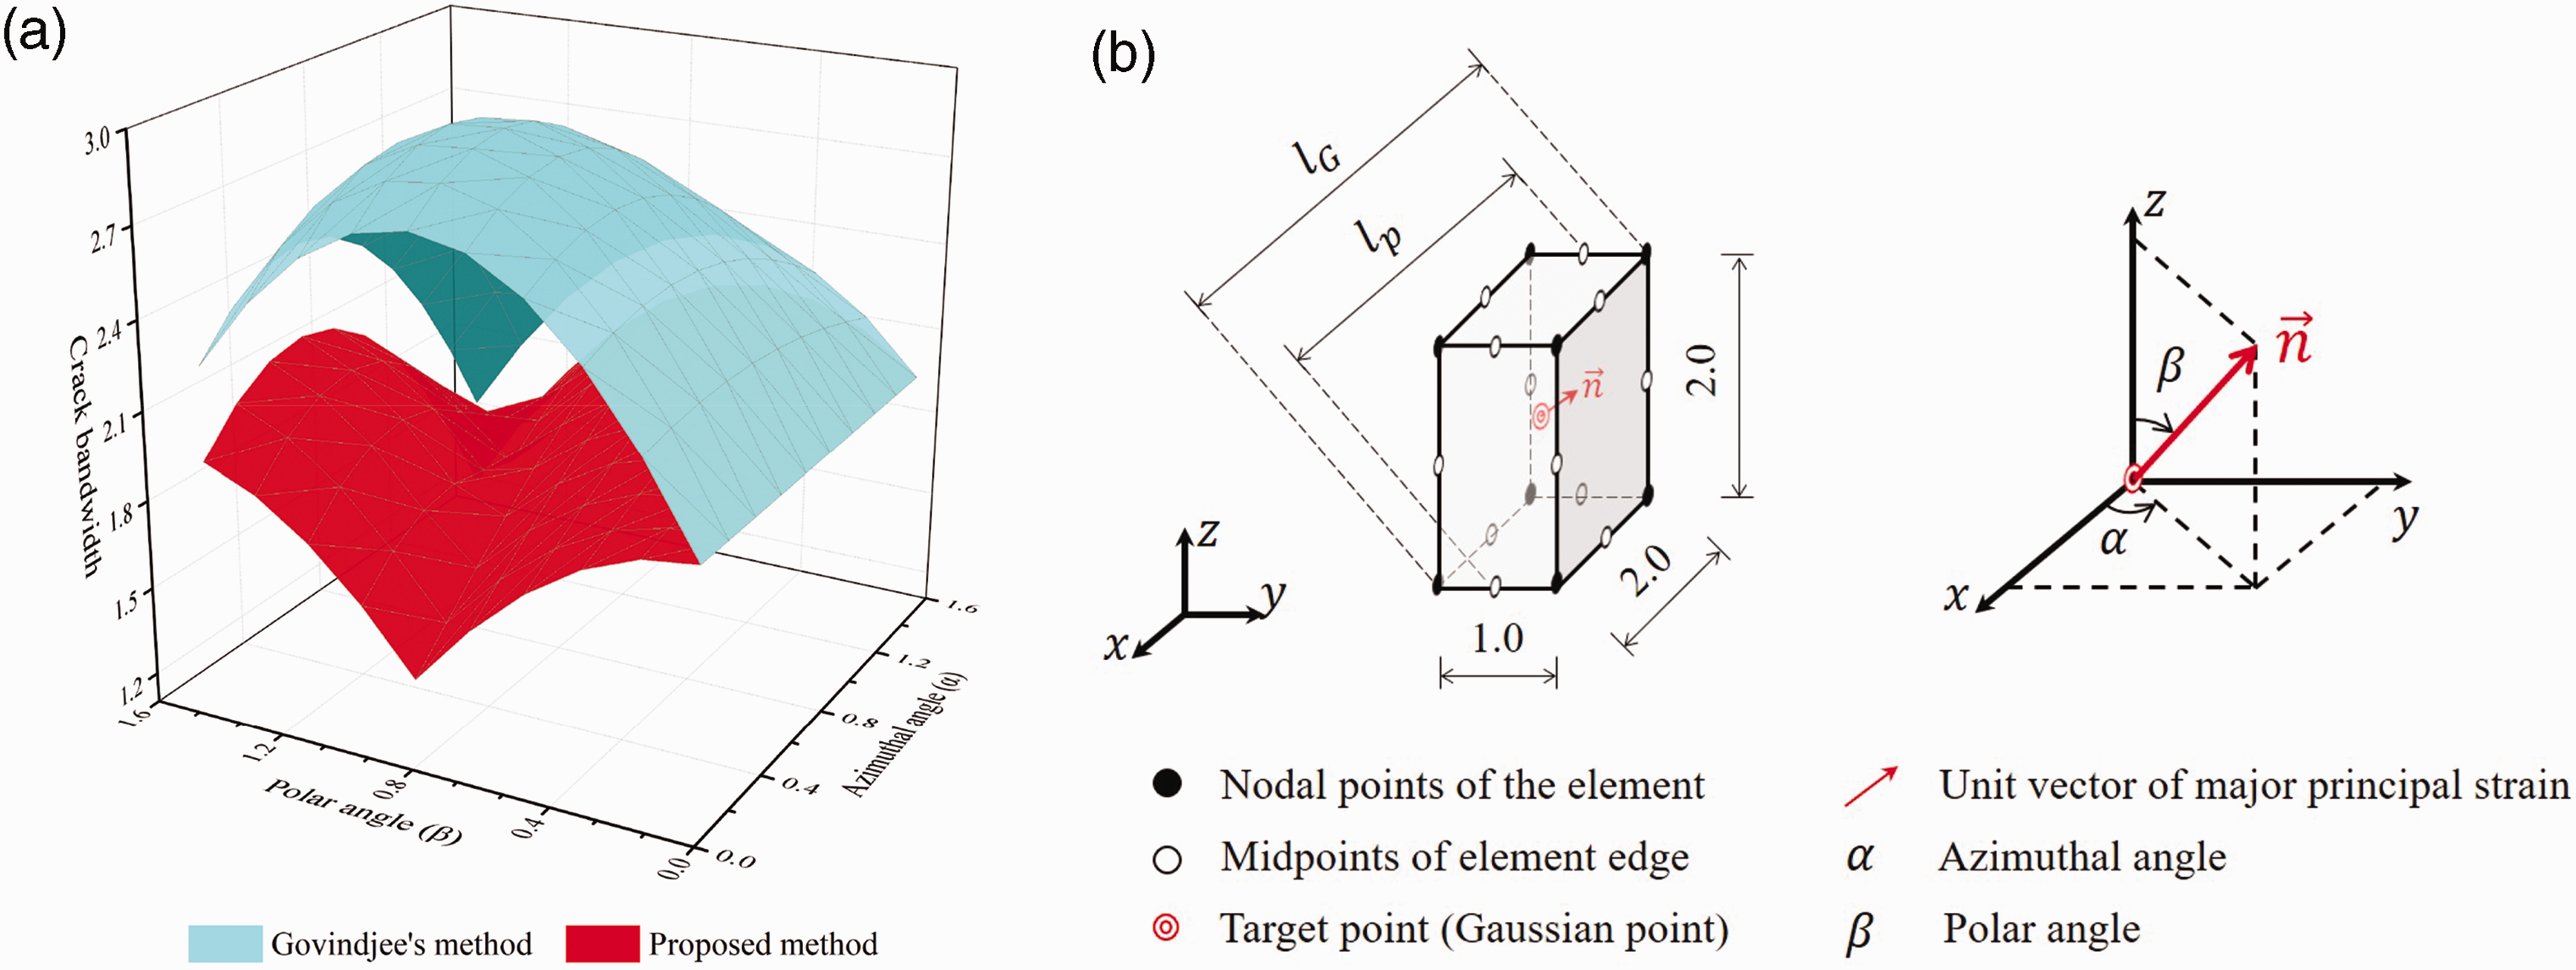
A direct experimental tension benchmark test of plain concrete was conducted in (Hassanzadeh, 1992), known as the Hassanzadeh test. Figure 5 shows a plain concrete cube with four edges notched in the middle, with a notch thickness of only 4 mm. This thin notch thickness leads to difficulties and errors in discretization of the cross section and beam, as the mesh must be close to a cube to avoid mesh sensitivity in (Shen et al., 2022a).In the test, the bottom surface of the cube is fixed and a vertical tension is applied to the top surface through displacement control until the top displacement reaches 0.04 mm. The material properties of the concrete used in the test are listed in Table 1 and taken from (Hassanzadeh, 1992; Shen et al., 2022a).
Concrete specimen in Hassanzadeh test: geometry and boundary conditions (Unit:mm).
Concrete properties in Hassanzadeh test.
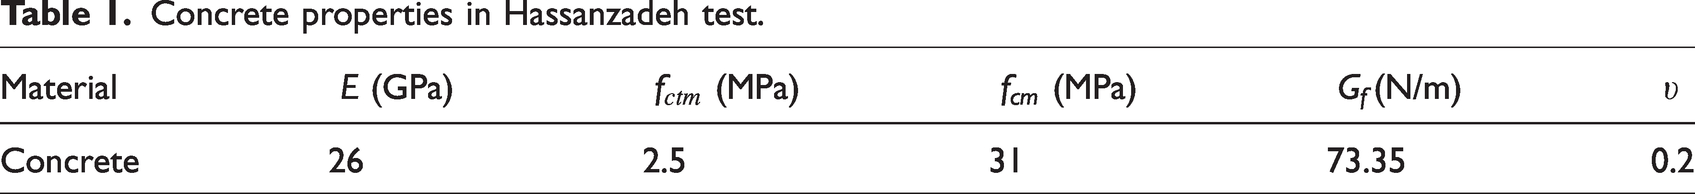
Figure 6 illustrates the mesh assignment and discretization of the concrete specimen in the CUF model. The y-axis is aligned with the height of the specimen and the x-z plane is placed on the cross-section. There are two types of cross sections with the same single-element size. To investigate the accuracy of the proposed crack bandwidth formulation, four models with different mesh discretizations are listed in Table 2. These models consider the influence of element size and order on structural behavior.
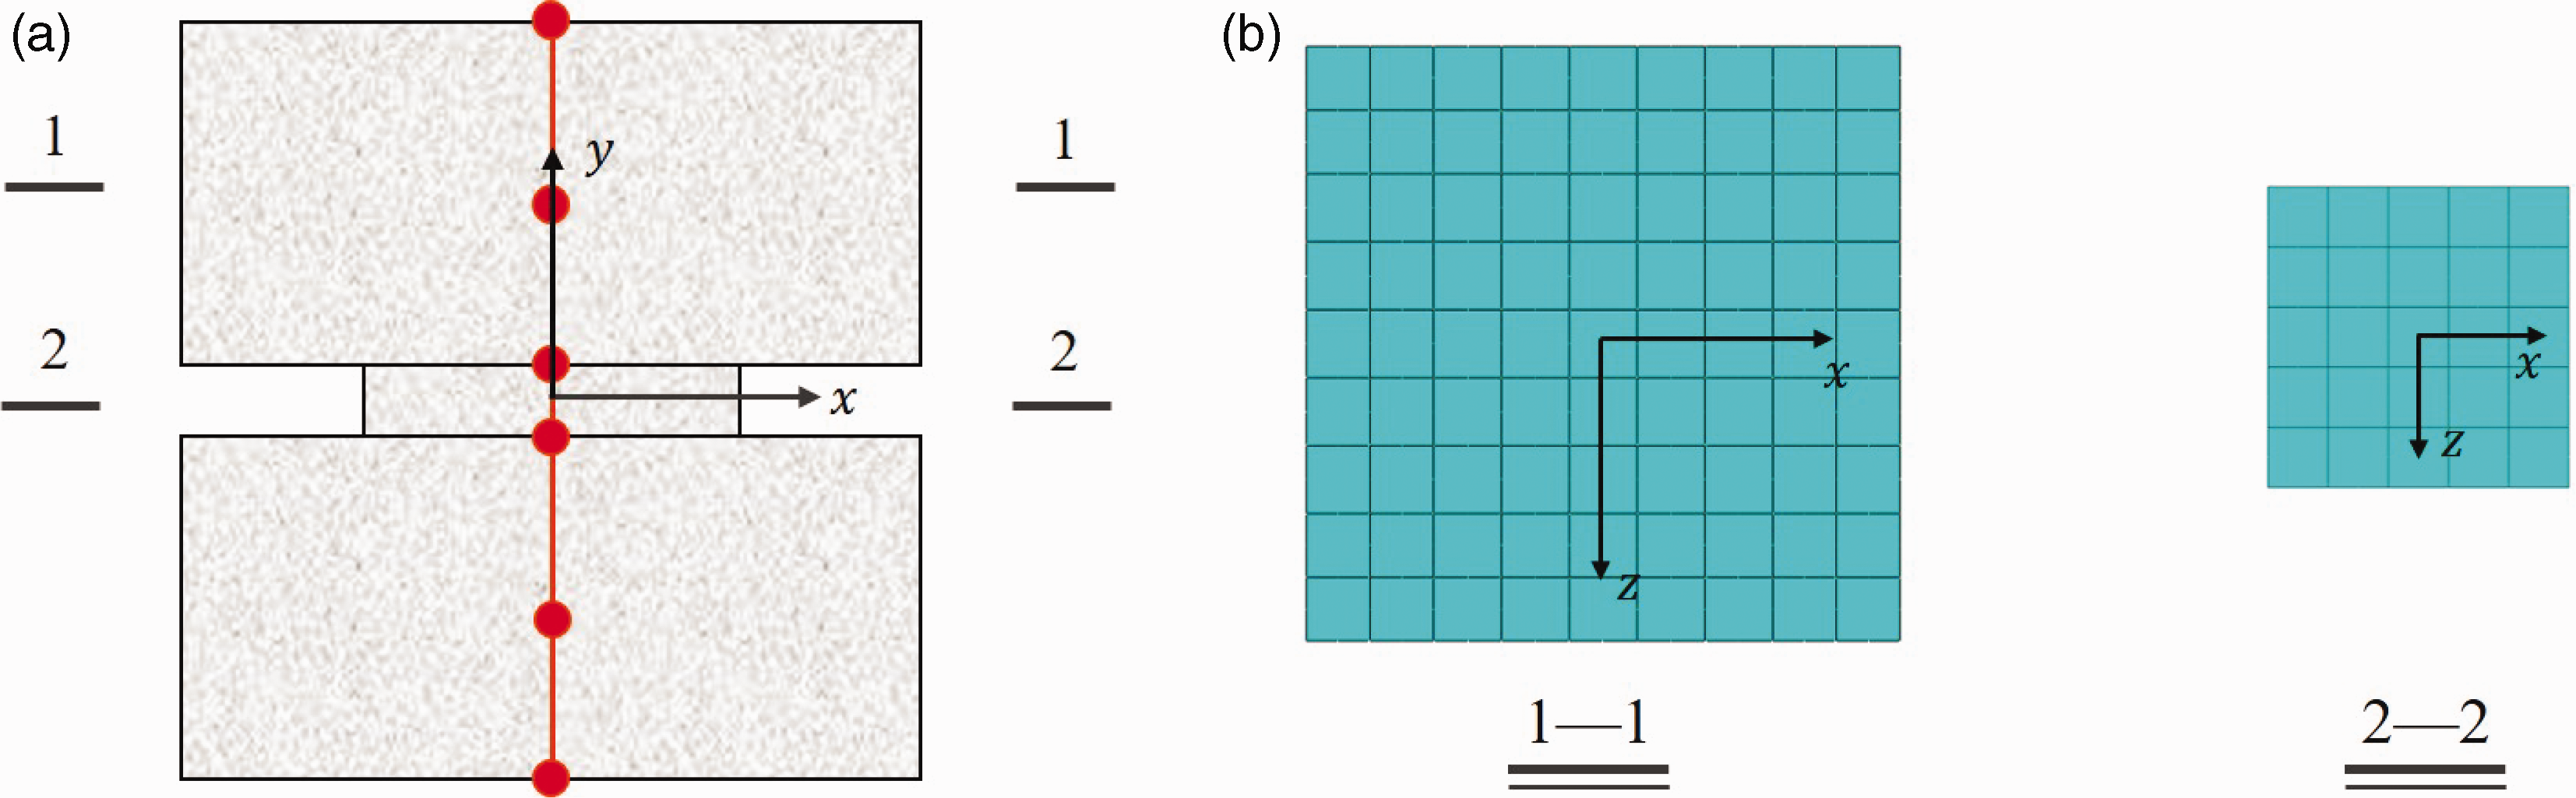
Mesh assignment of Hassanzadeh test: (a) Beam elements and (b) cross-sectional discretization.
Mesh configuration of the notch in Hassanzadeh test.
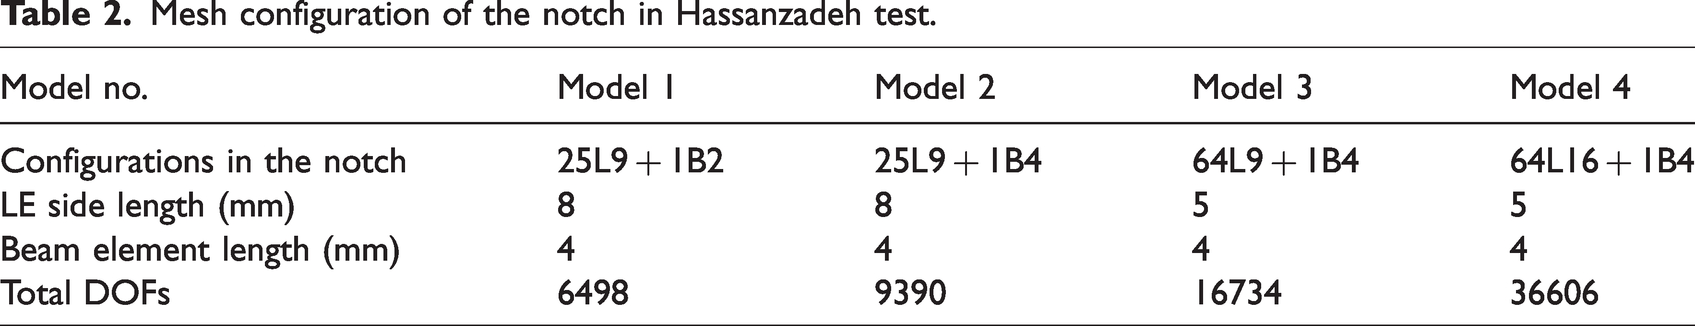
Figure 7 shows that damage localizes in the notch, but the damage widths/patterns of different models show slight differences. This can be attributed to the influence of the interpolation function on strain localization. For Model 1, all Gaussian points in the notch are damaged, indicating that strain localization occurs over the entire width of the beam element. This phenomenon has been previously reported by other researchers (Jirásek and Bauer, 2012; Slobbe et al., 2013) because the derivatives of the interpolation functions of linear beam elements are constant. When higher-order beam elements (B4) are used in the remaining three models, not all Gaussian points are damaged or cracked because the strain field functions along the y-axis are quadratic, leading to strain localization mainly occurring at both ends of the notched beam element. It is worth noting that higher-order elements like Model 4 provide more detailed information than lower-order elements like Model 1. However, Model 4 requires a large number of DOFs, which is around 6 times that of Model 1. Besides, it should be emphasized that the mesh displayed in Figure 7 is merely a plotting grid for visualization. It is not necessarily consistent with the mesh discretization illustrated in Figure 6. Significantly, the size of the post-processing mesh does not influence the final solution. This clarification remains valid for subsequent sections without further repetition.
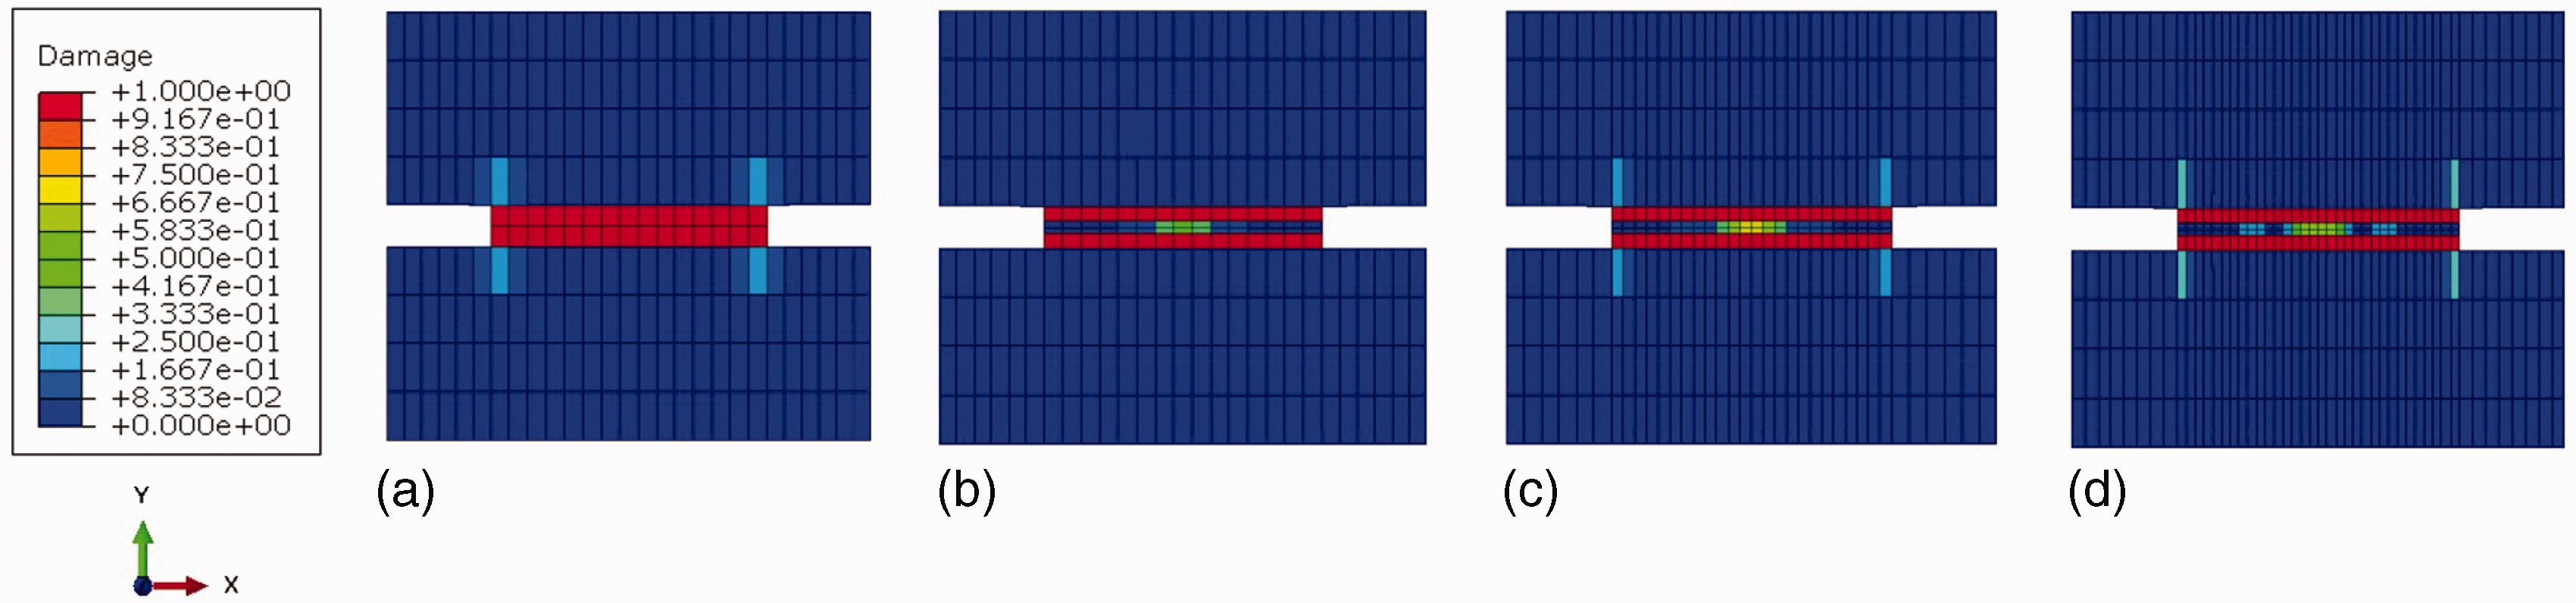
Final damage distributions of (a) Model 1, (b) Model 2, (c) Model 3, and (d) Model 4 in Hassanzadeh test.
Figure 8 compares the crack bandwidth
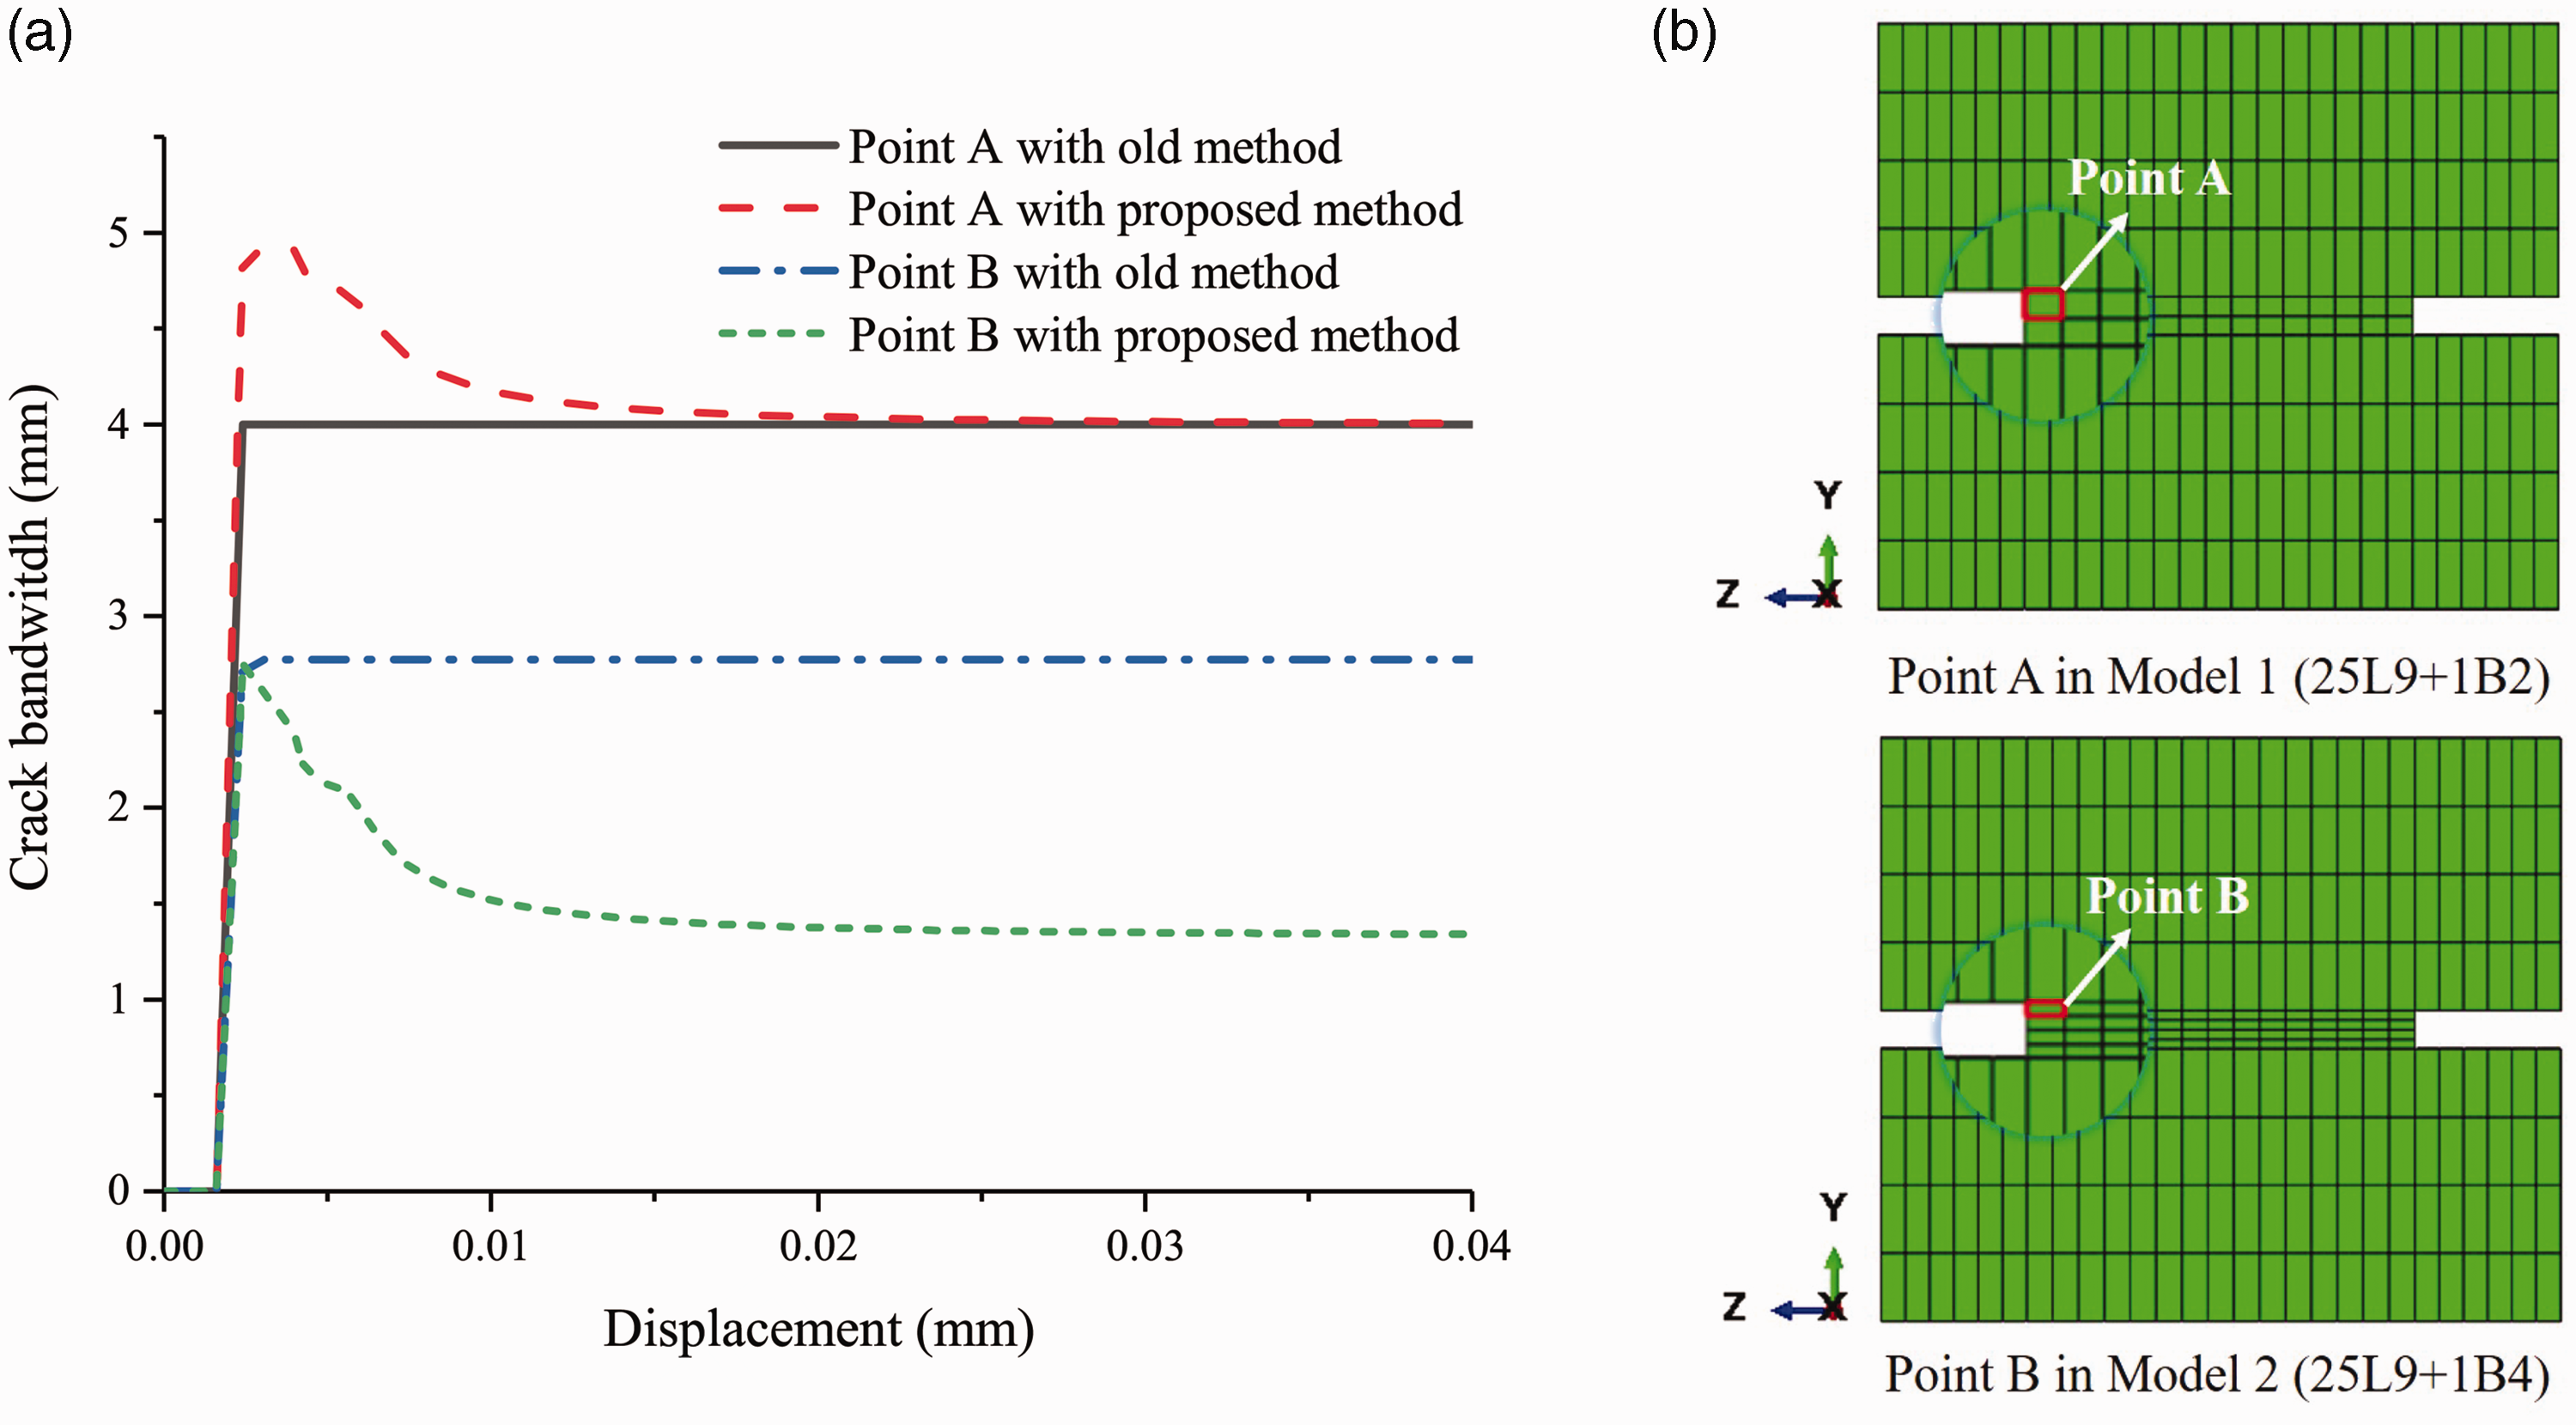
Comparisons of crack bandwidths using the previous method and the proposed method: (a) Crack bandwidths curves during simulation and (b) Indication of selected Gauss points.
As a reference, load-displacement curves using the previous method (Shen et al., 2022a) to calculate crack bandwidths
Load-displacement curves from the Hassanzadeh test: (a) Previous formulation; (b) Proposed new formulation.
Therefore, it can be concluded that the proposed new method is less sensitive to mesh size and more robust than the previous method in this case.
Three point bending test
The three-point bending (TPB) test is an indirect tension test performed on a plain concrete beam with a notch in the midspan, which was previously carried out experimentally in (Koermeling and Reinhardt, 1983). As shown in Figure 10, the test involves a simply supported concrete beam with a load applied to the top midspan. The load is controlled by displacement, with a maximum value of 0.5 mm. The notch has a thickness of 5 mm, which previously limited the use of higher-order beam elements in (Shen et al., 2022a). However, with the help of the new crack bandwidth formulation, more random mesh configurations can be used in this case. The concrete properties used in this test are listed in Table 3, based on (Koermeling and Reinhardt, 1983; Shen et al., 2022a).
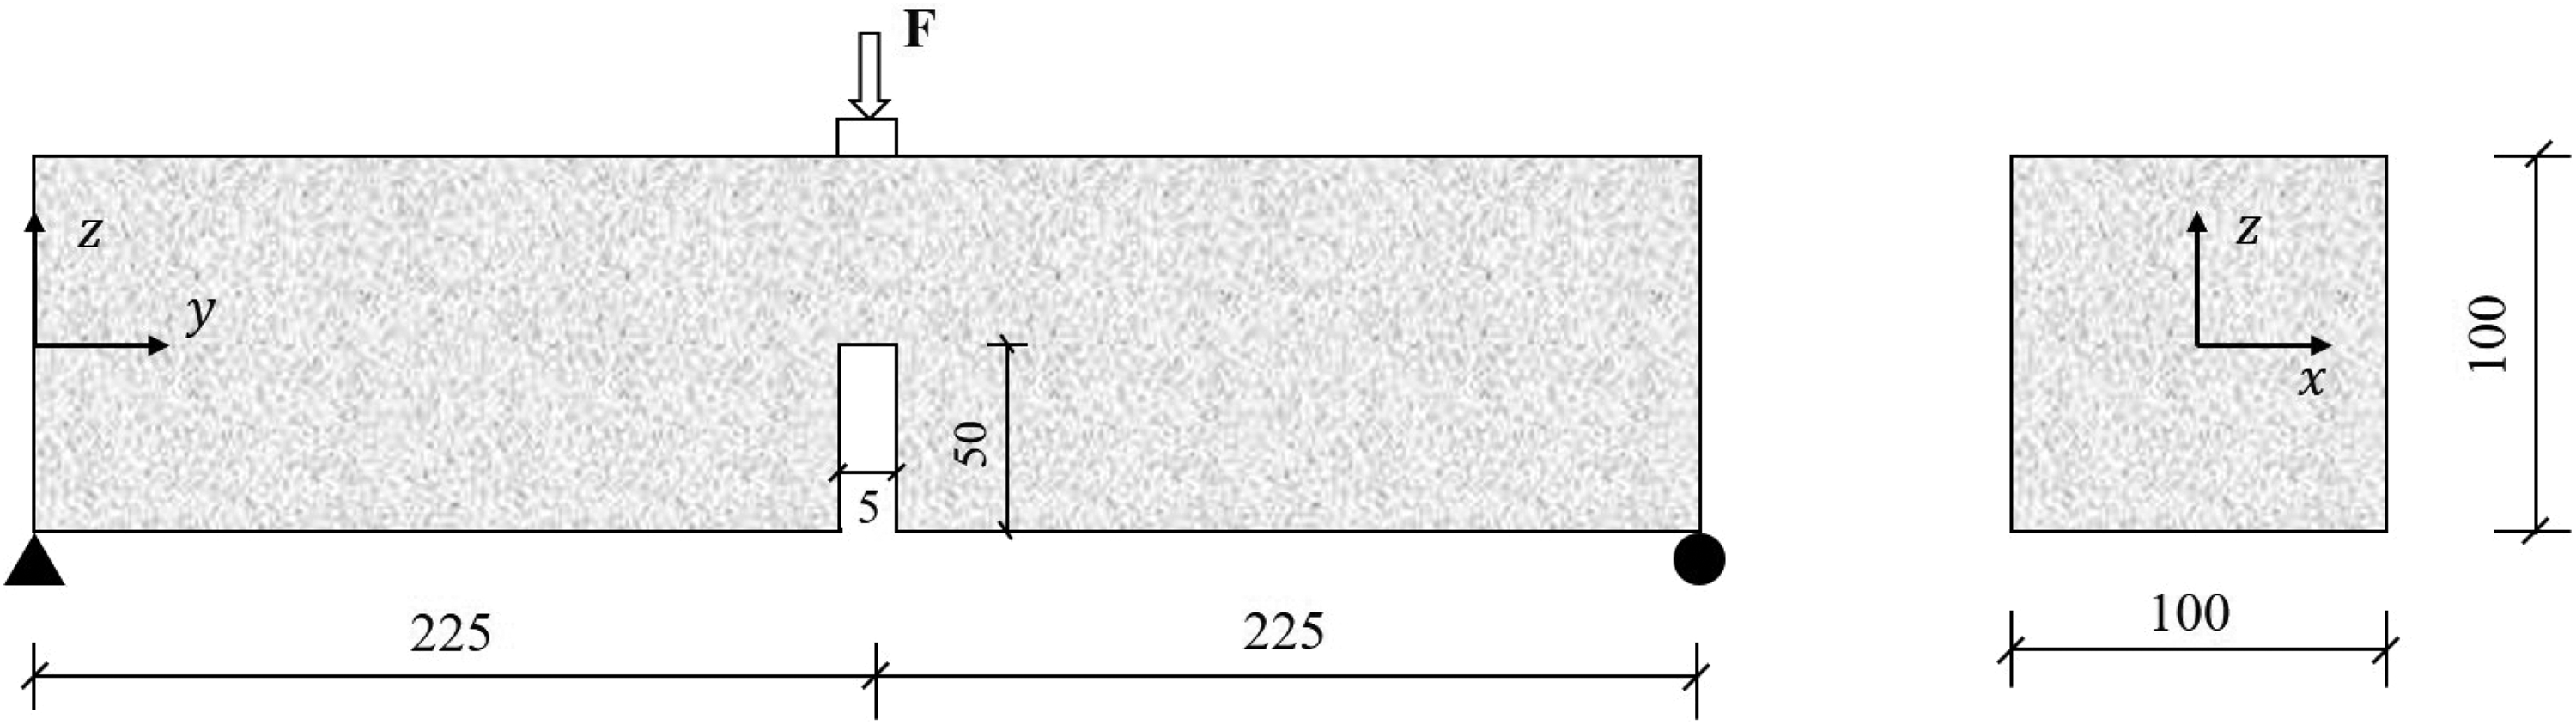
Concrete beam in TPB test: geometry and boundary conditions (Unit:mm).
Concrete properties in TPB test.
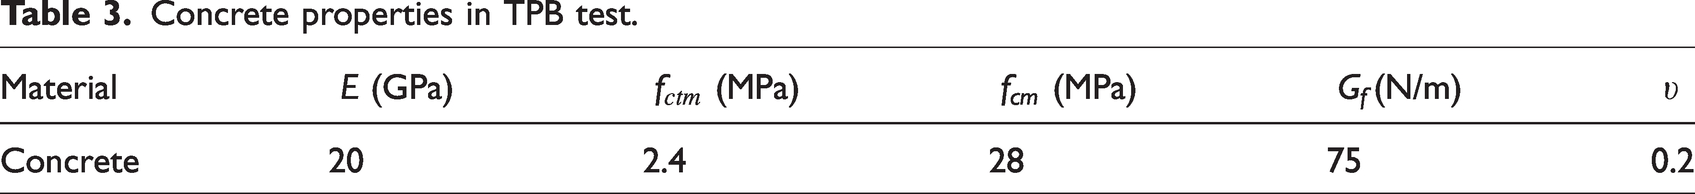
Figure 11 displays the mesh configuration of the CUF model for a notched concrete beam. The y-axis is along the length of the beam, and the x-z plane is on the cross-section of the beam. Symmetry condition is applied so that half of the cross-section is discretized in Figure 11(b). The discretization of beam elements along the y-axis will significantly impact the final structural behavior in this case. Therefore, six models listed in Table 4 are tested, where all models use the L9 element with a side length of 10 mm on the cross section. In Table 4, the number of remaining beam elements is different for different beam orders, which is designed to remove the convergence influence when lower-order beam elements are used.
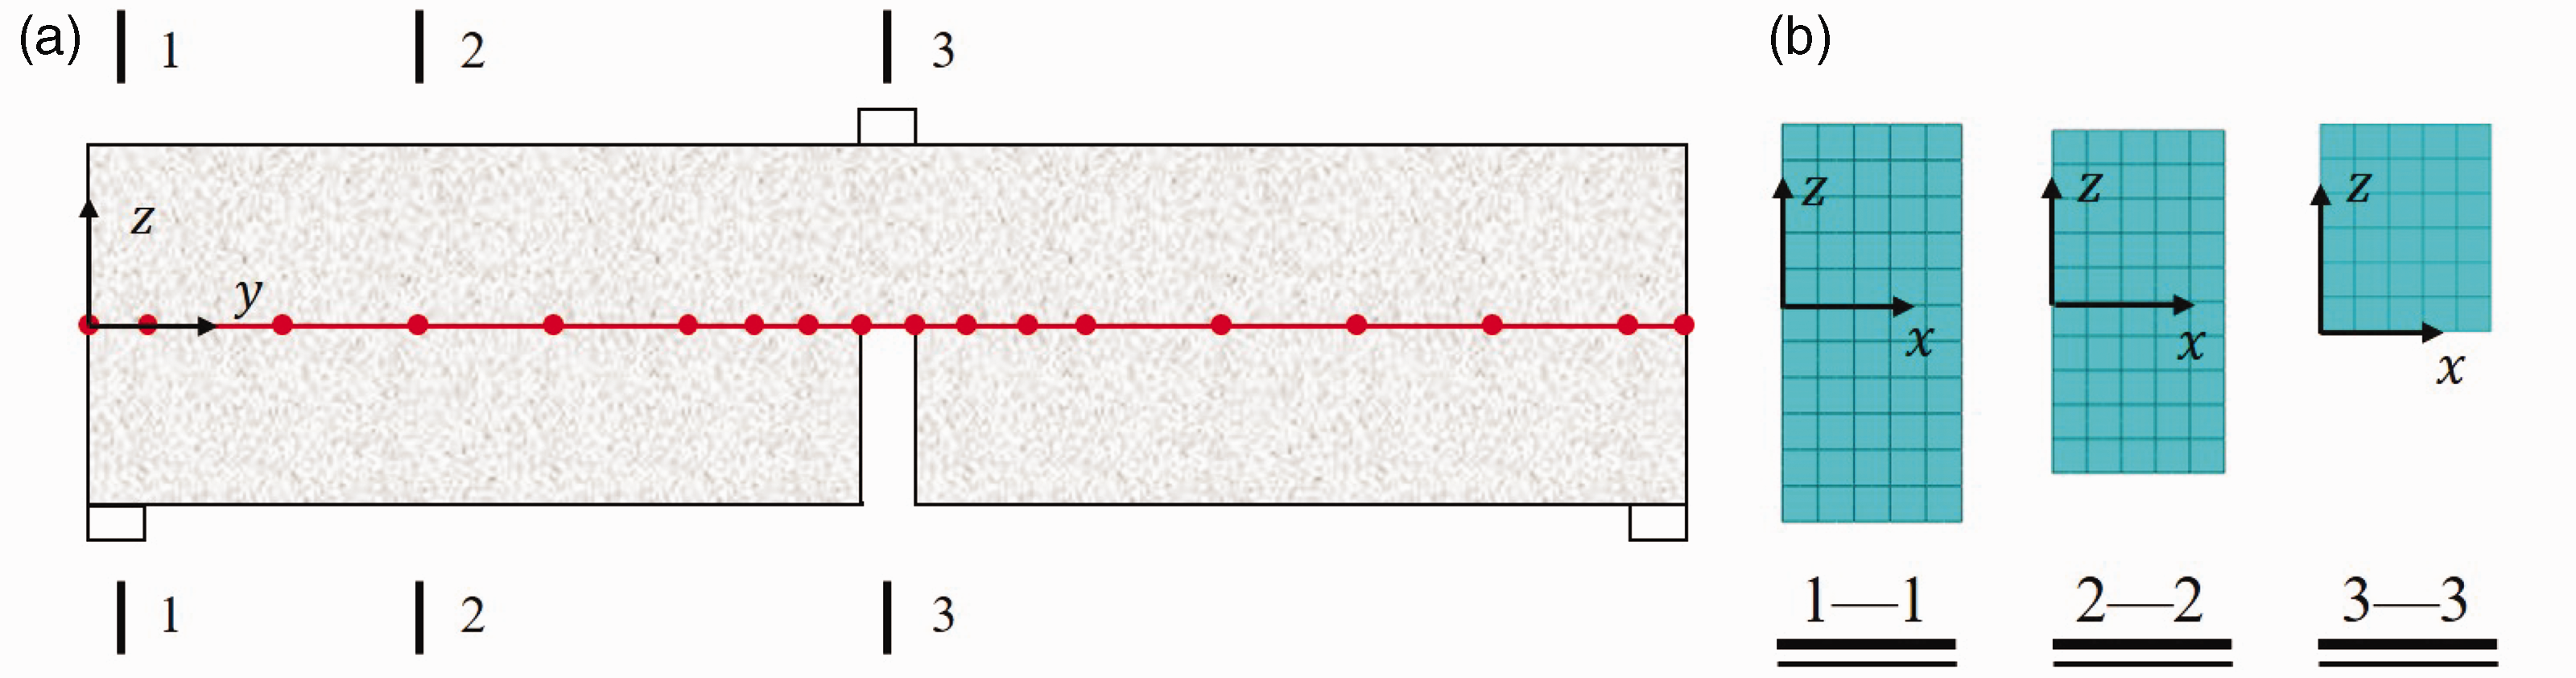
Mesh assignment of the notched concrete beam in TPB test: (a) Beam elements and (b) cross-sectional discretization.
Beam element configuration in TPB test.
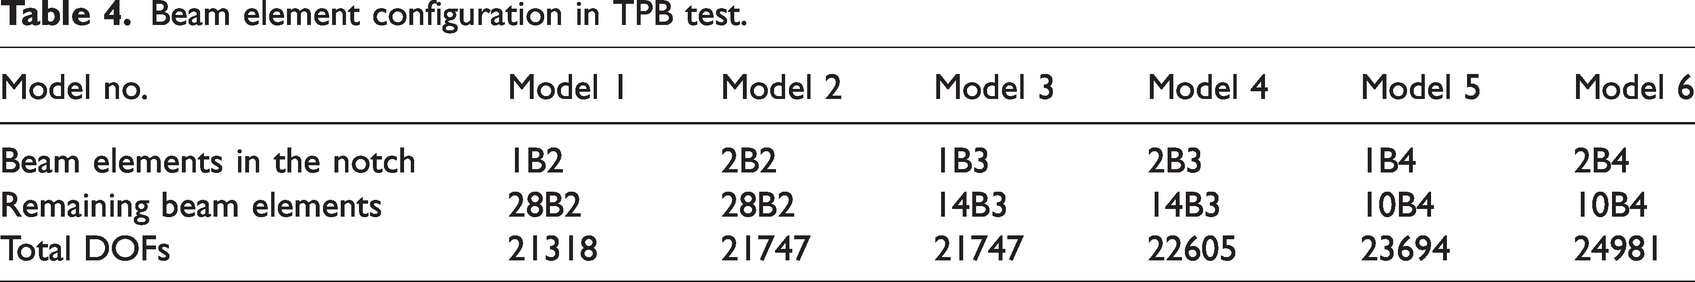
Figure 12 shows the final damage distribution for all models with the new crack bandwidth estimation. Models 1 and 5 show the expected damage distribution, similar to the phenomenon shown in Figure 7. However, when B3 or higher order elements are used in the notch, the damage distribution is significantly different. This can be explained by the fact that the new estimation of crack bandwidth changes the crack propagation path in order to preserve the fracture energy.
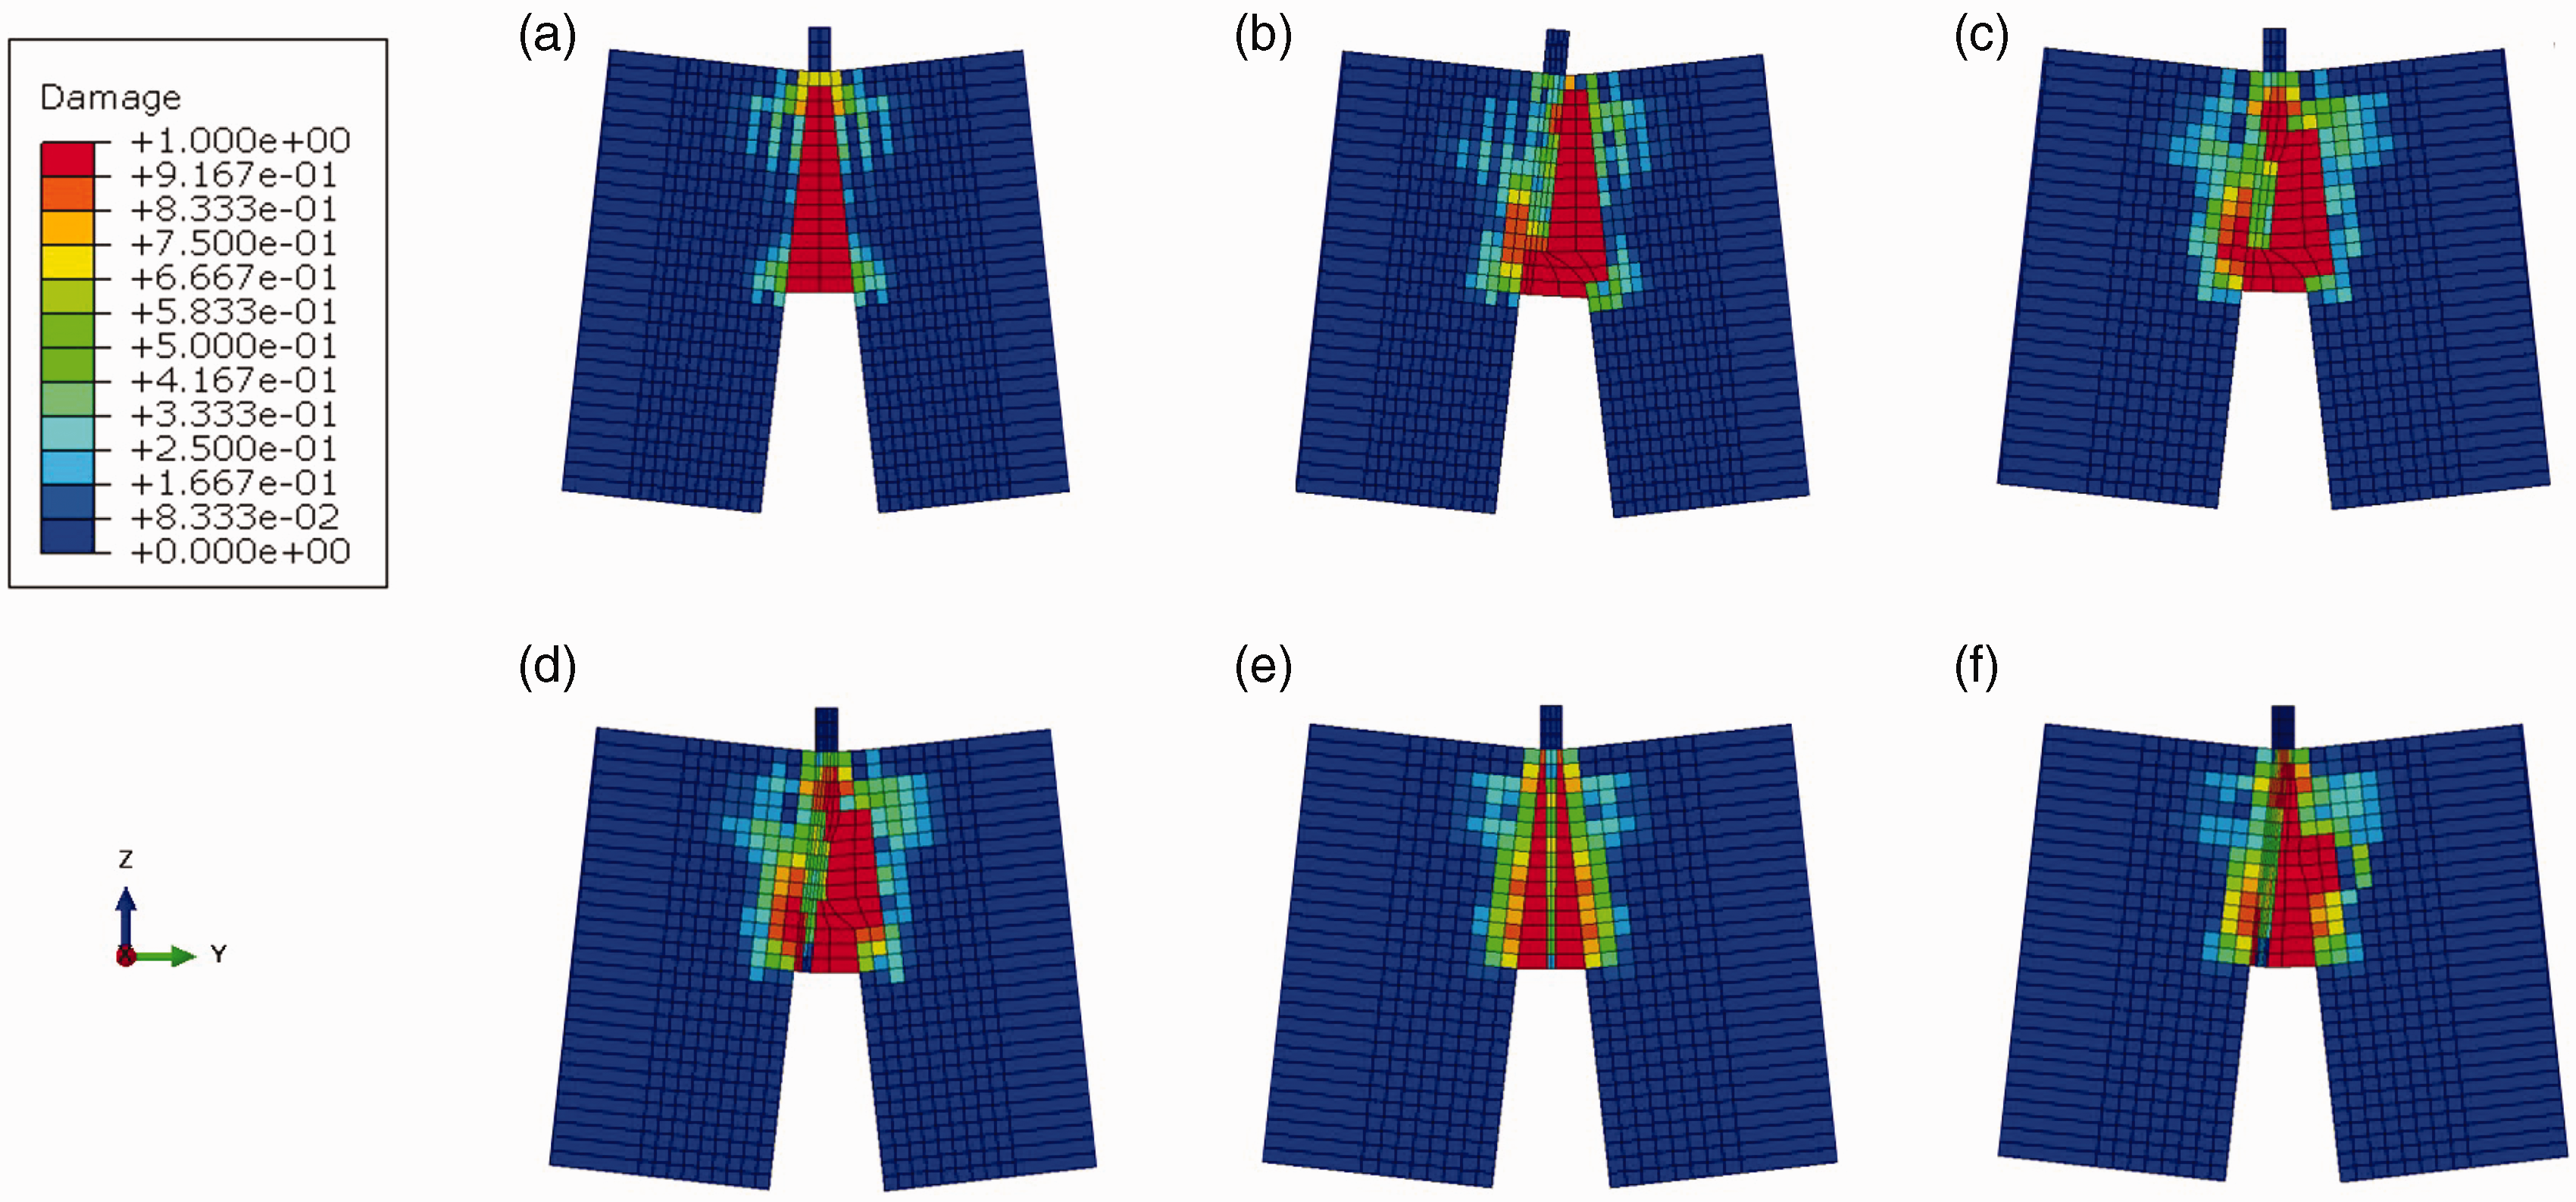
Final damage distribution of (a) Model 1, (b) Model 2, (c) Model 3, (d) Model 4, (e) Model 5, and (f) Model 6 in TPB test.
To investigate the evolution of damage when only 1B3 is used in the notch, Figure 13 plots the damage distributions around the notch at different stages of loading. The damage first appears at the bottom of the notch and then spreads out of the notch. Later, symmetry is lost and the damage on one side continues to propagate vertically. As the loading approaches its end, the damage spreads back to the middle of the notch. This behavior is distinct from the model with only 1B2 or 1B4 used in the notch, which showed damage only propagating vertically upwards within the notch.
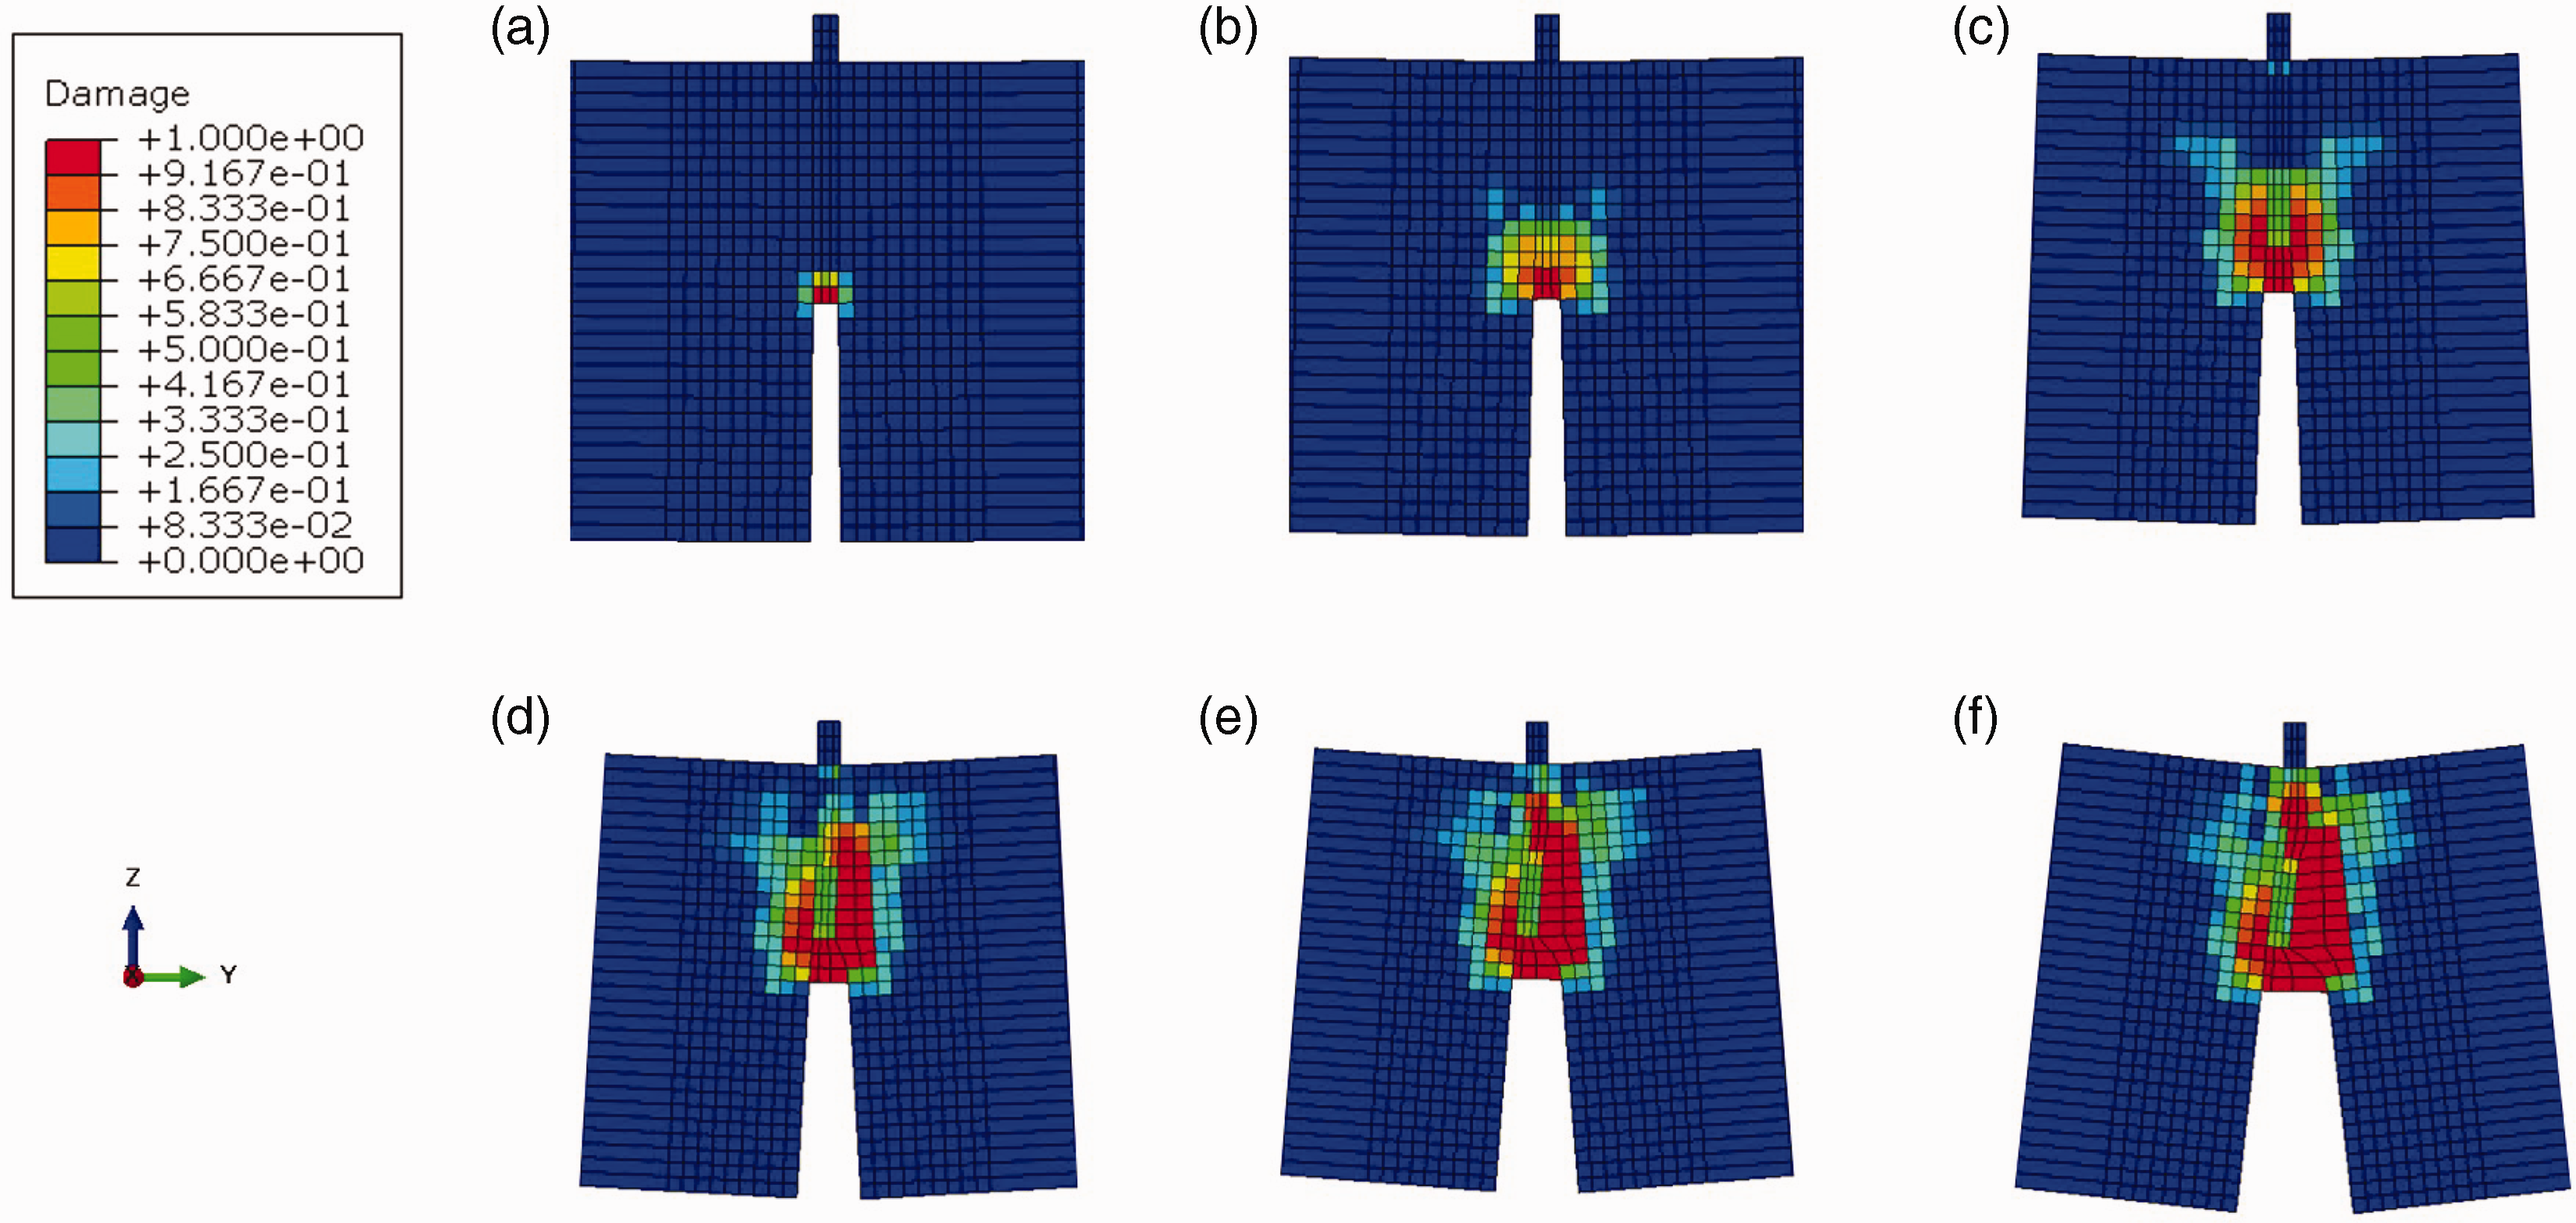
Damage evolution of Model 3 for (a)
Figure 14 shows some comparisons between the previous method and the proposed new method in computed crack bandwidths and stress-strain curves of some selected Gauss points. Similarly, the crack bandwidths from the previous formulation are higher than those from the proposed new method, except for Model 1 where the mesh configuration meets the requirement for cube elements. For the point A in Model 1, it is expected that the stress-strain curves from both methods are similar, as shown in Figure 14(b), due to the similar crack bandwidth in Figure 14(a). For point C in Model 5, the stress-strain curve from the proposed new method is higher than that from the previous formulation, indicating that the fracture energy is preserved successfully with the proposed new method. For point B in Model 3, the stress-strain curve from the proposed new method is similar to that from the previous method, because both methods provide similar overestimated crack bandwidths until around
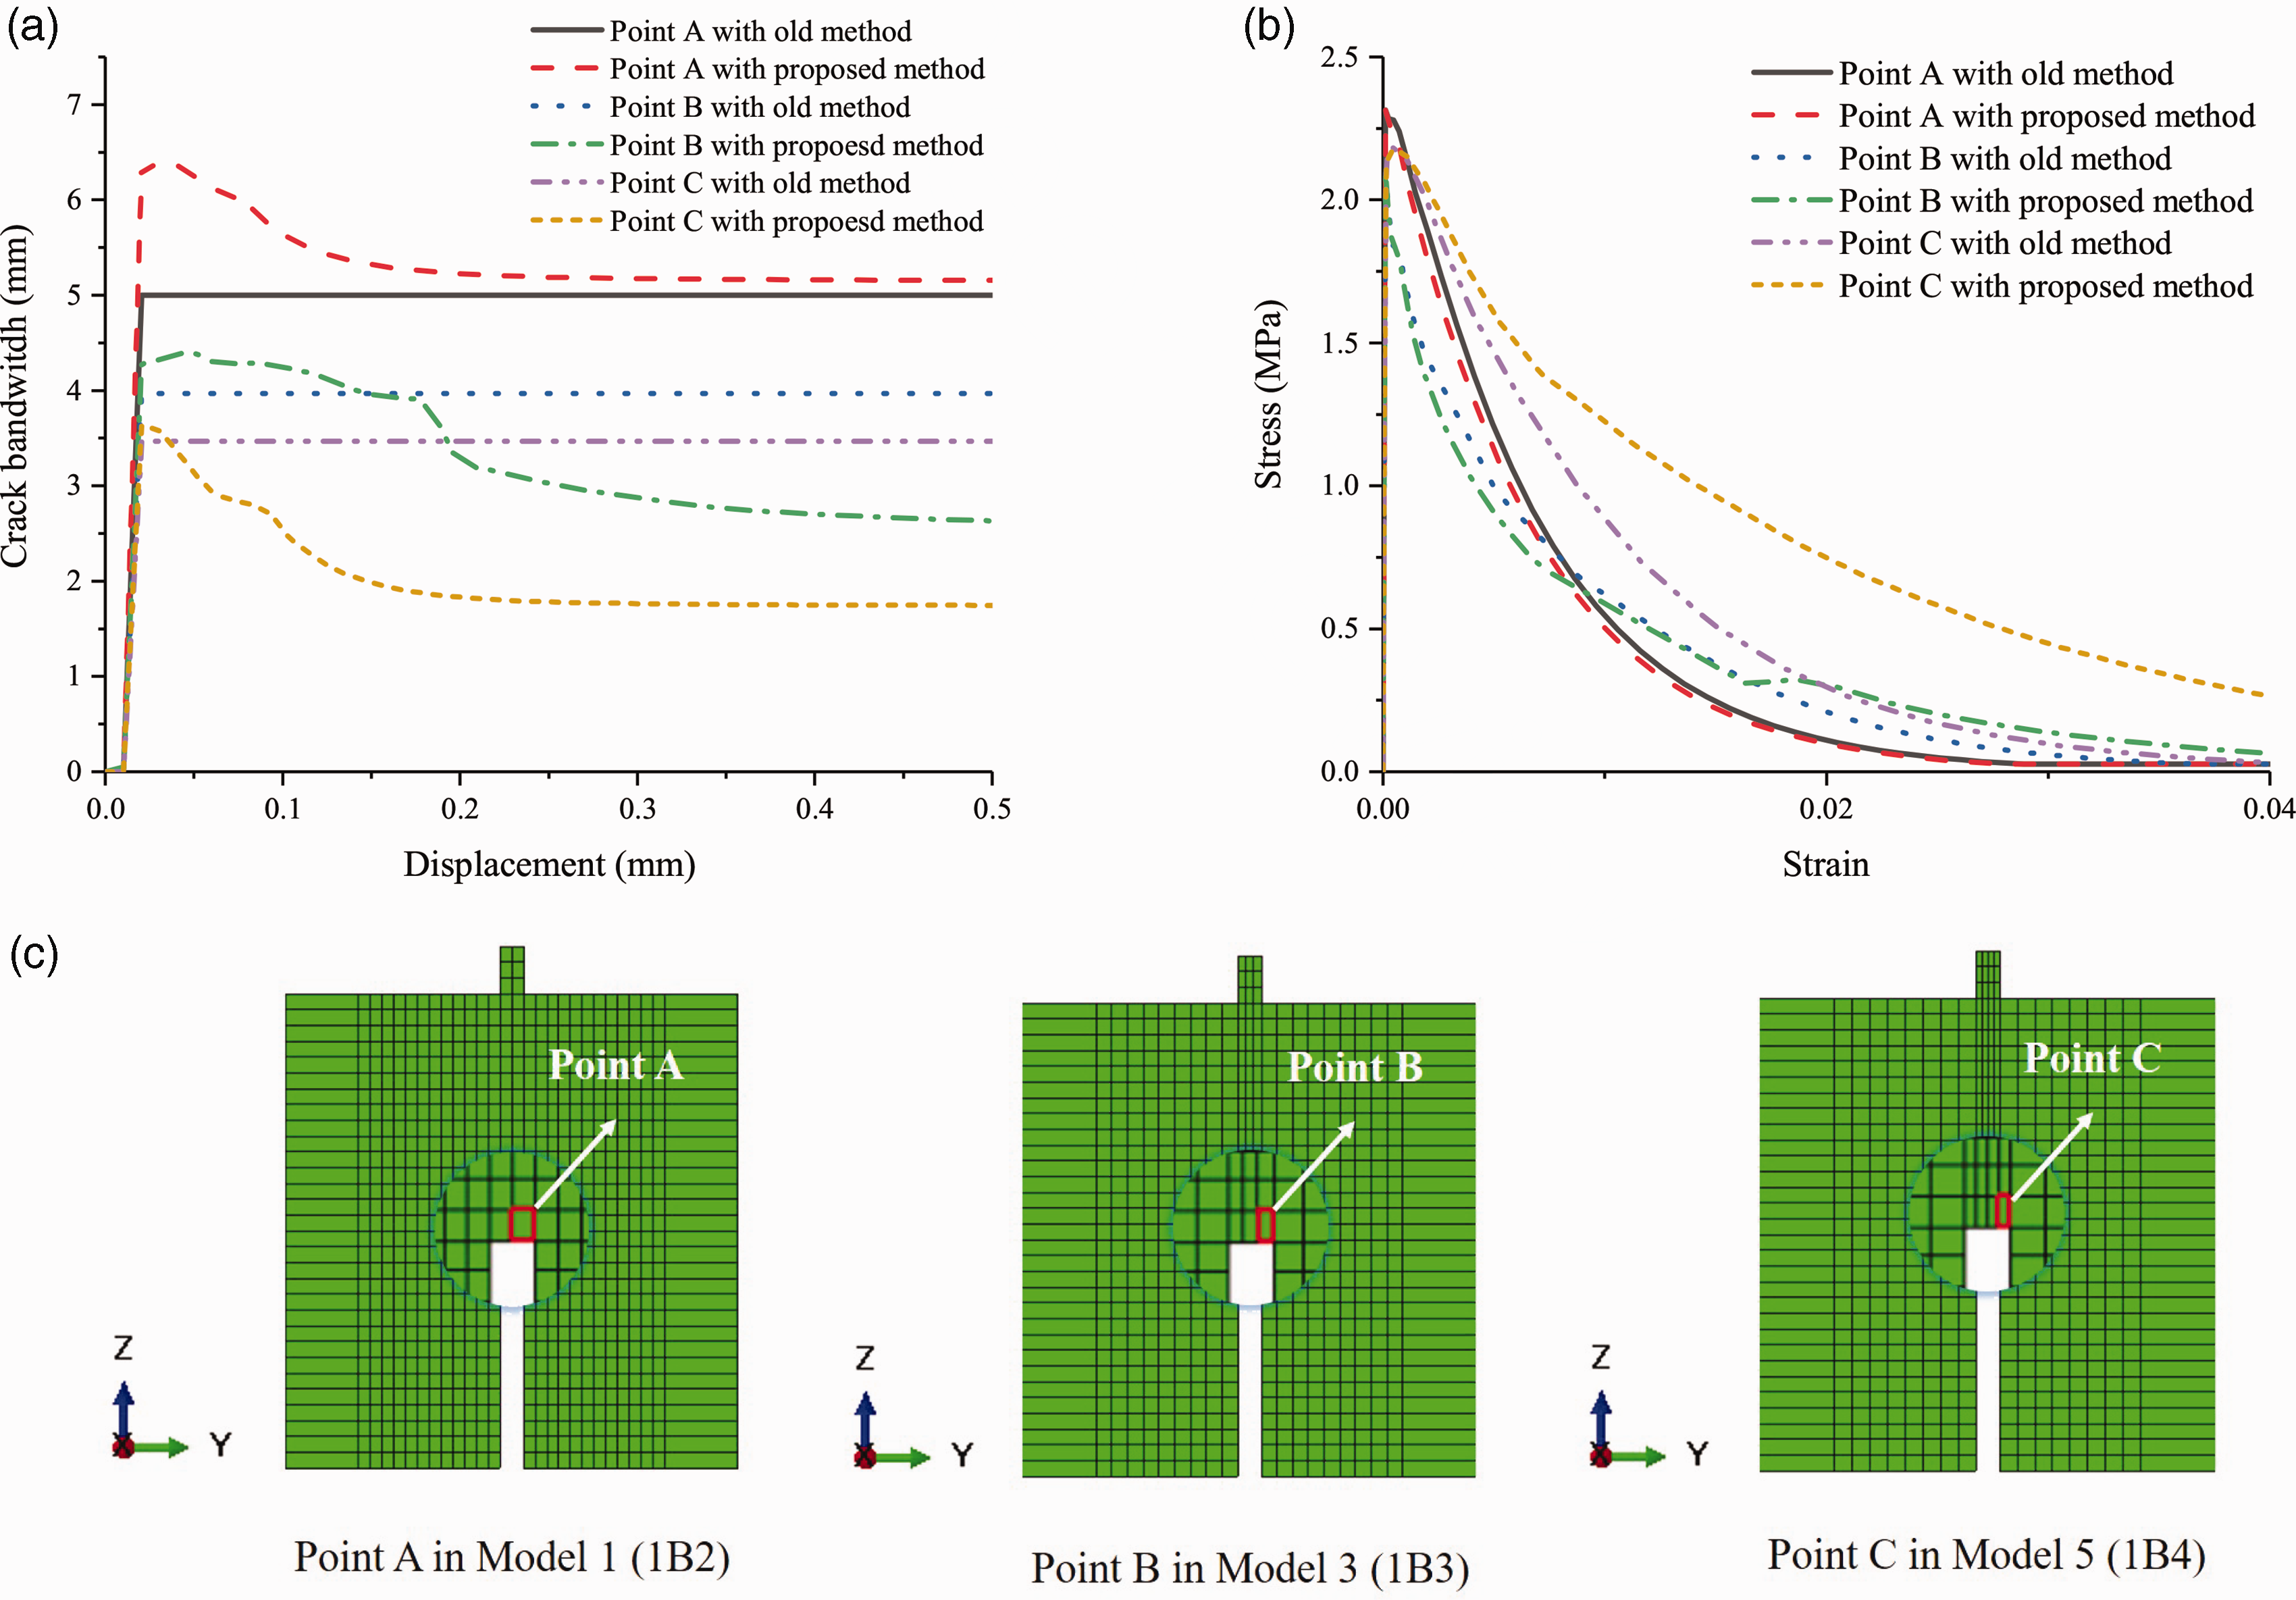
Comparisons of performance of the previous method and the proposed method: (a) Comparison of crack bandwidths; (b) Comparison of stress-strain curves and (c) Indication of selected Gauss points.
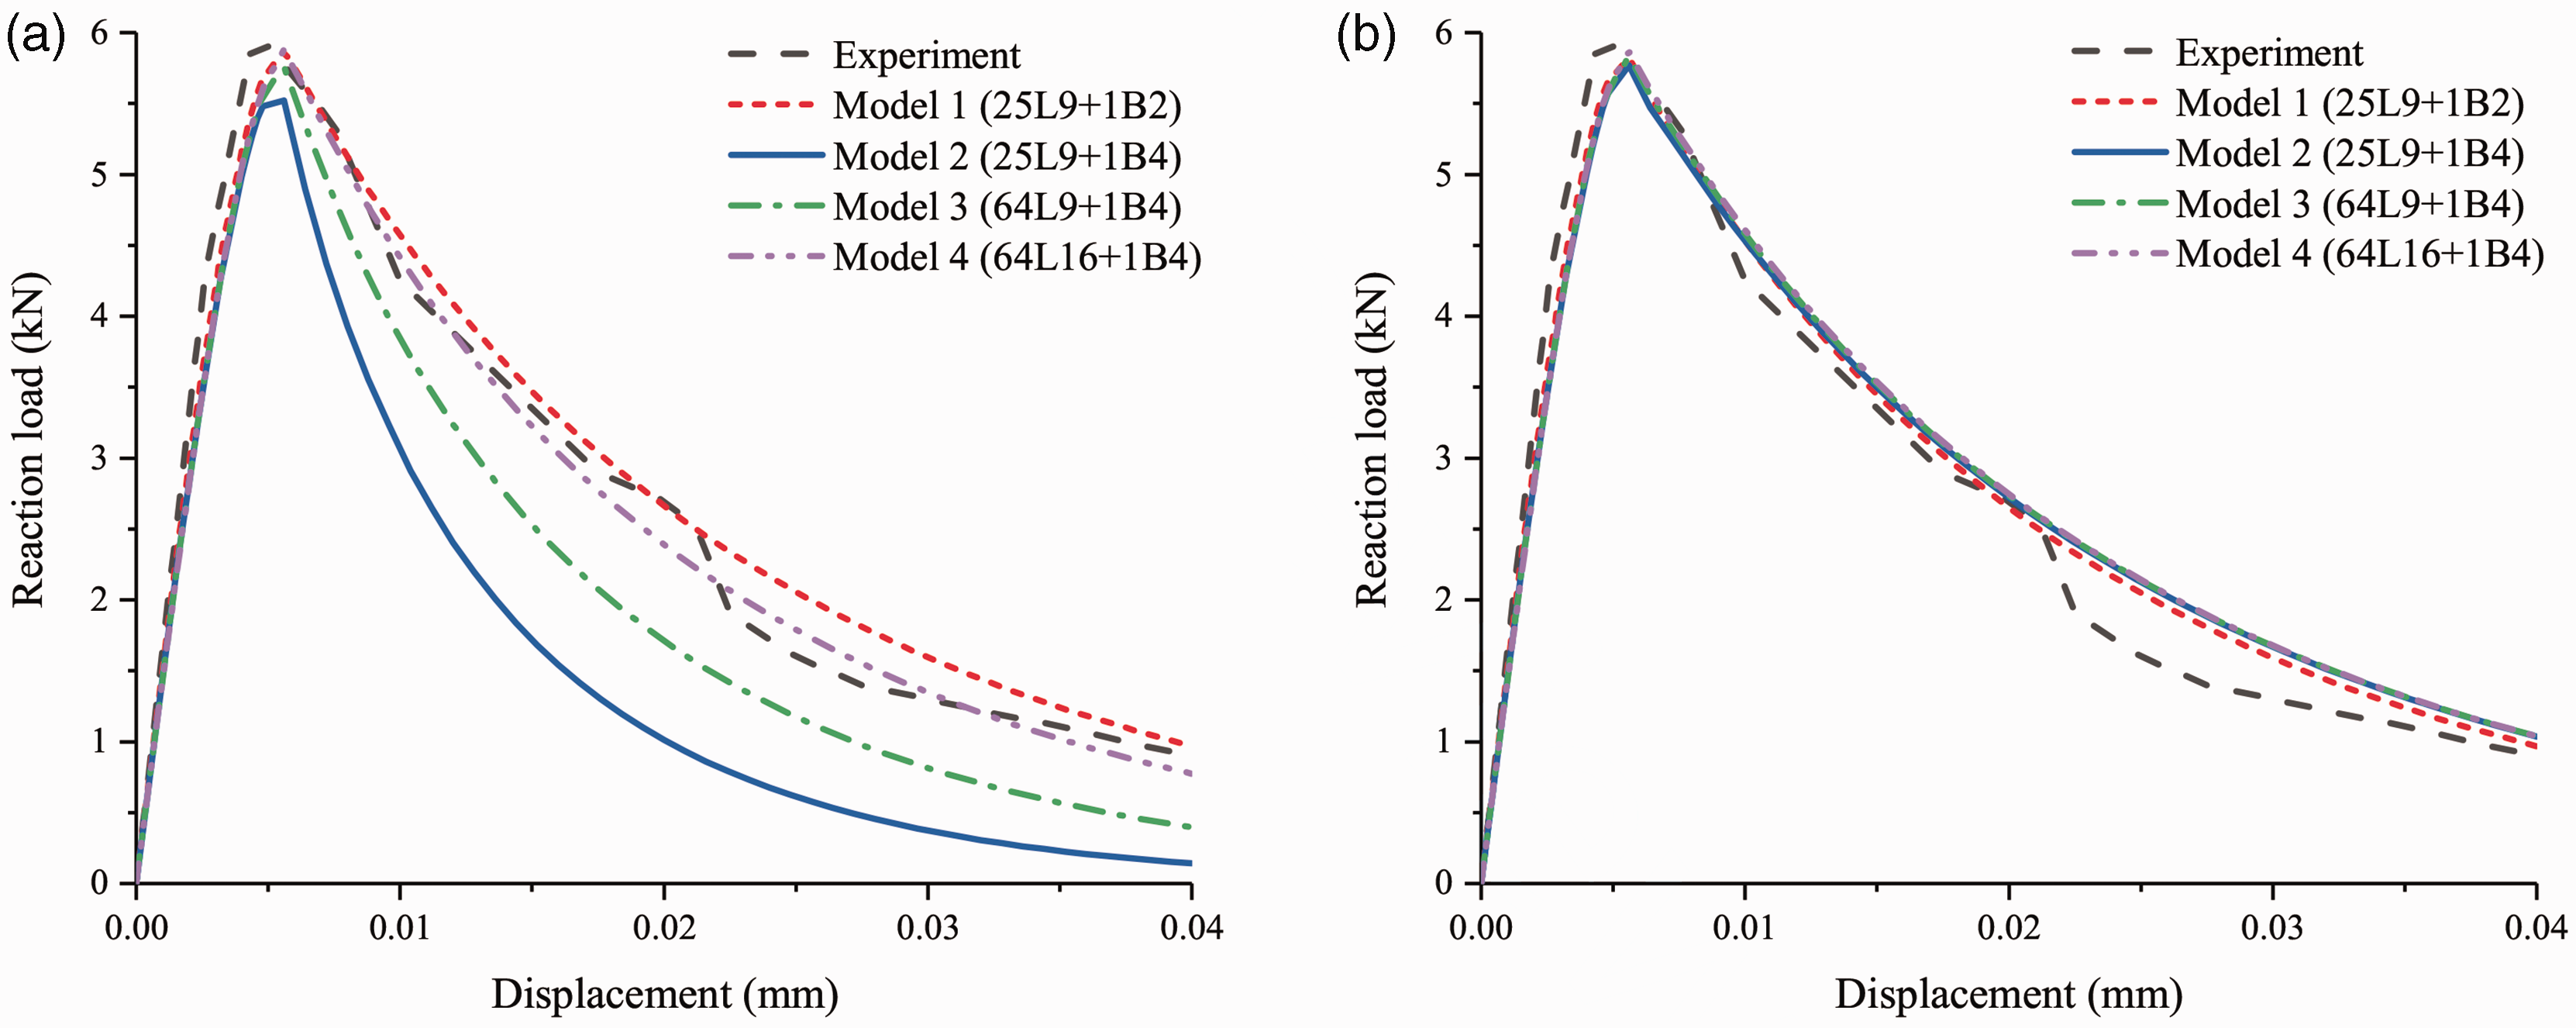
The load-displacement curves of all models based on the previous method by Shen et al. (2022a) and the new method are displayed in Figure 15, including the reference of experimental results. It is expected that Model 1 using both methods shows similar behaviors and good agreement with experimental results. In Figure 15(a), the softening curve of Model 2 is lower than that of Model 1. Similarly, this is observed between Model 3 and Model 4. When B4 elements are used, the softening curves of Model 5 and Model 6 are significantly lower than that of Model 1. This indicates that the previous formulation does not effectively preserve fracture energy and exhibits high mesh sensitivity to mesh configurations when the elements are not cubical.
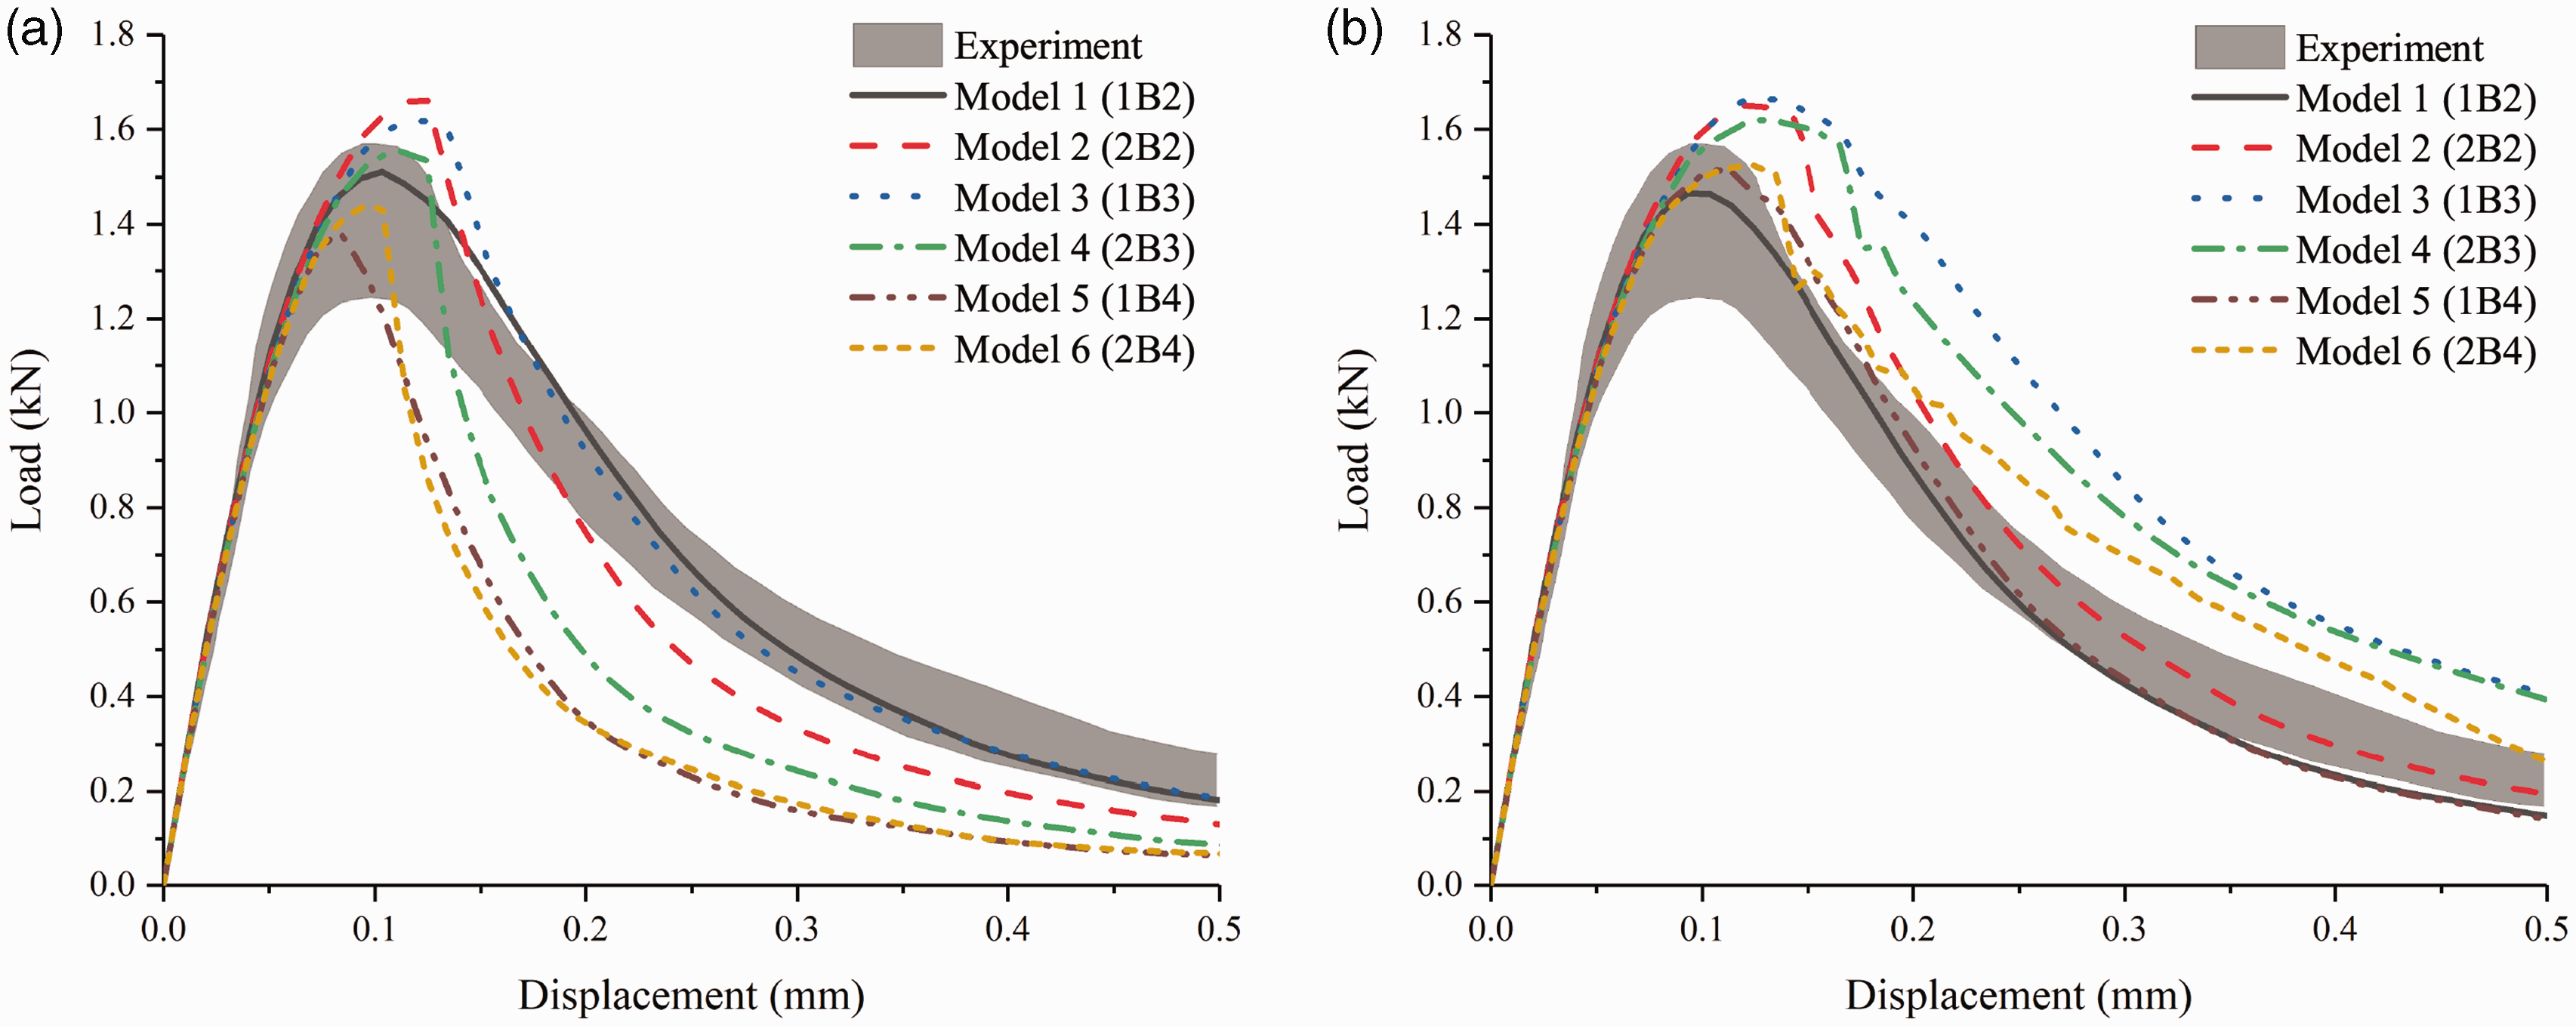
Load-displacement curves from the TPB test: (a) Previous formulation and (b) Proposed new formulation.
As shown in Figure 15(b), the peak load of Model 2 is slightly above the experimental results when two B2 elements are used in the notch. However, the fracture energy in Model 2 get preserved, as the softening curve is almost parallel to that of Model 1. Similarly, Model 5, which includes one B4 element in the notch, exhibits similar structural behavior in terms of stiffness, peak load, and softening curve as Model 1. Model 6, which includes two B4 elements in the notch, exhibits similar behavior during the first half of loading. However, the later softening curve is slightly higher than the experimental results, which may suggest that some part outside the notch was damaged (as shown in Figure 12). Both Model 3 and Model 4 give higher ultimate loads and softening curves than the experimental results, due to the change in damage propagation leading to an overestimation of dissipated energy. However, the structural behavior of Model 3 and Model 4 is similar, as demonstrated by the similar load-displacement curves in Figure 15(b) and damage distributions in Figure 12.
Overall, the new method appears to be effective in preserving fracture energy and avoiding zero energy dissipation. However, some slight deviations are observed in models with B3 elements, indicating that mesh sensitivity to B3 elements remains an issue. Nonetheless, this sensitivity can be eliminated if B2 and B4 elements are used, and it is recommended to allocate a single beam element in the notch using this proposed method.
Four point bending test
The plain concrete beam with a small notch in the midspan, which is designed to estimate fracture energy through a four-point bending test (FPB), is a relatively new benchmark. The experimental campaign for this benchmark was reported in (Yin et al., 2019). The FPB experimental test is significant because Yin et al. (2019) found that fracture energy can be accurately measured based on pure bending, without any interference from shear effects. To date, this test has only been modeled in (Arruda et al., 2022), where a 2D analysis was conducted.
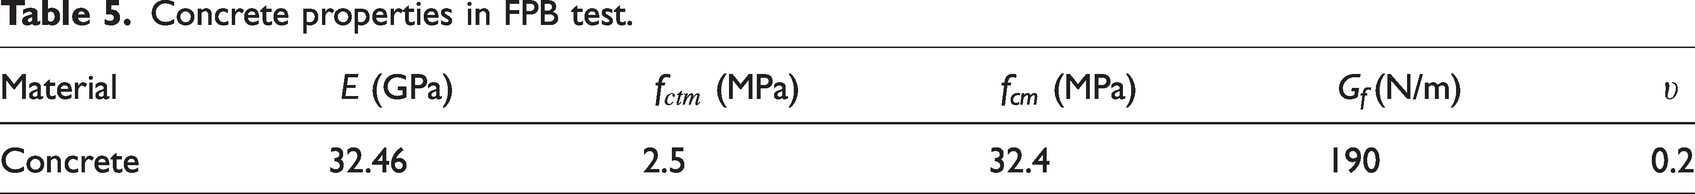
The geometric details and boundary conditions of the notched concrete beam are shown in Figure 16, which are identical to those in (Yin et al., 2019). The notch has a thickness of only 3 mm, making it smaller and more difficult to simulate than in the TPB test. The concrete properties used in the benchmark, as reported in (Yin et al., 2019), are listed in Table 5.
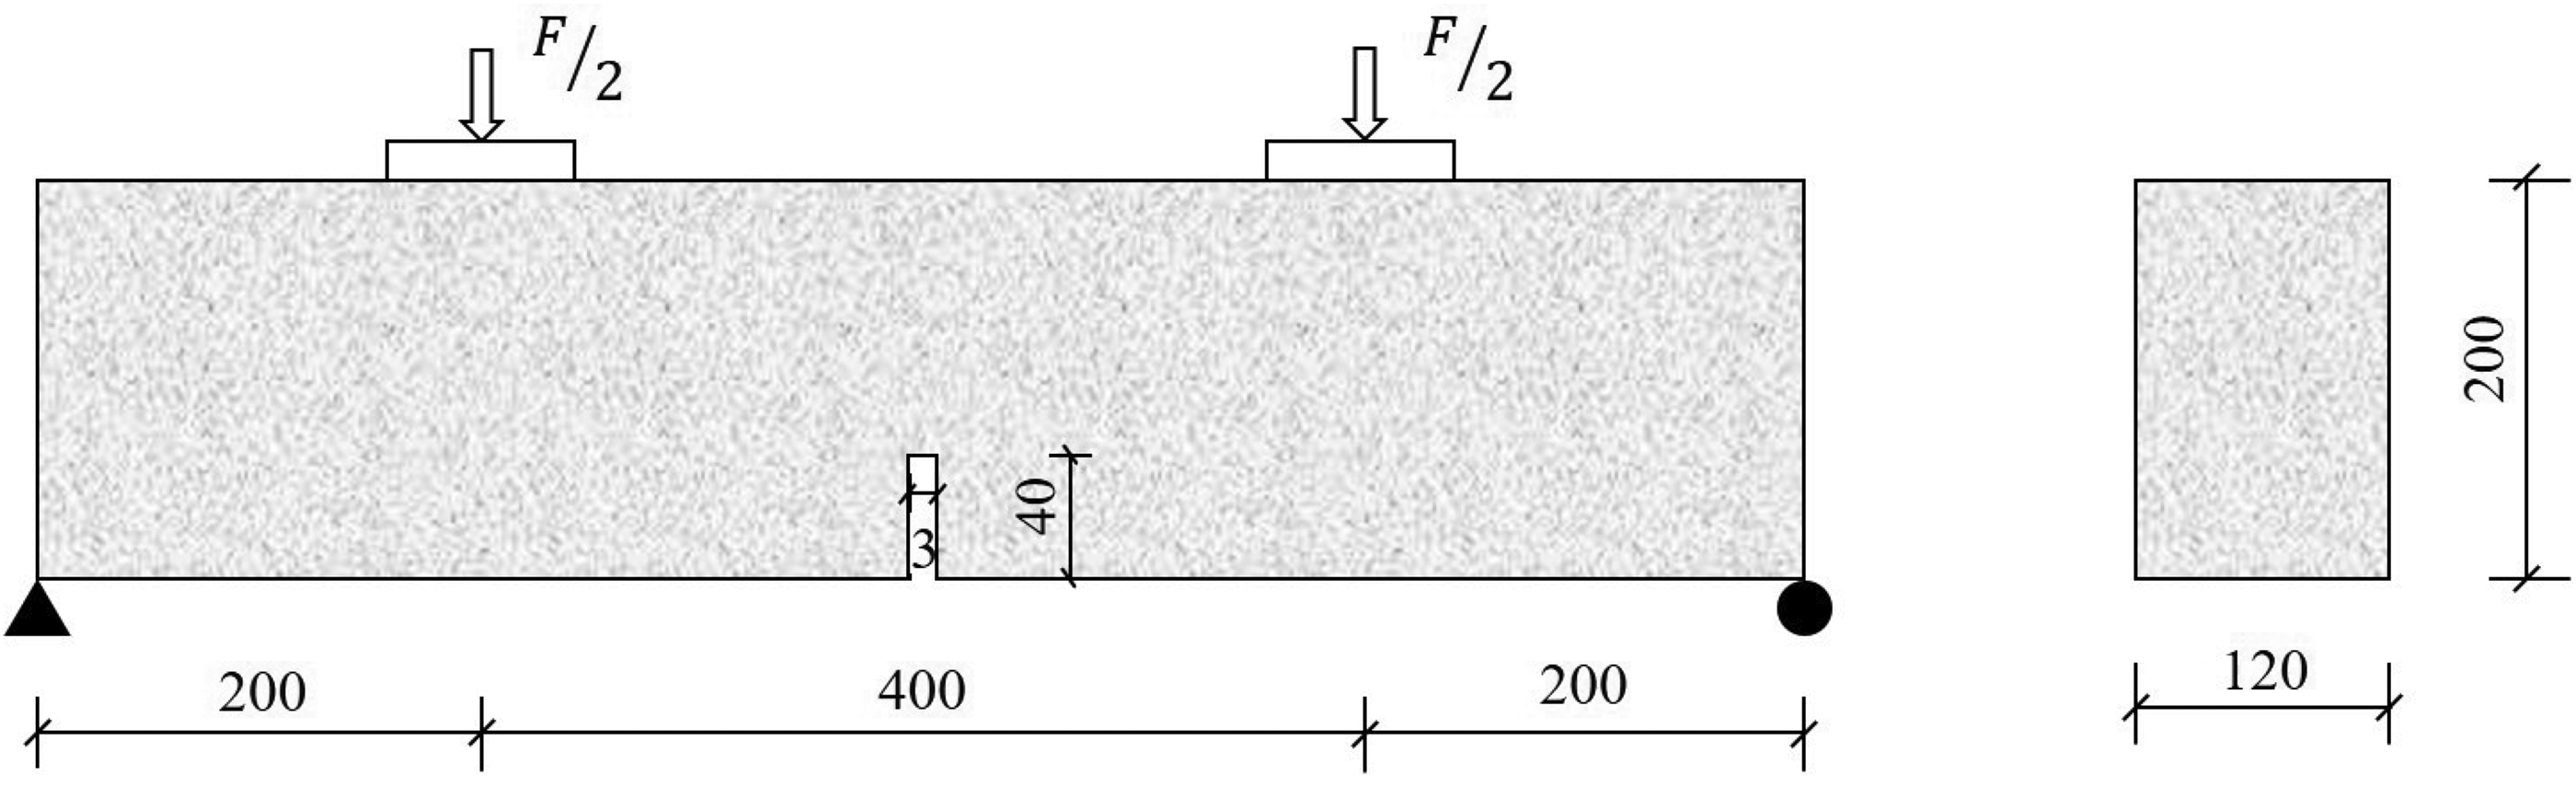
Concrete beam in FPB test: geometry and boundary conditions (Unit:mm).
Concrete properties in FPB test.
The mesh assignment for this case, shown in Figure 17, is similar to that in the TPB test. The discretization of the cross section in the FPB test is consistent across all models, using L9 elements with a side length of 40 mm. The purpose of this case is to evaluate the suitability of the new method for FPB modeling, as well as the sensitivity of structural behavior to the order of beam elements. To this end, three different models with the same number of beam elements, but in different orders, are listed in Table 6.
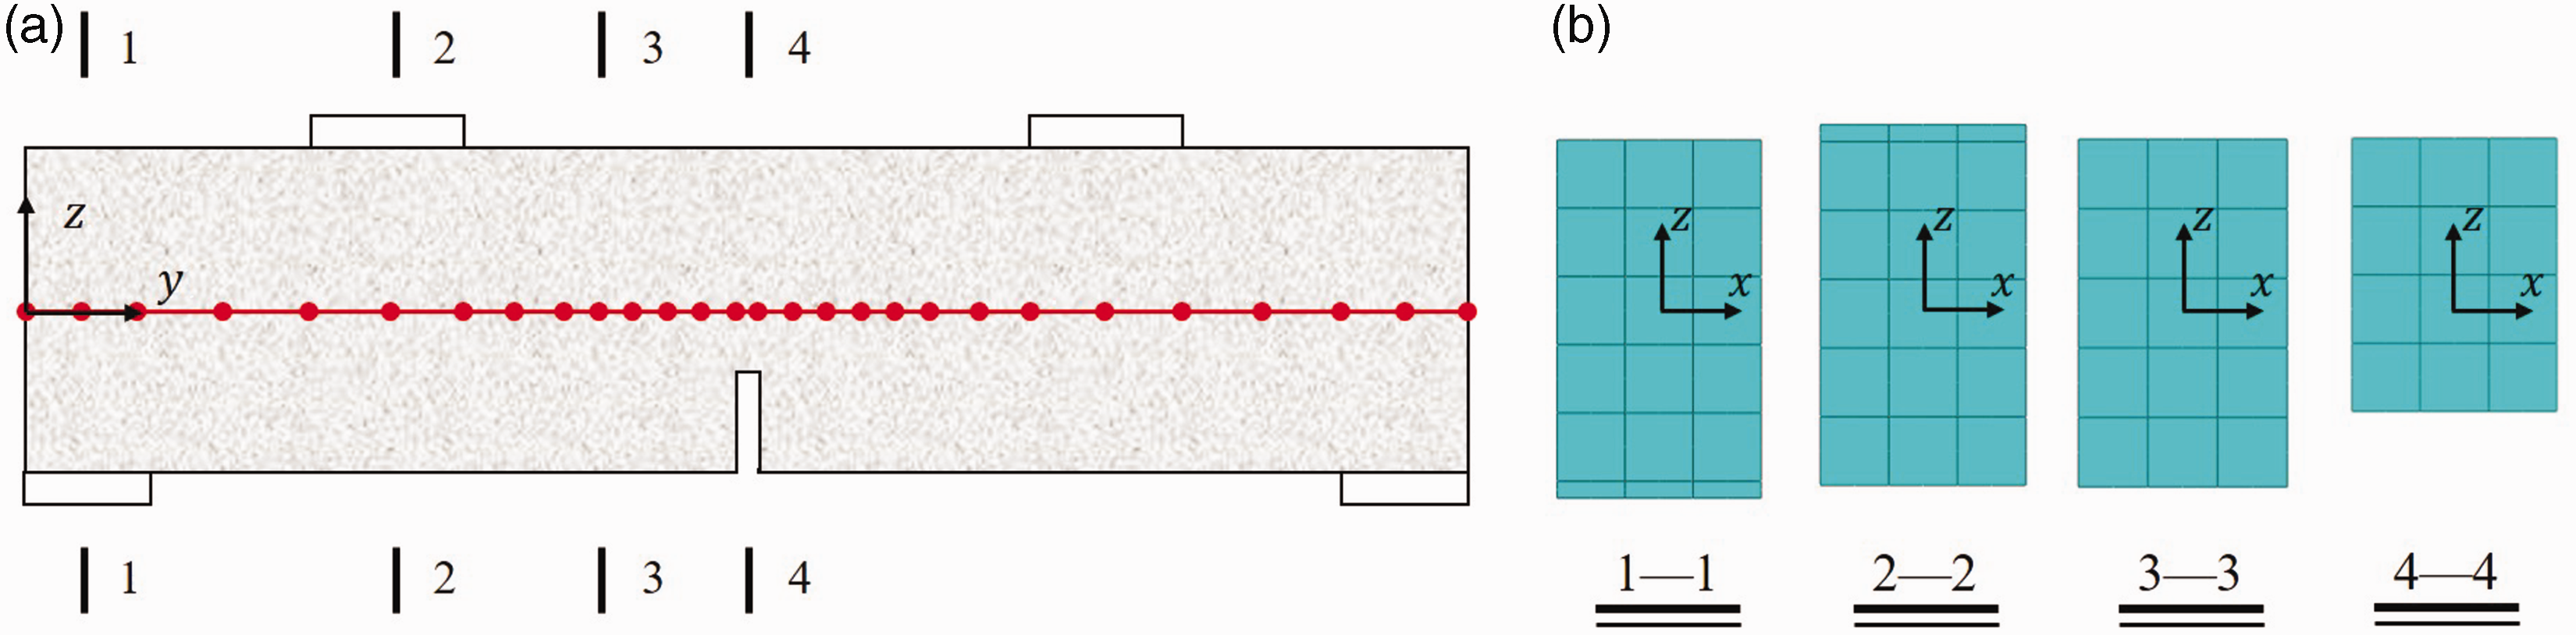
Mesh assignment of the notched concrete beam in FPB test: (a) Beam cross-sectional and (b) cross-sectional discretization.
Beam element configuration in FPB test.
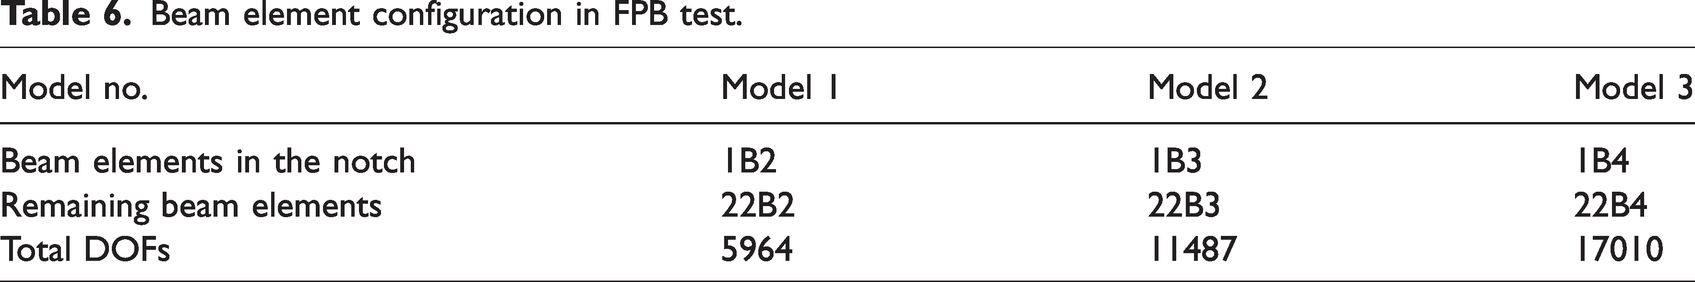
Figure 18 shows the final damage distributions of the three models. Model 1 and Model 3 show the expected damage distributions, with damage localized in the notch. However, when B3 elements are used in the notch, the damage spreads outside the notch, potentially leading to an overestimation of dissipated energy.
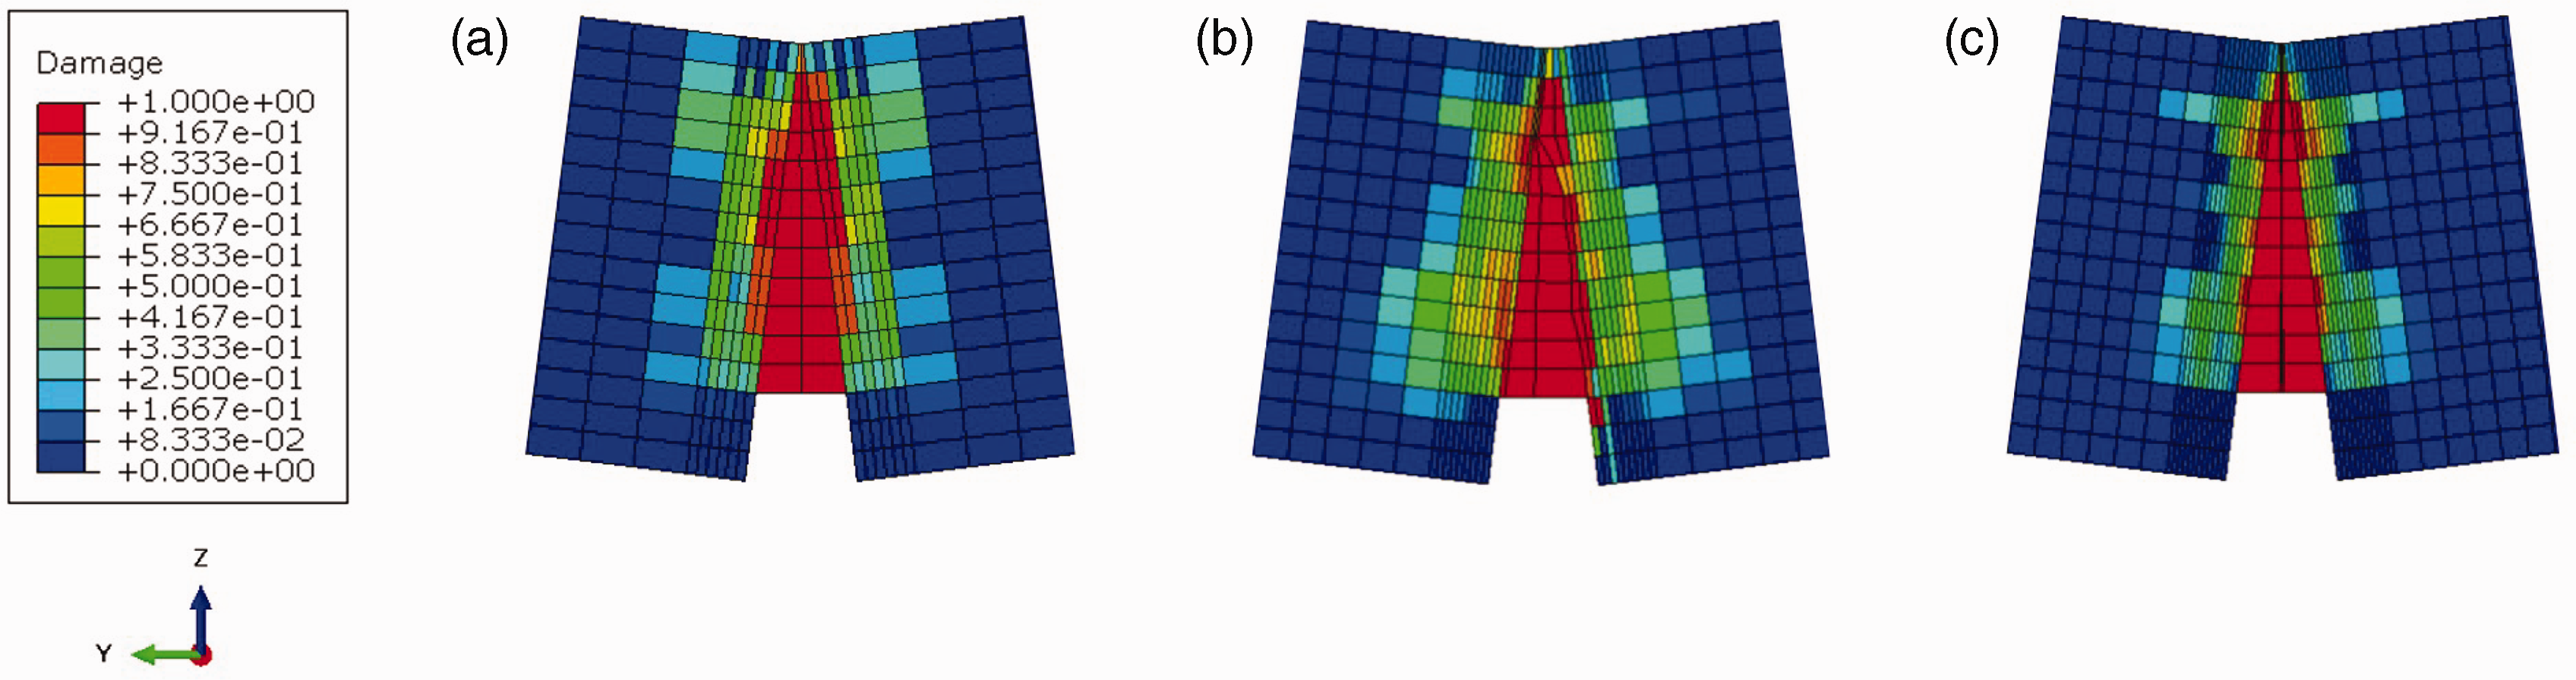
Damage distribution of (a) Model 1, (b) Model 2, and (c) Model 3 in FPB test.
Due to the small size of the notch, all mesh configurations based on the previous method from Shen et al. (2022a) are unlikely to produce accurate results. Therefore, Figure 19 only displays the load-displacement curves of the three models based on the new method, along with the experimental results for comparison. All three models have similar initial stiffness at the beginning, which is in good agreement with the experimental results, indicating no convergence issues even for Model 1 with the lowest DOFs. The ultimate loads and softening curves of Model 1 and Model 3 are similar, while Model 2 exhibits slightly higher results. Although the structural behavior of Model 2 is the closest to the experimental results, the change in crack path in Model 2 warrants further examination. In general, the new method appears to be effective in preserving fracture energy in this case. However, structural behavior in CUF models remains sensitive to the use of B3 elements.
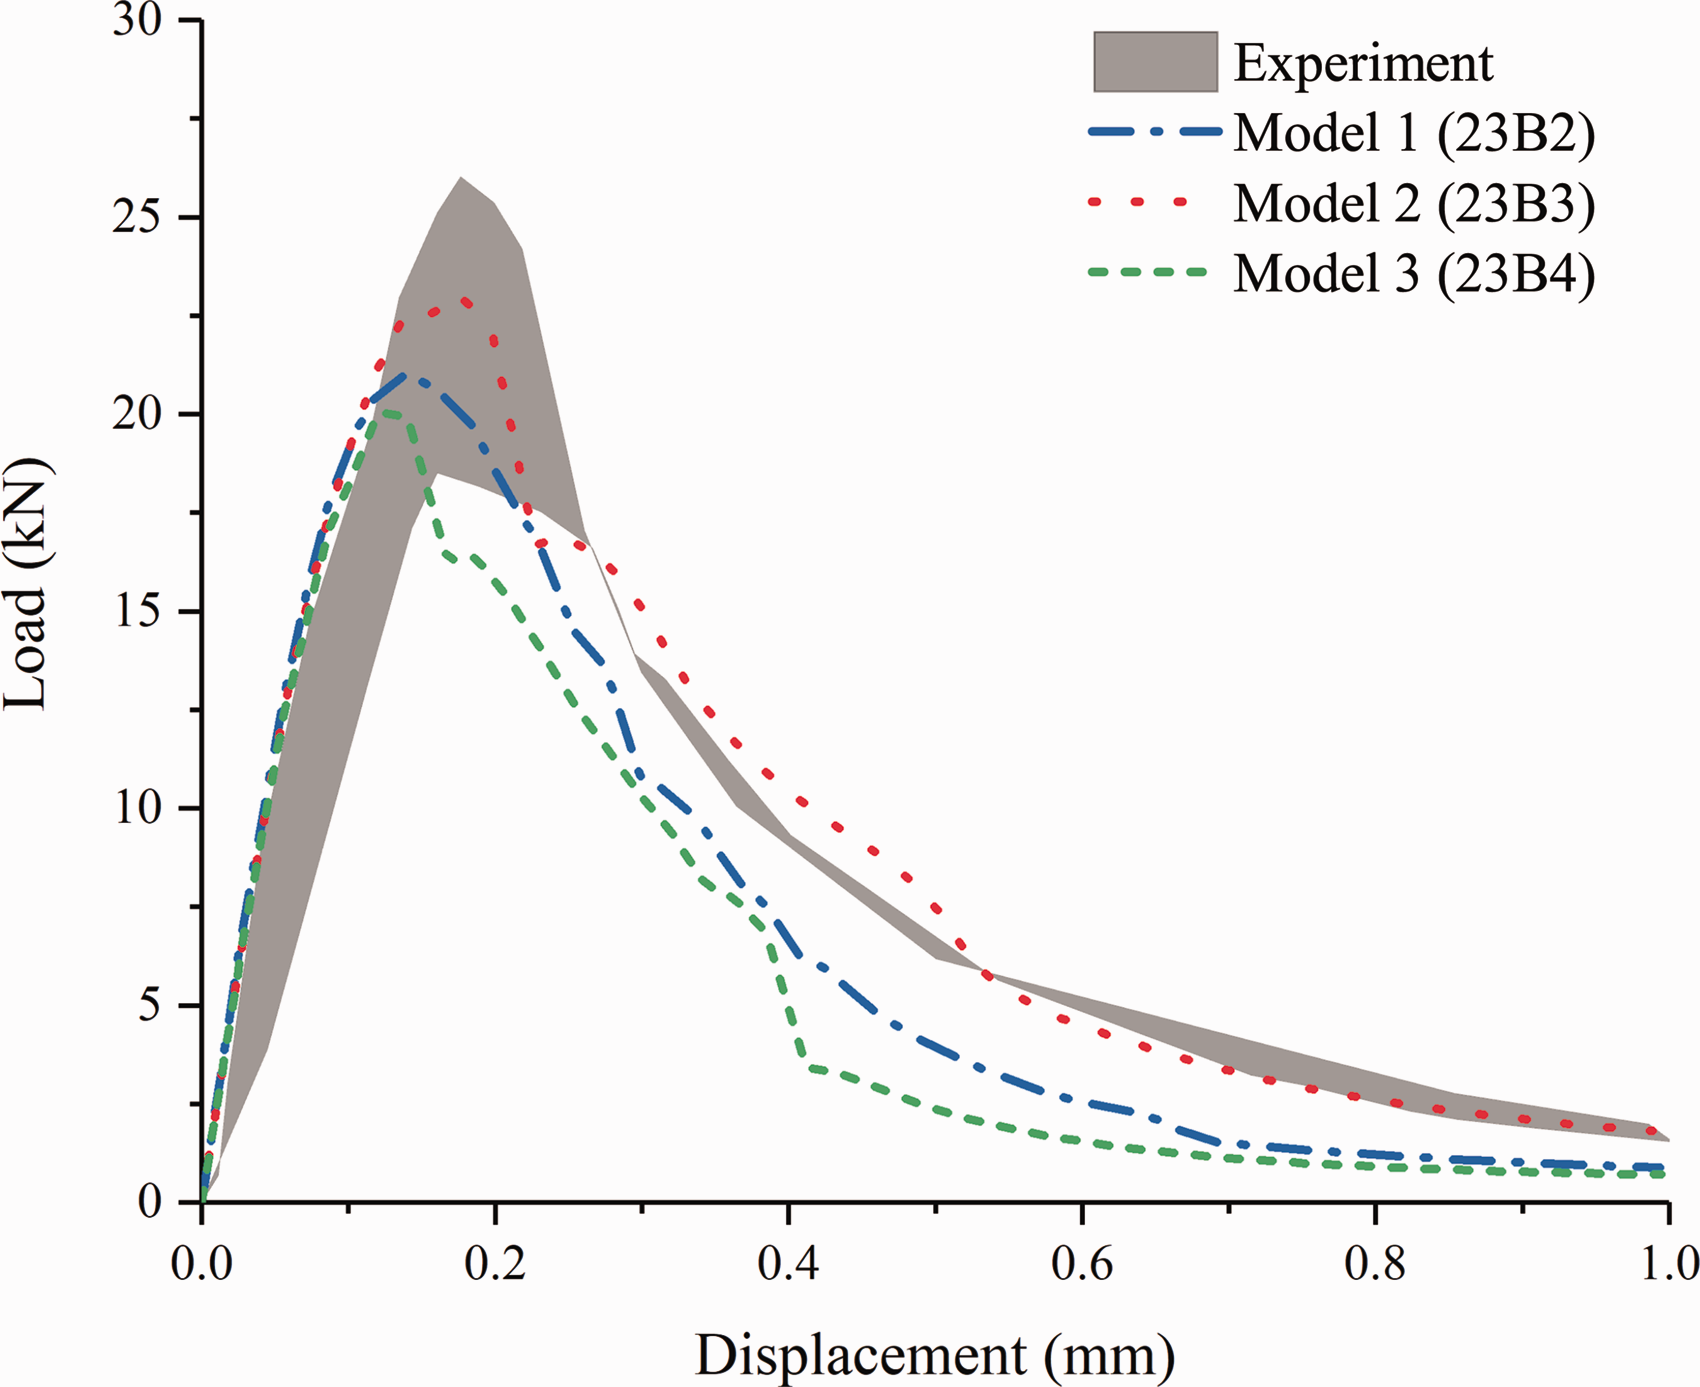
Load-displacement curves from the FPB test.
Conclusions
This paper presents a modified Mazars damage model with a consistent crack bandwidth specifically designed for higher-order beam theories based on CUF. The constitutive laws of concrete used in this model are based on fib Model Code 2010, which provide the concrete tensile and compressive damage evolution laws. The CUF model accurately captures the softening and damage behavior of concrete using a fracture energy regularization technique, as demonstrated by the results from three classic benchmarks. The following conclusions can be drawn based on the numerical and experimental results from these benchmarks:
The use of higher-order elements can lead to strain localization, such that strain-softening occurs only at some, rather than all, Gaussian points within a single element. This requires careful consideration in the estimation of crack bandwidth. The primary contribution of this work is the development of an improved method for estimating crack bandwidth, specifically tailored for higher-order beam theories based on CUF and taking element dimension, element order, and crack direction into account. The ability of this method to produce objective results has been demonstrated through validation at the structural level. The new crack bandwidth estimation method enables the retention and utilization of the high efficiency and low computational cost of CUF, as the choice of beam elements and Lagrange elements can be made independently. The use of B3 elements leads to an underestimation of crack bandwidth, which may require further modification in the future. Therefore, it is recommended to use B2 and B4 elements instead.
Footnotes
Declaration of conflicting interests
The author(s) declared no potential conflicts of interest with respect to the research, authorship, and/or publication of this article.
Funding
The author(s) disclosed receipt of the following financial support for the research, authorship, and/or publication of this article: This work has been partly supported by Fundação para a Ciência e Tecnologia, under the Transitional Standard – DL57/2016/N3/UI/CERIS/CT/165/2018. The author is also grateful for the Foundation for Science and Technology’s support through funding UIDB/04625/2020 from the research unit CERIS.