
Abstract
Several continuum damage mechanics (CDM) modelling approaches for predicting creep deformation of tempered ferritic steels have been developed in the literature, which have evolved from efforts to extend the operability of power plant components. Few of these models, however, focus on damage assessment of ex-service states of power plant steels through the extraction of damage parameters. Furthermore, few CDM approaches leverage the high density of creep curve data available through full-field strain measurement techniques such as digital image correlation (DIC). This work uses multiple creep curves obtained from DIC computed strain data at several stresses and temperatures from individual specimens of X20CrMoV12-1 (X20) piping steel. These curves serve as input data to a modified Oruganti continuum damage mechanics (CDM) model whereby microstructural-specific damage parameters can be extracted. Good agreement is noted between CDM-extracted parameters and microstructural, creep cavity density and hardness damage indicators. Damage parameters based on subgrain growth are particularly sensitive to the ex-service state of the X20 steel. The proposed CDM approach using DIC computed creep curves is shown to be a material efficient alternative to traditional damage assessment methods of ex-service material.
Keywords
Introduction
The operation of coal-fired power stations beyond their design lifetimes has highlighted the need for improved assessment techniques to better measure the accumulated creep damage present within critical components. Steam piping steels often used in older generation plants, such as the 12% Cr steel X20CrMoV12-1 (X20), exhibit complicated degradation mechanisms which involve interacting microstructural factors; creep strength of X20 and other 9–12% Cr tempered martensitic-ferritic steels stems from a fine substructure with dense dislocation structures stabilised by fine precipitates, such as MX carbonitrides and M23C6 carbides. Plant service exposure drives the evolution of these thermodynamically unstable features, including the coarsening of subgrains, recovery of dislocations, coarsening of precipitates and the development of new precipitates such as Laves and Z phase (Aghajani et al., 2009).
The last half of the century has seen the promulgation of several damage assessment techniques in an effort to extend thermal power plant operability. Methods include, among others, physical evaluations, such as hardness and surface cavity replica measurements, constitutive relations of creep (Cardoso et al., 2015), such as the description of minimum creep rates through Norton’s power law (Abdallah et al., 2014), rupture life predictions such as the Larson-Miller parameter (Larson and Miller, 1952) and full-curve descriptions including the
Some improved creep relations have demonstrated difficulty in isolating differences between service-aged materials. In the previous work of the authors (van Rooyen et al., 2019) for example, insignificant differences were found between ex-service X20 states in terms of precipitate-dependent threshold stress calculated using a modified power law relation, despite large differences in the corresponding creep curves. Classical creep models also do not universally capture the different creep mechanisms that dominate as the material state, testing temperature and stress conditions are altered. Parameters, such as activation energy and stress exponents, have been found to be insensitive to the state of material exposure and therefore do not lend themselves as effective damage indicators (El Rayes and El-Danaf, 2017; van Rooyen et al., 2019).
Continuum damage mechanics (CDM) models provide a framework by which several coupled damage laws phenomenologically track the evolution of microstructural and cavitation factors during creep by including sets of dimensionless damage parameters. The advantage of physically based CDM methods is the adaptability of these damage descriptors to physical microstructural characterisation through electron microscopy, allowing the entire creep curve to be modelled within creep regimes with different loading conditions and operating mechanisms (McLean and Dyson, 2000).
A large body of literature has focused on the application of CDM to 9–12% Cr steels, which evolved from the works of Dyson and McLean (Dyson and McLean, 1998; Dyson, 2000; McLean and Dyson, 2000) who pioneered the incorporation of several damage parameters into the fundamental hyperbolic sine creep rate equation that lies at the root of CDM. Since then, research has adapted various combinations of these damage parameters, with most of the approaches focusing on long-term creep modelling of power plant alloys. For 10% Cr steels, Kadoya et al. (1997) proposed a model that combined the effects of MX particle coarsening, dislocation accumulation and Mo solute depletion (due to Laves phase Fe2Mo precipitation) to predict creep strain-time curves for lives in excess of 6 000 h. This model was later adapted by Semba et al. (2008) who recognised that a dislocation recovery damage parameter is more appropriate for tempered martensitic-ferritic steels and included this as an indirect means of accounting for subgrain coarsening in the modelling of 9% Cr steel. The model formulation was later expanded in the work of Basirat et al. (2012) to include a cavitation damage parameter. However, the authors did emphasise the technical challenges associated with quantifying the dislocation densities required by a dislocation-based creep model.
There has also been evidence in the literature (Aghajani et al., 2009; van Rooyen et al., 2019; Yin and Faulkner, 2006) to suggest that instead of MX growth, the main particle damage parameter in X20 steel is related to the coarsening of the subgrain-pinning (intergranular) M23C6 precipitates. This was recently implemented in the multi-precipitate CDM model developed by Christopher and Choudhary (2019) in modelling long-term creep of Grade 91 steel. In addition to thermally induced coarsening, straining has also been shown to accelerate the growth kinetics of precipitates. A strain component is included in a particle damage evolution law by Murchú et al. (2017), who revealed that such an approach does not improve parameter correlation in short-term tests but does become significant when considering creep strain contributions across weld regions (Murchú et al., 2019). Instead, the need for subgrain damage evolution was identified.
Oruganti et al. (2011) focused on essential microstructural factors that contribute to creep degradation in CDM modelling of 9 – 10% Cr steels, including subgrain and particle coarsening. One of the overarching benefits of this model is the reduction in the number of parameters fitted to 12, of which 9 are physically bounded. Even more parameters can be combined under certain testing conditions such as for isothermal testing. Furthermore, the work was one of the first efforts to directly model subgrain growth as a damage parameter, which is considered vital to X20 modelling due to the sensitivity of this parameter to ageing through service exposure (Aghajani et al., 2009; van Rooyen et al., 2019).
The literature is currently sparse in terms of the application of CDM to service-exposed power alloys. Dyson and Osgerby (1993) and later McLean and Dyson (2000) applied CDM models to service-exposed 1Cr0.5Mo steel by adjustment of two non-damage parameters. More recently, efforts have been made to capture elements of creep degradation of P9 steel subjected to different heat treatments through a comparison of fitted microstructural rate constants (Christopher and Choudhary, 2018; Pan et al., 2017) successfully applied the Oruganti model to the boiler steels T91 and T92, although it is unclear whether ex-service or virgin material was used.
One of the main challenges in using CDM models is the requirement for large datasets at different stress or temperature states to fit parameters (Dyson, 2000; Yin and Faulkner, 2006). Service-exposed steel is often in limited supply and can only be removed in small sections from repaired components during planned station maintenance periods (Gupta et al., 2015). Measurement of multiple creep curves at various temperatures and stresses requires multiple specimens and substantial amounts of material and testing time. There has been little attempt to interface CDM with modern image correlation methods that presently lie at the heart of full-field experimental mechanics, let alone the application to service-exposed power engineering alloys.
In contrast to conventional deformation measurement solutions such as extensometers, digital image correlation (DIC) allows full-field displacement measurement by spatially tracking unique speckle features within subset windows discretised from sequential digital images (Schreier et al., 2009). Previously, the authors developed a technique for obtaining multiple tensile (van Rooyen and Becker, 2018) and creep (van Rooyen et al., 2019) curves at different temperatures and different stresses (van Rooyen et al., 2022) from single specimens of ex-service X20 using DIC. The high spatial density of deformation measurement points obtainable through DIC satisfies the material economy required by the mechanical testing of ex-service X20.
This work builds on previous studies (van Rooyen et al., 2019, 2020, 2022) in which multiple creep data sets were obtained from single-specimen tests using DIC and variable stress and temperature profiles. These data sets serve as input for damage parameter extraction using a CDM model adapted from Oruganti et al. (2011) of various aged forms of ex-service X20 with the main aim of establishing a relationship between the ageing level of ex-service X20 and initial-state (prior to testing) damage parameter magnitudes. A comparative assessment of the fitted parameters between material states is coupled with microstructural analysis and alternative damage assessment methods to confirm the damage category of the tested ex-service X20.
Materials and experiments
The service-exposed X20 steel used in this work was supplied in the form of thick-walled piping from local power stations. The original categorisation of legacy steel in terms of service history is based on cavity density measurement through surface replication with higher damage 1 associated with more severe operating conditions, longer service exposure and higher cavity densities. Figure 1 shows backscatter electron scanning electron microscope (BS-SEM) micrographs highlighting the main microstructural features of the various levels of service exposure of the X20 steel (labelled from here on as virgin and low, medium and high damage X20). Low and medium damage X20 was subjected to 130 000 hours of in-service operation at an operating temperature of 545°C and pressures of 17 MPa and 19.4 MPa, respectively. High damage X20 was exposed to 543°C and 18.1 MPa at 156 000 hours. Further details regarding the service conditions, chemical composition and microstructural characterisation of the materials are detailed in van Rooyen et al. (2019). In summary, increasing subgrain and Cr23C6 precipitate sizes, higher Laves phase volume density, higher cavity density and lower Vickers hardness measurements were noted for increasing damage states. These trends were not as obvious between the low and medium damage states, despite differences in service exposure and experimentally measured creep strain rates.
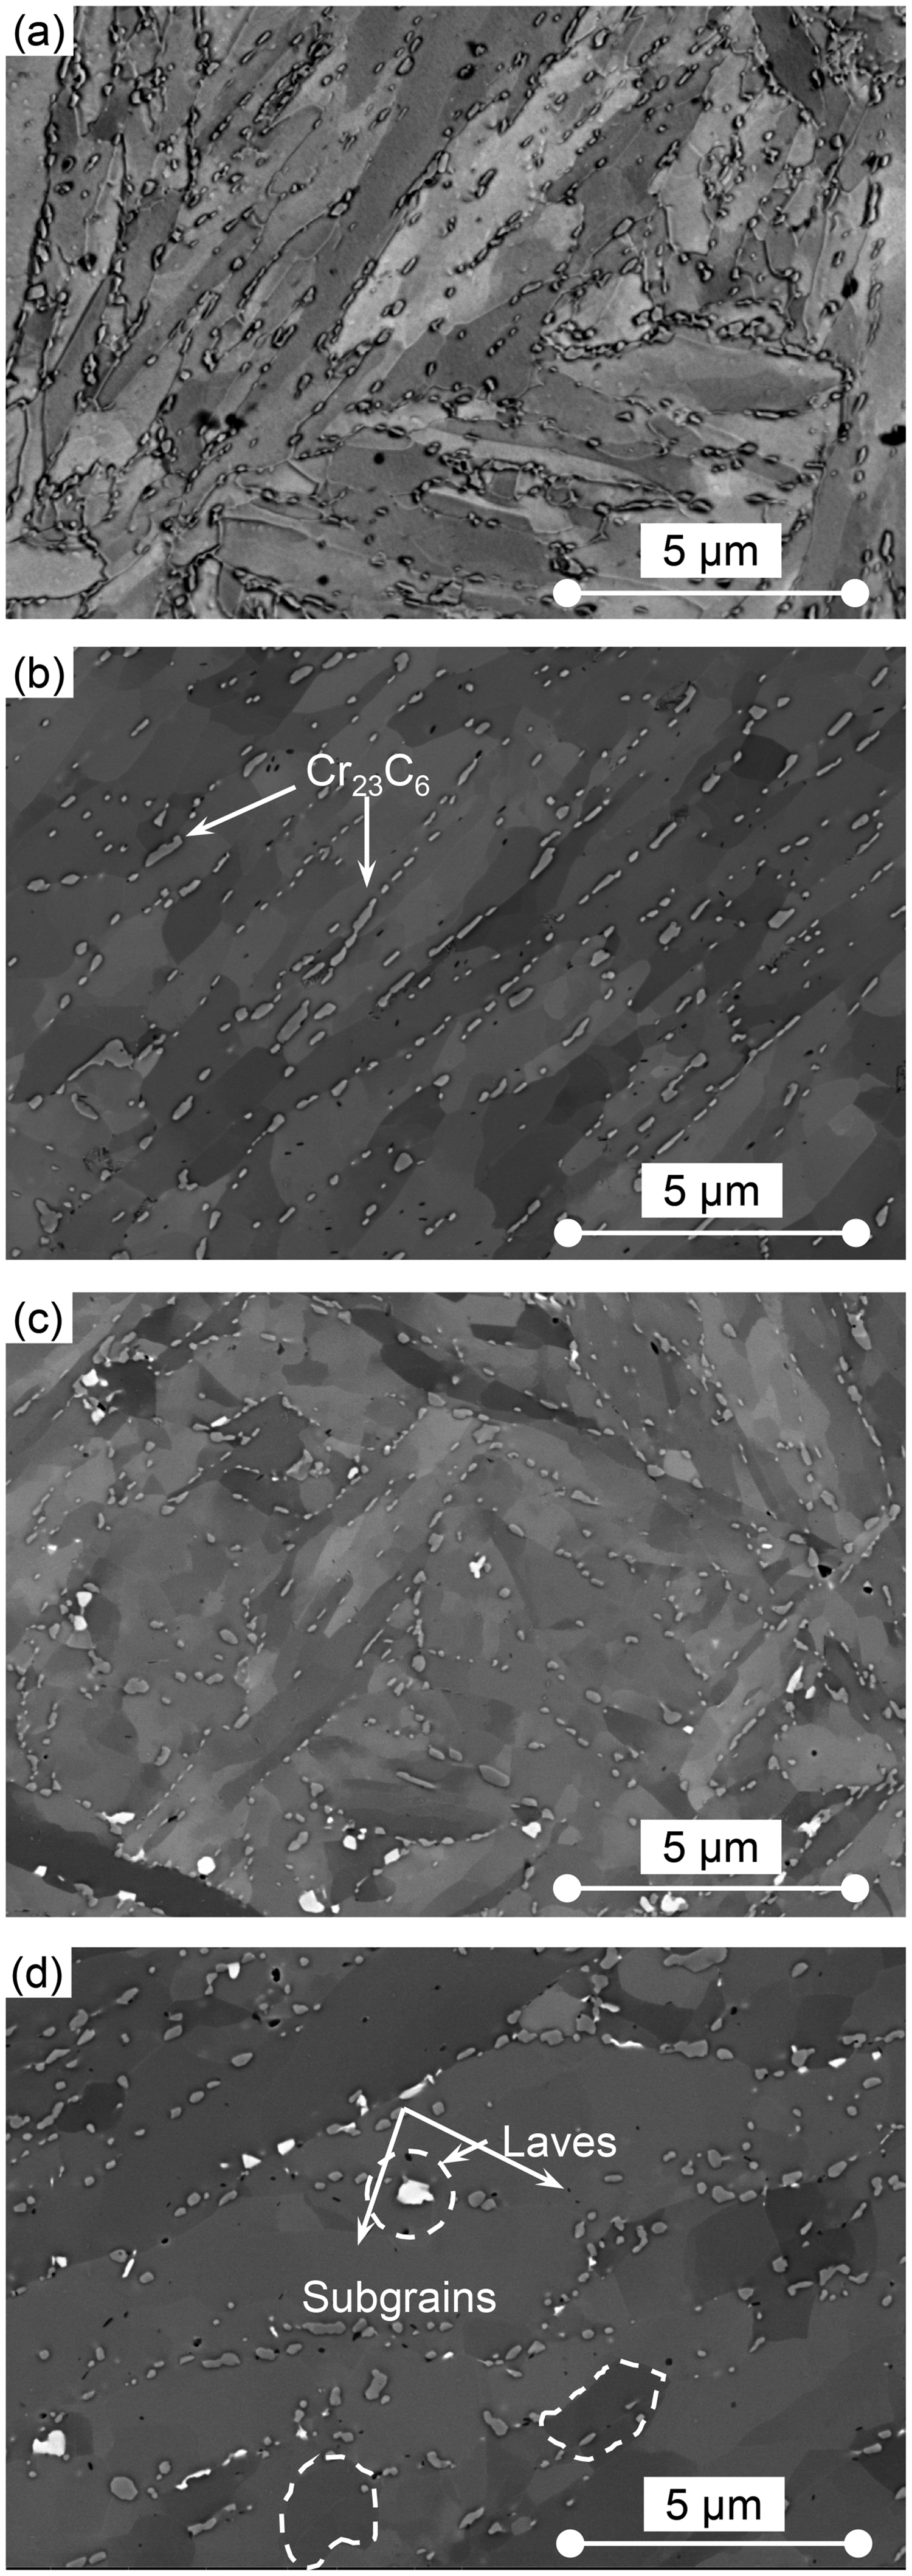
BS-SEM micrographs of (a) virgin and (b) low, (c) medium and (d) high damage X20 steel showing subgrains, Cr23C6 and Mo-rich Laves phase precipitates.
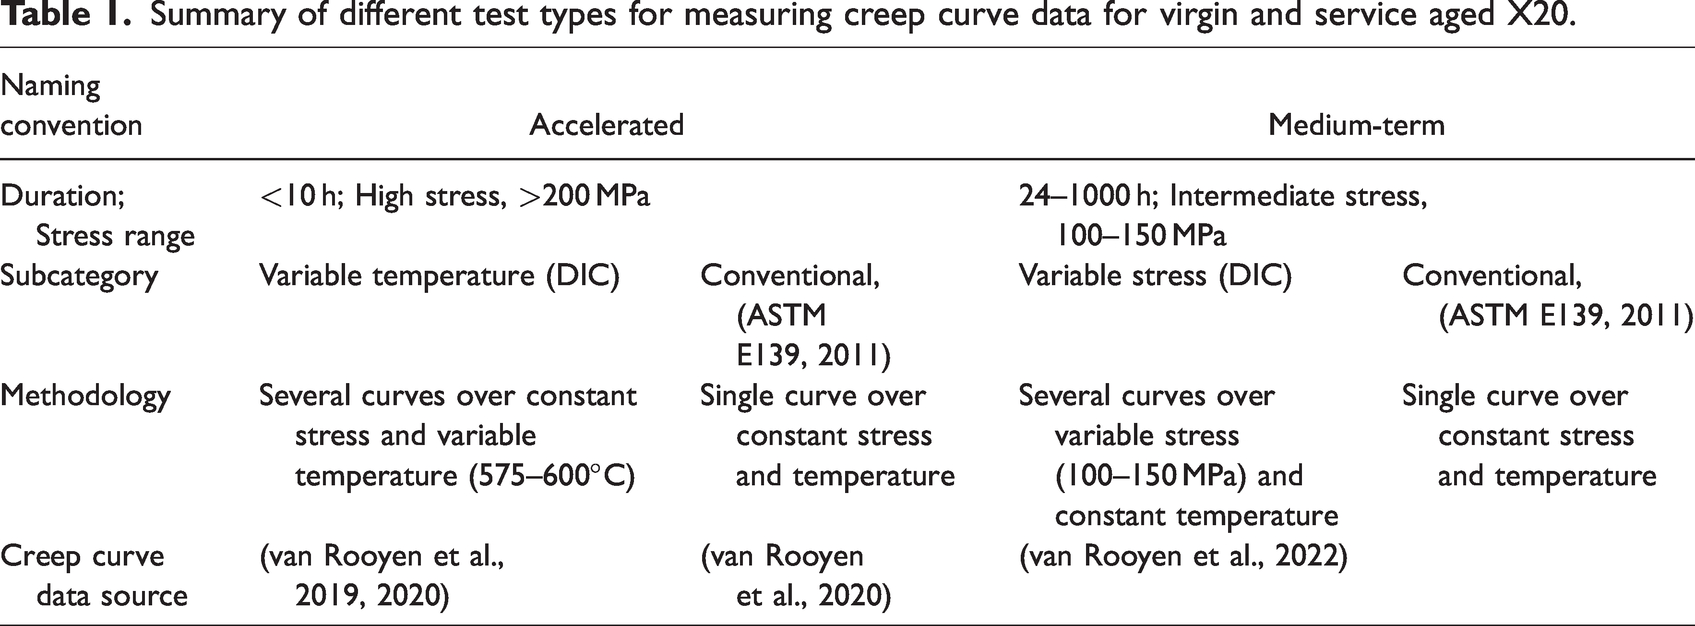
Various sources of creep curves from different test types are used for input to the CDM model, as summarised in Table 1 with the test setups summarised in the schematic diagrams in Figure 2. These tests are categorised according to (i) duration from start to rupture and whether (ii) uniform (for use in conventional testing, that is, constant temperature or stress) or (iii) variable temperature or stress fields (with the use of DIC) are applied.
Summary of different test types for measuring creep curve data for virgin and service aged X20.
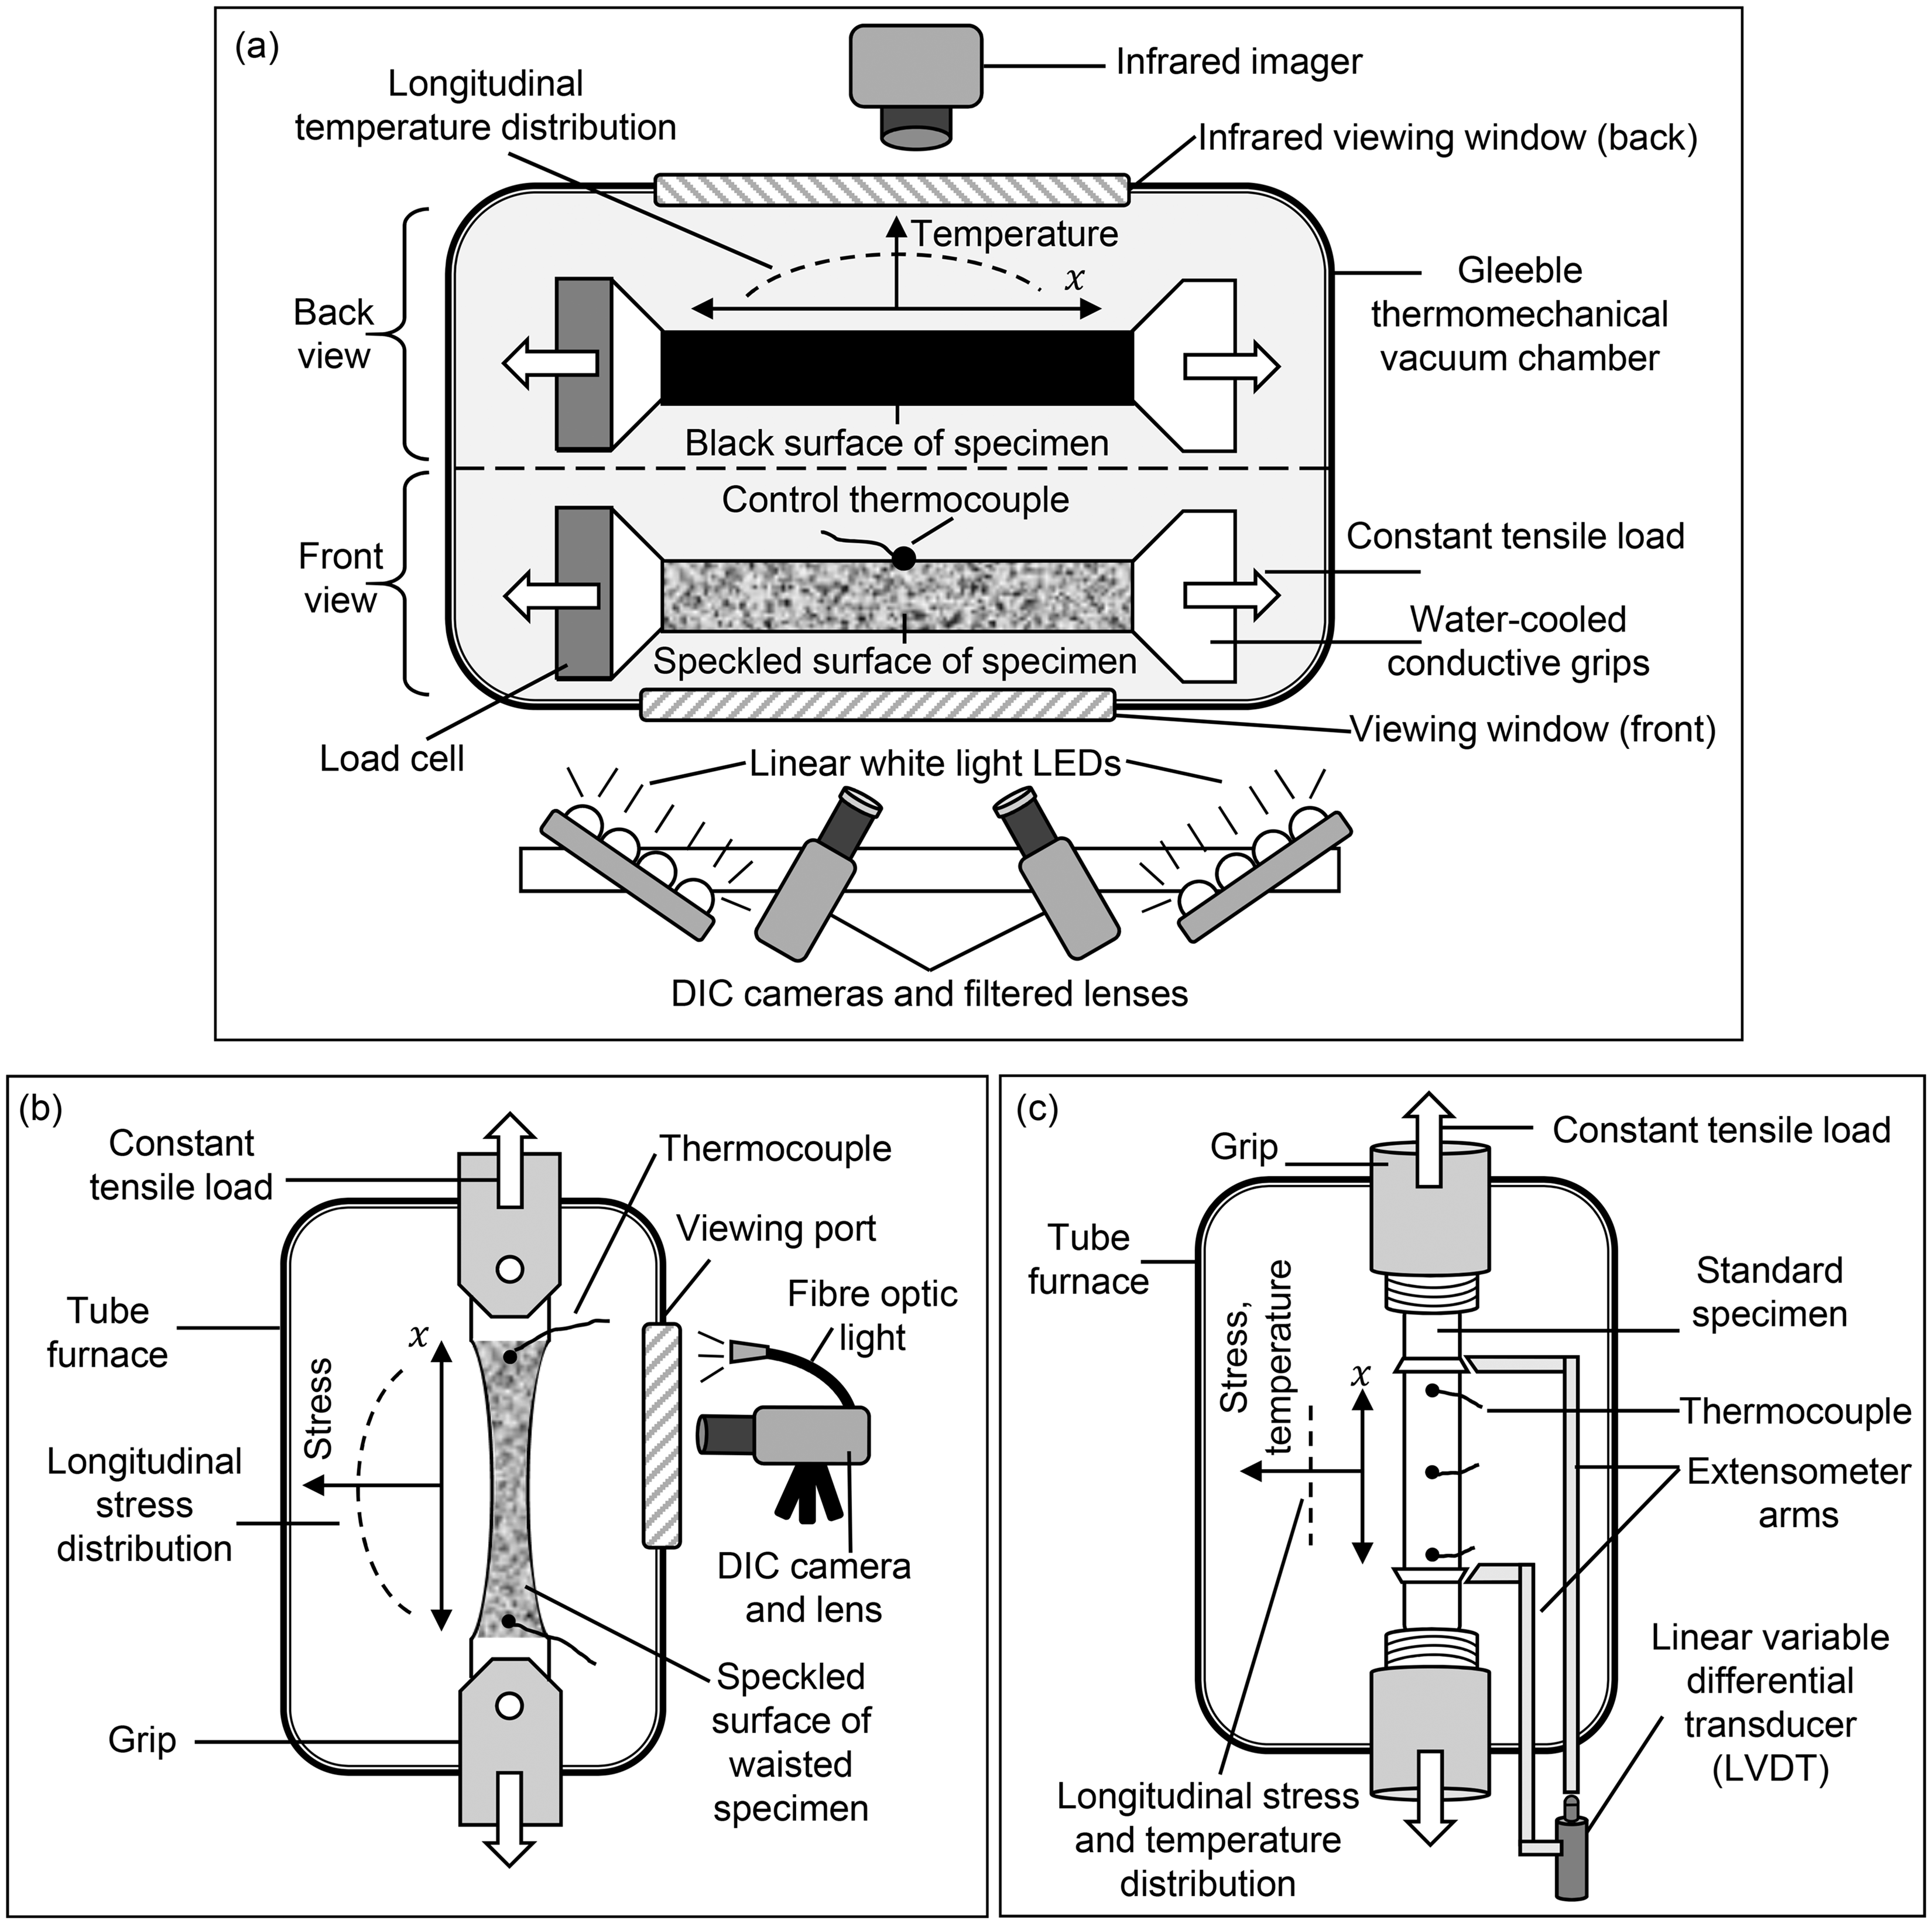
Schematic diagram of the experimental setups for the (a) variable-temperature tests using stereo-DIC for strain measurement (van Rooyen et al., 2019, 2020; van Rooyen and Becker, 2018), (b) variable-stress tests using 2D-DIC for strain measurement (van Rooyen et al., 2022) and (c) ASTM standardised, conventional creep tests using extensometry for strain measurement (ASTM E139, 2011; van Rooyen et al., 2020).
As shown in Figure 2(a), variable-temperature accelerated creep testing was performed in a Gleeble thermomechanical simulator that applies a near-parabolic temperature profile (with a maximum of 600°C) longitudinally across a specimen. Strain and temperature data are acquired by stereo-DIC and thermal imaging applied to the speckled and highly emissive (black) surfaces of the specimen, respectively. Further details regarding the setup can be found in van Rooyen et al. (2019), van Rooyen and Becker (2018), and van Rooyen et al. (2020).
Variable-stress medium-term creep tests were conducted at 600°C using a constant-load creep setup (Figure 2(b)) where 2 D-DIC is applied using a single camera through a tube furnace viewport. A waisted specimen design (ASTM E139, 2011) results in non-uniform stress development along the uniaxial loading direction. Further details regarding the setup can be found in van Rooyen et al. (2022).
Conventional testing involved the use of a traditional creep setup as stipulated by ASTM E139 (2011) where strain is measured using a linear variable displacement transducer (LVDT) as indicated in Figure 2(c). Constant temperature and engineering stress is maintained per specimen in these tests. Further details regarding the setup can be found in in van Rooyen et al. (2020).
Model formulation
The creep model used is based on the CDM formulation developed by Oruganti et al. (2011) and was selected on the basis of simplicity in the inclusion of key microstructural parameters (subgrains and precipitates) relevant to the creep strength of X20 (Aghajani et al., 2009; van Rooyen et al., 2019). The model is also adapted to include a cavity nucleation-controlled damage parameter to better model the creep curves of aged (cavity-dense) materials.
Modified model equations
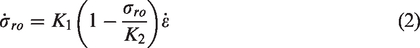
The CDM model employed is represented by the collection of coupled differential equations (1) to (6):


The fundamental creep law in equation (1) relates the creep strain rate,
The characteristic creep constant,
Primary creep is represented by an evolution of 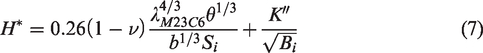
Here,
Damage parameters
The tertiary regime is modelled through the damage parameters and their evolutionary equations. The subgrain coarsening damage parameter is given as,
The damage term related to precipitate coarsening is a function of the initial particle diameter 
The Ostwald ripening law based on volume diffusion control (Yadav et al., 2016) leads to the rate equation of
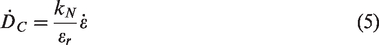
Besides microstructural deterioration parameters, physical damage in the form of creep cavitation has long been reported for X20 particularly at low stresses (Parker and Siefert, 2018; Trück et al., 1991), leading to consumed life estimation of in-service components based on cavity density measurements from replica metallography (van Zyl et al., 2005). Based on this line of thinking, a creep-constrained cavity nucleation-controlled damage parameter 
In reality, both void growth and cavitation occur (as noted previously for aged X20 in van Rooyen et al., 2022), requiring combined creep-constrained cavity growth and growth-constrained cavity nucleation damage equations that prove to be complex when defining for high stresses within the transgranular fracture regime (Dyson and McLean, 1998; Lin et al., 2005; Perrin and Hayhurst, 1996). Furthermore, estimates of
Model calibration
Model calibration involves determining the fixed baseline parameters of the modified Oruganti CDM model which are summarised in Table 2. Details regarding the methods used to determine the values are summarised in Appendix 1. Parameters established from microstructural data (
Summary of initial estimates, bounds and optimised values of baseline parameters.
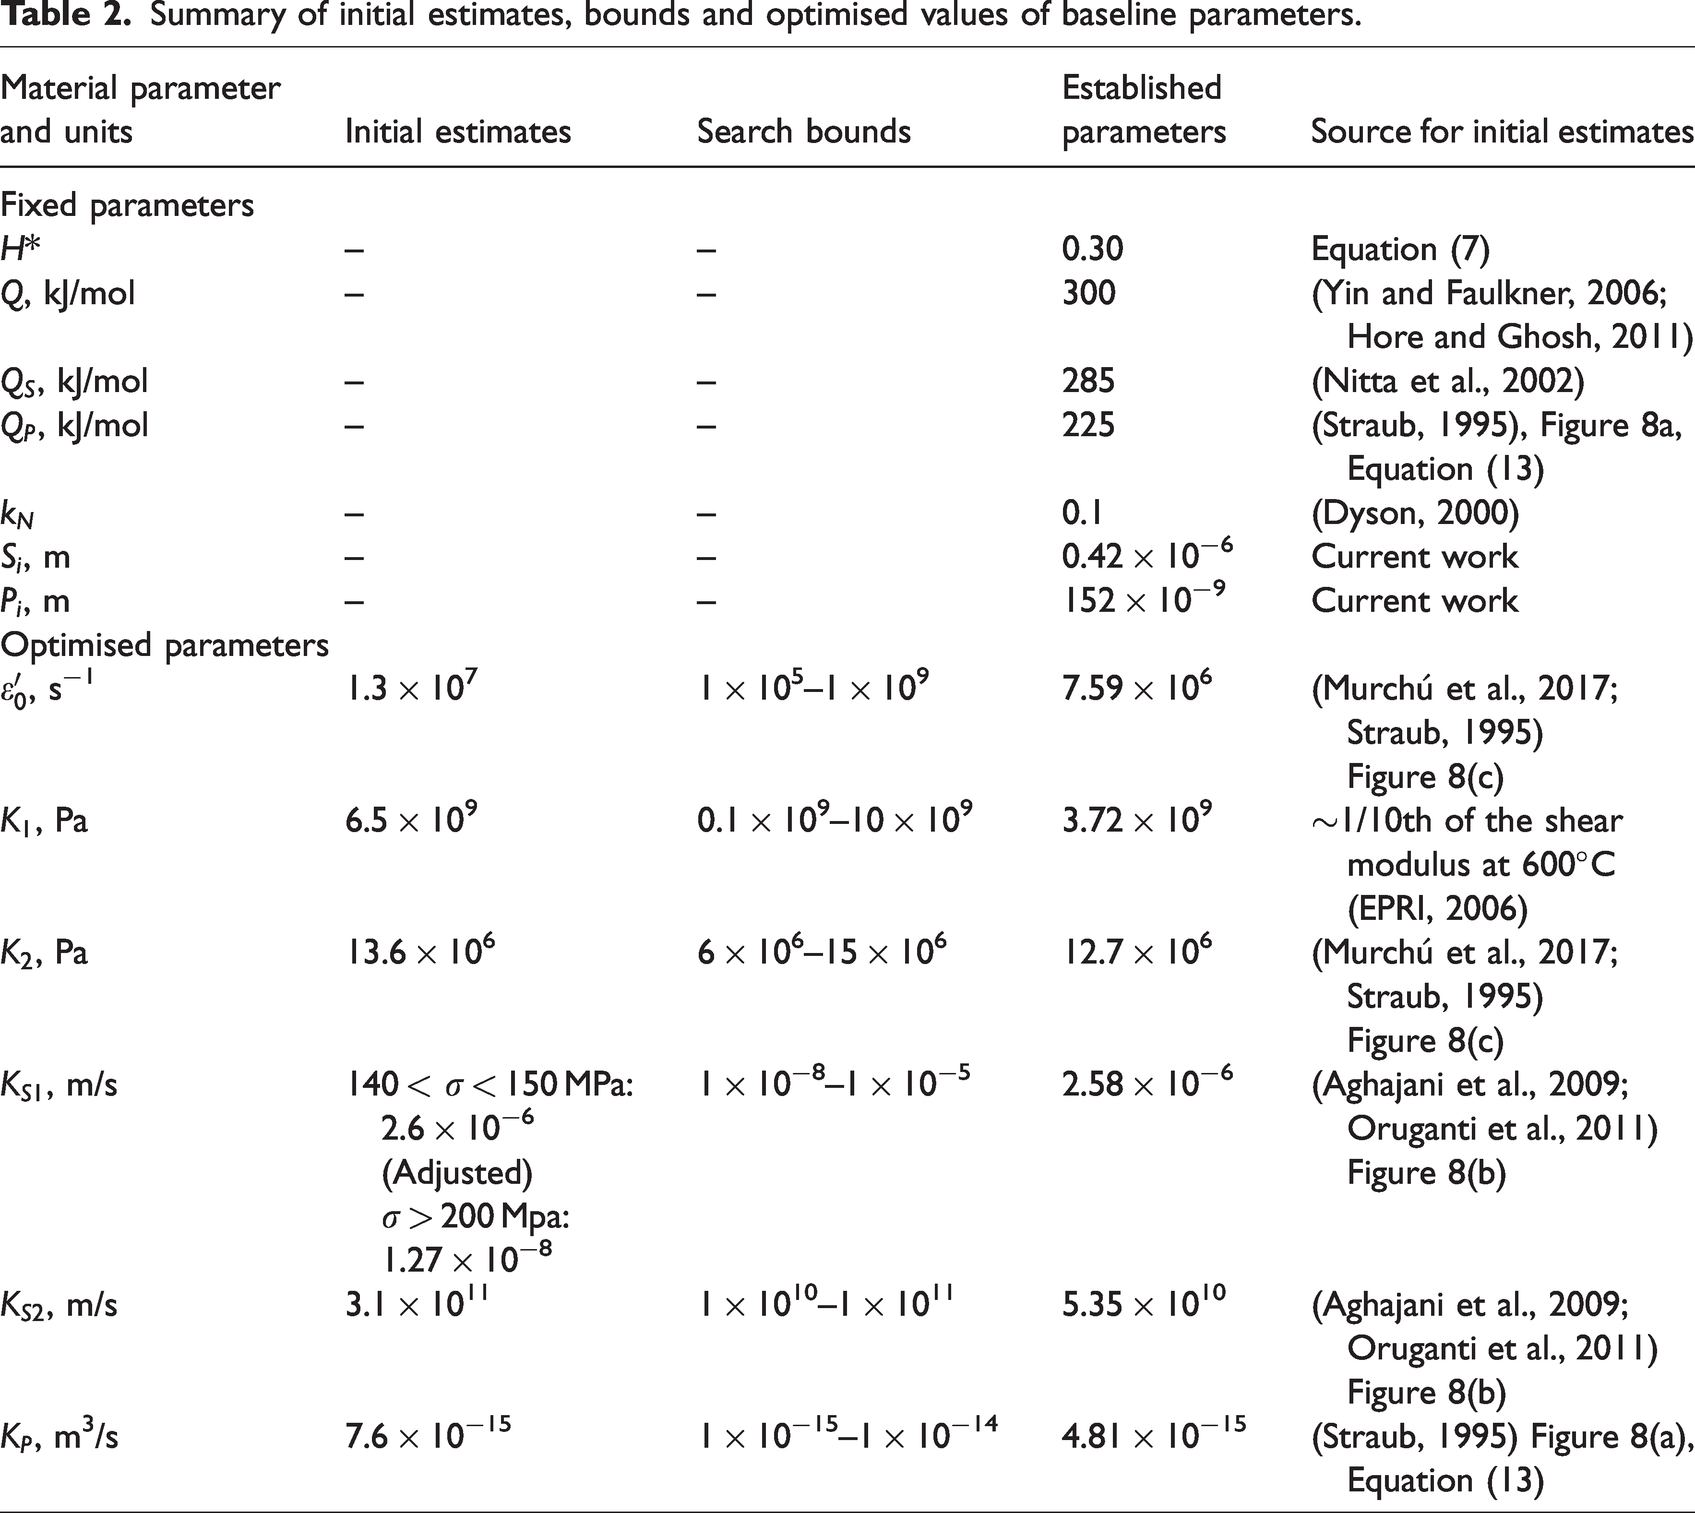
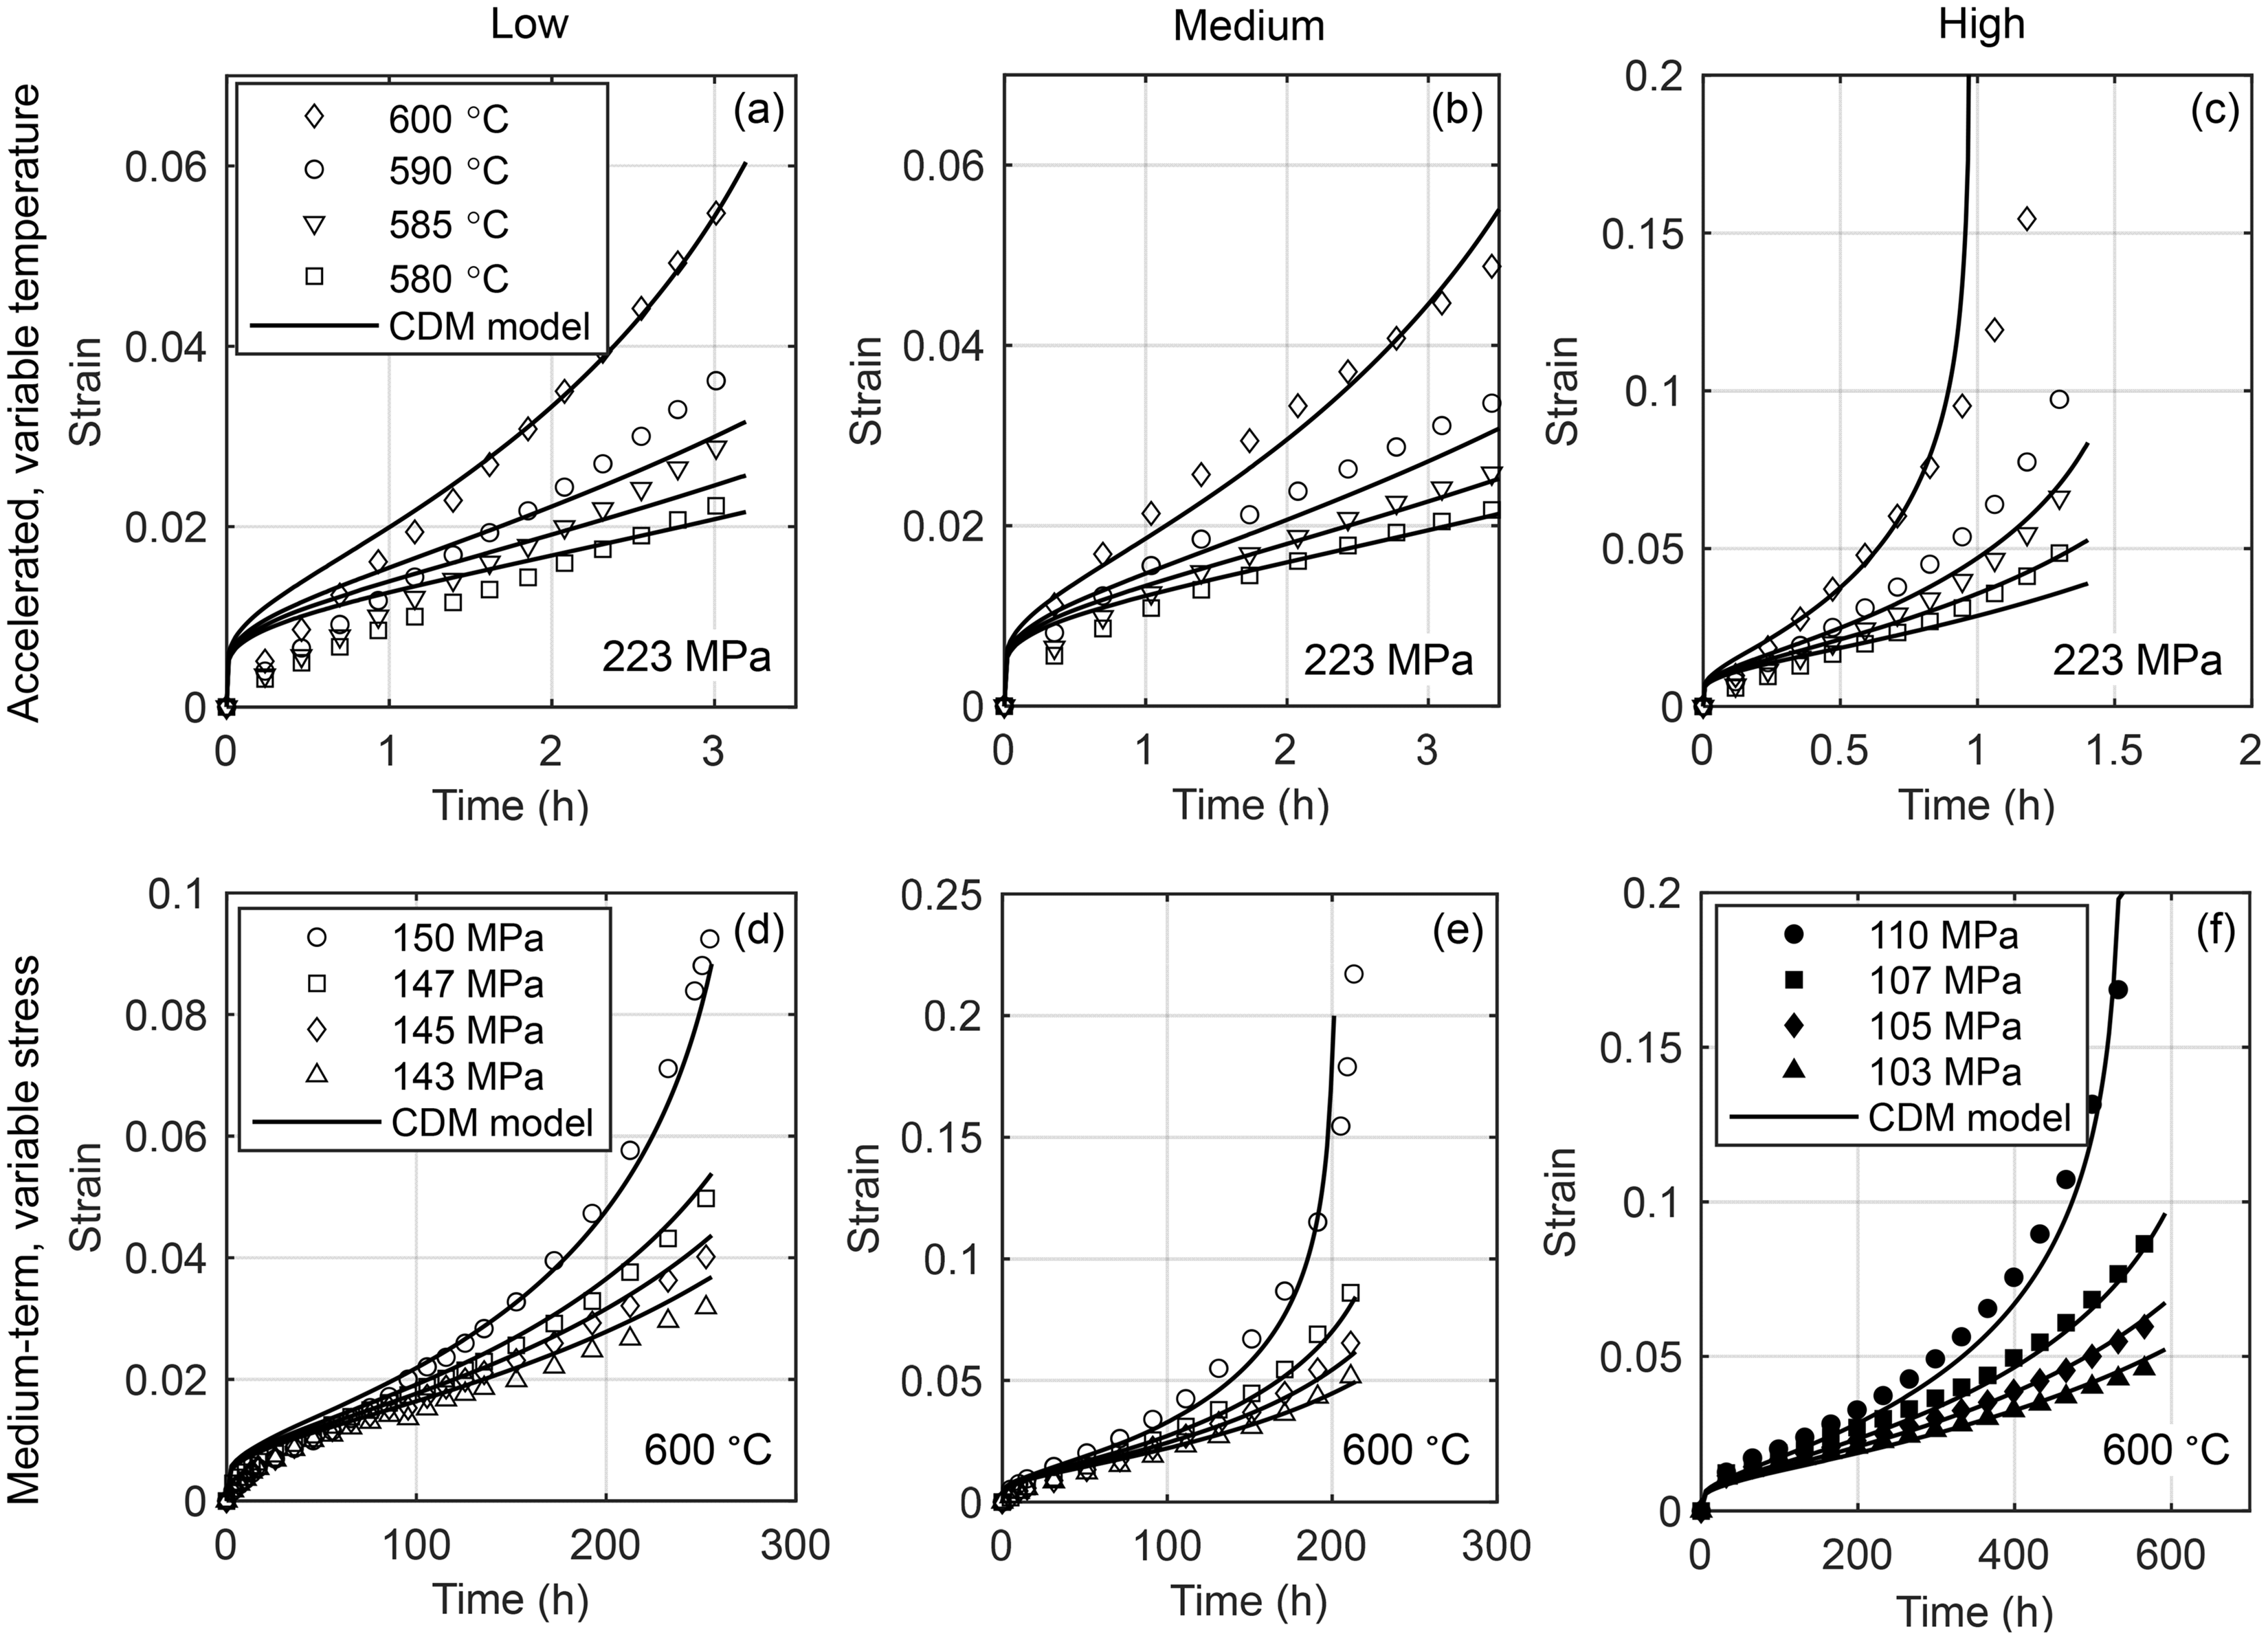
Figure 3(a) compares the medium-term experimental data (symbols) and the corresponding CDM model response (solid line) for the DIC-measured creep curves of the variable stress test at several stresses. Data and model predictions for the 140 MPa conventional creep test are also included. Good agreement is noted between the model predictions and the DIC experimental data, including the conventional creep curve at 140 MPa. This demonstrates the ability of the current model to simulate medium-term (<1000 h duration) creep curves.
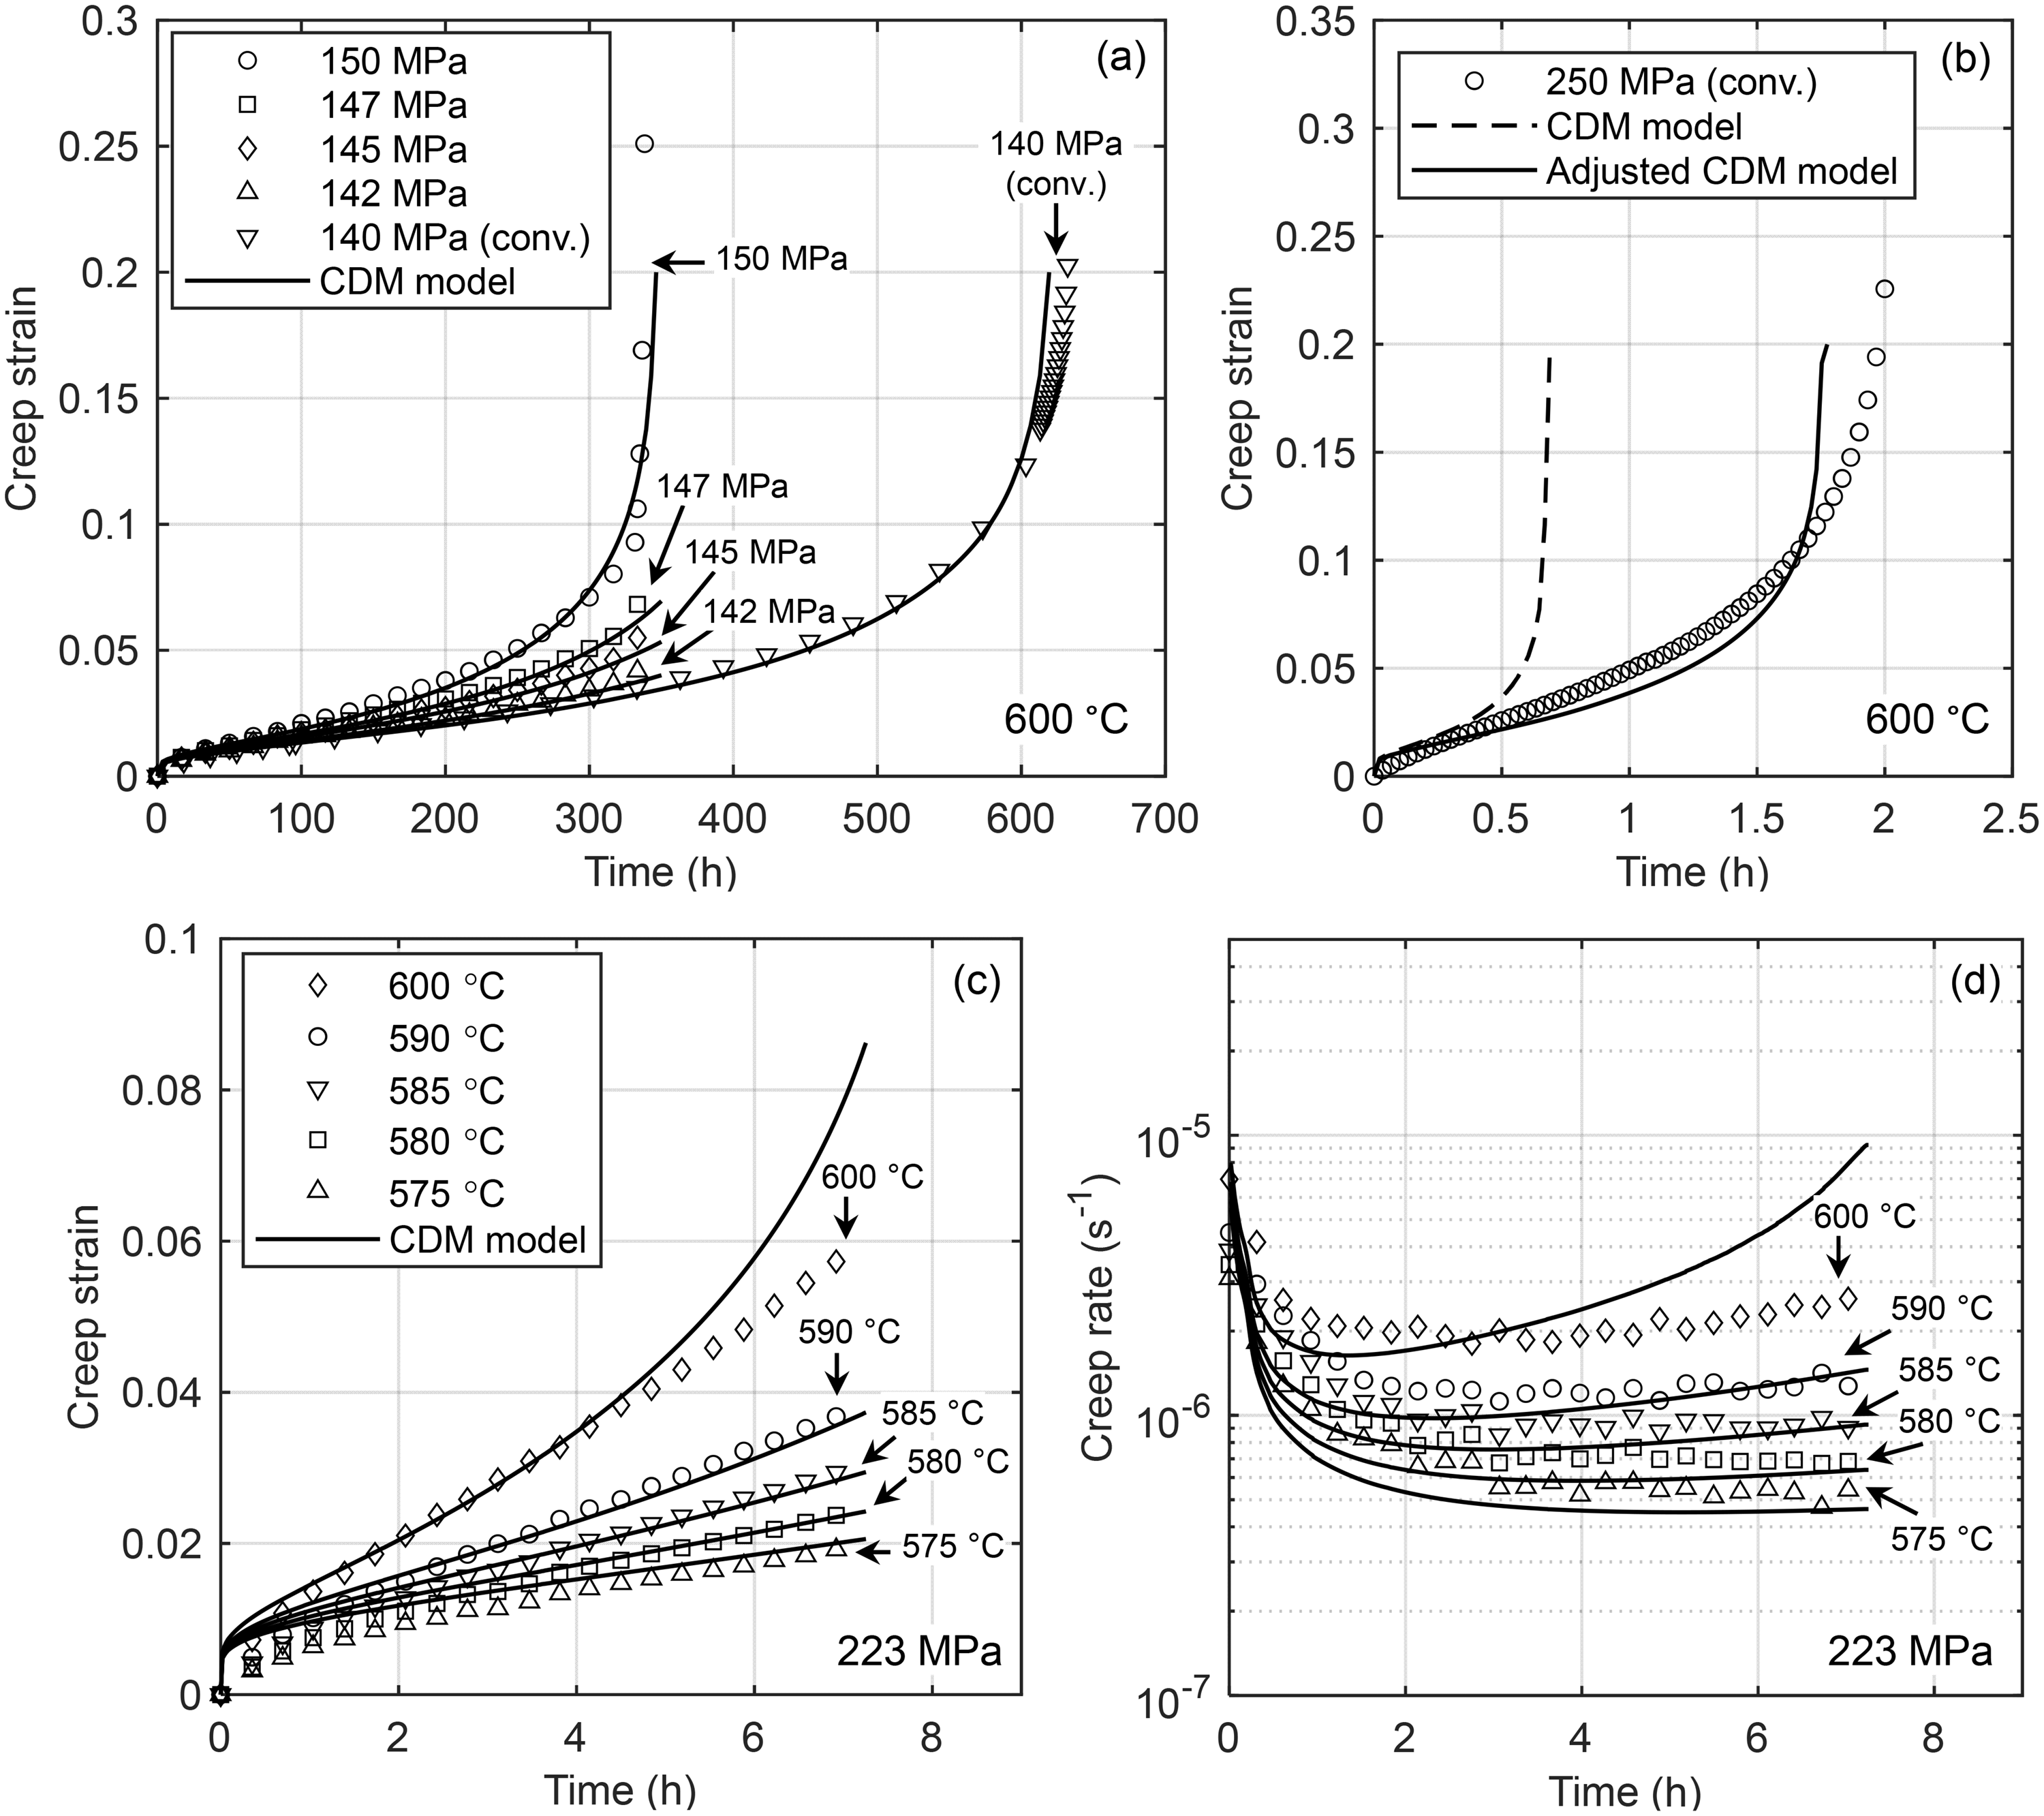
Comparison of the predictions of the CDM model and the experimental data of virgin X20 from (a) medium-term variable stress data including a conventional test at 140 MPa, (b) accelerated, conventional test data with adjusted model parameters and (c) accelerated, variable temperature test data with corresponding (d) creep rates (using the same legend in (c)).
At higher stresses and shorter durations typical of accelerated tests, the model underestimates the time to rupture, as shown in Figure 3(b) for a conventional creep test at 250 MPa and 600°C. This is likely due to the change in the dislocation climb mechanism from general to local at higher stresses (Christopher and Choudhary, 2019), or due to the stress dependence of the evolution of internal structures. Straub (1995) and Qin et al. (2003) demonstrated that steady-state subgrain size is inversely proportional to stress. Under the assumption of the stress-dependent subgrain growth mechanism, an updated
Summary of ranges for estimated initial and optimised damage parameters.
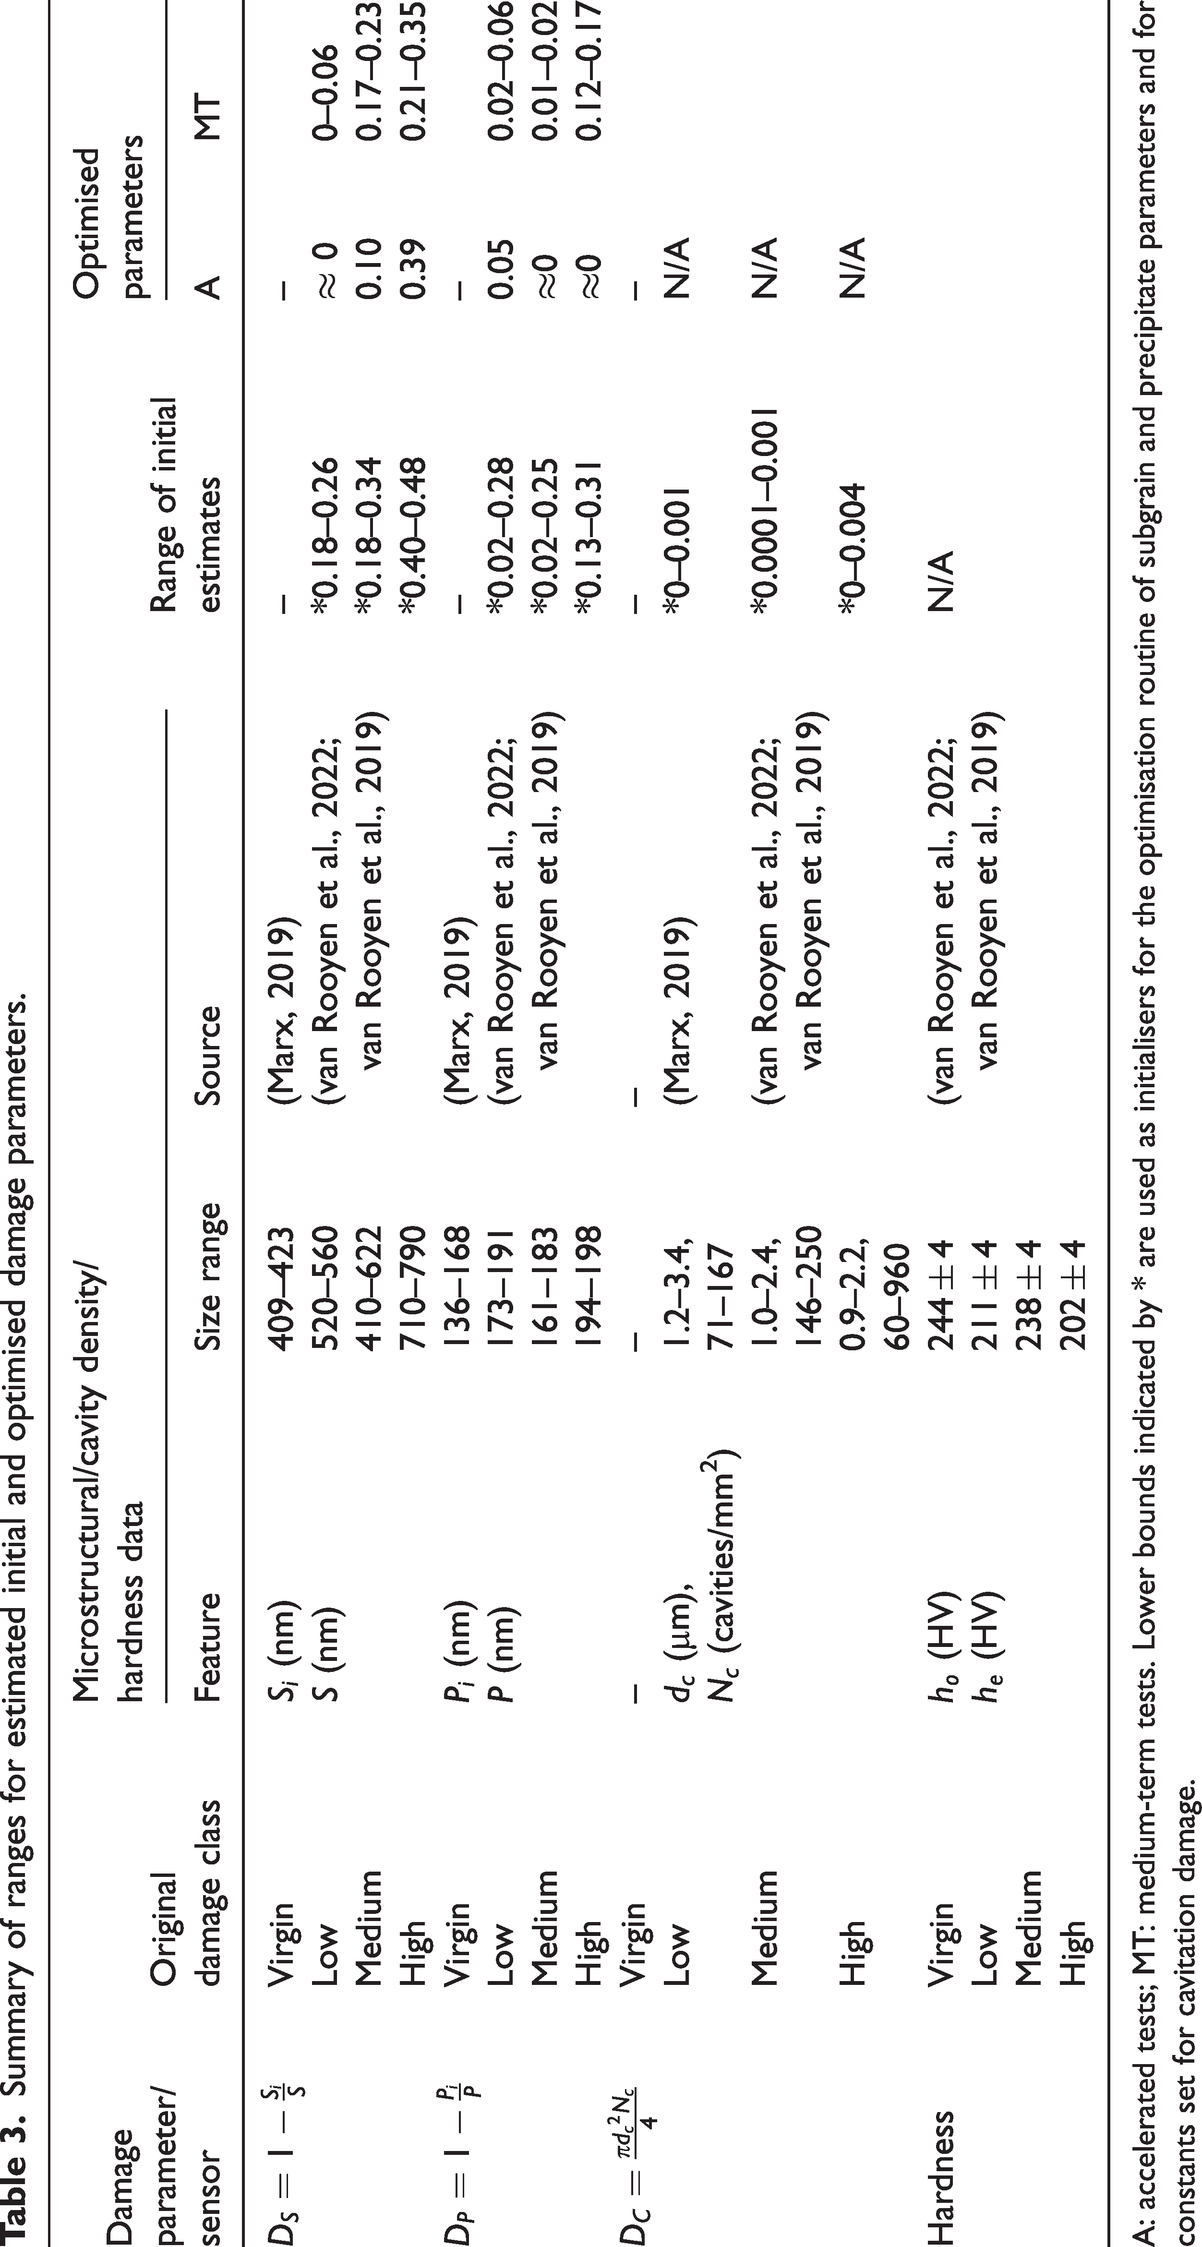
A: accelerated tests; MT: medium-term tests. Lower bounds indicated by * are used as initialisers for the optimisation routine of subgrain and precipitate parameters and for constants set for cavitation damage.
To demonstrate the ability of the adjusted model to simulate creep data at higher stresses and at different temperatures, the adjusted model was applied to accelerated variable-temperature creep curves measured using DIC from a single specimen. As indicated in the microstructural analysis performed in a previous work (van Rooyen et al., 2020), particle coarsening was ignored for these short duration tests (
Damage parameter extraction
The premise of the paper lies in establishing a relationship between the aging level of ex-service X20 and initial-state (prior to testing) damage parameters used in the CDM model. This can be achieved by applying the calibrated model and fitting initial values of selected damage parameters (
5.1 Sensitivity study
The sensitivity of the strain with respect to the damage parameters must be explored to establish the uniqueness of the solutions and the correlations between the parameters. The influence of a percentage change (Δ
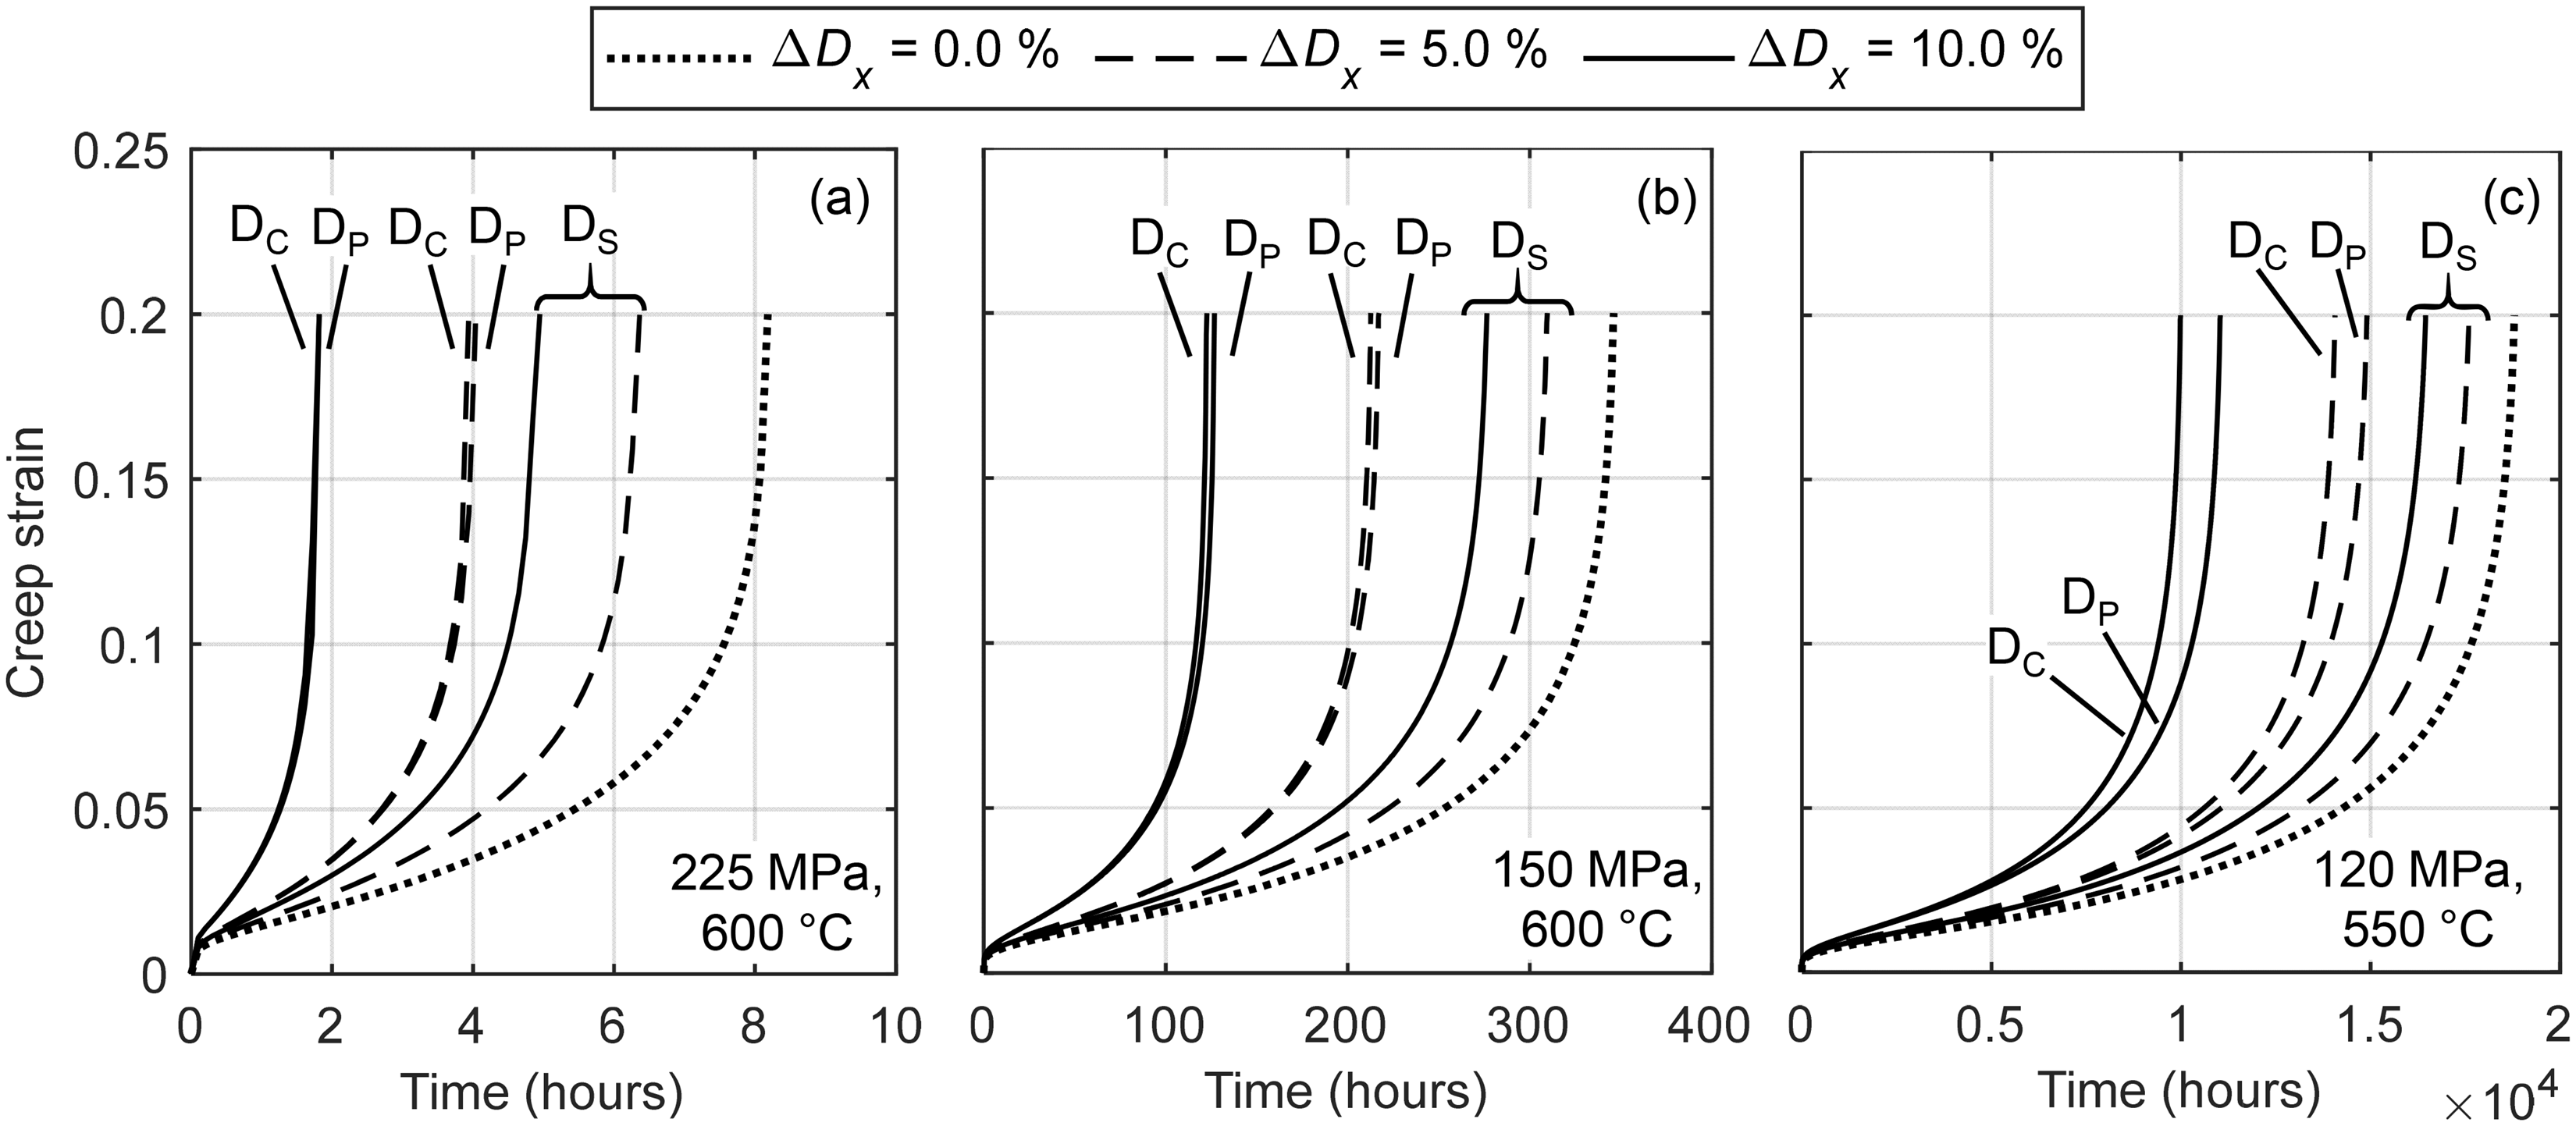
Sensitivity of creep curves to subgrain, precipitate and cavity damage parameters for (a) accelerated, (b) medium-term and (c) long-term tests. Note: Δ
Although not presented here, several objective functions were considered, including a creep stage-based weighting function as suggested by Christopher and Choudhary (2018). It was found that a smooth and low stiffness evolution is available through a normalised version of equation (14) where
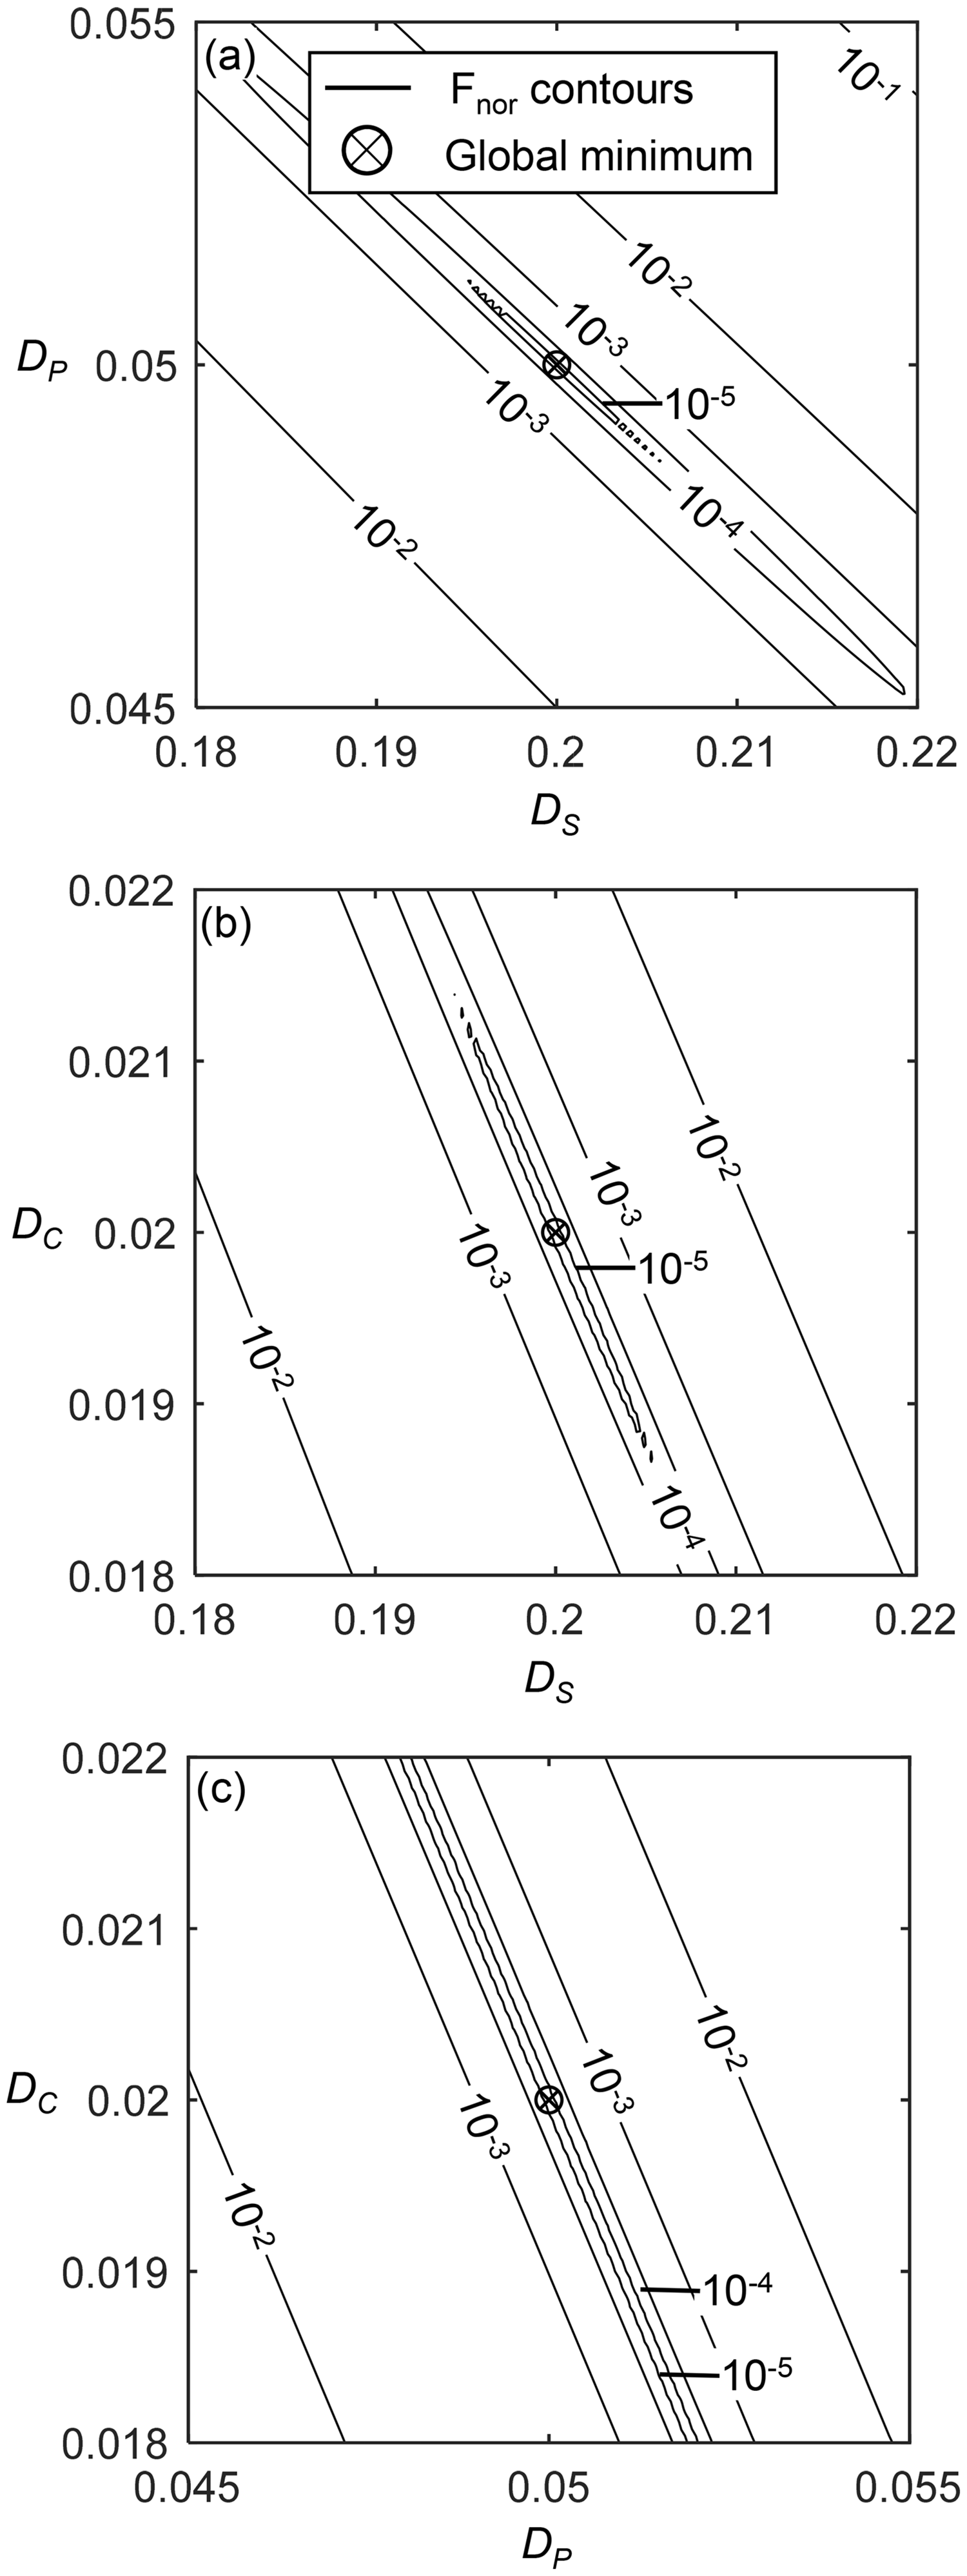
Response surfaces of the objective function for medium-term creep tests for (a) DS–DP , (b) DS–DC and (c) DP–DC parameter combinations.
Further consideration is given to the effect of stress and temperature measurement error on the confidence in optimised damage parameter values (determined as the absolute difference between nominal and identified parameters normalised by the search range). The simulated creep curves in this case include a Gaussian distribution of strain noise with a standard deviation of 150 µε which approximately corresponds with the longitudinal temporal noise floor (142 με) calculated for the DIC-measured creep curves (van Rooyen et al., 2022).
It was found that the same percentage change in temperature,
For the purpose of this study, the
It should be noted that the optimised
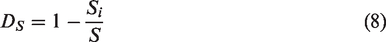
As indicated by equation (7),
Subgrain and precipitate damage optimisation
Extraction of
Table 3 reports the initial estimates used in the fitting procedure (due to the heterogeneity of the microstructural data, a range of initial estimates are reported), including the estimates of
The experimental and fitted curves for the ex-service material states are shown in Figure 6 for accelerated, variable temperature creep tests (top row) and medium-term, variable stress creep tests (bottom row). Similarly to the baseline fits in Figure 3, a satisfactory match is observed between the model predictions and medium-term data in the bottom row of Figure 6 whereas relatively poorer fits are noted for the accelerated creep tests (top row) for the same reasons as mentioned in Section ‘Model calibration’. The current formulation of the CDM model only optimises for two parameters (initial values of
Comparison of CDM model predictions and experimental creep curves for low, medium and high damage X20 (left to right columns, respectively) during accelerated variable temperature and medium-term variable stress (top to bottom rows, respectively).
The optimised damage parameters obtained from the accelerated and medium-term tests are provided in Table 3. Apart from the
Discussion
Differences in creep behaviour between service-exposed X20 steels with varying levels of service histories are identified by the DIC technique. Microstructural deterioration is also revealed through subgrain, precipitate, cavity density and hardness measurements. These aspects are combined using a microstructurally sensitive CDM framework to reveal quantitative differences in damage levels between the ex-service states.
Full-field methods in creep damage modelling
DIC based creep strain measurements can extract multiple, spatially resolved creep curves at several stresses using a waisted specimen geometry during medium-term tests, or multiple accelerated creep curves across a varying temperature field generated through a Gleeble thermomechanical machine. Such approaches are ideal when material efficiency is a key requirement, such as in the assessment of the service-retrieved materials from a power plant. Accelerated creep tests demonstrated time savings and the economy of material advantages over conventional longer-term versions. Variable temperature tests require special feedback control from a Gleeble thermal system to maintain a specific temperature profile across the specimen, making adaptation to longer-term, independent testing difficult. On the other hand, the tests conducted within a traditional creep rig modified with integration of DIC may be better suited to measurement of medium-term creep curves.
Both approaches produce creep curve data that are representative of the damage levels of service-exposed X20 steels with varying levels of service histories. Specifically, differences in damage states are revealed through qualitative comparisons of curves in terms of minimum creep rates and failure times (Figure 6). Previous approaches (van Rooyen et al., 2019) to quantifying damage levels used simple conventional creep relations (such as the Bird-Mukherjee-Dorn and Zener-Hollomon threshold stress-modified equations) together with DIC-obtained accelerated creep curves. In this work, the application of accelerated and medium-term data to CDM models is highlighted.
Calibration of the Oruganti et al. (2011) CDM model (modified to include cavitation damage) for virgin X20 benefits from the data richness offered by DIC analysis over non-uniform temperature and stress fields. From a single test, a range of curves in various stages of development can be systematically input into the model to extract baseline constants. For example, primary and secondary regime-dominated curves can be used to extract baseline reference stress (equation (2)) and subgrain (equation (3)) parameters, respectively. Tertiary segments of the curves are useful in identifying baseline constants related to slow-evolving subgrain and precipitate damage relations, although the final acceleration to failure is only captured for the maximum temperature or stress condition. This is shown in Figure 9 when comparing the tertiary regime of the 140 MPa stress curve from a variable stress test to a curve at the same stress from a conventional test. The rapid increase in strain rate in the final stages of the former curve is caused by the rupture of the specimen at the location of maximum stress (viz. the 150 MPa curve in Figure 9).
The medium-term test is successfully simulated by the model whose calibrated parameters are within the ranges predicted from the literature. For accelerated tests, the primary stage is not well described as shown in Figure 6. This disparity can be attributed to the lack of a stress-dependent evolutionary equation for the backstress contribution to the primary creep through
Comparison with alternative damage indicators
Application of the calibrated CDM model to ex-service X20 creep curves from various test types provides a set of optimised 
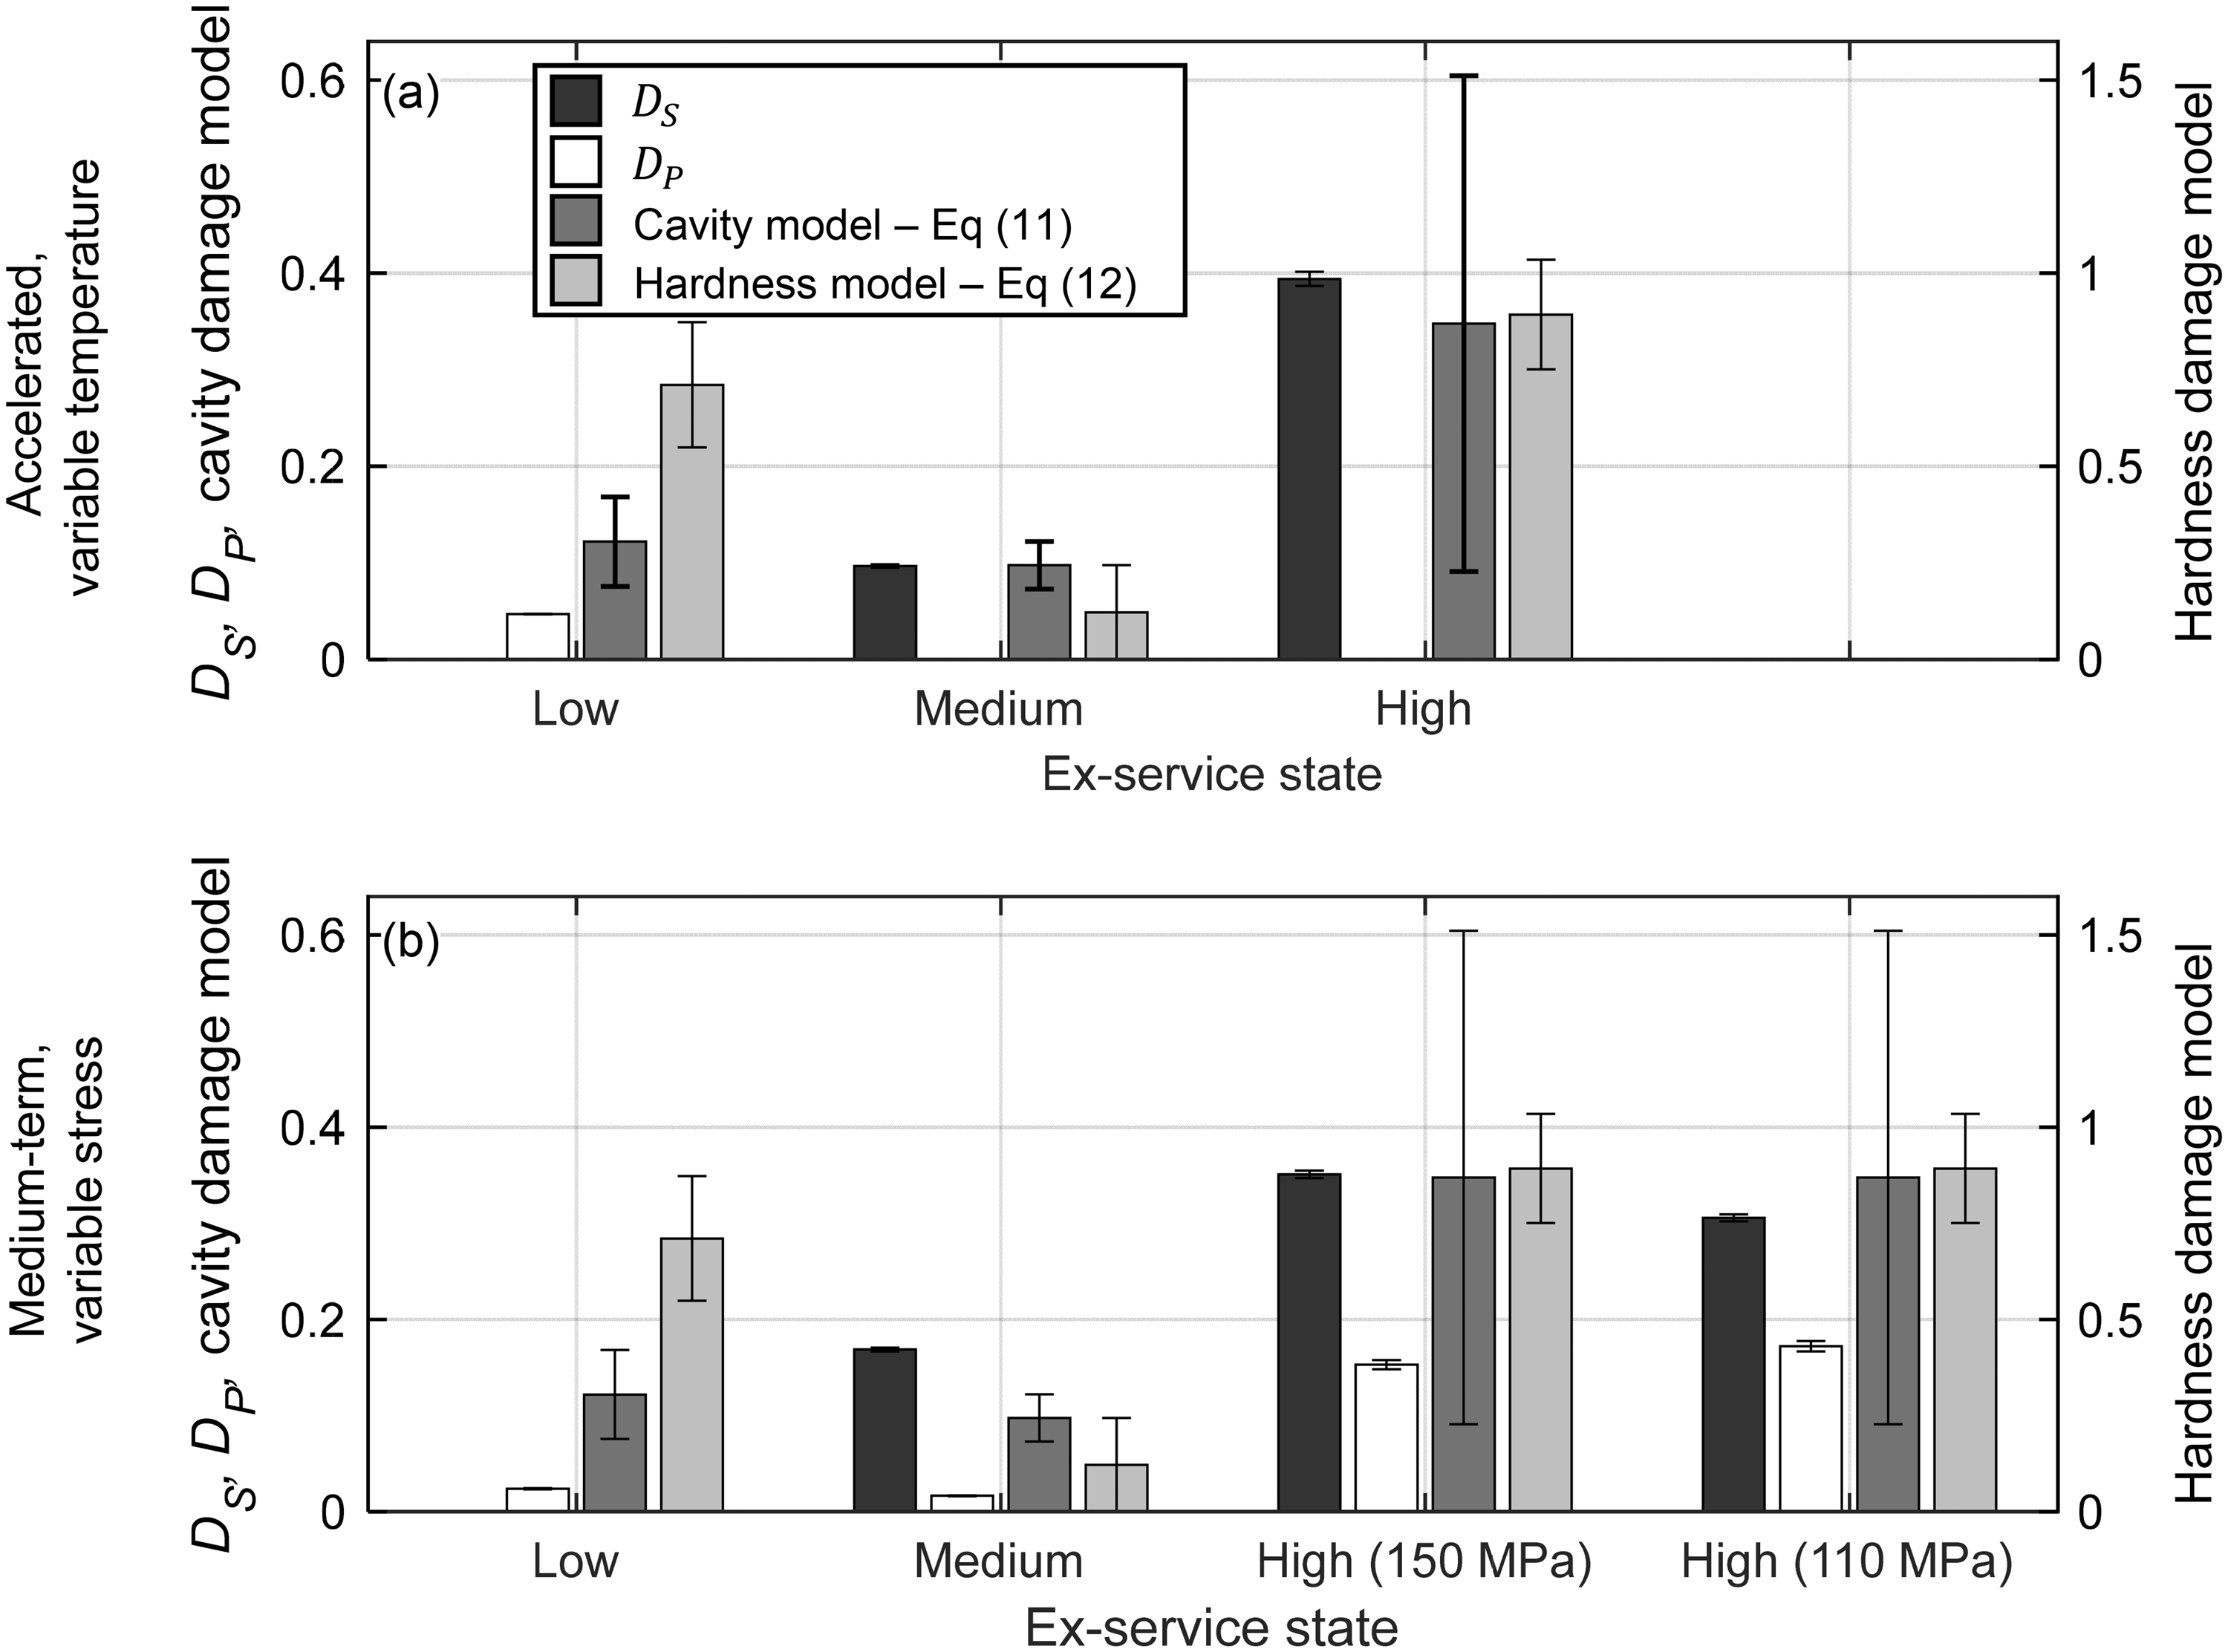
Optimised DS and DP damage parameter sets from (a) accelerated variable temperature and (b) medium-term variable stress compared with hardness and cavity density damage assessments.
The cavity density at failure,
Secondly, the hardness model of Endo et al. (2003) is also included as:
Figure 7 demonstrates that comparative damage assessments between ex-service states using optimised damage parameters correspond well with traditional damage sensors of
It is also evident from Figure 7(a) that only one parameter from the
Nonetheless, the optimised damage parameters agree with the microstructural data previously sampled from these specimens (van Rooyen et al., 2019), which indicated larger grains but denser M23C6 distributions for medium damage when compared to the low damage state. This would explain why the medium damage material has similar medium-term creep behaviour to the low damage material (Figure 6(e) and (d), respectively) on account of the strengthening benefits offered by precipitates for intermediate stresses (Murchú et al., 2017). Similarly, high damage X20 showed higher
For accelerated and medium-term tests, it is difficult to discern whether optimised
As the duration of the test increases for medium-term tests, both
Recommended CDM-based damage philosophy
CDM-based damage extraction is an effective and material efficient damage assessment tool, especially when combined with the high density of creep curves available through DIC measurement. This approach assumes that ex-service material has accumulated damage during operation which is represented by the non-zero, initial state (
This work demonstrates the quantitative correlation between the extracted damage parameters and the original classifications of ex-service X20. Hardness methodology show less consistency in terms of the observed creep behaviour. For example, the higher hardness damage observed for low damage X20 compared to medium damage X20 is inconsistent with the longer rupture times observed in medium-term, low damage tests in Figure 6(d). The optimised damage parameters also display less scatter than the cavity model, especially with respect to high damage X20. Furthermore, higher consistency and hence confidence in parameters is noted for the medium-term, variable stress tests than single-specimen, conventional tests. This is attributed to the use of multiple creep curves in the optimisation routine in the latter approach, which allows for more meaningful parameter extraction.
Based on these grounds, the following damage assessment philosophy is recommended: Conservative assessments of service-retrieved material required in entry-level integrity evaluation procedures can involve using DIC to measure multiple accelerated creep curves (as shown in the top row of Figure 6) from single specimens and optimising for
Although beyond the current scope, the technique proposed in this work can then be used to estimate times to failure of components in a similar manner to the hardness and cavity damage evaluation techniques (Cane, 1982; Cardoso et al., 2015). Operating temperatures and stresses along with the optimised damage parameters can be applied to the CDM model to predict evolution to failure. This has a considerable advantage over wholly empirical methods, as the CDM model is directly tied to microstructural evolution. Relative comparisons of the parameters between ex-service materials can also allow for refinement of traditional damage classification techniques (viz. the cavity-based classification used in Abe et al. (2008) to include more subcategories that reduce the uncertainties in expended life fractions. Demonstrative of this is the apparent disparity in damage verdicts for medium damage X20 when considering cavity density,
Conclusions
The emphasis of this work is damage assessment using the wealth of creep curve data available from DIC strain measurements within a microstructurally relevant CDM framework. This technique is ideal for applications in the power industry due to the preservation of material volume and it introduces a new potential benchmarking technique for future damage evaluation procedures. The key conclusions are:
Experimental techniques that make use of full-field strain measurement of virgin and ex-service X20 power plant steel supply several creep strain curves across various temperatures and stresses that are in various stages of curve development while preserving material economy. This is useful for applications to data heavy CDM model calibration where the accuracy of the parameter extraction process is greatly improved by the large number of creep curves. The evolution of subgrains, M23C6 precipitates and cavity distributions during testing result in the adaptation of a CDM model with representative damage parameters and evolutionary equations. Following calibration of the baseline parameters on virgin X20, optimisation of subgrain and precipitate damage parameters is performed on ex-service X20 using creep curves from medium-term with variable-stress tests and from accelerated with variable-temperature tests. Medium-term tests result in measurable values of these parameters, especially in terms of subgrain damage, which are higher for highly exhausted material. Smaller differences in intermediate exhausted states can also be identified by pairing the optimised damage parameters with traditional forms of creep damage assessment. Good agreement is demonstrated with alternative evaluation philosophies, demonstrating the potential of the technique for use as a life-assessment tool. Relatively lower damage parameter values and higher hardness values for the medium damage material suggest an expended life fraction closer to that of the low damage counterpart, despite a higher cavity density and original damage categorisation.
Future work could focus on more accurate cavity density damage characterisation using 3 D imaging techniques such as microtomography and applying CDM models to the damage parameter extraction from small specimen testing techniques such as small punch creep tests. The latter can be achieved by combining strain mapping from DIC and integrating the CDM model for iterative stress calculations using finite element methods.
Footnotes
Acknowledgements
Sourcing of piping material is gratefully attributed to the ESKOM Power Plant Engineering Institute (EPPEI) Material Science Specialisation programme. Micrographs were provided by the electron microscopy facilities of the Centre for High Resolution Transmission Electron Microscopy (CRTEM) at the Nelson Mandela University.
Declaration of conflicting interests
The author(s) declared no potential conflicts of interest with respect to the research, authorship, and/or publication of this article.
Funding
The author(s) disclosed receipt of the following financial support for the research, authorship, and/or publication of this article: This work was supported by the National Research Foundation of South Africa [grant number TTK13070320379].