
Abstract
Objective
To assess the nasolabial symmetry in smile and resting position in individuals with nonsyndromic unilateral cleft lip and palate (UCLP) and compare with Class I individuals without cleft lip and palate (CLP).
Materials and Methods
Frontal photographs of 40 individuals with UCLP (mean age 14.30 ± 0.25 years; 20 female, 20 male) and 40 skeletal Class I individuals without CLP (mean age 14.60 ± 0.34 years; 20 female and 20 male) were examined. Bland–Altman Levels of Agreements, Mann–Whitney U test, independent sample t-test were conducted, and intraclass correlation coefficients (ICCs) were calculated for statistical analysis.
Results
Differences in the transverse lip distance (d-d’) and vertical lip height at crista philtri (e-e’) were lesser in the UCLP group at smile (P = .001; P = .005, respectively). When comparing the differences in these measurements at rest between control and UCLP groups, vertical lip height was longer at crista philtri (e-e’) (P = .014), crista philtri was more laterally located (f-f’) (P = .002), and the transverse lip distance was greater (d-d’) (P = .004) in the UCLP group. Distance of the crista philtri to the midline of the face (f-f’) (P = .007) were higher in the UCLP group during smiling compared to control group.
Conclusions
Nasolabial region asymmetry in smiling and rest position in individuals with UCLP was significantly different from the control group. However, the asymmetry in the nasolabial region, which is more evident in the resting position in individuals with UCLP, decreases during smiling.
Introduction
Facial attractiveness plays a major role in social life and in interactions among individuals. Most studies about facial attractiveness show that attractive faces are relatively symmetrical. Proportional harmony of the face is also very important in the perception of facial attractiveness.1, 2
Patients with cleft lip and palate (CLP) need treatment from birth to adulthood to obtain esthetic and functional rehabilitation. The goal of surgical treatment is not only restricted to reconstruction of the anatomy of the nasolabial and oral regions, with the purpose of enhancing esthetics and the function, but it also should promote normal growth of the midface. In individuals with CLP, the hard and soft tissues of the nasolabial and dentoalveolar regions are affected and asymmetries in the nose and lips are frequently mentioned in the literature.3–5
In individuals with CLP, the nasolabial region is the least attractive area of the face.6, 7 They often express dissatisfaction with their facial appearance and show emotional distress as they were frequently confronted with negative comments during childhood and adolescence. Symmetry in the nasolabial area of individuals with unilateral cleft lip and palate (UCLP) is distorted. Several surgical (rhinoplasty, cleft lip revision) and nonsurgical interventions (neurotoxins) may be utilized to improve this asymmetry. In these individuals, good facial esthetics may be associated with facial symmetry, which is therefore regarded as an important outcome of treatment. It is very important to evaluate nasolabial symmetry objectively in smiling and rest position. 8
In orthodontic treatment planning, photographs and lateral cephalograms have been important diagnostic aids in analyzing the patient's profile and lips at rest. For recording the facial morphology and for the objective analysis of residual asymmetry following cleft repair, two-dimensional (2D) photographs are used routinely. Posing errors and magnification of the face associated with 2D photography impact reliability in the assessment of facial morphology and evaluation of facial deformities. Over the last 10 years, stereophotogrammetry has been used to capture three-dimensional (3D) facial morphology for the analysis of cleft lip before and after the surgery. The application of 3D imaging in the evaluation of facial asymmetry overcomes the limitations of 2D imaging. In the literature, there are several studies that evaluated the nasolabial symmetry with 2D and/or 3D techniques.1,9–11 These studies found varying levels of nasolabial asymmetry. However, 3D imaging methods may not be preferred in routine clinical use due to high cost of 3D surface scanning. Therefore, 2D assessment is still used in routine clinical practice for the quantification of nasolabial morphology and asymmetry.12–14 This study aims to determine the possible asymmetry in patients with CLP, using this easily accessible and routinely used method.
Which facial expression should be considered as a reference in repetitive evaluations is a controversial issue. While some researchers state that smiling is reliable, some state that the rest position is more suitable for hard and soft tissue evaluations due to concerns about reproducibility. In this regard, Ackerman et al. 15 says that the evaluation of smiling, rest, and talking all together is necessary for ideal treatment goals. Baseline abnormalities in hard and soft tissue as well as postsurgical changes may cause differences in the appearance and movement of the nasolabial region in individuals with UCLP compared to those without. Especially in smiling, the muscle activity is more pronounced and therefore is more of a determinant in symmetry. It is important for the success of the treatment that the clinicians can predict what kind of differences they may encounter in these patients. One of the most important variables in this regard is symmetry.15, 16
The purpose of this study was to evaluate the nasolabial asymmetry in individuals with UCLP during smiling and at rest and to compare it with the control group. The hypotheses were that (1) there is a difference in soft tissue measurements between the cleft and non-cleft sides during smiling and in rest position in patients with UCLP and (2) the amount of asymmetry between UCLP and Class I individuals without CLP during smiling and in rest position is different.
Materials and Methods
The study was approved by the Ethics Committee of the Faculty of Medicine at Ege University Records for this study were obtained from the patient database of the Department of Orthodontics. The study was in accordance with the Declaration of Helsinki. The participants of this study provided written informed consent.
A power analysis to determine sample size was performed based on the measurement of vertical distance of crista philtri to the base of the nose. This parameter was selected because this is the closest parameter to the cleft region which may be affected by the anomaly. We assumed that 0.5 mm difference between the UCLP and control group in left and right crista philtri to the base of the nose length asymmetry is clinically important. There is no high-evidence paper measuring the magnitude of asymmetry which can be perceived visually in individuals with UCLP. 0.5 mm was almost the level of the method error.10, 17 We decided to assume this limit as clinically important level so we could reach the highest necessary sample size in that conditions. Ayoub et al. 18 published that the asymmetry in this length was found −0.1 ± 0.5 mm in control group. When a 0.5 mm difference in the UCLP group is considered significant, the amount of vertical length asymmetry should be −0.6 mm in UCLP group. So, to test the null hypothesis that there is no difference in the amount of asymmetry in the length of vertical distance of the crista philtra to the base of the nose, a two-sample, two-sided means comparison test was used. In the alternative hypothesis, it was assumed that the length asymmetry was 0.5 mm higher in UCLP group compared to control group. On the basis of the aforementioned proposition, it was established that a sample size of 40 produced a power greater than 95% with a significance level of P< .05.
The individuals with UCLP who applied to our university clinic between 2017 and 2019 for treatment were included in this study. A total of 185 individuals with UCLP and 158 individuals with Class I occlusion were identified and examined for eligibility. Inclusion criteria for the UCLP group were as follows: (1) All of the clefts were left-oriented (2) the patient had UCLP without Simonart’s band, (3) the patient had no other craniofacial anomalies or syndromes, (4) primary UCLP repair was performed before 18 months of age, (5) same primary surgical techniques were applied by several surgeons for the lip repair (modified Millard procedure), (6) presurgical infant orthopedic treatment was provided, (7) the patient had orthodontic treatment, (8) frontal photographs with calibration scale were taken after orthodontic treatment, and (9) the patient's age was 13 to 15 years. Inclusion criteria for the control group were as follows: (1) the patient had no craniofacial anomalies or syndromes, (2) Class I molar relationship was noted, (5) frontal photographs with calibration scale were taken after orthodontic treatment, and (6) the patient's age was 13 to 15 years.
From the photographs of 185 individuals with UCLP; which is the study group, 50 individuals were positioned incorrectly during taking the photographs, 19 of them were not clear, 22 individuals did not give consent, 25 individuals did not have rest and smiling photographs belonging to the same patient, 15 individuals were not in natural head position, 10 models were missing, and 4 models were broken so that they all were excluded from the study. From the photographs of 158 individuals with Class I malocclusion, which is the control group, 40 individuals were positioned incorrectly during taking the photographs, 22 of them were not clear, 12 individuals did not give consent, 35 individuals did not have rest and smiling photographs at belonging to the same patient, and 9 models were missing so that they all were excluded from the study.
Finally, the frontal photographs including smiling and rest position of 40 individuals with UCLP (mean age 14.30 ± 0.25 years; 20 female, 20 male) and 40 individuals with Class I occlusion without UCLP (mean age 14.60 ± 0.34 years; 20 female and 20 male) were selected.
Measurements were made on the right and left sides according to the morphological reference points determined on the face and the lines passing through these points. Figure 1a and b markings and measurements on the image were performed in Dolphin Imaging 11.5 Software (Dolphin Imaging and Management Solutions).
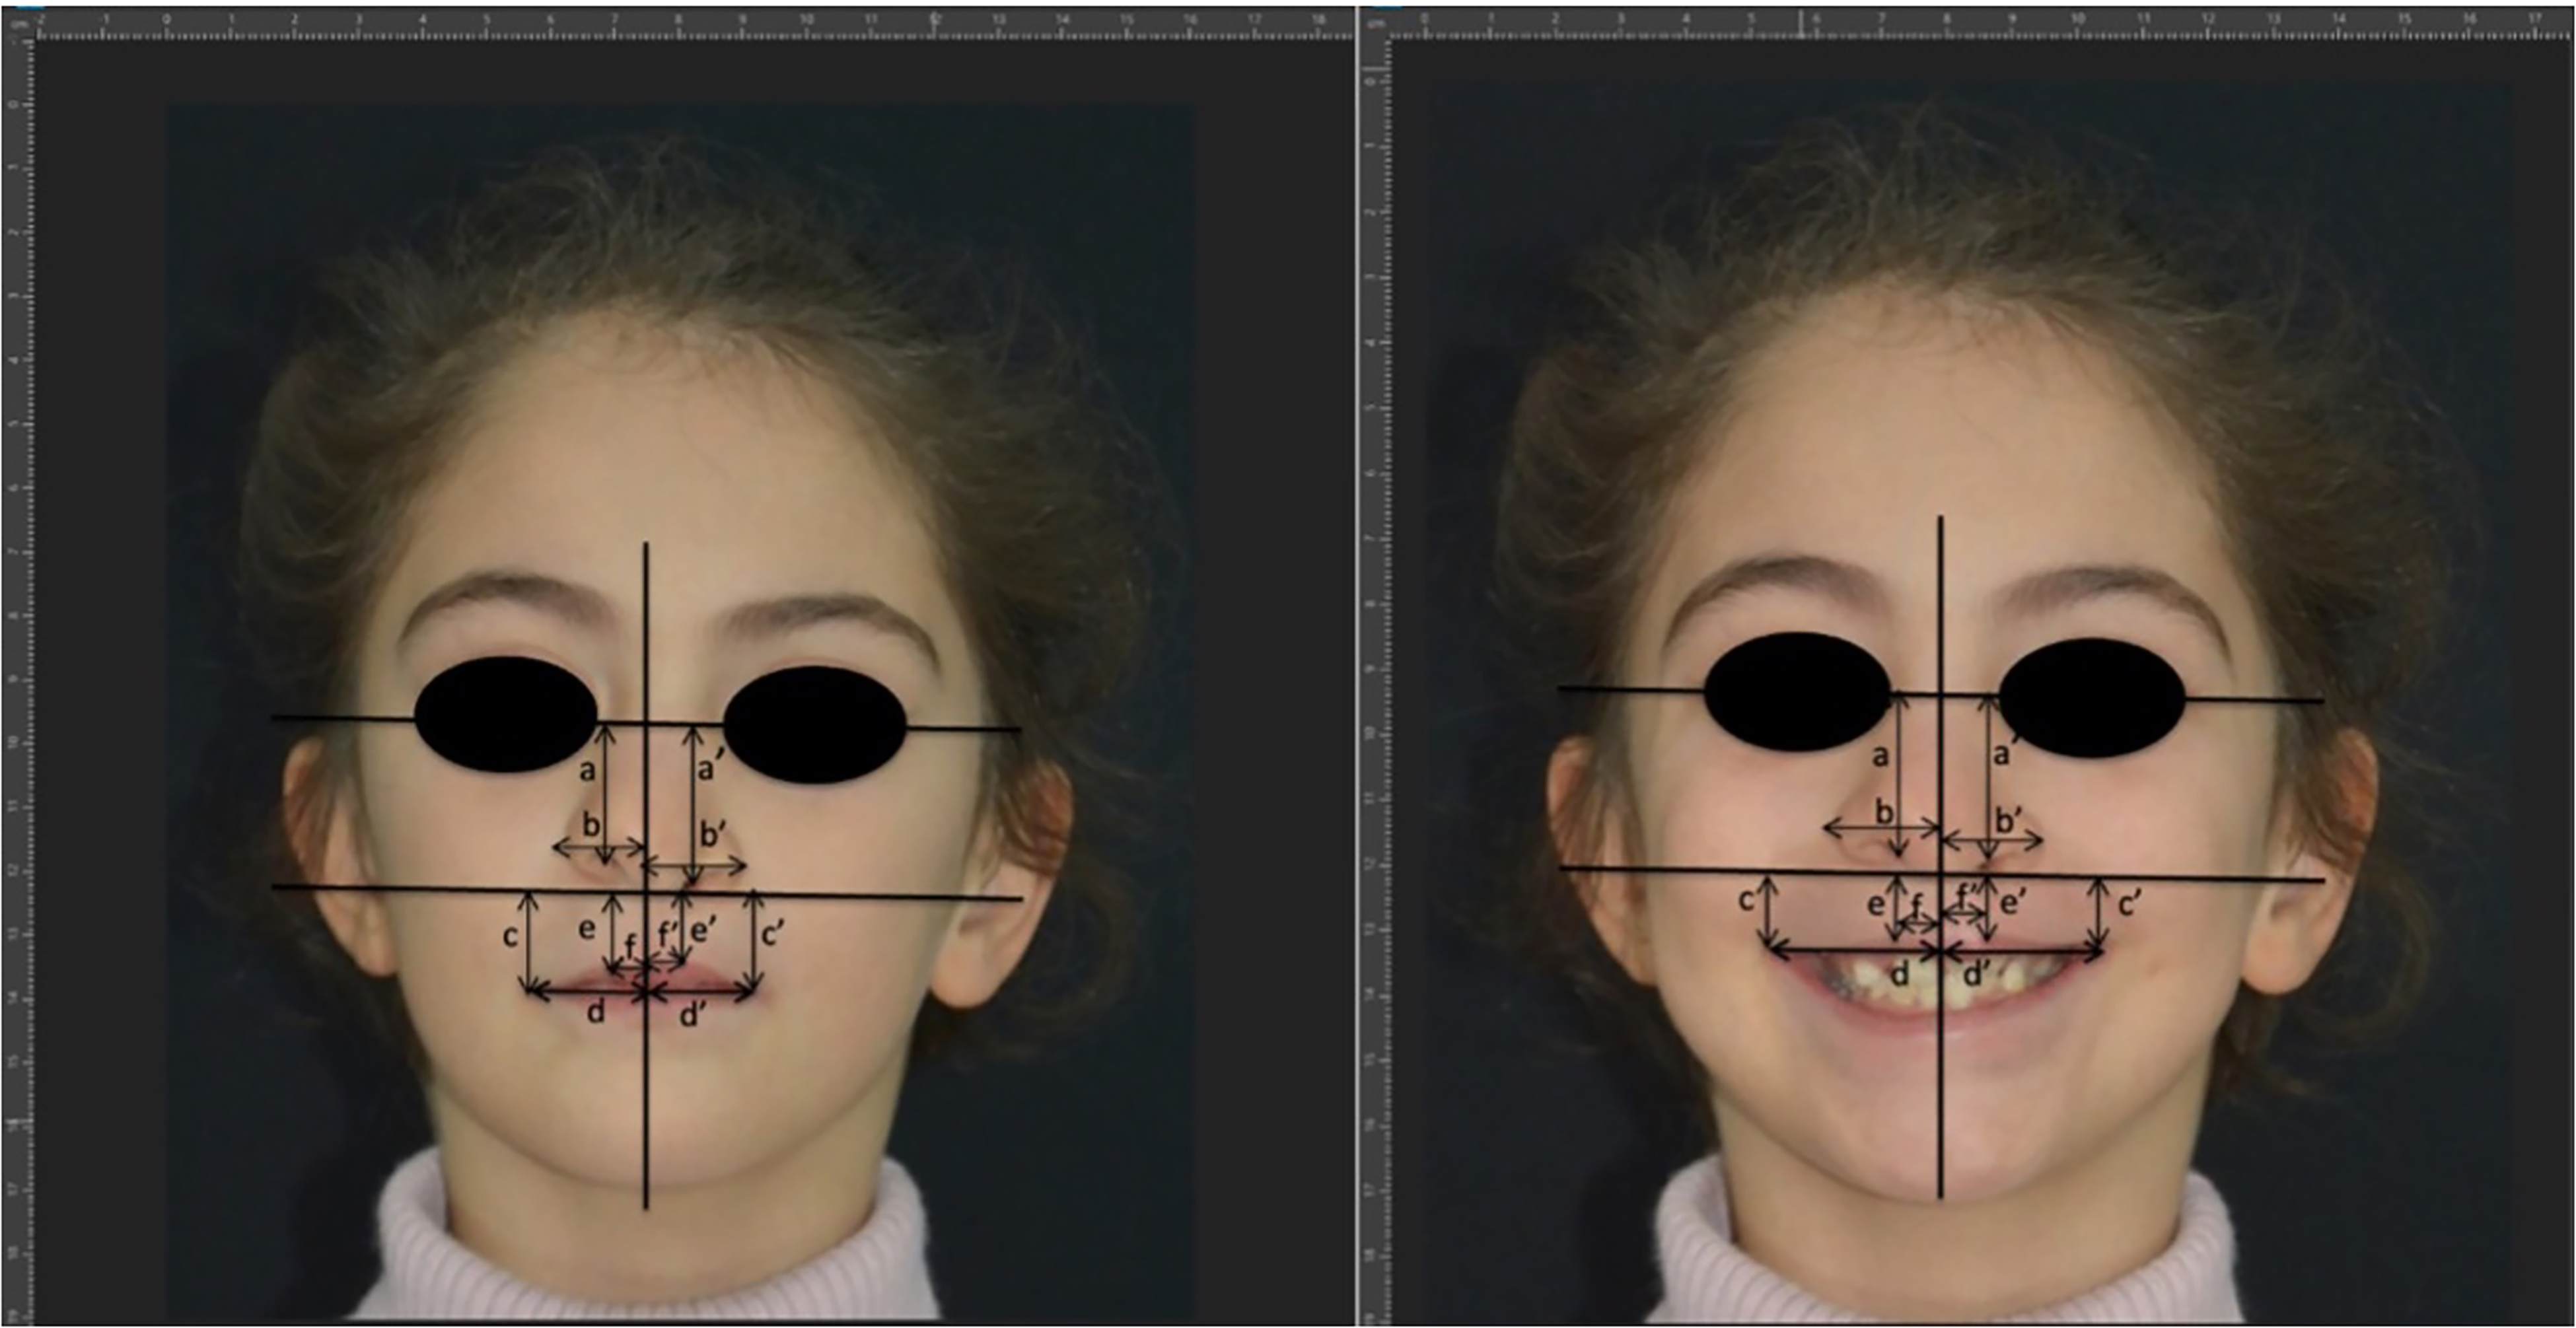
Anthropometric measurements made on frontal photographs. H1: horizontal reference line passing through inner canthi (intercanthal line). H2: reference line parallel to H1 passing through subnasale. V: reference line perpendicular to H1 and H2; intersecting H1 and H2 at the midpoint between inner canthi. a/a’: Vertical distance of the nasal wing. b/b’: Distance of the nasal wing to the midline. c/c’: Vertical distance from the corner of the mouth to the base of the alar base (vertical lip height at alar base). d/d’: Distance of mouth corners to midline (transverse lip length). e/e’: Vertical distance of crista philtri to the base of the alar base (vertical lip height at crista philtri). f/f’: Distance from crista philtri to the midline of the face a, b, c, d, e, and f represent the measurements in the non-cleft side; a’, b’ ,c’ ,d’ ,e’ and ,f’ represent the measurements in the cleft side.
All the photos were taken with the same camera, Nikon D7100 under standardized conditions. AF-S Micro-Nikkor 105 mm 1:2.8 G ED lens was used. All photographs were taken by the same experienced photographer. Before taking the photographs, glasses were removed and hair was tightened up. Individuals were positioned in the natural head position and asked to keep their eyes open and to relax their facial muscles. They were also instructed to show a neutral facial expression to avoid conscious tension of the facial musculature during capturing rest photos. For the smiling photos, the individuals were given a command so that we could see their teeth as much as possible. The patient was given a command as “give a big full smile where I can see your teeth”. A total of 15 photographs were taken of each patient at the same time and within the next 3 days. Participants were informed that repetitive photos would be taken. Thus, possible factors that may affect the repeatability of the rest and smiling positions tried to be controlled.
Among these 15 photographs, the 5 photographs that reflect the position best were determined by a single researcher, and one of these remaining photos was selected by another researcher for further analysis. At this stage, the photographs were compared among each other. The “best” photographs were those that demonstrated no muscle activity at rest and the maximum smile.
In order to calculate the magnification of each image, the mesio-distal diameter of the central incisor in the photographs and the mesio-distal diameter of the same incisor on the patient's model were measured and the amount of magnification for each image was calculated. The actual values were obtained by applying the magnification coefficient of that patient to all measurements of the patient.
The 2D symmetry assessment was performed as described by Fudalej et al. 19 Each image was loaded into the Dolphin software program and orientated so that the intercanthal line became an H1 horizontal reference line. Horizontal H2, parallel to H1, and vertical V, perpendicular to H1 and H2, lines were then formed to create a system of reference lines. The H1 line was used for measurements on the frontal photograph and H2 shows the anthropometric points used and measured distances. Each measurement was made on both cleft and non-cleft (or right and left in the control group) sides (Figure 1).
Statistical Analysis
All analyzes were performed in SPSS (version 22.0; IBM Corp.) software. The normality of the data was evaluated by Shapiro–Wilk test. Descriptive statistics were calculated for the cleft side and the non-cleft side for all measurements. For statistical differences between the cleft and non-cleft sides, an independent samples t-test was used for normally distributed data, and the Mann–Whitney U test was used for data that were not normally distributed. Differences in parameters between the cleft and non-cleft sides were calculated in the rest and smiling photos in the control and UCLP groups. The Wilcoxon signed-rank test was used to compare the data between the control and UCLP groups and within the groups and also Spearman’s correlation coefficients were calculated. Bland–Altman Levels of Agreement was determined to evaluate the differences between the right and left measurements in both groups. One month after the first measurements, the photographs were remeasured on the pictures of 20 randomly selected individuals, and the intragroup reliability was evaluated by calculating the intraclass correlation coefficients (ICCs). Statistical significance level was set at P < .05.
Results
The ICC values for the measurements were highly acceptable, ranging from 0.897 to 0.996 (mean ICC = 0.965).
Table 1 shows mean, minimum, maximum, and standard deviation values in the individuals with UCLP at rest and smiling on the cleft and non-cleft sides. At rest, in individuals with UCLP, on the cleft and non-cleft sides; the difference between the transverse lip distance (d-d’) was greater (mean diff.;−1.49 mm; −3.17 mm; −0.19 mm, 95% CI; P = .047), but vertical lip height at crista philtri (e/e’) was lesser in the cleft side (mean diff.;1.40 mm; 0.01 mm; 2.79 mm, 95% CI; P = .037), while the difference in the distance from crista philtri to the midline of the face (f/f’) was greater in the cleft side (mean diff.;−1.69 mm; −2.64 mm; −0.74 mm, 95% CI; P = .001). At smile in individuals with UCLP on the cleft and non-cleft sides; the distance of the crista philtri to the midline of the face (f/f’) was greater in the cleft side (mean diff.;−1.20 mm; −2.12 mm; −0.37 mm, 95% CI; P = .008) (Table 1).
The Descriptive Statistics of the Parameters for Measurements in non-Cleft and Cleft Sides and Results of Statistical Comparisons.
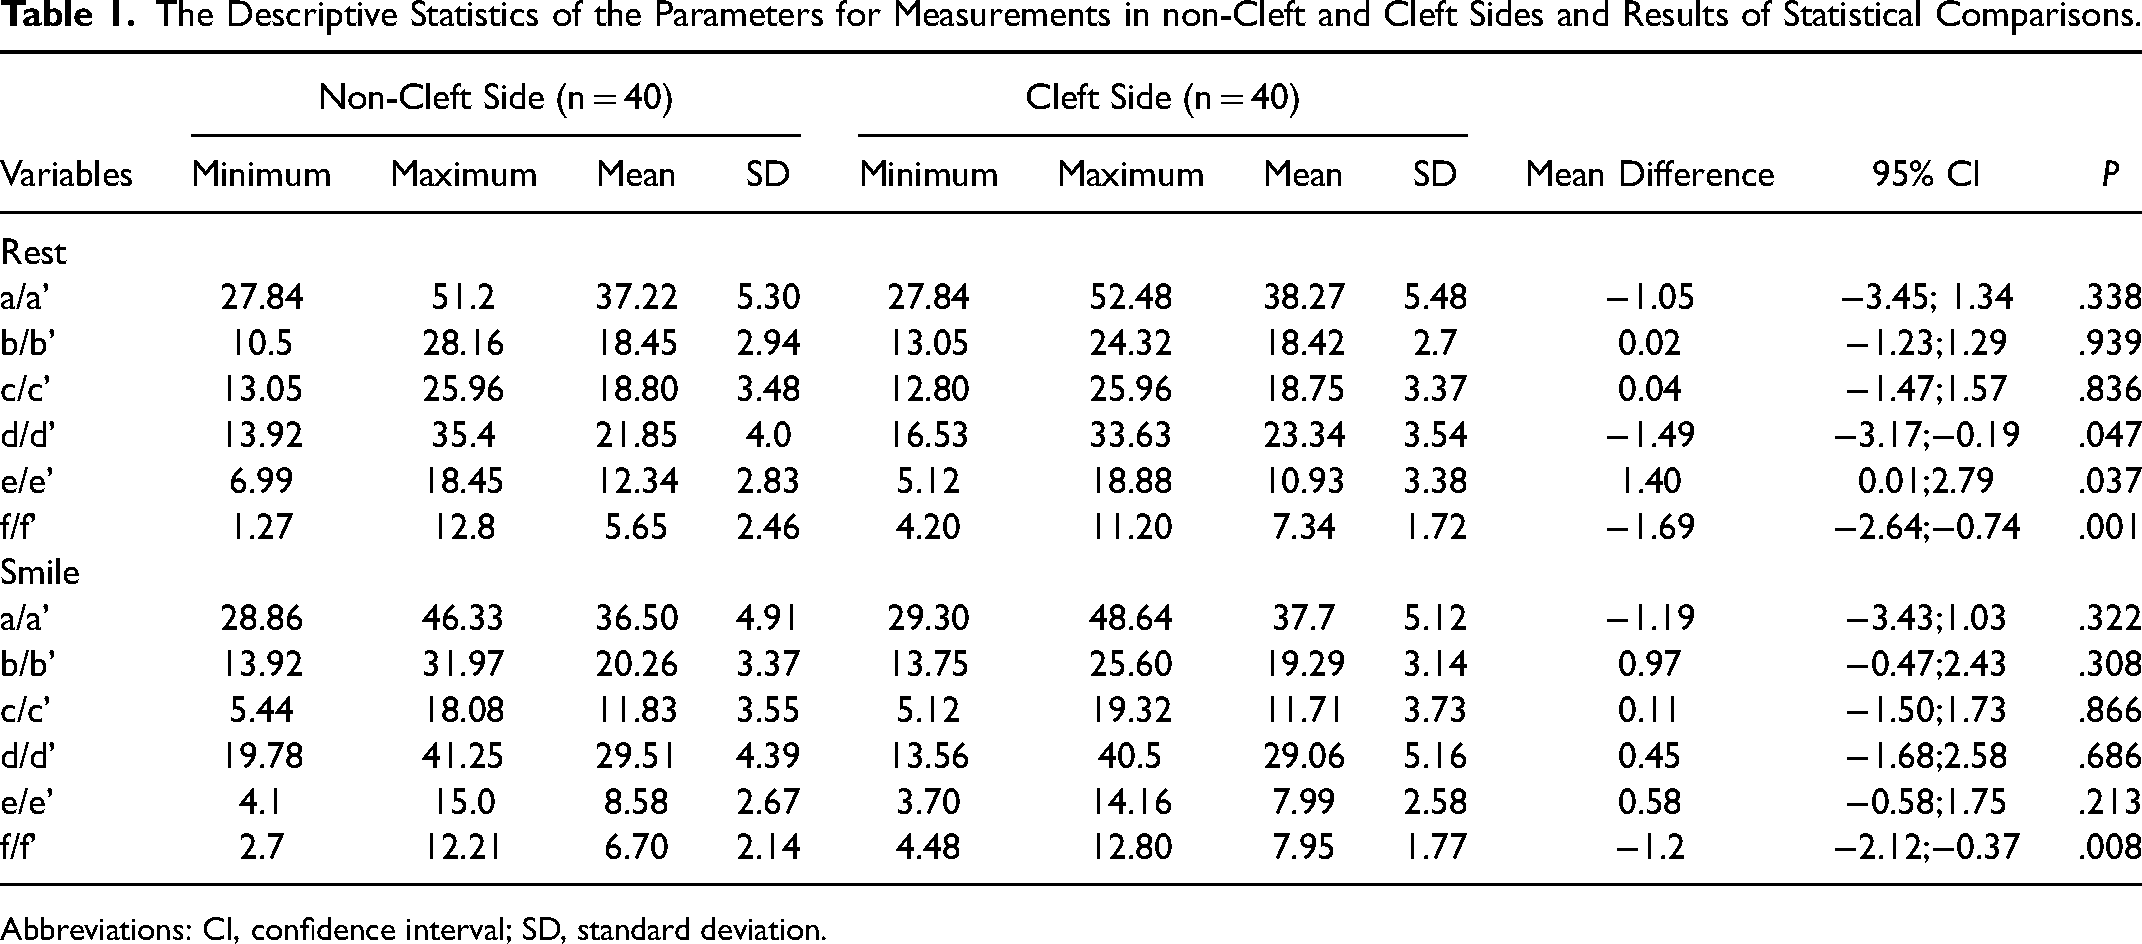
Abbreviations: CI, confidence interval; SD, standard deviation.
Differences in the transverse lip distance (d-d’) and vertical lip height at crista philtri (e-e’) were lesser in the UCLP (p = 0.001; P= .005, respectively) at smile. When the differences between the control and the UCLP groups in rest position were compared; the differences between the vertical distance of the nasal wing (a-a’) (P= .002), vertical lip height at cristi philtri (e-e’) (P = .014) and distance from crista philtri to the midline of the face (f-f’) (P = .002) and also transverse lip distance (d-d’) (P = .004) were greater in the UCLP group. The differences between the vertical distance of the nasal wing (a-a’) (P < .001) and the distance of the crista philtri to the midline of the face (f-f’) (P = .007) were greater in the UCLP group during smiling compared to control group (Tables 2 and 3).
The Descriptive Statistics of the Differences Between Left and Right Sides in Control Group and non-Cleft and Cleft Sides for all Image Groups.
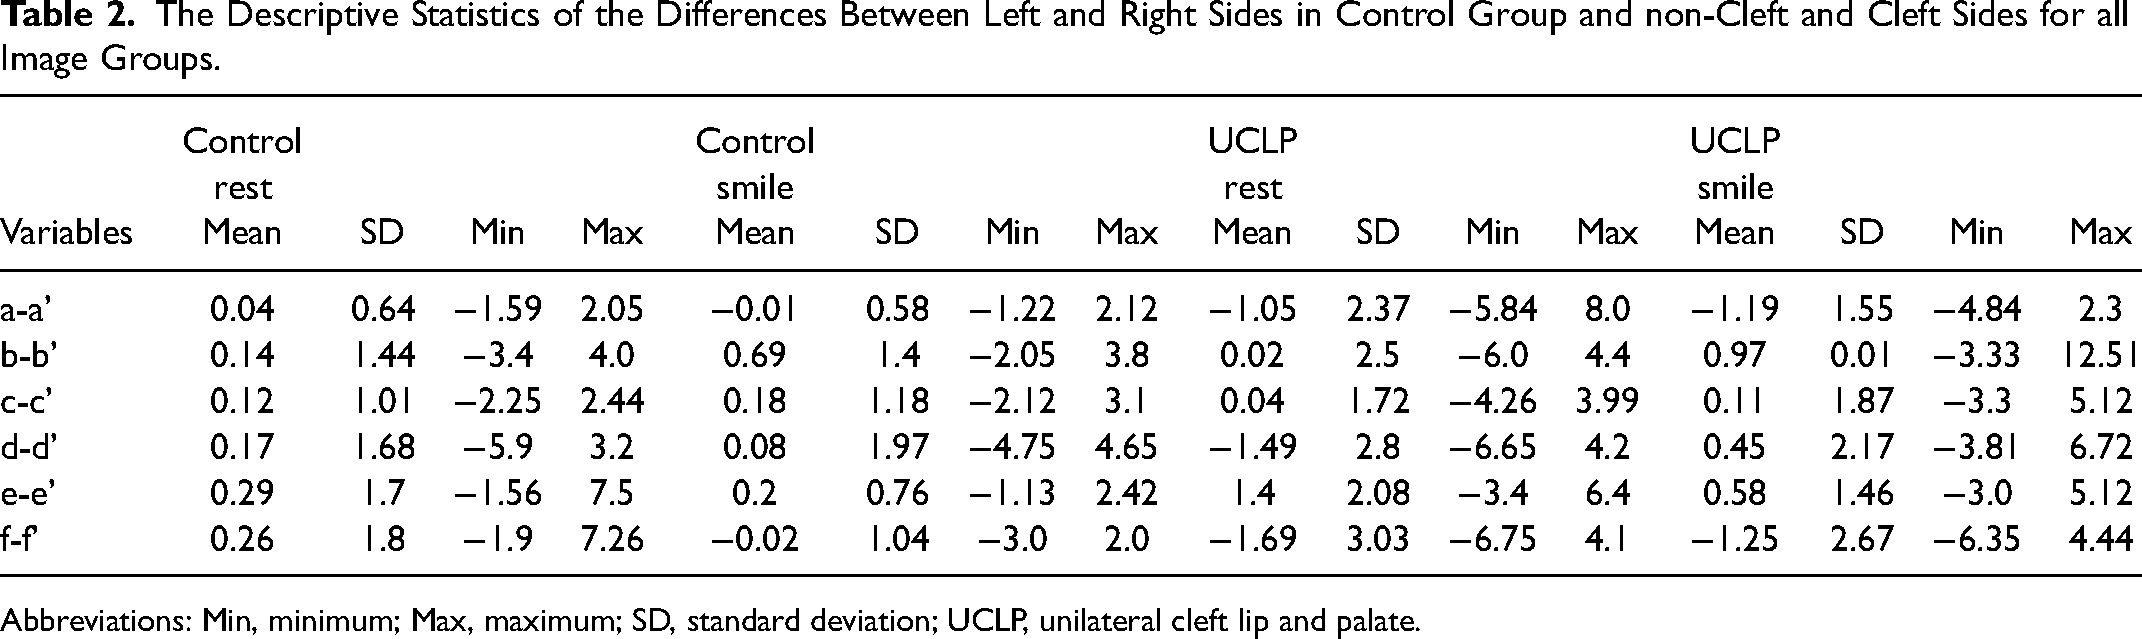
Abbreviations: Min, minimum; Max, maximum; SD, standard deviation; UCLP, unilateral cleft lip and palate.
Statistical Comparisons in the Amount of Asymmetry Among UCLP and Control Groups in Different Positions.
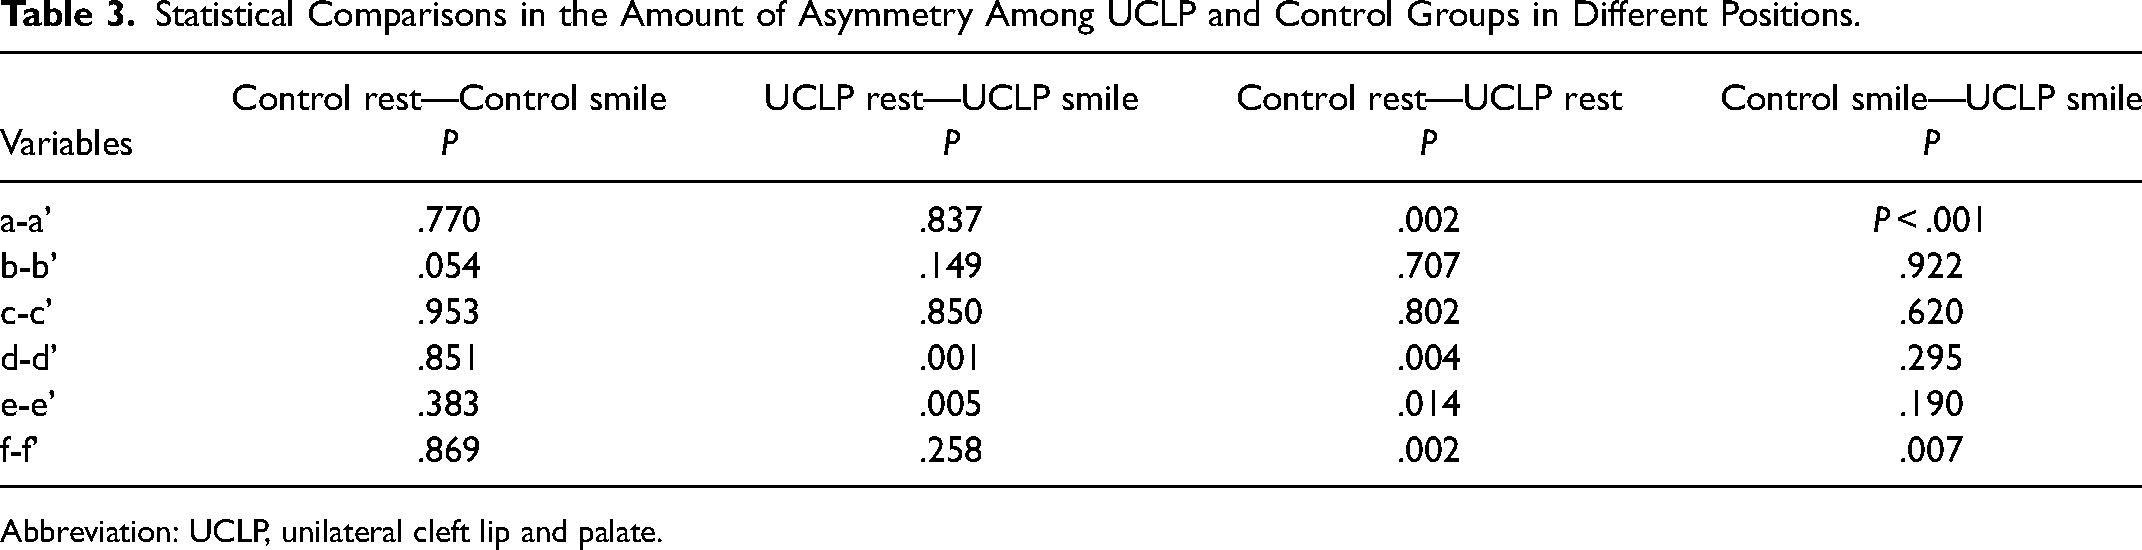
Abbreviation: UCLP, unilateral cleft lip and palate.
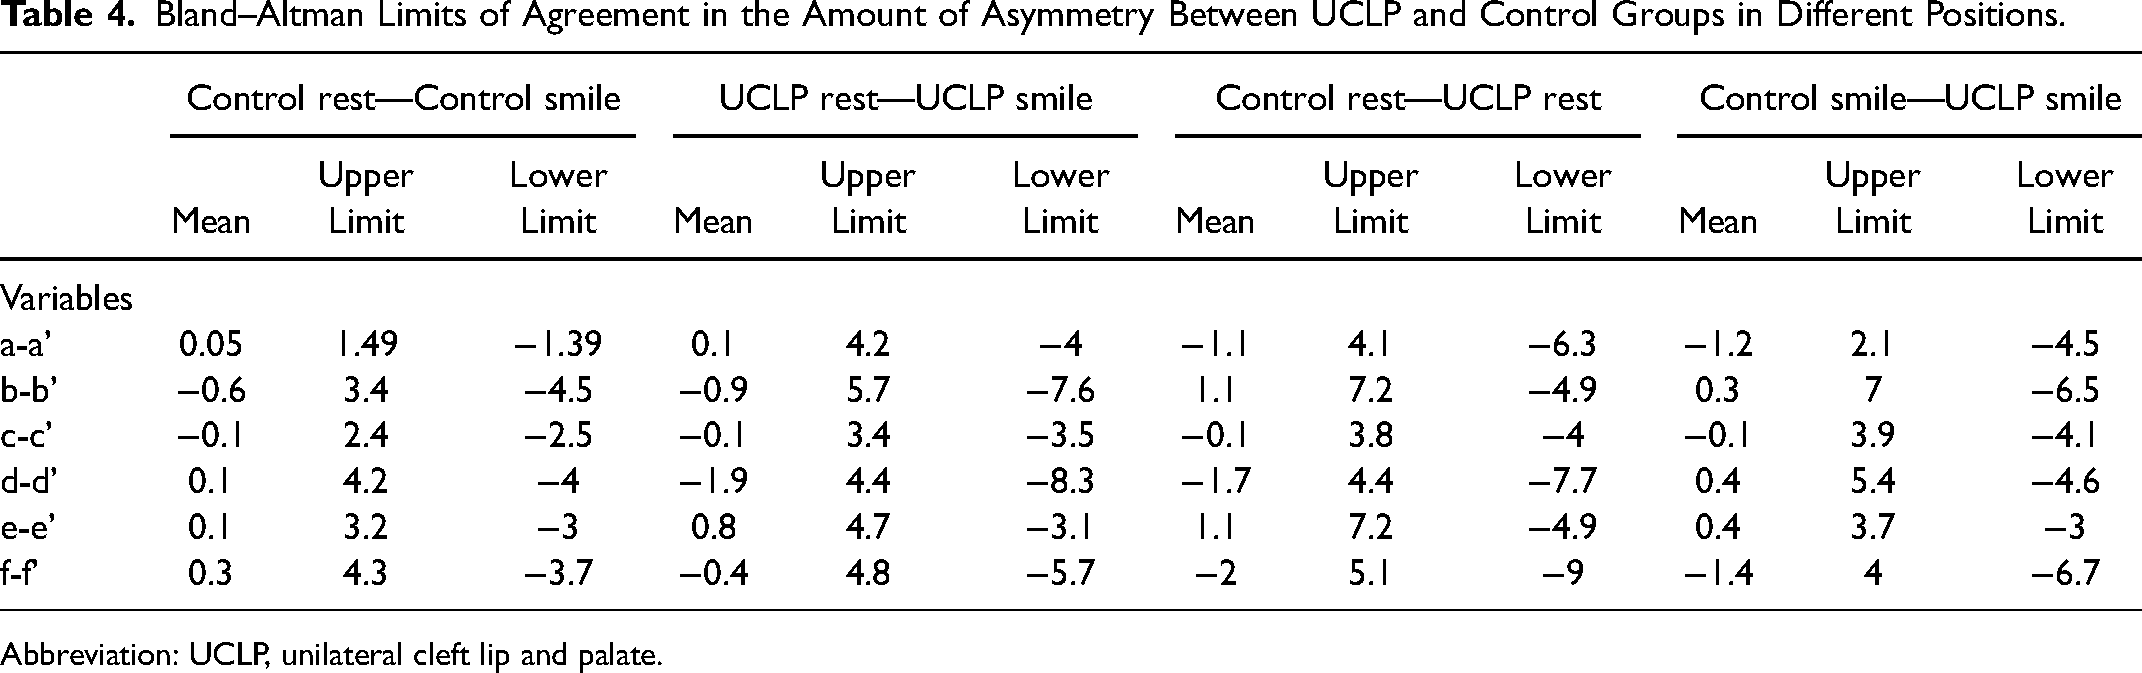
The limits of Bland–Altman Levels of Agreement in the amount of asymmetry were higher between rest and smiling photographs in individuals with UCLP. The highest difference between UCLP rest and UCLP smile was found at transverse lip distance (d-d’) as −1.9mm (upper limit 4.4, lower limit −8.3) and it is followed by (b-b’) parameter with an average of −0.9mm mean (upper limit 5.7, lower limit −7.6). The lowest difference in terms of upper and lower limits was seen as 3.4 and −3.5 in the lip height at the alar base (c-c’). The mean in (c-c’) parameter is −0.1. Also, the levels of agreement increases between control and individuals with UCLP in rest position (Table 4).
Bland–Altman Limits of Agreement in the Amount of Asymmetry Between UCLP and Control Groups in Different Positions.
Abbreviation: UCLP, unilateral cleft lip and palate.
Discussion
Several studies have explored the residual asymmetry in the nasolabial regions following the surgical repair of CLP. The assessment of nasolabial area is an important measure of the outcome of the surgical repair of cleft lip. The UCLP deformity is characterized by a short columella, a flattened nostril, a wide alar base, and an inferiorly/posteriorly displaced alar root on the cleft side. Also, an asymmetric nasal tip with relatively more projection and definition on the non-cleft side can be observed.20, 21 These residual deformities are a result of failure to correct, undercorrection, or relapse.
Studies investigating asymmetry in individuals with cleft lip have used facial measurements, and static 2D and 3D photography. The nose/lip/mouth area, however, is rarely static in our day-to-day social interactions. The method of photographic assessment is meant to be a straightforward and reliable way to assess facial esthetics.9, 11, 18 We evaluated 2D frontal photographs of 40 individuals with nonsyndromic UCLP and 40 skeletal Class I individuals without CLP in our study.
Darby et al. 1 examined the effect of smiling on facial asymmetry in non-cleft adults and concluded that overall facial asymmetry increased in magnitude from rest to natural and to maximum smile. Hallac et al. 22 stated that during a lip pucker with maximal orbicularis oris contraction, individuals with CLP have an increased facial asymmetry during voluntary smile. Despite the surgical lip repair, the motion path shape during the expressions was more asymmetric in comparison to non-affected individuals.
Al Rudainy et al. 23 evaluated the symmetry of face in 13 patients aged 4 years old with UCLP using stereophotogrammetry. At rest, residual asymmetries were identified at the vermillion of the upper lip, and vertical and anteroposterior asymmetries were identified on the cleft side. Asymmetry of the upper lip significantly increased at maximum smile as a result of the upward forces of all perioral lifting muscles.
In this study, the 2D assessment showed no significant changes in distance of the alar base to the midline. On the other hand, labial asymmetry was significantly less in the control versus the UCLP group.
Some of the investigators concluded that nasal and/or labial asymmetry improved after an alveolar bone graft.24–26 In contrast, Sander et al. 27 did not observe any significant improvement in the nasal asymmetry. Thierens et al. 28 investigated whether an autologous alveolar bone graft has an effect on the nasolabial asymmetry in 15 patients with CLP, and they stated that alveolar bone grafting completes the alveolar ridge but did not significantly improve the asymmetry of the nasolabial area The alveolar bone graft patients with an average of 9 years old were evaluated in this study.
Nasolabial asymmetry is a common finding in UCLP and numerous studies, using various methods to evaluate facial morphology, have shown that the cleft and non-cleft sides of the face differ. Fudalej et al. 19 investigated nasolabial symmetry from the frontal and basal photographs of 60 consecutively treated children with complete UCLP, (aged 11.2 years) and 44 children without clefts (aged 11.2 years). They showed that complete UCLP had more asymmetrical nasolabial areas than children without clefts.
The results of our investigation support the findings of earlier studies. Nasolabial asymmetry is more evident in the rest position in the UCLP group.19, 27 In our study, unlike previous studies, we investigated nasolabial asymmetry in smiling position and compared them with controls without UCLP.
At maximum smile, residual asymmetries at the nares and the philtrum were accentuated because of the abnormal functioning of orbicularis oris muscle and lateral aleaque nasi muscle. Trotman et al. 29 and Trotman et al. 30 linked these abnormalities to the mechanical limitations in maximum movements secondary to lip scarring and the impairment of the maximum force capacity of the lip muscles in cleft cases. Horizontally, at maximum smile; the upper lip shifted significantly toward the scar tissue of the cleft side. The increase in anteroposterior asymmetry at maximum smile is partially due to the inadequate underlying bone support in complete UCLP cases, which disturbs the force balance of the facial muscles. The asymmetry of the upper lip significantly increased at maximum smile.
Darby et al., 1 evaluated the effect of smile on facial asymmetry in 20 patients with Class I occlusion. Overall 3D facial asymmetry scores for the sampled Caucasian adults with clinically symmetrical faces increased in magnitude from rest to natural and to maximal smile. They concluded that clinicians should evaluate the patients at rest and also during maximal smile with unilateral posterior crossbite, UCLP, or skeletal asymmetry before and during the treatment as part of an outcome assessment.
Russell et al. 31 , found that nostril shape irregularity and, to a lesser degree, nostril perimeter correlated with facial appearance. On the other hand, Roberts-Harry et al. 32 could not find any relationship between nasal morphology and facial attractiveness. Russell and Tompson, 33 reported similar findings. In our study, there is a statistically significant difference in the vertical distance of the nasal wing (a-a’) between the rest and smiling in control and UCLP group. Forty patients were compared in each group with an age range from 13 to 15. Comparing the motion path of key landmarks in the upper lip demonstrated statistically significant differences in both the magnitude and shape of motion during smiling and rest between cleft and non-cleft groups.
In the literature, most of the studies state that people with CLP are negatively affected by their facial appearance and speech, which may result in psychosocial difficulties. There are also studies that find patients with UCLP to be psychosocially well adjusted, even if they are not satisfied with their facial appearance.34–36
In clinical studies meant to evaluate the changes after treatment, a control group should be included so that the changes that occurred with growth and development can be accounted for. 37 In this study, individuals with UCLP were compared with individuals with Class I occlusion as a control group. It is known that individuals with clefts are prone to facial and dental Class III patterns with continued growth and development. For this reason, it might be preferable to use Class III individuals as the control group in order to reflect the population better. 38 Although the aforementioned proposal is not always valid, we think that it may be valuable to compare individuals with UCLP and Class III individuals with the specified parameters in order to increase the clinical power of the study. Therefore, future studies comparing individuals with UCLP with Class III individuals can be conducted. However, this study does have its own internal controls with smiling and rest in UCLP being compared. 39
The following can be stated as the limitations of this study. Considering the complex anatomy of the nasolabial region, especially in individuals with CLP, it is not possible to evaluate possible morphological asymmetries in the whole region with 2D imaging methods. Obtaining more detailed information is only possible with further analysis of photographs obtained with 3D surface scanners. However, we think that the data obtained with the methods we used, which are accessible to most every clinician, is clinically useful. The expense and difficulties in accessibility inherent with 3D imaging systems and the software needed for further analysis, may be prohibitive in much of the world. On the other hand, when the psychosocial conditions of individuals with CLP are considered, there may be problems in obtaining their real smiles although photos were repetitively taken on the same day and different days. One of the main limitations of this study was the static rather than the dynamic recording of smile. Various factors could have contributed to the asymmetry of facial expression, which includes the magnitude, pattern, and the speed of facial muscle movements at the cleft and the non-cleft sides.
Conclusion
In individuals with UCLP, the nasolabial region asymmetry was significantly different from the control group individuals without CLP. The difference in nasolabial asymmetry was more prominent in rest position in individuals with UCLP, while this difference was less noticeable during smiling. This should be considered in the planning of surgical and orthodontic treatments.
Footnotes
Acknowledgments
There is no support in the form of grants, equipment, or drugs.
Declaration of Conflicting Interests
The author(s) declared no potential conflicts of interest with respect to the research, authorship, and/or publication of this article.
Funding
The author(s) received no financial support for the research, authorship, and/or publication of this article.