
Abstract
Objectives
Rapid palatal expanders (RPEs) are commonly used in patients with cleft lip and palate (CLP) prior to secondary alveolar bone grafting (SABG). Their position and size can impede tongue movement and affect speech. This study assessed changes in perception and production of speech over the course of RPE treatment.
Design
Prospective longitudinal.
Setting
Tertiary university-affiliated hospital.
Participants
Twenty-five patients with unilateral CLP treated with Fan-type RPEs, and their parents.
Interventions
Patient and parent speech questionnaires and patient speech recordings were collected at baseline before RPE insertion (T1), directly after RPE insertion (T2), during RPE expansion (T3), during RPE retention (T4), directly after RPE removal but before SABG (T5), and at short-term follow-up after RPE removal and SABG (T6).
Main Outcome Measures
Ratings for patient and parent questionnaires, first (F1) and second (F2) formants for vowels /a/, /i/, and /u/, and nasalance scores for non-nasal and nasal sentences, were obtained and analyzed using mixed model analyses of variance.
Results
Ratings worsened at T2. For the vowel /a/, F1 and F2 were unchanged at T2. For the vowel /i/, F1 increased and F2 decreased at T2. For the vowel /u/, F1 was unchanged and F2 decreased at T2. Nasalance was unchanged at T2. All outcome measures returned to T1 levels by T4.
Conclusions
RPE insertion resulted in initial adverse effects on speech perception and production, which decreased to baseline prior to removal. Information regarding transient speech dysfunction and distress may help prepare patients for treatment.
Introduction
Cleft lip and palate (CLP), the most prevalent congenital craniofacial malformation,1,2 is accompanied by deficient growth of the maxilla in the transverse dimension as a consequence of surgical interventions and functional distortions, as well as intrinsic developmental limitations.3,4 Accordingly, an early and frequent observation is the occurrence of a true skeletal imbalance in width of the maxilla to the mandible (with associated dentoalveolar crossbite), which progressively worsens with maturation.5–11 Maxillary constriction manifests predominantly in the anterior region such that the arch takes on a distinctive triangular or v-shape appearance. 12 Patients with CLP therefore represent a large population likely to benefit from the provision of treatment with a rapid palatal expander (RPE).
An RPE is an orthodontic appliance that widens the maxillary arch. Since more anterior than posterior maxillary expansion is needed in patients with CLP, a Fan-type RPE is preferred.13–17 The Fan-type RPE consists of molar bands, used to anchor the appliance, and a palatal spider-type screw, used to activate the appliance for differential anteroposterior expansion. 18 Consistent with the accepted standard of care, expansion of the palate is performed during the mixed dentition stage prior to secondary alveolar bone grafting (SABG), so orthodontic retention to prevent collapse of the palate is necessary until the day of the procedure.19–23
RPEs occupy substantial space within the oral cavity and impede lingual gestures in speech production. 24 Studies of patients without CLP have evaluated subjective and objective speech outcomes associated directly with wearing an RPE24–26 or indirectly with oral and nasal airway changes following an RPE.27–29 De Filippe et al. 25 conducted a retrospective investigation using nonstandardized speech questionnaires and found that patients self-reported increased speech difficulty with expanders of the Hyrax, Haas, and Quad-helix types. Problems with pronunciation were perceived initially but resolved within one week. Stevens et al. 24 and Biondi et al. 26 conducted prospective investigations using speech recordings of patients with Hyrax-type expanders. Acceptability of speech, rated by naive listeners, was compared to acoustic measures. Immediately following placement of the RPE, speech acceptability deteriorated significantly, and acoustic analysis showed centralization of the vowel /i/. Stevens et al. 24 found no difference with respect to banded or bonded 4-arm Hyrax-type expanders, whereas Biondi et al. 26 found significantly less speech impairment with the banded 2-arm compared to the banded 4-arm Hyrax-type expander. Although all speech outcomes improved over time and most speakers returned to their previous baseline levels after 2 to 3 months with the RPE, the studies demonstrated the temporary but considerable adverse effects of the device on speech.
Speech is a particularly important topic in children with CLP because they often present with salient and characteristic disorders of articulation and oral–nasal balance. 30 Articulation disorders in speakers with CLP are divided into obligatory (or passive) errors, related to anatomical differences resulting from the cleft, and into compensatory (or active) errors, where patients circumvent structural issues by substituting target sounds with phonemes outside their language's sound system.31–33 By occupying space on the palate, an RPE could potentially exacerbate both types of articulation disorders. Oral–nasal balance disorders in speakers with CLP include hypernasality, hyponasality, and mixed nasality. 34 Hypernasality results most often from velopharyngeal dysfunction. 30 However, oronasal fistulas can also cause or exacerbate the condition,35,36 and an RPE may increase the size of existing fistulas or create new ones. 37
Patient concerns of speech impediments can threaten acceptance of and compliance with many orthodontic interventions, 38 so it is critical to understand how an RPE may affect the speech of patients with CLP. Although there is a gap in the orthodontic literature regarding the impact of RPEs on the speech of children with CLP, research in typical speakers demonstrated that the obstruction of the anterior palate and alveolar ridge by an RPE negatively affects speech articulation. 24 Anterior vowels such as /i/ require the tongue to elevate and approximate the anterior palate.24,25,39,40 Several factors affect the extent to which speakers can compensate for such speech perturbations. Large structural obstacles, such as RPEs, are accommodated gradually in typical speakers. 24 Different individuals show considerable variability in their ability to compensate, 41 and speakers with a history of speech disorders tend to take longer to adapt.24,42,43 Whether oral–nasal balance is affected by an RPE is not known. Inadvertent opening of new or enlarging of existing oronasal fistulas (from palatal expansion) could increase nasality, 37 but blocking of oronasal fistulas (from palatal obturation) could decrease nasality. 44
The current study investigated how speaker self-perception and acoustic measures of speech production were affected by treatment with an RPE, and how adaptation occurred over time. Two types of outcome measures were obtained. Questionnaires were used to capture the views of the patients and their parents about speech with an RPE. Incorporating the patient (and parent) perspective offers clinically meaningful measures of speech outcomes.45–48 Patient self-reports and proxy reports from parents both merit consideration.49,50 These self-perception measures were supplemented with acoustic spectrographic measures. Vowel sounds are characterized by peaks of acoustic energy, which are called formants. The lowest 2 formants are the primary acoustic correlates of vowel type. They are linked to the opening of the mandible and to the elevation and protrusion of the tongue.51–55 A reduction in tongue movement related to the RPE would be reflected in changed distances between the vowel formants. For the assessment of oral–nasal balance in speech, computer-based nasometry provides a nasalance score that quantifies the proportion of the nasal to the combined oral and nasal speech signal.45,56,57 High scores for speech stimuli devoid of nasal sounds indicate hypernasality and low scores for speech stimuli loaded with nasal soundsindicate hyponasality.58,59 A possible impact of an RPE on oral–nasal balance would be reflected in corresponding changes in the nasalance scores.
Two hypotheses (H) were tested in the present study:
H1—Patients’ self-perception and parents’ perception of speech-related dysfunction and distress would be worsened after RPE placement, shown by increased ratings from speech questionnaires. H2—Articulation of the high-front vowel /i/ and high-back vowel /u/ would be centralized after RPE placement, shown by increased first and/or decreased second formants from speech recordings.
The current study also investigated whether oral–nasal balance, assessed with nasalance scores from speech recordings, would change throughout RPE treatment. This research question was explorative and not motivated by a specific hypothesis.
Methods
Participants
Patients with nonsyndromic unilateral CLP (UCLP) presenting to the Orthodontic Clinic at The Hospital for Sick Children were assessed by a staff orthodontist to determine the requirement of treatment with a Fan-type RPE prior to a SABG procedure.
Twenty-five patients (14 males, 11 females) between 7.20 and 11.67 years of age (mean, 9.00; standard deviation [SD], 0.99) with UCLP were included in the study, using a convenience sampling approach. The UCLP was complete in 18 patients, incomplete in 7 patients, right-sided in 10 patients, and left-sided in 15 patients. None of the participants were undergoing speech therapy while the RPE was in place.
Approval for this prospective longitudinal study was granted by the Research Ethics Boards of the University of Toronto (protocol number 00035427) and The Hospital for Sick Children (protocol number 1000057703) in Toronto, Ontario, Canada.
Morphologic Characteristics
Maxillary arch width was recorded pre- and post-expansion. Arch width was measured with a standard Boley gauge by the same investigator (KS). Pre-expansion measurements were taken extraorally (on dental casts) and post-expansion measurements were taken intraorally as the distances between the cusp tips of the primary canines (3-3), the mesiobuccal cusp tips of the primary first molars or buccal cusp tips of the permanent first premolars (4-4), the mesiobuccal cusp tips of the primary second molars or buccal cusp tips of the permanent second premolars (5-5), and the mesiobuccal cusp tips of the permanent first molars (6-6). To assess intraexaminer measurement accuracy, 15 randomly selected pre-expansion measurements on dental casts were taken in duplicate with at least one month of separation between measurements.
Oronasal fistula location and size (where present) were recorded pre- and post-expansion. In the case of multiple fistulas, each fistula was considered a discrete entity. Fistula width and length (or major and minor diameter) were measured intraorally with a standard Boley gauge by the same investigator (KS). Fistula area (ellipse) was estimated by the formula: area = [major diameter / 2] × [minor diameter / 2] × π. Fistula size was grouped by area based on diameter equivalents60–62 into 4 categories: pinhole or narrow slit, <0.8 mm2 (diameter <1 mm); small, 0.8 to 7.0 mm2 (diameter 1.0-2.9 mm); medium, 7.1 to 19.5 mm2 (diameter 3.0-5.0 mm); and large, >19.5 mm2 (diameter >5.0 mm).
Data Collection
Timeline
Data collection of patient and parent speech questionnaires and patient speech recordings was completed at 6 time points. T1 (baseline) occurred 0.00 to 0.50 months (mean, 0.29 months) before RPE insertion. T2 occurred on the day of and immediately following RPE insertion. T3 occurred 1.00 to 1.50 months (mean, 1.08 months) after RPE insertion, during the active expansion phase. T4 occurred 4.50 to 6.50 months (mean, 5.75 months) after RPE insertion, during the passive retention phase. T5 occurred on the day of and immediately following RPE removal but preceding SABG. T6 (short-term follow-up) occurred 4.75 to 7.00 months (mean, 6.25 months) after RPE removal and SABG.
Speech Questionnaires
For the assessment of patient and parent perceptions of speech, each patient and parent completed separate questionnaires consisting of 10 items addressing concerns with speech dysfunction and distress. Responses to each item were recorded on an ordinal 5-point scale with options: 0, Never; 1, Almost Never; 2, Sometimes; 3, Often; and 4, Always. All items were unidimensional with a higher response reflecting a worse outcome. The items comprising the patient questionnaire were derived with permission from the field-test version of the CLEFT-Q© before the development of this tool had concluded.46–46 Since the CLEFT-Q© is solely a patient-reported outcome measure, 7 items from the field-test version were adapted to create an explorative parent questionnaire, so that there were 7 matched and 3 unmatched items between the patient and parent questionnaires.
Speech Recordings
For the assessment of articulation of speech, each patient read 9 vowel-consonant-vowel (VCV) sequences aloud, each repeated 3 times. The vowels (/a/, /i/, /u/) represent the extreme positions of vowel articulation in Canadian English.
For the assessment of oral–nasal balance of speech, each patient read a non-nasal sentence (“Look at this book with us - it's a story about a zoo”) and a nasal sentence (“Mama made some lemon jam”) aloud, each repeated 3 times. 56 These are commonly used to detect hypernasality and hyponasality in speech.63–65
All speech recordings were made in a quiet office by the same investigator (KS) using a Nasometer 6200 headset (KayPENTAX), which features a horizontal sound-separator plate with a microphone on either side so that nasal and oral sound can be recorded separately. The signal balance of the microphones on the headset was periodically verified using the calibration procedure according to manufacturer instructions. All speech recordings were made on a handheld digital audio recorder (Tascam DR-05; TEAC) at a sampling rate of 44.1 kHz stereo (16 bit).
Data Analyses
Measurement of Questionnaire Ratings
Auditory-perceptual analyses were completed for the patient and parent questionnaires. An overall questionnaire rating (Min, 0; Max, 40) was given by the sum of responses to all 10 items. An additional matched questionnaire rating (Min, 0; Max, 28) was given by the sum of responses to the 7 matched items. The CLEFT-Q© was under development at the time of initiation of the study. The psychometric properties, scoring procedures, and external validity reported by Wong Riff et al. 46 do not apply to the derived questionnaires in this study. As such, the data were analyzed as ad hoc measures and should not be interpreted as formal CLEFT-Q© scores.
Measurement of Vowel Formants
Acoustic analyses were completed for the vowels /a/, /i/, and /u/ using the Praat (version 6.1.16) software. 66 A wide-band spectrogram was produced for each VCV sequence, and 2 vertical markers manually placed by the same investigator (VB) served to demarcate the intervals containing the stressed vowel sounds. In each case, 3 tokens of the stressed vowel sound were selected from the respective VCV sequences: the stressed /a/ sounds from the 3 VCV sequences “asa, asha, aza,” the stressed /i/ sounds from the 3 VCV sequences “isi, ishi, izi,” and the stressed /u/ sounds from the 3 VCV sequences “usu, ushu, uzu.” The center frequencies of the first (F1) and second (F2) formants of each labeled vowel sound were measured using the formant tracker tool based on a long-term linear predictive coding analysis. A custom batch-processing script with standard parameter settings (Burg method: search for 5 formants in 5500 Hz; window 25 ms; time-step 2.5 ms; preemphasis from 50 Hz) was developed to aid in this process. F1 and F2 for each vowel were measured as mean values over the entire duration of the labeled vowel interval.
Measurement of Nasalance Scores
Nasality analyses were completed for the non-nasal and nasal sentences using the Praat software. The amplitudes of the nasal and oral sounds in each sentence were measured. The proportion of nasal sound in the speech signal was expressed as a percentage nasalance score, given by the formula: % nasalance = nasal / [nasal + oral] × 100. 56 A custom batch-processing script with parameter settings that approximated the filter characteristics of the Nasometer 6450 (KayPENTAX) software (Hanning band-pass filter frequency 250-750 Hz; roll-off 200 Hz) was developed to aid in this process. Nasalance scores for each sentence were calculated as mean values over the entire duration of the sentences.
Statistical Analyses
Statistical analyses were completed using SAS (version 9.4) software. Intraexaminer reliability for measurement of maxillary arch width was evaluated using the intraclass correlation coefficient and the Dahlberg's error. Agreement between patient- and parent-reported outcome measures was evaluated using a Pearson correlation coefficient for the matched questionnaire rating and Kendall's tau-b correlation coefficient for the matched questionnaire items. Effect of time point was evaluated using a mixed model analysis of variance (ANOVA) with post hoc Tukey-Kramer tests for all outcome measures. Association between nasalance scores and oronasal fistula size was tested using Spearman correlation coefficient. Test results with a value of P < .05 (adjusted for multiple comparisons where applicable) were required for statistical significance.
Results
Maxillary Arch Width
The intraclass correlation coefficients for the assessment of intrarater reliability were between 0.998 (95% CI, 0.995-0.999) and 1.000 (95% CI, 0.998-1.000) for all dental reference points. The average measurement error was 0.1 mm.
Pre-expansion (Table 1), arch width ranged from 20.5 to 37.2 mm (mean, 28.2 mm) at 3-3, 20.5 to 43.7 mm (mean, 34.9 mm) at 4-4, 30.5 to 51.1 mm (mean, 42.0 mm) at 5-5, and 41.0 to 57.0 mm (mean, 50.0 mm) at 6-6.
Maxillary Arch Width at Pre- and Post-Expansion.a
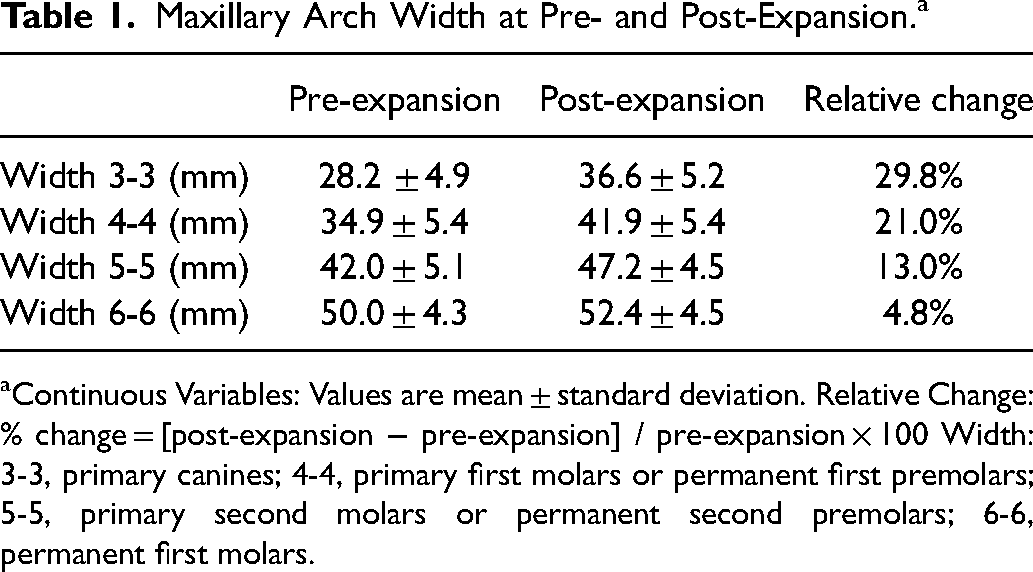
Continuous Variables: Values are mean ± standard deviation. Relative Change: % change = [post-expansion − pre-expansion] / pre-expansion × 100 Width: 3-3, primary canines; 4-4, primary first molars or permanent first premolars; 5-5, primary second molars or permanent second premolars; 6-6, permanent first molars.
Post-expansion (Table 1), arch width had been increased by a mean of 8.4 ± 1.6 mm (29.8%) at 3-3, 7.0 ± 2.4 mm (21.0%) at 4-4, 5.2 ± 1.9 mm (13.0%) at 5-5, and 2.4 ± 1.2 mm (4.8%) at 6-6. This corresponded to a differential expansion between anterior and posterior regions at a ratio of 3.5:1, respectively.
Oronasal Fistula Location and Size
Pre-expansion (Table 2), presence of at least one oronasal fistula was noted in 17 of 25 patients (68.0%). Further subdivided with respect to location, 13 patients (52.0%) had only a labial-alveolar fistula, 1 patient (4.0%) had only a palatal fistula, and 3 patients (12%) had both a labial-alveolar and a palatal fistula. Accordingly, a total of 20 fistulas (16 labial-alveolar, 4 palatal) occurred in the 25 patients. The distribution of fistula sizes was 10.0% pinhole or narrow slit, 30.0% small, 50.0% medium, and 10.0% large.
Oronasal Fistula Location and Size at Pre- and Post-Expansion.a
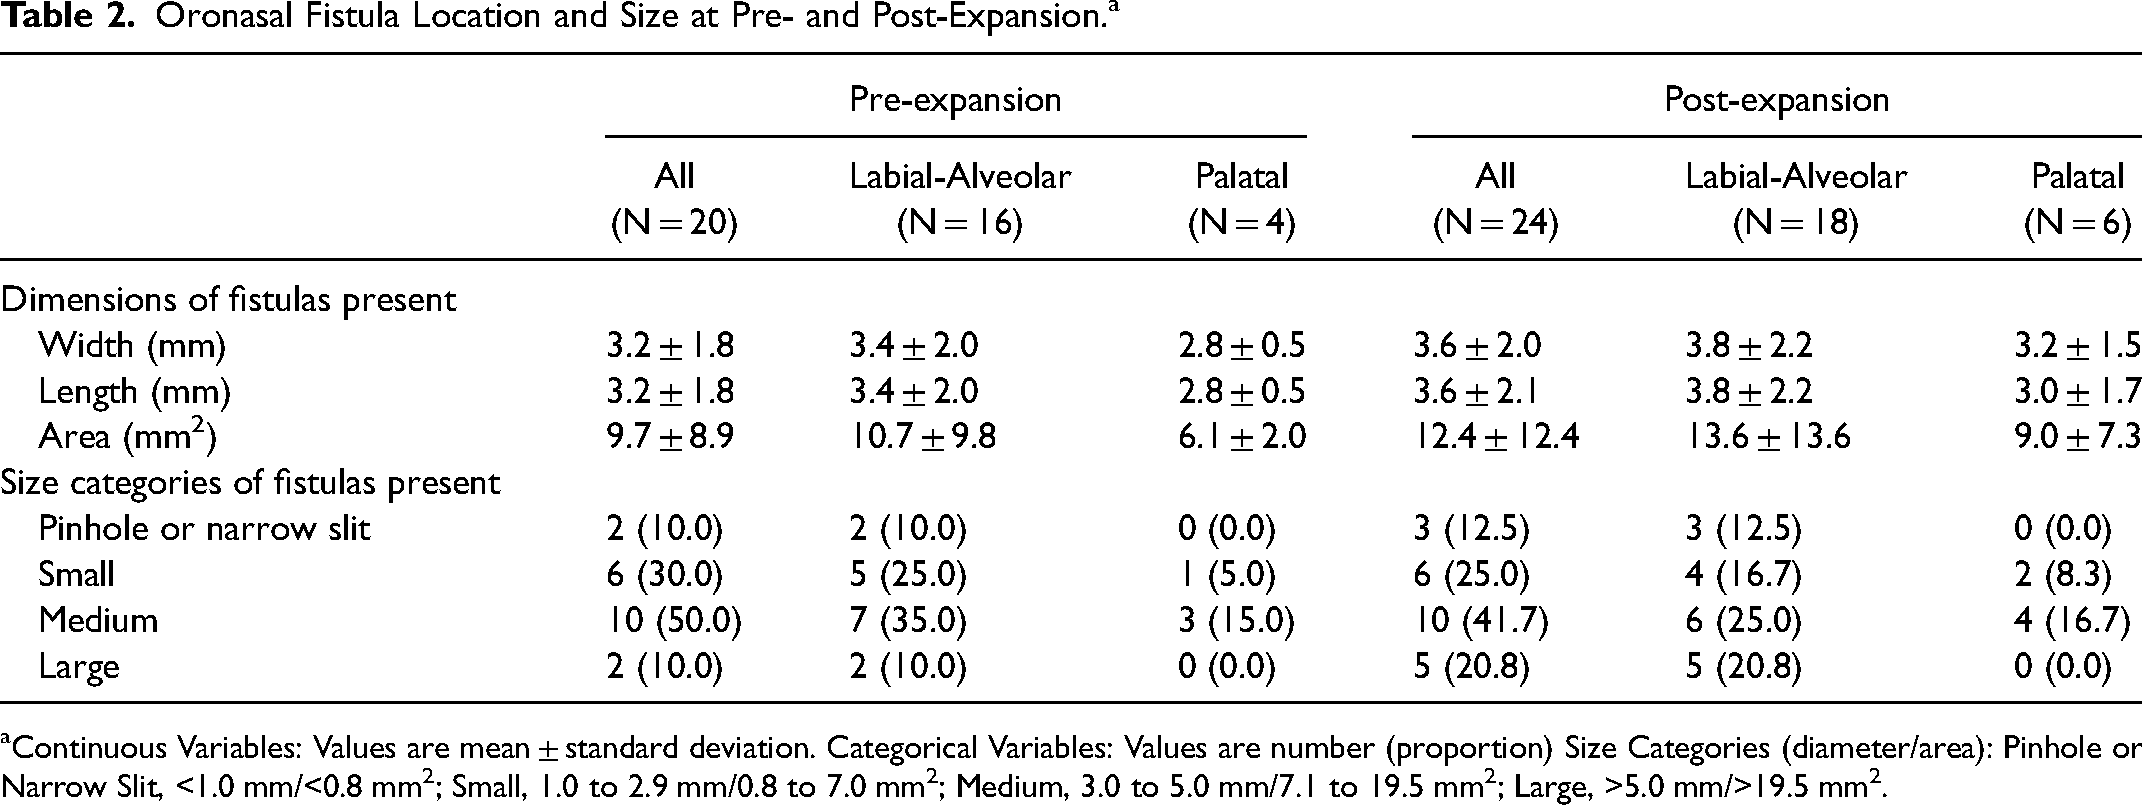
Continuous Variables: Values are mean ± standard deviation. Categorical Variables: Values are number (proportion) Size Categories (diameter/area): Pinhole or Narrow Slit, <1.0 mm/<0.8 mm2; Small, 1.0 to 2.9 mm/0.8 to 7.0 mm2; Medium, 3.0 to 5.0 mm/7.1 to 19.5 mm2; Large, >5.0 mm/>19.5 mm2.
Post-expansion (Table 2), presence of at least one oronasal fistula was noted in 19 of 25 patients (76.0%). The new occurrence in 2 patients was attributed to 1 patient with no previous fistula who developed a labial-alveolar fistula, and 1 patient with no previous fistula who developed both a labial-alveolar and a palatal fistula. In addition, 1 patient with a previous labial-alveolar fistula developed a palatal fistula. Therefore, 4 fistulas (2 labial-alveolar, 2 palatal) developed in the 25 patients. All fistulas that developed post-expansion were narrow slits or small. All fistulas (except for 1) that existed pre-expansion were enlarged post-expansion. In some cases, the magnitude was enough to warrant a change in size category. No pinhole or narrow slit fistulas progressed to small, 3 of 6 small fistulas progressed to medium, and 3 of 10 medium fistulas progressed to large.
Patient and Parent Perception of Speech
Ratings for Patient Questionnaire
A graphic representation of the data is shown in Figure 1A. Visual appraisal of the data showed that mean ratings (Table 3) increased at T2. The mean ratings gradually decreased, returned to T1 levels by T4, and decreased further over subsequent time points. A mixed model ANOVA of the mean ratings (dependent variable) was performed to assess changes in patient-reported perception of speech at each time point (within-subject factor variable). The main effect of the time point was highly significant (F5,117 = 58.05, P < .0001). Post hoc analyses of time point with Tukey-Kramer adjusted multiple comparison tests provided confirmation that the mean ratings were higher at T2 than at all other time points. They began to lower at T3 but remained higher than those at T1 until T4. Significant differences (P < .05) were found between all time point pairs except T1/T4, T1/T5, T1/T6, and T5/T6 (Figure 1B).
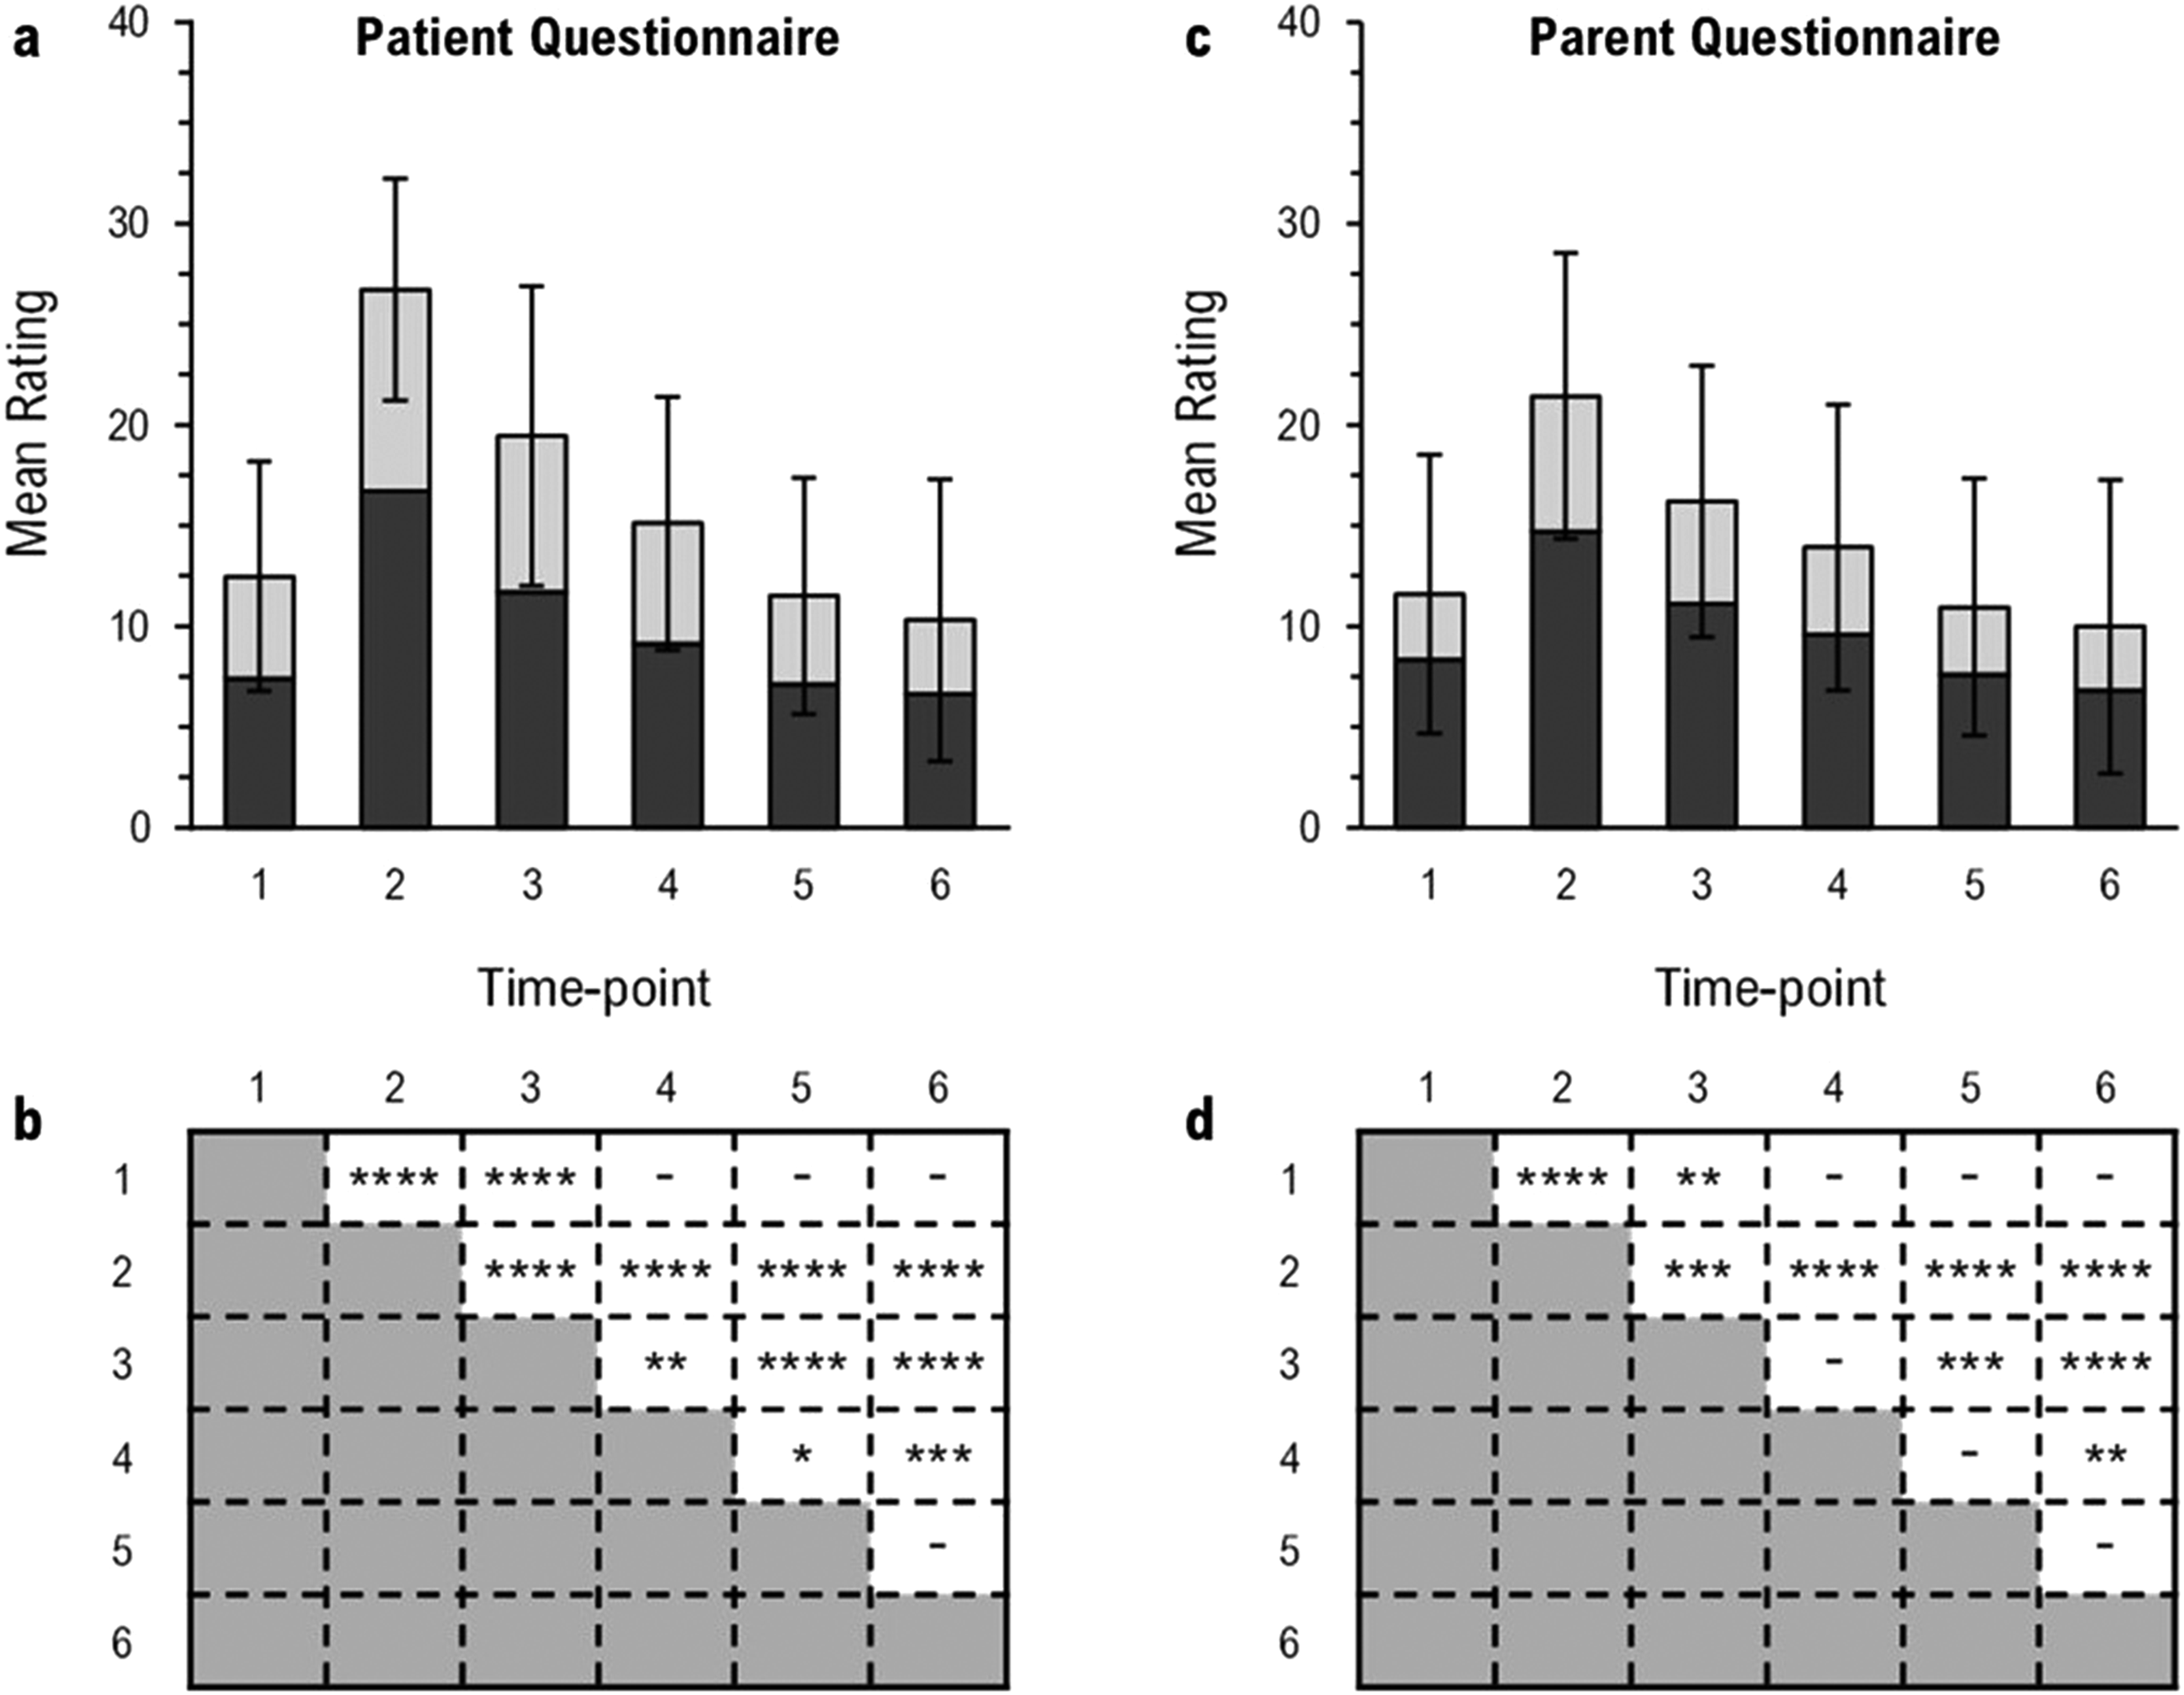
Mean ratings of patient- and parent-perceived speech dysfunction and distress at each time point (A, C). Stacked bars are mean summative ratings of: 7 matched questionnaire items, dark gray; and 3 unmatched questionnaire items, light gray. Full bars are mean summative ratings of all 10 questionnaire items. Error bars represent the standard deviation of mean summative ratings of all 10 questionnaire items. Significant differences between time point pairs (B, D): *P < .05; **P < .01; ***P < .001; ****P < .0001.
Mean Ratings of and Correlation Between Patient- and Parent-Perceived Speech Dysfunction and Distress at Each Time Point.a
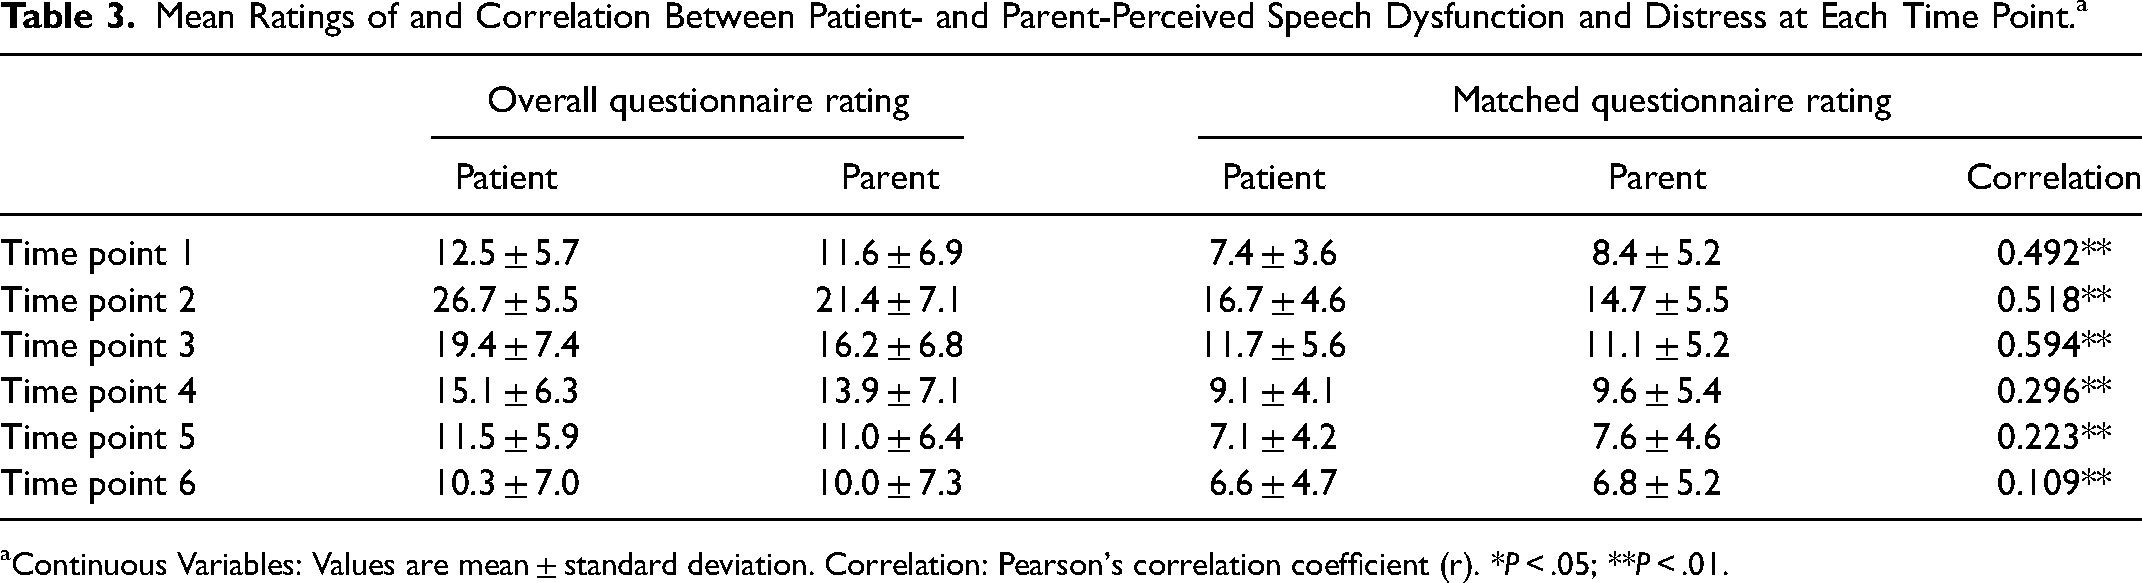
Continuous Variables: Values are mean ± standard deviation. Correlation: Pearson's correlation coefficient (r). *P < .05; **P < .01.
Ratings for Parent Questionnaire
A graphic representation of the data is shown in Figure 1C. Visual appraisal of the data showed that mean ratings (Table 3) increased at T2. The mean ratings gradually decreased, returned to T1 levels by T4, and decreased further over subsequent time points. A mixed model ANOVA of the mean ratings (dependent variable) was performed to assess changes in parent-reported perception of speech at each time point (within-subject factor variable). The main effect of the time point was highly significant (F5,117 = 24.03, P < .0001). Post hoc analyses of time point with Tukey-Kramer adjusted multiple comparison tests provided confirmation that the mean ratings were higher at T2 than at all other time points. They began to lower at T3 but remained higher than those at T1 until T4. Significant differences (P < .05) were found between all time point pairs except T1/T4, T1/T5, T1/T6, T3/T4, T4/T5, and T5/T6 (Figure 1D).
Agreement Between Ratings for Patient and Parent Questionnaires
A graphic representation of the data is shown in Figure 1A and C. Visual appraisal of the data showed that matched ratings (Table 3) followed a similar trend for patients and parents (monotonic relationship) with respect to time point. A Pearson coefficient was calculated to determine the strength of correlation between patient- and parent-reported outcomes for the matched questionnaire rating at each time point (Table 3). There was a low positive correlation at T1 (r = 0.492) which was significant (P < .05), a moderate positive correlation at T2 (r = 0.518) and T3 (r = 0.594) which were significant (P < .01), and weak correlations at T4 (r = 0.296), T5 (r = 0.223), and T6 (r = 0.109), which were not significant. A Kendall's tau-b coefficient was calculated to determine the strength of association between patient- and parent-reported outcomes for the matched questionnaire items at each time point. There were positive associations at T1 (Tb = 0.236), T2 (Tb = 0.311), T3 (Tb = 0.370), and T4 (Tb = 0.226) which were highly significant (P < .0001), a positive association at T5 (Tb = 0.218) which was significant (P < 0.001), and a weak association at T6 (Tb = 0.079) which was not significant.
Articulation of Speech
Formants for Vowel/a/
A graphic representation of the F1 data for /a/ is shown in Figure 2 (bottom left). Visual appraisal of the data showed that mean F1 frequencies remained relatively unchanged from T1 (mean, 916.28 Hz; SD, 134.39 Hz) levels through T5, then decreased at T6 (mean, 865.91 Hz; SD, 128.50 Hz). A mixed model ANOVA of the mean F1 frequencies (dependent variable) was performed to assess changes in acoustics of the vowel /a/ at each time point (within-subject factor variable). The main effect of time point was highly significant (F5,407 = 4.67, P < .001). Post hoc analyses of time point with Tukey-Kramer adjusted multiple comparison tests provided confirmation that the mean F1 frequencies were similar from T1 to T5 and lower at T6 than at all other time points. Significant differences (P < .05) were found between time point pairs T1/T6, T2/T6, T3/T6, T4/T6, and T5/T6.
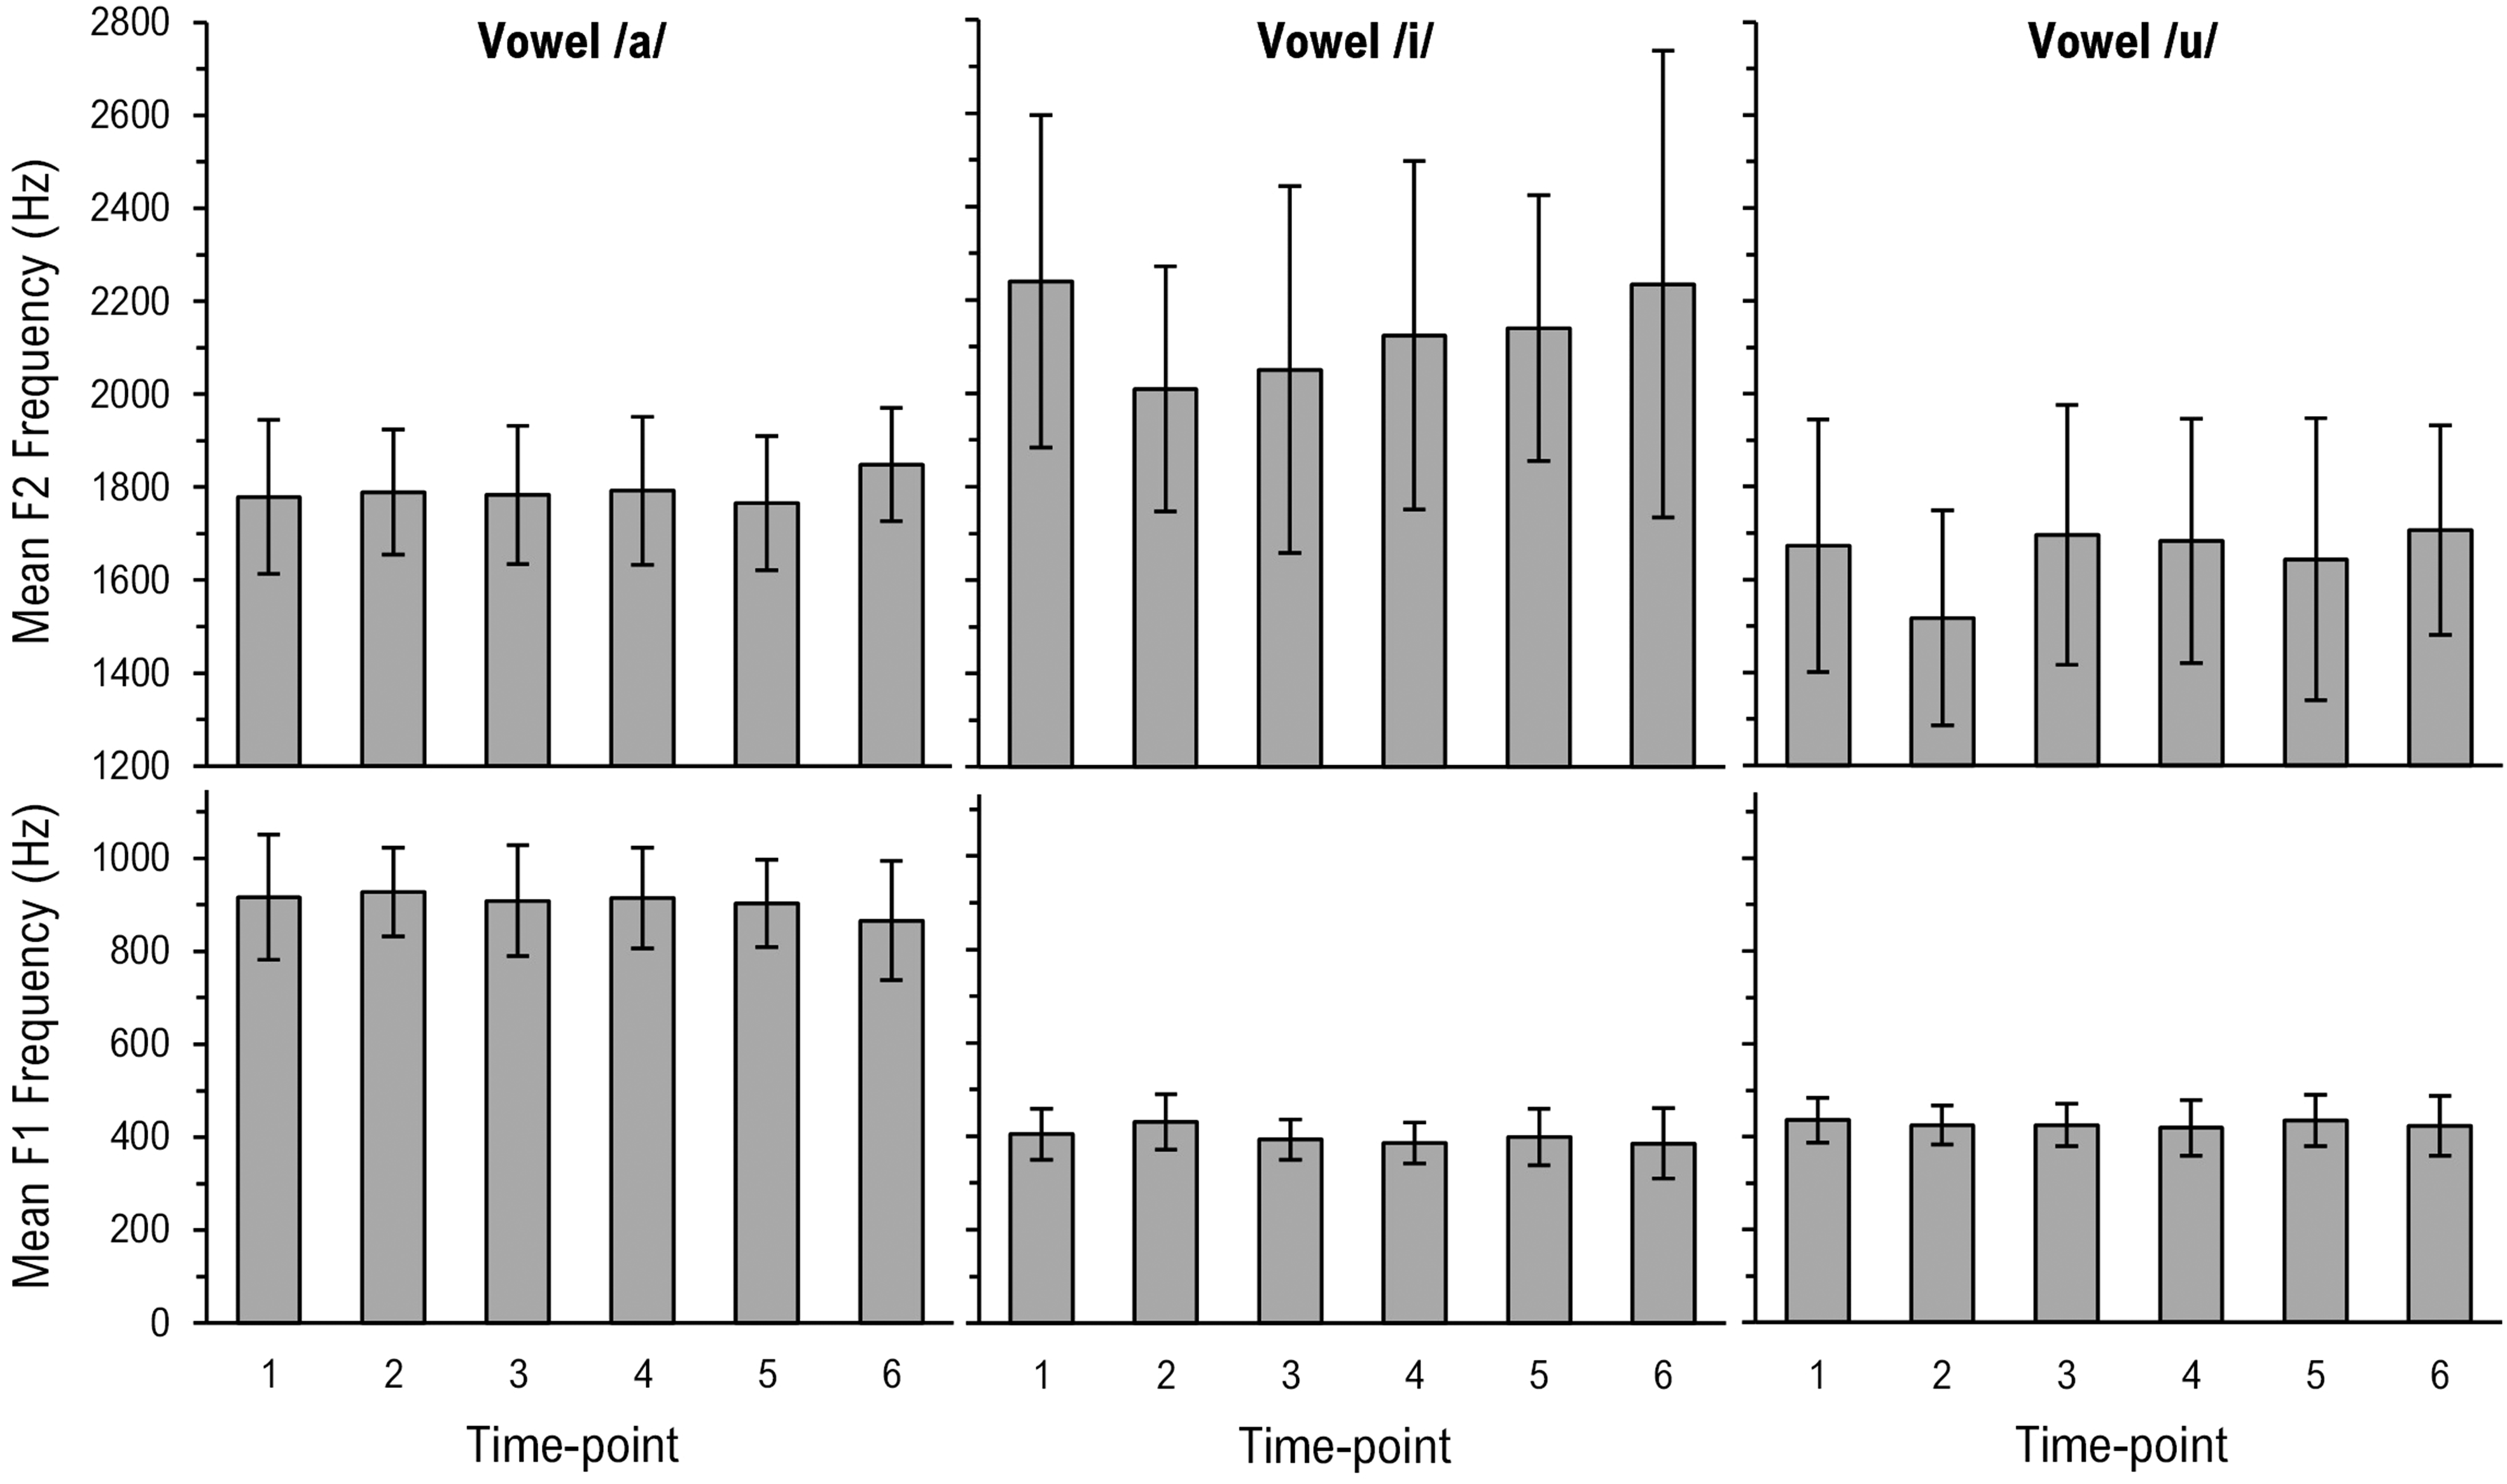
Mean F1 and F2 frequencies at each time point. Error bars represent the standard deviation. Significant differences between T1 and subsequent time points: *P < .05; **P < .01; ***P < .001; ****P < .0001.
A graphic representation of the F2 data for /a/ is shown in Figure 2 (top left). Visual appraisal of the data showed that mean F2 frequencies remained relatively unchanged from T1 (mean, 1779.11 Hz; SD, 165.96 Hz) levels through T5, then increased at T6 (mean, 1848.65 Hz; SD, 121.43 Hz). A mixed model ANOVA of the mean F2 frequencies (dependent variable) was performed to assess changes in acoustics of the vowel /a/ at each time point (within-subject factor variable). The main effect of time point was significant (F5,408 = 2.37, P < .05). Post hoc analyses of time point with Tukey-Kramer adjusted multiple comparison tests provided confirmation that the mean F2 frequencies were similar from T1 to T5. The mean F2 frequencies at T5 were nominally lower and at T6 were nominally higher than all other time points. A significant difference (P < .05) was found between the time point pair T5/T6.
Formants for Vowel /i/
A graphic representation of the F1 data is shown in Figure 2 (bottom middle). Visual appraisal of the data showed that mean F1 frequencies increased transiently at T2 (mean, 431.14 Hz; SD, 59.37 Hz). The mean F1 frequencies quickly decreased and returned to T1 (mean, 404.42 Hz; SD, 54.40 Hz) levels by T3, then remained relatively constant thereafter through T6. A mixed model ANOVA of the mean F1 frequencies (dependent variable) was performed to assess changes in acoustics of the vowel /i/ at each time point (within-subject factor variable). The main effect of time point was highly significant (F5,407 = 9.74, P < .0001). Post hoc analyses of time point with Tukey-Kramer adjusted multiple comparison tests provided confirmation that the mean F1 frequencies were higher at T2 than at all other time points. The mean F1 frequencies were similar to those at T1 by T3 but continued to lower. Significant differences (P < .05) were found between time point pairs T1/T2, T2/T3, T2/T4, T2/T5, and T2/T6.
A graphic representation of the F2 data is shown in Figure 2 (top middle). Visual appraisal of the data showed that mean F2 frequencies decreased at T2 (mean, 2009.50 Hz; SD, 262.47 Hz). The mean F2 frequencies gradually increased and returned to T1 (mean, 2239.73 Hz; SD, 355.82 Hz) levels by T4, then remained relatively constant thereafter through T6. A mixed model ANOVA of the mean F2 frequencies (dependent variable) was performed to assess changes in acoustics of the vowel /i/ at each time point (within-subject factor variable). The main effect of time point was highly significant (F5,407 = 7.61, P < .0001). Post hoc analyses of time point with Tukey-Kramer adjusted multiple comparison tests provided confirmation that the mean F2 frequencies were lower at T2 than at T1. Although the mean F2 frequencies at T3 were higher than those at T2, they remained lower than those at T1. From T4 to T6, the mean F2 frequencies were similar to those at T1. Significant differences (P < .05) were found between time point pairs T1/T2, T1/T3, T2/T6, and T3/T6.
Formants for Vowel/u/
A graphic representation of the F1 data is shown in Figure 2 (bottom right). Visual appraisal of the data showed that mean F1 frequencies remained relatively unchanged from T1 (mean, 436.15 Hz; SD, 48.53 Hz) levels through to T6. A mixed model ANOVA of the mean F1 frequencies (dependent variable) was performed to assess changes in acoustics of the vowel /u/ at each time point (within-subject factor variable). The main effect of time point was not significant (F5,406 = 1.93, P = .088).
A graphic representation of the F2 data is shown in Figure 2 (top right). Visual appraisal of the data showed that mean F2 frequencies decreased transiently at T2 (mean, 1516.93 Hz; SD, 231.46 Hz). The mean F2 frequencies quickly increased and returned to T1 (mean, 1672.84 Hz; SD, 272.05 Hz) levels by T3, then remained relatively constant thereafter through T6. A mixed model ANOVA of the mean F2 frequencies (dependent variable) was performed to assess changes in acoustics of the vowel /u/ at each time point (within-subject factor variable). The main effect of time point was highly significant (F5,406 = 10.10, P < .0001). Post hoc analyses of time point with Tukey-Kramer adjusted multiple comparison tests provided confirmation that the mean F2 frequencies were lower at T2 than at all other time points. The mean F2 frequencies were similar to those at T1 by T3 and did not change appreciably at subsequent time points. Significant differences (P < .05) were found between time point pairs T1/T2, T2/T3, T2/T4, T2/T5, and T2/T6.
Oral–Nasal Balance of Speech
Nasalance Scores for Non-Nasal Sentence
A graphic representation of the data for the non-nasal sentence is shown in Figure 3A. Visual appraisal of the data showed that mean nasalance scores fluctuated about T1 (mean, 18.95; SD, 12.43) levels at subsequent time points. Despite minor peaks at T2 (mean, 23.14; SD, 13.55) and T4 (mean, 20.50; SD, 13.49), the mean nasalance scores remained relatively constant through T5, then increased at T6 (mean, 25.81; SD, 11.30). A mixed model ANOVA of the mean nasalance scores (dependent variable) was performed to assess changes in nasality of the non-nasal sentence at each time point (within-subject factor variable). The main effect of time point was significant (F5,116 = 3.45, P < .01). Post hoc analyses of time point with Tukey-Kramer adjusted multiple comparison tests provided confirmation that the mean nasalance scores were lower at T1 than at T6. Significant differences (P < .05) were found between time point pairs T1/T6 and T5/T6 (Figure 3B).
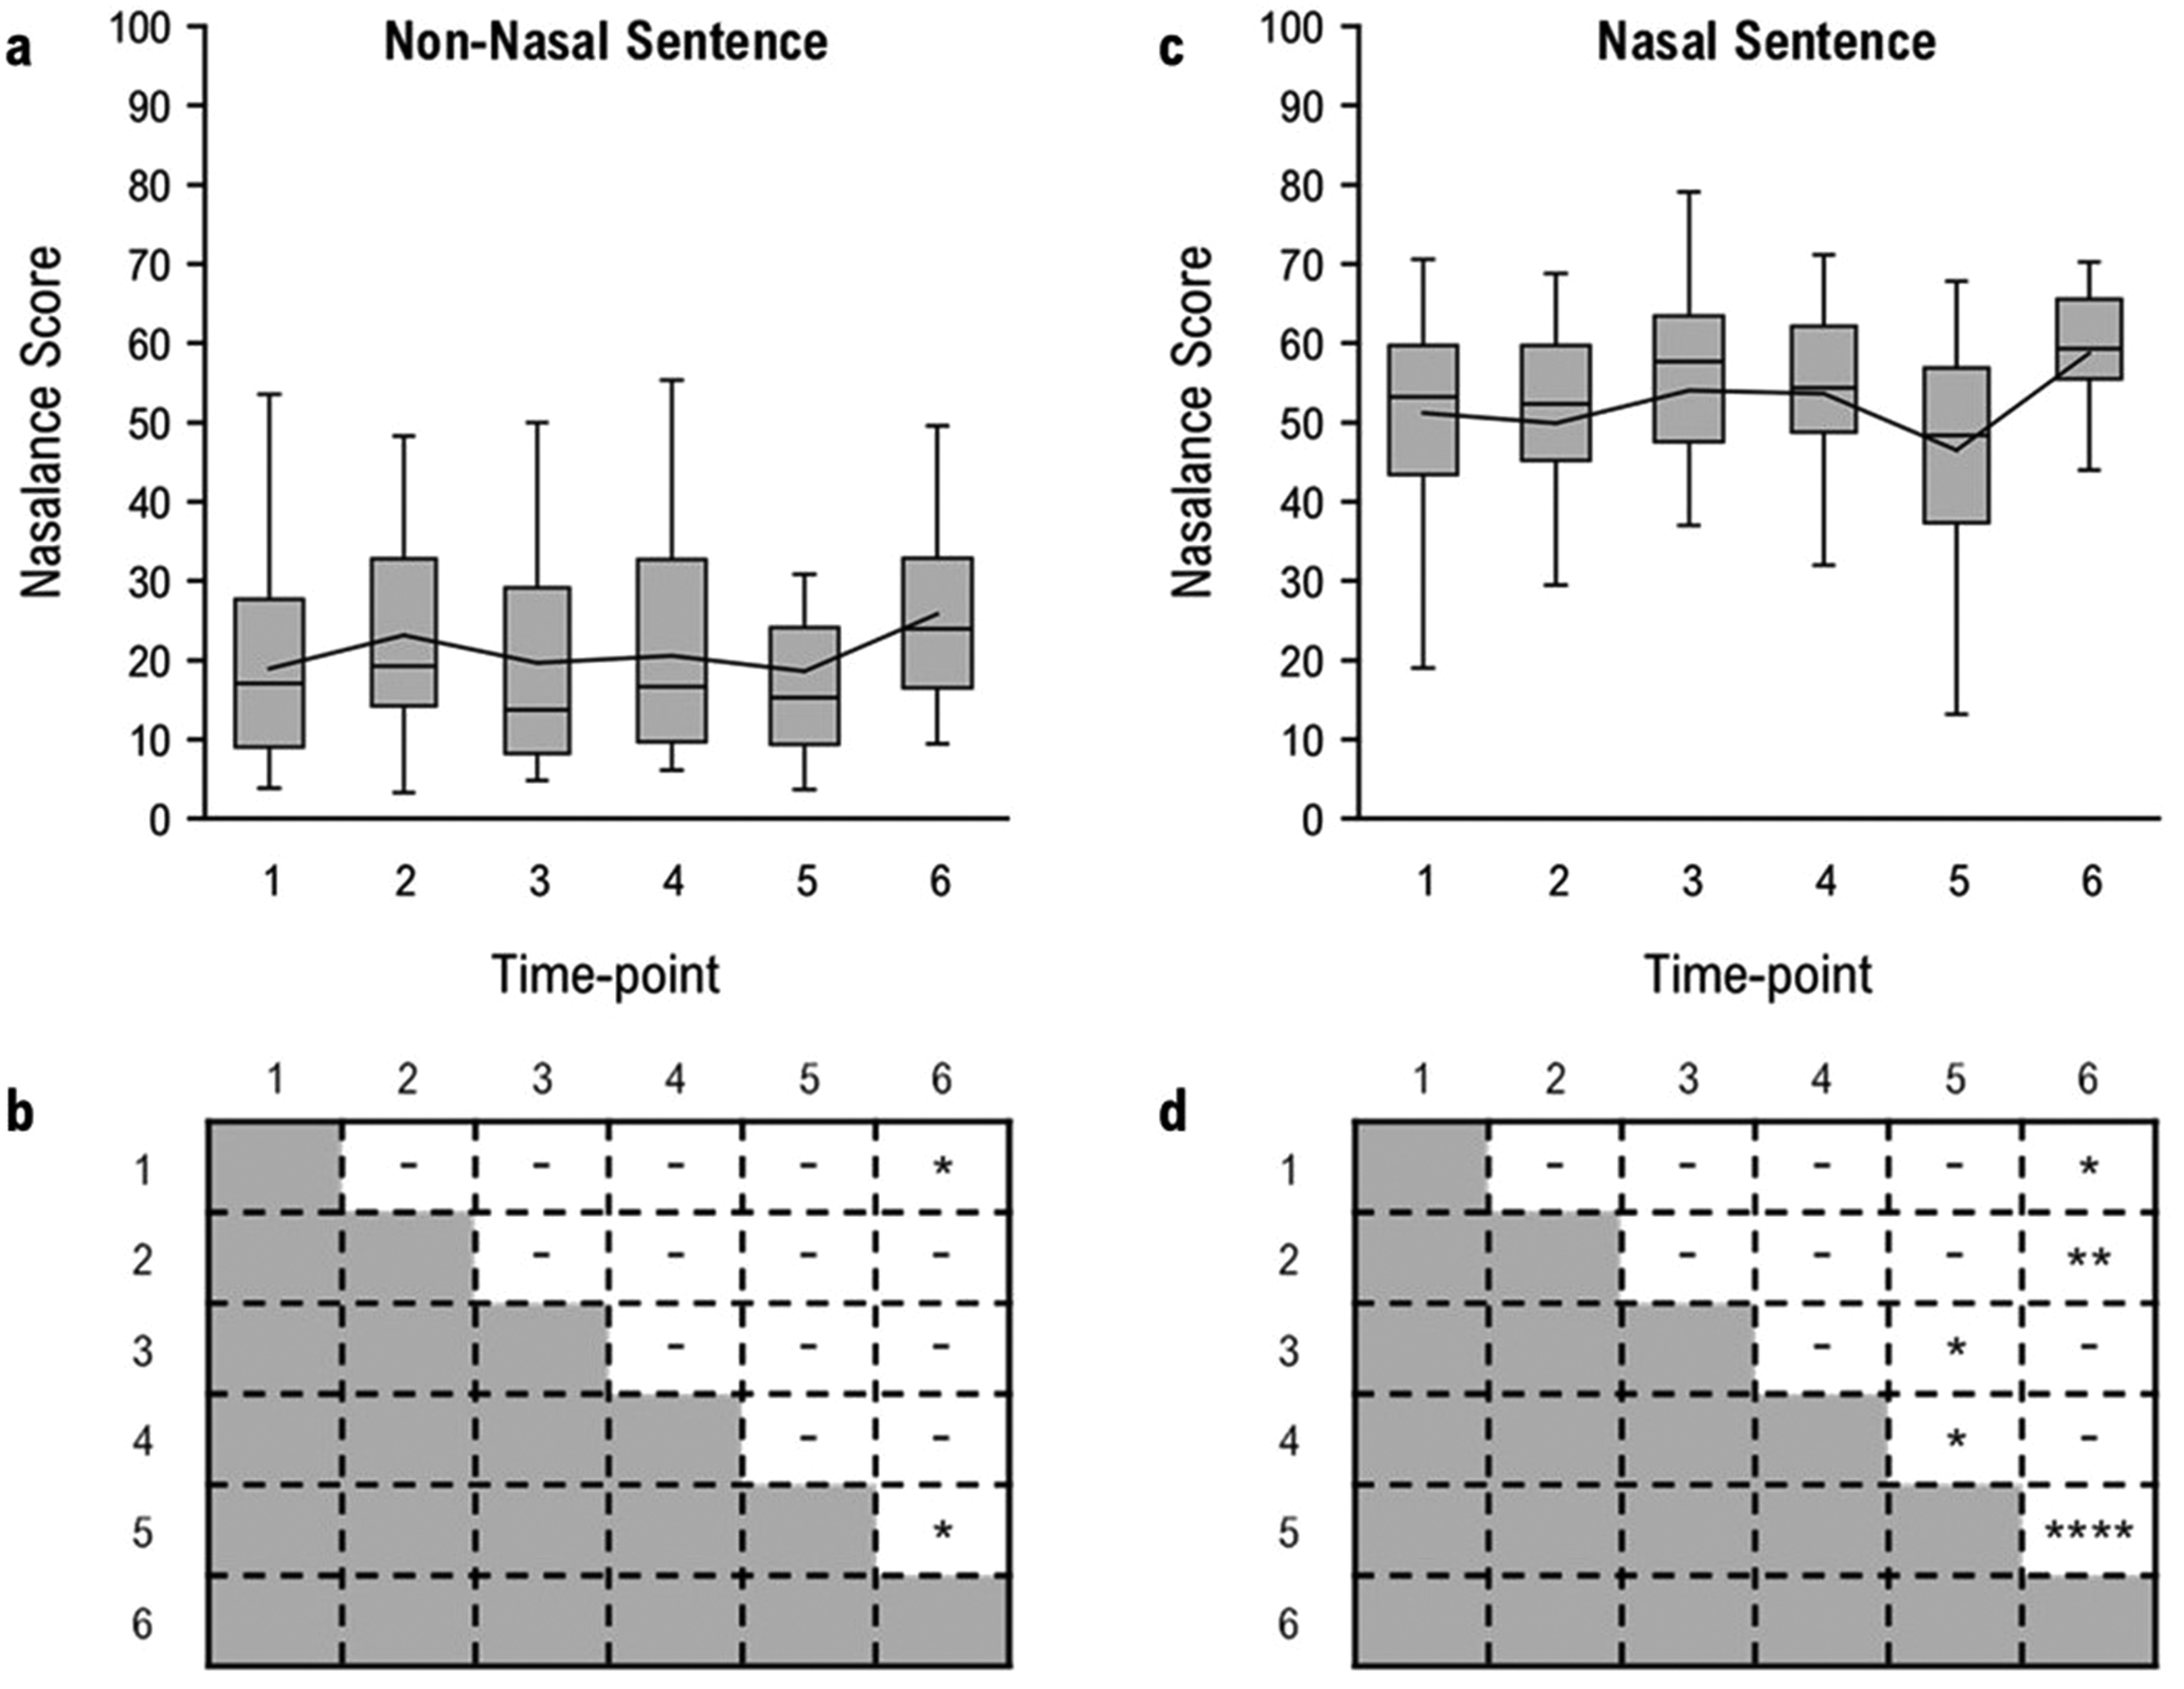
Nasalance scores at each time point (A, C). Line represents the mean. Significant differences between time point pairs (B, D): *P < .05; **P < .01; ***P < .001; ****P < .0001.
Nasalance Scores for Nasal Sentence
A graphic representation of the data for the nasal sentence is shown in Figure 3C. Visual appraisal of the data showed that mean nasalance scores fluctuated about T1 (mean, 51.17; SD, 13.38) levels at subsequent time points. Despite minor peaks at T3 (mean, 54.06; SD, 15.04) and T4 (mean, 53.60; SD, 10.76), the mean nasalance scores remained relatively constant through T4, then decreased at T5 (mean, 46.47; SD, 14.89) and increased at T6 (mean, 58.76; SD, 9.23). A mixed model ANOVA of the mean nasalance scores (dependent variable) was performed to assess changes in nasality of the nasal sentence at each time point (within-subject factor variable). The main effect of time point was highly significant (F5,117 = 6.08, P < .0001). Post hoc analyses of time point with Tukey-Kramer adjusted multiple comparison tests provided confirmation that the mean nasalance scores were lower at T1 than at T6. Significant differences (P < .05) were found between time point pairs T1/T6, T2/T6, T3/T5, T4/T5, and T5/T6 (Figure 3D).
Correlation Between Nasalance Scores and Oronasal Fistula Size
In order to evaluate whether an increase in fistula size from T1 to T4 correlated significantly with a change in nasalance between these time points, the fistula areas at these time points were added up, and the total fistula area at T1 was subtracted from T4. For both the non-nasal and nasal sentences, the average score for each patient's nasalance score at T1 was subtracted from the score at T4. For the 19 participants who had fistulas, Spearman's correlation coefficients showed very weak, nonsignificant correlations between change in fistula area and the nasalance scores for the non-nasal sentence (ρ = 0.07) and the nasalance scores for the nasal sentence (ρ = 0.04).
Discussion
The purpose of the present study was to investigate the effects of an RPE on speech difficulties perceived by patients and parents, articulation of vowels, and oral–nasal balance. The outcome measures were the questionnaire ratings for patient and parent perception, the first 2 formants for vowel articulation, and the nasalance scores for oral–nasal balance.
Hypothesis H1, that there would be worsening of speech-related dysfunction and distress reported by both patients and parents after placement of the RPE, was supported by significantly higher ratings on patient and parent questionnaires at T2. The patient and parent questionnaire items with the largest change indicated feelings of frustration and apprehension while speaking and concerns with being understood while speaking. After the RPE had been in place for approximately 6 months, ratings of speech disturbances were no longer different than before RPE insertion. Perceptions continued to improve following RPE removal and SABG. Ratings at T6 were even slightly better compared to the start of treatment, although this difference was not statistically significant.
Correlation between patient-parent pairs was modest at T2 and T3, but poor at all other time points even though the matched items addressed the same constructs. In general, the parent perspective tended to be less critical, which had also been noted in a previous questionnaire survey. 67 Although parents are in an ideal position to make nuanced observations of their child's emotional welfare in the home environment, they are not often privy to their child's social relationships outside the home. However, these can have a profound influence on how their child feels and functions on a daily basis.49,50 This emphasizes the importance of a patient-reported outcome measure.48,68 Concomitant evaluation of both perspectives presents an opportunity to appreciate what is important to both patients and parents. Patients and parents can have potentially diverse views regarding speech dysfunction and distress but provide critical and complementary sources of information.49,50
The patient questionnaire and the explorative parent questionnaire were based on preliminary content of the CLEFT-Q©. The CLEFT-Q© is a condition-specific patient-reported outcome instrument designed exclusively for patients with CLP.46–48 The overarching domains of facial function and health-related quality of life each have independent scales addressing dysfunction of and distress associated with speech, respectively. This study was undertaken before item reduction, reliability, validity, and responsiveness testing of the CLEFT-Q© was complete. Therefore, the psychometric properties, scoring system, and generalizability of the finalized CLEFT-Q© speech scales were not applicable to the patient nor the parent questionnaires, and the items included were scored as ad hoc measures. Although the patient (self) version of the CLEFT-Q© is now available, a parent (proxy) version is still in development. Although nonvalidated tools were used in this study, they were able to detect differences over time and provided valuable insights into the psychosocial implications of RPE-induced speech deficits.
Hypothesis H2, that there would be centralization of the vowels /i/ and /u/ after placement of the RPE, was supported by findings of significantly increased F1 and deceased F2 frequencies for /i/ as well as significantly decreased F2 frequencies for /u/ at T2. For /a/, both F1 and F2 frequencies were unaffected at T2. With time, patients adapted to the RPE and the /i/ and /u/ sound quality improved. The F1 frequencies for /i/ and the F2 frequencies for /u/ returned to baseline levels by T3 (typically 1 month after insertion), whereas recovery of the F2 frequencies for /i/ did not occur until T4 (typically 3-6 months after insertion). In previous research in patients without CLP, Stevens et al. 24 found that F1 changes were overcome by T4 (typically 2-3 months after insertion), and F2 changes were overcome by T6 (typically 1-2 months after removal).
It has been argued that F1 is related to the degree of tongue elevation and jaw opening,51,52,54,55 while F2 is related to the degree of tongue protrusion and lip rounding.51–53 In the high-front vowel /i/, the tongue elevates in the superior-anterior oral cavity (toward the palate), making this sound particularly vulnerable to obstruction by an RPE. To produce the high-back vowel /u/, the tongue is raised to the posterior oral cavity (approaching the velum) and the lips are rounded. The observed changes in formant frequencies can probably be explained by more posterior positioning of the tongue in order to accommodate the RPE. During the production of the low-back vowel /a/, the tongue lowers towards the floor of the mouth and the posterior tongue extends into the pharynx, while the jaw and lips are open wide. This tongue shape makes the /a/ sound resistant to palatal perturbation by an RPE.
Based on the time course of results for the vowel formants, a more rapid and complete vowel compensation occurred in this study compared to the study by Stevens et al. 24 However, the 2 studies differed markedly in the sample population and appliance design. Stevens et al. 24 evaluated Hyrax-type RPEs in patients without CLP while the present study focused on Fan-type RPEs in patients with CLP. Although both types of RPEs may be equally intrusive, it may be that the use of a Fan-type RPE resulted in more available space in the superior-anterior oral cavity and facilitated access by the tongue, more than the use of a Hyrax-type RPE would have. 15 It could also be speculated that patients with CLP, who commonly require intervention by a speech-language pathologist beginning at an early age, may be more amenable to practicing and relearning affected sounds. Research has shown that past experiences with an oral sensorimotor perturbation may expedite future adaptive responses.69,70 In these studies, the speech of patients wearing experimental removable appliances was assessed after the introduction of the unfamiliar appliance, after a period of training with the appliance, then after reintroduction of the familiar appliance following a rest period. Patients were quicker to adjust regardless of whether several minutes or several months had elapsed since the initial exposure to the appliance. On the other hand, patients with preexisting speech difficulties may take longer to adapt.42,43 Finally, the patients in the present study were on average 3 years younger than those of the Stevens et al. 24 study, and it has been proposed that the ability to accommodate a new oral environment decreases with age. 71
An additional research question asked whether there would be changes in oral–nasal balance over the course of RPE treatment. Disorders of oral–nasal balance are complex because features of both hypernasality and hyponasality can be present in patients with CLP. Therefore, nasalance scores of the non-nasal and nasal sentences should be interpreted together. 34
The observed changes in nasalance scores over the course of the study followed a different pattern than the other speech measures. It was noted that nasalance scores were lower than the baseline at T5 and higher at T6. These changes could be attributed to the relative impedance of the oral and nasal cavities 72 . Where there is oronasal coupling in patients with CLP, an RPE could increase oral impedance. As the volume in the oral cavity was reduced by placement of the RPE at T2, more acoustic energy was emitted from the nasal cavity, though this increase was not significant. The reduction in nasality after some time with the RPE in place could be linked to a lower tongue posture to accommodate the presence of the appliance in the palate.74,75 Such a newly habituated tongue posture might persist for some time after RPE removal, which could explain the observed slight drop in the nasalance scores of the nasal stimulus at T5.
Nasalance scores for the non-nasal stimulus were significantly higher at T6 than at baseline, indicating that patients had adjusted to an oral cavity without an RPE. It is expected that nasalance scores in young children will increase over time, and the patients were considerably older at the end of the study.76,77 With growth and development, there is presumed to be a notable improvement in nasal patency as a result of adenoid involution and growth of the nasal cavity. 78 On the other hand, the changes in oronasal fistula size between T1 and T4 were not significantly correlated with the changes in nasalance scores in the present study.
Limitations and Future Directions
The main challenge of this study was the logistics of data collection. For patient (and parent) convenience, data collection was linked to clinical appointments. The organization of the appointment schedules was further complicated by mandatory clinic closures and appointment deferrals as a result of the COVID-19 pandemic. Although the sequence of timepoints could be controlled, the intervals between timepoints showed some variability. No information on speech therapy history was collected. As all ongoing speech therapy occurred in the community, the patient hospital charts could not be assumed to be complete. In order to achieve a sufficiently homogenous study sample, only patients with complete or incomplete UCLP were included. In future research, more participants should be added to the data set to enable additional subgroup analyses according to the extent of CLP (unilateral/bilateral and complete/incomplete), amount of maxillary expansion, presence, location, and size of oronasal fistulas, and auditory-perceptual assessment of speech articulation and oral–nasal balance.
Clinical Implications and Conclusions
Unpleasant experiences related to orthodontic treatment can have negative effects on patient acceptance of treatment. 38 Speech perturbations associated with an RPE, particularly if unexpected, can threaten the success of, not only the RPE but treatment as a whole. This is important because an RPE is likely one of the first appliances inserted at the beginning of orthodontic treatment in the mixed dentition, which, in the CLP population, typically consists of multiple phases. An unpleasant initial experience may have lasting ramifications for the remainder of orthodontic treatment, which will often continue for many more years in patients with CLP. Accurate pre-treatment information regarding the effects of the RPE on speech may be helpful to set the patient up for better acceptance of the treatment. Hopefully, clinicians will find the results presented here useful for their counseling of patients with CLP and their parents when preparing them for treatment with an RPE.
Footnotes
Acknowledgments
The authors would like to credit Derek Stephens of the Department of Biostatistics, Research and Design at The Hospital for Sick Children for his facilitation of and contribution to the statistical analysis of this study. The authors would like to thank the Department of Dentistry at The Hospital for Sick Children for its financial support of this study.
Declaration of Conflicting Interests
The author(s) declared no potential conflicts of interest with respect to the research, authorship, and/or publication of this article.
Funding
The author(s) received no financial support for the research, authorship, and/or publication of this article.