
Abstract
Recommended practices in early childhood special education include using systematic instructional strategies with fidelity to promote learning and individualizing the frequency, intensity, and duration of support to provide each child with the level of instruction needed to make optimal gains (Division for Early Childhood, 2014). Although children often learn common skills, such as pre-academics, in typical environments with little explicit instruction, some young children with disabilities benefit from frequent learning opportunities incorporating planned, systematic, evidence-based procedures (Greenwood et al., 2018; Ledford et al., 2019).
Response prompting describes a category of interventions used to increase correct responding when learning a new skill (e.g., color naming). These procedures can be broadly defined as providing the assistance needed to ensure correct responding, with eventual transfer of stimulus control to the typically occurring stimulus (Cengher et al., 2018). That is, children initially respond correctly in the presence of the prompt, but eventually learn to respond correctly even when prompts are not provided (Touchette, 1971). Time delay (TD) is a specific response prompting procedure intended to result in near errorless learning of new skills (Wolery & Gast, 1984). TD is a single prompt procedure—that is, the same prompt is used for all teaching sessions, for a given behavior, and no other prompts are provided. The prompt used during TD is referred to as a controlling prompt—assistance of any form (e.g., verbal, gesture, etc.) that consistently evokes the correct response. Compared with controlling prompts, intermediate (or non-controlling) prompts provide the child with a hint and do not consistently result in the correct response; these types of prompts are not used in TD procedures.
When using TD strategies, the controlling prompt is immediately delivered during initial instructional trials—referred to as 0-s delay trials. Following a specified number of 0-s delay trials, the instructor increases the number of seconds between the delivery of the cue and the delivery of the controlling prompt (e.g., a latency of 3 s). This short interval provides the individual with an opportunity to independently respond with the correct answer prior to the delivery of the controlling prompt (cf. Ledford et al., 2019). During this delay, the learner could give an unprompted error response rather than an unprompted correct response (Heckaman et al., 1998); thus, early learners may primarily benefit from TD if they can—or are able to quickly learn to—wait for the controlling prompt (Ledford et al., 2019).
Two primary variations of TD exist: constant TD (CTD) and progressive TD (PTD; Ledford et al., 2019). The difference between CTD and PTD is that implementers gradually increase the delay interval for PTD and hold it constant for CTD. The final delay interval depends on the complexity of the behavior and the typical response latency of the child (e.g., naming a letter takes less time than sounding out a word and a child with apraxia may have a longer latency to respond than a child with no language delay). Although TD procedures (e.g., controlling prompt, wait interval) are well-established, numerous variations in delivery model are possible. For example, TD can be conducted in massed (e.g., 10 trials in a row), distributed (e.g., 10 trials distributed throughout the day), or embedded (e.g., 10 trials interspersed within a specific play activity) trials and it can be used with or without instructive feedback (i.e., extra information in the consequent statement), error correction, and interspersing known stimuli.
Several previous reviews have evaluated the outcomes of TD interventions (Handen & Zane, 1987; Ledford et al., 2012; Schuster et al., 1998; Walker, 2008; Wolery et al., 1992). The foci of the reviews varied, with some restrictions to specific behavior categories (e.g., chained tasks; Schuster et al., 1998), diagnosis (e.g., autism; Walker, 2008), or instructional arrangement (e.g., small group; Ledford et al., 2012). None focused on early childhood participants or included studies published in the last 14 years. Previous reviews have also not reported the extent to which variations are used and shown to be effective. One review published 30 years ago (Wolery et al., 1992) found CTD to be effective in teaching discrete behaviors to a variety of individuals across a number of instructional arrangements and settings. Another review (Walker, 2008), published 15 years ago, found that CTD resulted in more errors to criterion, over PTD, when teaching autistic 1 individuals.
Given the ever-expanding corpus of studies, this review expands on the previous ones in several ways. First, we included peer-reviewed and non-peer-reviewed literature (i.e., theses and dissertations), allowing us to detect potential publication bias (Chazin et al., 2021; Sham & Smith, 2014). In addition, we excluded studies without sufficient experimental rigor for interpreting outcomes (e.g., without three potential demonstrations of effect). Given that quality can vary even given three potential demonstrations, we considered outcomes in relation to quality and rigor (Q&R; Ledford et al., 2020; Ledford & Gast, 2018; What Works Clearinghouse, 2020). That is, we rated the quality of included studies and considered this rating in relation to outcomes. Finally, we did not exclude studies based on specific participant diagnoses or target behavior criteria which may allow us to make broader generalizations when compared with previous reviews. Thus, we systematically evaluated the quality/rigor, characteristics, and outcomes of studies evaluating TD for teaching young children. The research questions were as follows:
Method
Coding Team
The first author, a certified teacher and behavior analyst enrolled in a doctoral program in special education with experience coding for systematic reviews and conducting TD, trained five master’s student coders. Prior to conducting coding for the present study, all master’s students were required to reach a minimum 90% agreement with the first author on at least three practice sources. Once trained, master’s students conducted all descriptive coding for included sources. In addition, quality and outcomes were coded via the Single Case Analysis and Review Framework (SCARF; Ledford et al., 2020) by the first author and a PhD-level behavior analyst with expertise in single case design and systematic instruction. Six out of the seven team members identified as non-Hispanic White females, and one identified as an Asian female.
Literature Search
A search was conducted on September 10, 2020 and updated on January 6, 2022, using PsycINFO and ProQuest Dissertations & Theses Global. The following search string was used to identify potential eligible studies: ab (“time delay” or “prompt delay” or “prompt and test”) and (instruction or teaching or intervention). Eligibility was evaluated by the two authors (described above). A total of 1,239 studies were identifying via the database searches. Seven additional sources (Chazin & Ledford, 2021; Ledford & Wolery, 2013, 2015; Schebell et al., 2018; Sweeney et al., 2023; Todt et al., 2023; Wolery et al., 1988) were identified via a secondary search where we reviewed all works by any first author that showed up more than once during the initial search, resulting in a total of 1,246 studies eligible for initial screening.
Study Screening and Inclusion Criteria
To meet inclusion criteria, studies had to: (a) be written in English, (b) include data for at least one participant described as attending a preschool or who was aged 3 to 5 years, (c) graphed data from a single case design that met contemporary standards (i.e., three data points per condition with three potential demonstrations of effect; Ledford & Gast, 2018), and (d) the primary intervention had to include TD instruction. We specifically excluded variables not taught via TD (i.e., observational learning, incidental learning targets, and DVs without baseline data collection). See Table 1 for additional details regarding TD definitions.
Time Delay Inclusion Criteria.
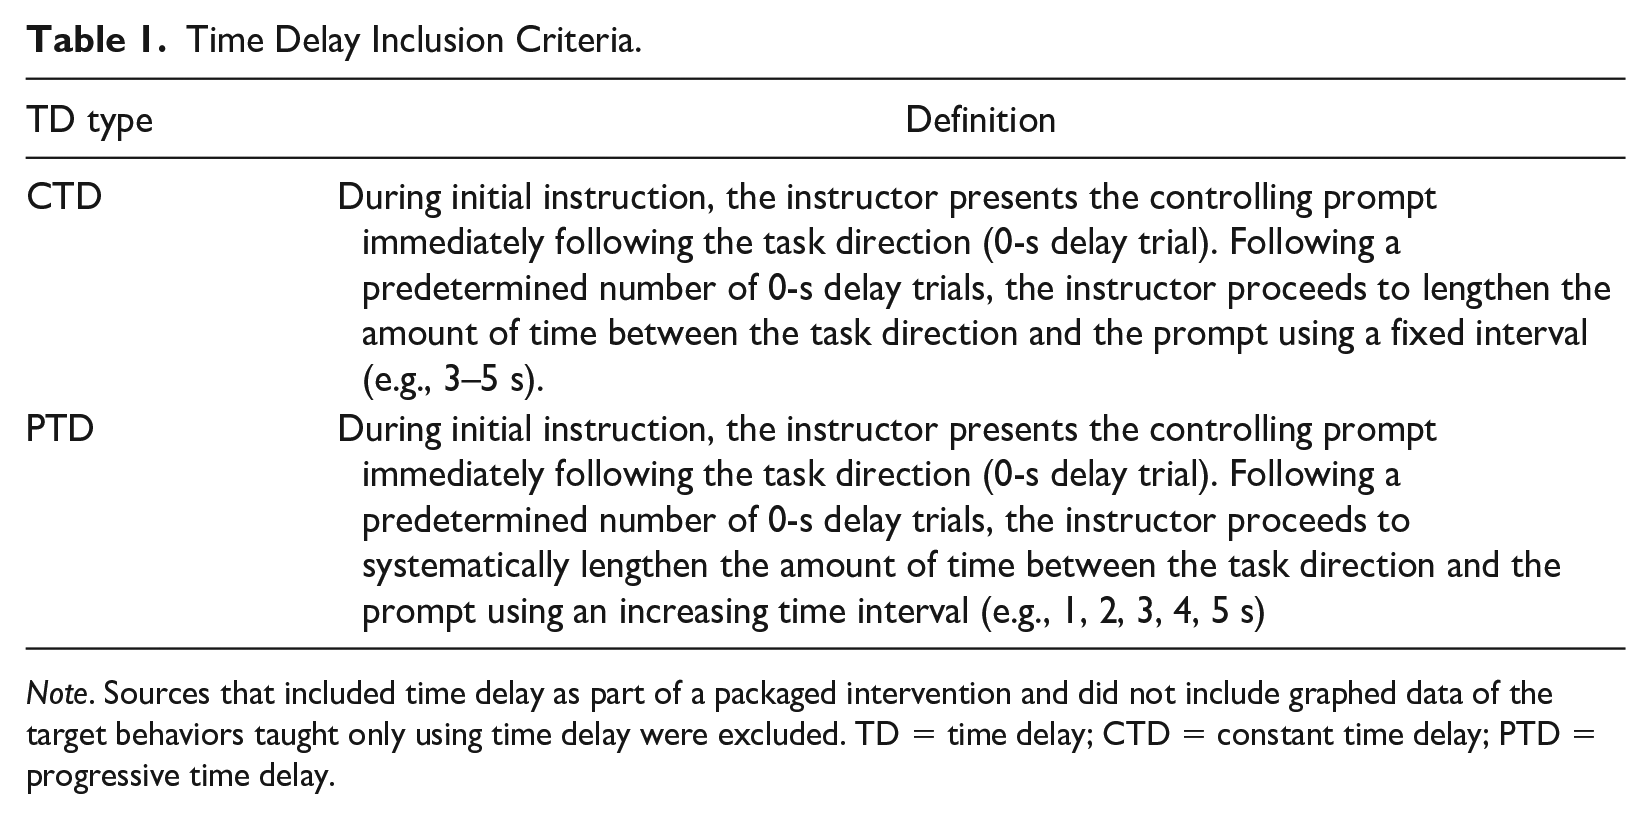
Note. Sources that included time delay as part of a packaged intervention and did not include graphed data of the target behaviors taught only using time delay were excluded. TD = time delay; CTD = constant time delay; PTD = progressive time delay.
A source was determined to be published if it appeared in a peer-reviewed journal. If all data from a singular study were available in both unpublished and published forms (e.g., a doctoral dissertation was later published in a peer-reviewed journal), the unpublished version of the study was removed.
All abstracts and titles were double-screened using the Rayyan software tool (Ouzzani et al., 2016; www.rayyan.ai/). Duplicates were detected and removed (n = 60). Abstracts and titles were reviewed for the remaining 1,186 studies (100% double-screened). At this stage, 824 studies were excluded, and 362 studies were identified as eligible for full-text screening. These studies were double-screened by the authors and a second doctoral student. Discrepancies were resolved by the first author.
Initially, 189 studies (including both demonstration and comparison designs) were screened and sorted based on participant age. This manuscript includes data from 33 sources that included at least one preschool-aged participant (n = 26 published, n = 7 unpublished). See the Preferred Reporting Items for Systematic Reviews and Meta-Analyses (Moher et al., 2009) diagram in Figure 1 for inclusion results.
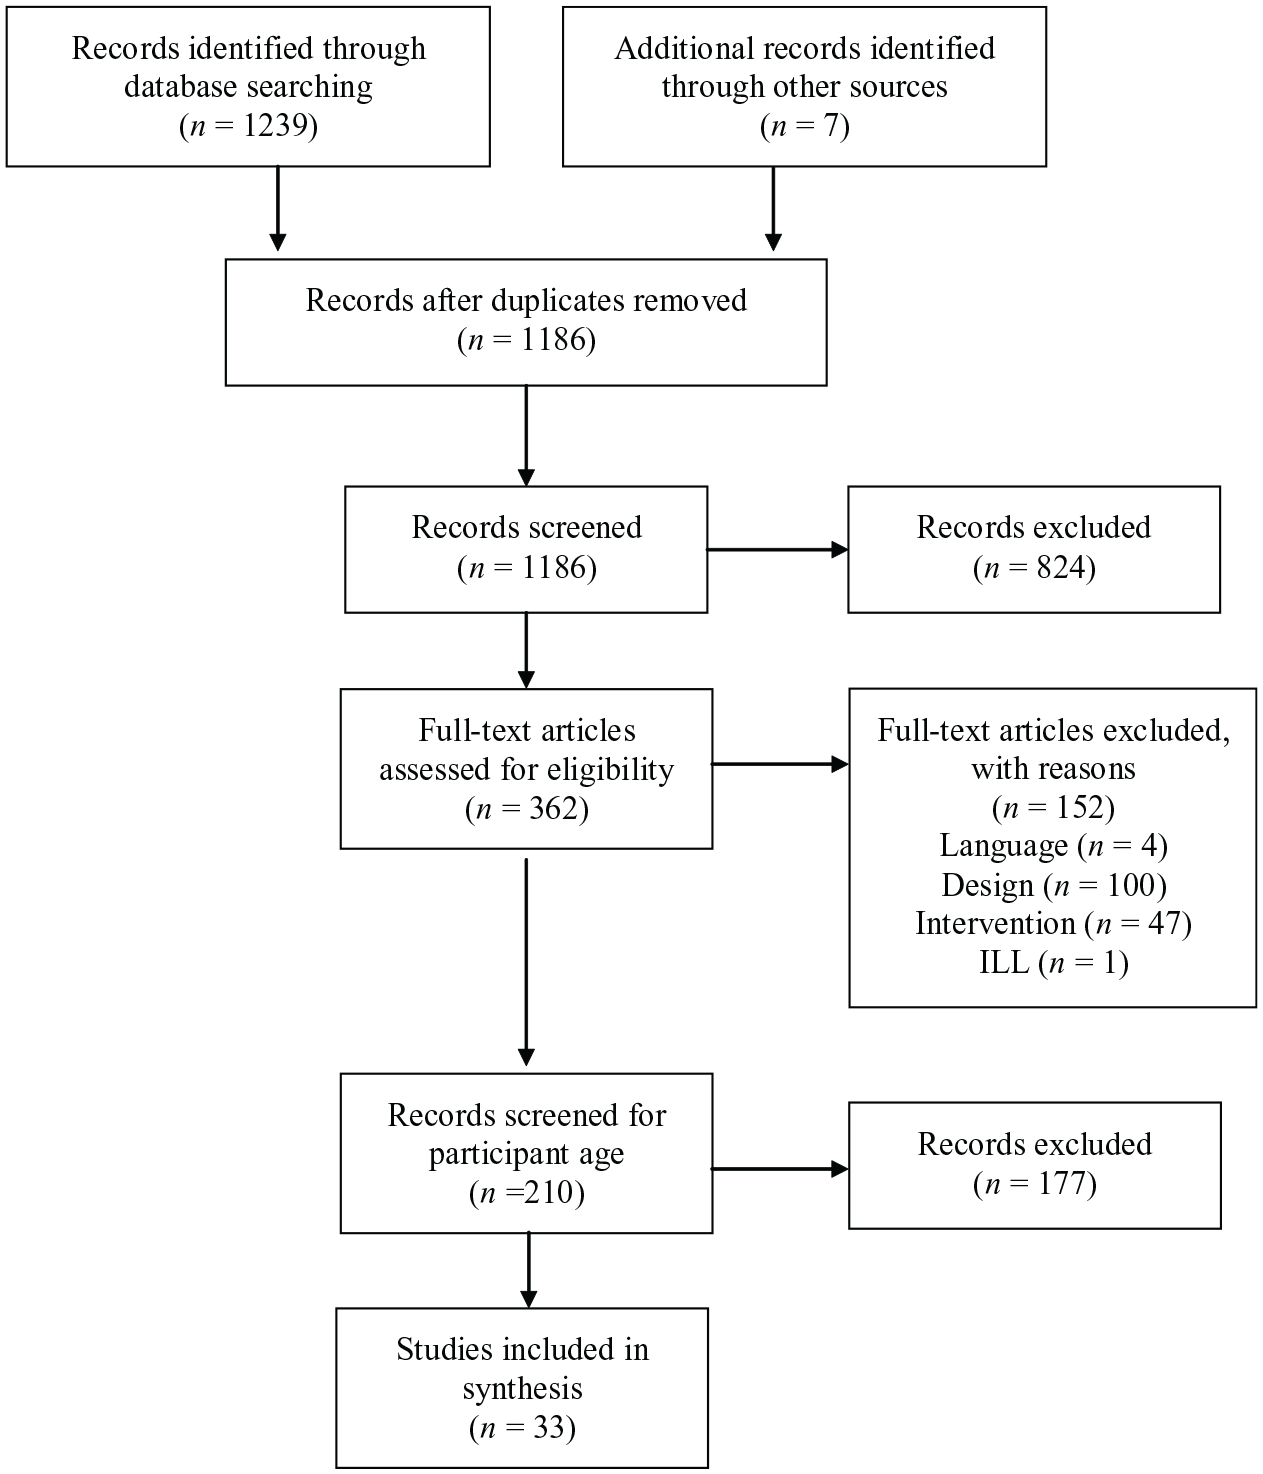
PRISMA Flow Diagram.
Coding
Descriptive, quality, and outcomes coding was conducted for eligible sources. Information on study participants, variables, and validity was recorded via dichotomous yes/no codes. Code books, with definitions and coding directions, are available via online Supplemental Materials. (https://osf.io/ux2s6/?view_only=bb6b92ac6c7041e38ca07a2cb3a9cece). We did not calculate effect sizes or conduct a meta-analysis which inhibits our ability to determine if magnitude of effect differed based on coded study characteristics. This decision to not conduct a meta-analysis was determined due to the inappropriateness of available effect size metrics for analyzing acquisition data and the fact that available metrics generally reflect level of overlap or mean differences between conditions, which are not ideal metrics for establishing whether criterion levels are met for previously unknown targets, which is the context in which TD is used (Ledford & Gast, 2018).
Participants
Data were coded on participant demographics, including gender, age, disability, race, and ethnicity. Disability category was deduced if there was evidence of disability specific special education services (e.g., provision of speech and language therapy for a child with a speech delay), reported Individuals with Disabilities Education Act classification (e.g., orthopedic impairment), or reported medical diagnosis (e.g., autism). Participant race and ethnicity were coded separately (e.g., White, Hispanic or White, Non-Hispanic).
Dependent Variables
Data regarding dependent variable (DV) categorization and topography were coded for each eligible participant. Designs that included graphed data of multiple dependent variables were coded as different designs (e.g., if data from two children in a dyad were shown on a single graph, we analyzed these data as two separate designs). Target behaviors taught were divided into three categories: (a) academic—skills related to school-based scholastic activities, including early learning behaviors (e.g., pre-academics such as matching) and school-aged skills (e.g., answering questions related to a science topic); (b) adaptive behaviors (e.g., self-help and vocational behaviors); and (c) communication/social/joint attention—any skill that could be used during reciprocal interactions between two or more people and play/leisure skills (see “Descriptive Coding” in the online Supplemental Materials for details). Topography included verbal responses (e.g., saying the name of a stimulus) and motor responses (e.g., engaging in a motor behavior to complete a play behavior or selecting a stimulus from an array of three).
Independent Variables
We coded various details about the TD procedure, including the TD type and interval details (i.e., trial arrangement and mastery criteria, antecedent and consequent components, and intervention context and implementer). The controlling prompt was coded by topography (e.g., verbal model, full physical assistance). Details regarding the TD procedure (including antecedent and consequent procedures) were coded on a participant level (n = 149) and details regarding the instructional context and implementer were coded by source (n = 33).
TD Type and Interval Details
We coded whether authors used progressive or constant delays (CTD or PTD), the controlling prompt topography, terminal delay latency (e.g., 3 s), and the interval for increasing latency when PTD was used (e.g., increased by 1 s at a time). We also coded whether authors reported three types of criteria: mastery criteria, criteria for increasing interval latency (e.g., moving from 0 to 1 s), and criteria for decreasing interval latency (e.g., moving from 1 to 0 s, usually due to unprompted errors).
Antecedent and Consequence Components
We recorded data on whether any antecedent (e.g., attending cues) or consequent (e.g., error correction, instructive feedback, tokens) strategies were reported and if any modifications were made contingent on non-responders (e.g., modifying delay intervals or changing reinforcement).
Contexts and Implementers
For each source (n = 33), we coded the context of the intervention, including setting (e.g., clinic, school), instructional arrangement (e.g., small or whole group), trial arrangement (e.g., massed, embedded), trials per session, and implementer (e.g., teacher, researcher; including whether endogenous implementer training was described).
Rigor and Outcomes Coding
Demonstration designs (i.e., any baseline to intervention comparison) for which a functional relation identification was possible (i.e., sufficient data per condition with three potential demonstrations of effect) were coded using the SCARF 2:0 (Ledford et al., 2020) to assess the overall Q&R and outcomes. The SCARF evaluates Q&R in several categories: (a) data sufficiency, (b) data reliability, (c) procedural fidelity, (d) DV descriptions, (e) condition/participant descriptions, and (f) ecological/social validity. Q&R coding is automatically converted into a numeric 0 to 4 score, with higher scores representing higher-quality studies (i.e., studies with a thorough methodological description and rigorous controls for threats to internal validity; Chazin et al., 2021; Ledford & Windsor, 2022). We elected not to include comparison designs in this coding because interpretation of an outcome of no difference between two intervention conditions (no functional relation, with both interventions being similarly effective or ineffective) is substantially different than interpretation of an outcome of no difference between a baseline and an intervention condition (no change from baseline, evidence of ineffectiveness).
Outcomes were evaluated via the SCARF using visual analysis, with scores of 0 indicating no positive effects, scores of 1 to 2 indicating inconsistent or minimal effects, and scores of 3 to 4 indicating consistent positive effects (a positive functional relation between the dependent and independent variable was apparent). These data were plotted to allow for visual analysis of the relationship between Q&R and outcomes, with high Q&R and outcome scores (top right quadrant) indicating high-quality evidence of positive effects. Contrastingly, high Q&R scores and low outcome scores (bottom right quadrant) indicate high-quality evidence of negative outcomes (inconsistent, non, or negative effects; for additional information regarding the SCARF please see https://ebip.vkcsites.org/scarfv2/).
Generalization and Maintenance Coding
Generalization and maintenance data were evaluated using the SCARF, with outcomes plotted on the vertical axis and measurement details on the horizontal axis. More distal (maintenance) or rigorous (generalization) measurement is depicted further right on the graph while less distal or rigorous measurement is depicted further to the left of the axis. As described for primary outcomes, generalization and maintenance outcomes were scored on a scale of 0 to 4, with scores of 3 and 4 representing evidence of consistent positive effects.
Interobserver Agreement
Interobserver agreement (IOA) data were calculated using the point-by-point method ([agreements / total agreements + disagreements] × 100). Mean IOA was 92.12% (86.22%–97.29%; see “IOA” in the online Supplemental Materials). All sources were double-coded (IOA coding was calculated for all codes for all sources). Disagreements for descriptive coding were resolved by the primary author and disagreements for quality and outcomes coding were resolved via weekly discrepancy discussions between the two authors.
Results
We identified and included 33 eligible sources, including 189 (demonstration and comparison) single case designs, with publication (or completion) dates ranging from 1990 to 2021 (Mdn = 2013; no date restrictions were set, but no eligible studies published prior to 1990 were identified).
Participants
Participants (n = 149) included 101 identified as being male or a boy (68%) and 40 as being female or a girl (27%). No participants were identified as being non-binary and gender was not reported for eight participants (Giunta-Fede et al., 2016; Ledford & Wolery, 2015). Average reported age was 4.54 years old (SD = 1.29). Age was not reported for six participants, all of which came from a single source (Ledford & Wolery, 2015). Most (n =117, 79%) participants were identified as having a disability, predominantly as autistic (n = 54, 36%) or as having a developmental delay (n = 47, 32%) or a speech language impairment (n = 26, 17%; see Table 2). Race was not reported for 57 (38%) participants. When race was reported (n = 92, 62%), participants were predominately identified as being White (n = 54, 36%) or Black (n = 22, 15%; see Table 2). Ethnicity was only reported for four sources (Lane et al., 2015; Ledford et al., 2017; Olszewski et al., 2017; Schebell et al., 2018) with seven participants identified as Hispanic.
Participant Information.
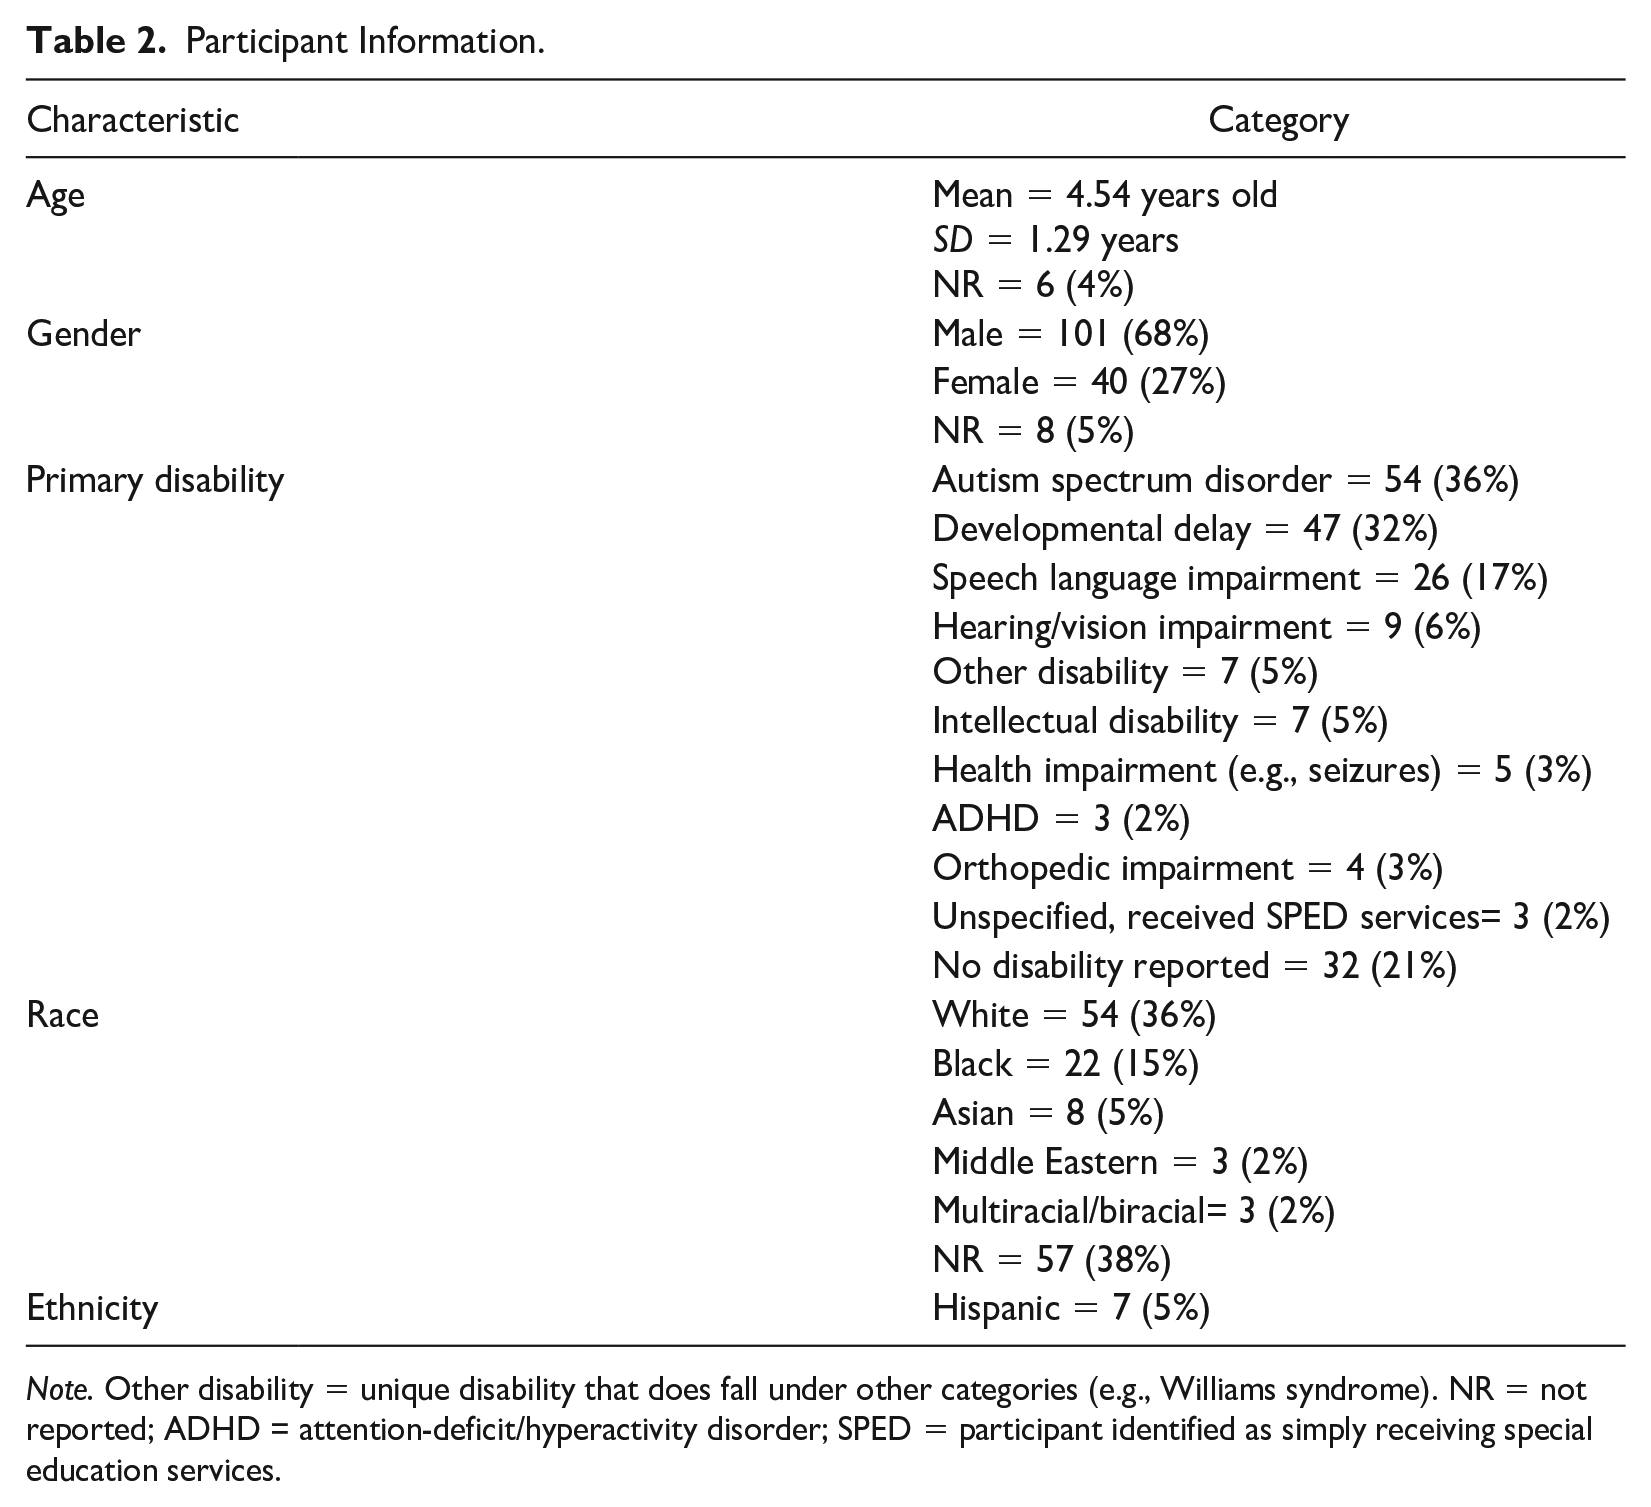
Note. Other disability = unique disability that does fall under other categories (e.g., Williams syndrome). NR = not reported; ADHD = attention-deficit/hyperactivity disorder; SPED = participant identified as simply receiving special education services.
Dependent Variables
Commonly reported DVs were academic skills (n = 91, 61%; e.g., sight words, math facts, matching), followed by communication/social/joint attention (n = 54, 36%; e.g., social communication, imitation, play) and adaptive behaviors (n = 4; 3%; e.g., hand washing). Although there were some examples of chained behaviors (e.g., swimming; Rogers et al., 2010), DVs were primarily reported to be discrete skills. The most commonly reported target behavior topography was verbal responses (n = 117, 79%), followed by motor performance (n = 39, 26%) and motor identification (n = 2, 1%). One source reported target behaviors including both verbal and motor performance responses (n = 4; Gast et al., 1993). Relatedly, controlling prompt topographies were most often a verbal model (n = 115, 77%) or full physical assistance (n = 27, 18%; see Table 3).
Dependent Variable Information.
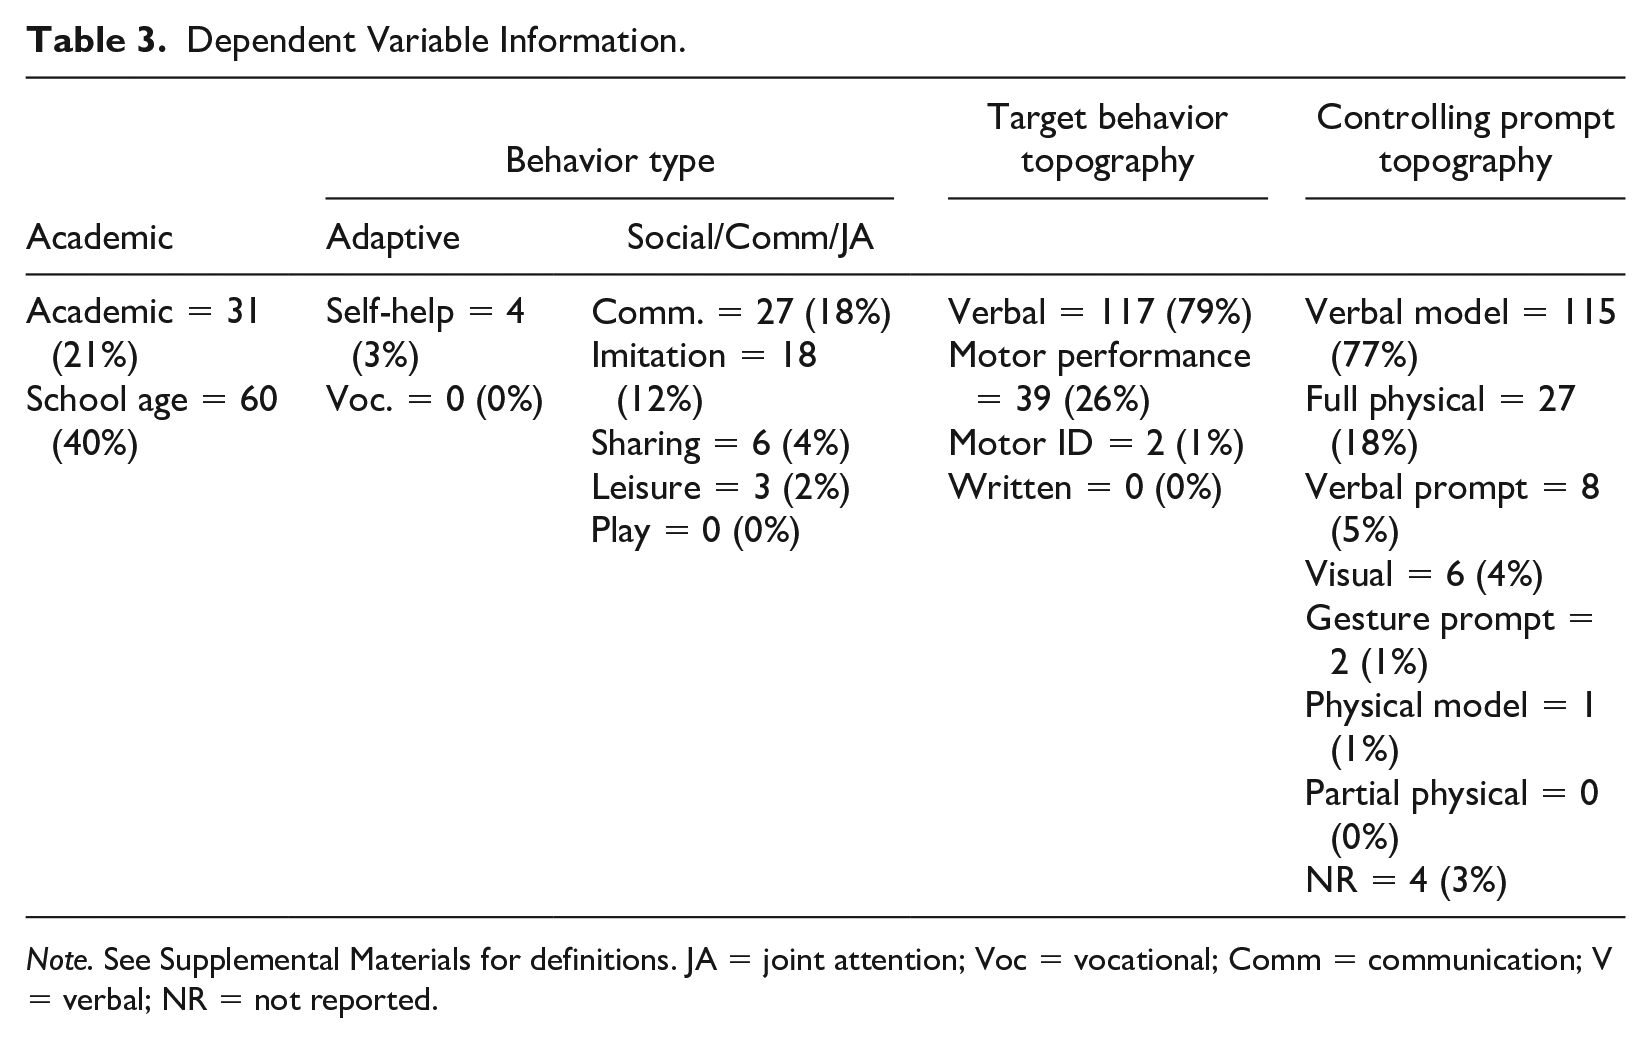
Note. See Supplemental Materials for definitions. JA = joint attention; Voc = vocational; Comm = communication; V = verbal; NR = not reported.
Independent Variables
TD Type and Interval Details
A similar number of designs were included that evaluated CTD (n = 64, 43%) and PTD (n = 85, 57%). The most common number of 0-s delay sessions conducted for each participant was two (n = 43, 29%), followed by three (n = 35, 23%), and one (n = 32, 21%). The number of instructional sessions at 0-s delay was not reported for 39 (26%) participants. The most commonly reported terminal latency—the largest wait interval provided prior to the delivery of the controlling prompt—was a 3-s delay (n = 63, 42%), followed by a 4-s delay (n = 44, 29%). For sources that evaluated PTD, the most commonly reported interval to increase latency was a 1-s delay (n = 55, 65%), followed by a 2-s delay (n = 12, 14%) and a 3-s delay (n = 12, 14%). Criteria for increasing the delay latency were reported for 112 (75%) participants (e.g., latency increased after the participant reached 100% unprompted or prompted correct responses; Shepley et al., 2016). Criteria for decreasing the delay latency were reported for 36 (24%) participants (e.g., moving back to 0 s delay contingent on two or more unprompted errors in a session; Chazin & Ledford, 2021). Mastery criteria were reported for 115 (77%) participants. The most commonly reported mastery criteria was 100% unprompted correct responses for two consecutive sessions (n = 29), followed by 100% unprompted correct responses for three consecutive sessions (n = 20).
Additional Components
Trials occurred in massed (n = 112, 75%), embedded (n = 36, 24%), and distributed formats (n = 7, 5%). One source included both massed and embedded trials (n = 10; Ledford et al., 2017), measuring child preference for each. On average, sessions conducted in a massed trial format consisted of 15 total trials per session (range = 3–30), sessions conducted in an embedded trial format consisted of 10 total trials per session (range = 4–24), and sessions conducted in a distributed trial format consisted of 9 total trials per session (range = 5–12).
The use of an attending cue was reported for 94 (63%) participants. An error correction was used for 87 (58%) participants contingent on an incorrect response (e.g., provided the correct the response; Ledford et al., 2019). Instructive feedback (the provision of additional information contingent on correct responding; Alber et al., 1999; Whatley et al., 2009) was provided for 22 (15%) participants. Implementers repeated trials based on errors for 46 (31%) participants and interspersed known or previously mastered targets for 38 (26%) participants.
Most participants (n =145, 97%) were provided with social consequences indicating approval or correctness, and 37 (25%) participants were provided social consequences indicating acknowledgment of an error contingent on incorrect responding. A total of 67 (45%) participants were provided items without inherent value (e.g., tokens) that were later exchanged for a reward, and 73 (49%) participants were provided access to tangible items (including edibles) or preferred contexts contingent on correct responding. In addition to reinforcement for target responses, reinforcement was provided to 48 (32%) participants for engaging in non-target behavior (e.g., attending, staying seated). No source reported the removal of tokens or preferred items contingent on errors or challenging behavior.
Modifications due to insufficient correct responding were made to TD procedures for 19 participants. Modifications included increasing or altering reinforcement (n = 8; Chazin & Ledford, 2021; Francis et al., 2020; Ledford et al., 2017; Sweeney et al., 2023; Todt et al., 2023), alternating the attending cue (n = 5; Ledford et al., 2017; Ledford & Wolery, 2015) or instructional format (n = 3 Ledford et al., 2017; Sweeney et al., 2023; Todt et al., 2023), and changing the response latency (n = 2; Valk, 2003). Six of the seven studies that used modifications came from a related group of authors, perhaps suggesting that some researchers may be more likely to make modifications when acquisition is slow or delayed.
Contexts and Implementers
Instructional arrangement (i.e., how many children were present) was not reported for three sources (Giunta-Fede et al., 2016; Klaus et al., 2019; Schrandt et al., 2009). When reported, the majority of reported sessions took place in a one-on-one format (n = 17, 52%), followed by a small group (defined as eight or less; n = 14, 42%). Two sources reported using both one-on-one and small group instruction (Fleming, 1991; Hawkins, 2008).
Sessions commonly occurred in classrooms (n = 30, 91%), including special education (i.e., self-contained or pullout; n = 14), general education (n = 12), and non-specified (i.e., authors did not report classroom type; n = 4). Other identified settings were a clinic (n = 3, 9%) and community park (n = 1, 3%). Most TD sessions were implemented by researchers (n = 22, 67%), followed by classroom teachers/instructors (n = 7, 21%), and a classroom teacher enrolled in graduate school at the time of implementation (n = 1, 3%). TD Implementer was not reported for three sources (9%; Alig-Cybriwsky et al., 1990; Kinder, 2010; Schrandt et al., 2009). Of sources that reported teacher/instructor implementation, only three provided information about teacher training (e.g., video modeling and role-playing, Gast et al., 1993; Olszewski et al., 2017; Rakap, 2019).
SCARF 2.0 Analysis
The SCARF (Ledford et al., 2020) was used to assess the Q&R and outcomes for all eligible single case demonstration designs (n = 111) Designs included multiple probe/baseline designs across behaviors (n = 66, 59%), adapted alternating treatment designs (n = 36, 32%), and multiple probe/baseline across participant designs (n = 9, 8%).
Quality and Rigor
Studies were generally high-scoring on internal validity measures, with 108 (97%) having sufficient data, 90 (87%) collecting sufficient reliability data and demonstrating high agreement, and 96 (86%) collecting fidelity data and demonstrating high fidelity. Feasibility or acceptability ratings (i.e., social validity) were reported for 29 designs (26%). Typical environments and/or endogenous implementers were used for 92 designs (82%). The average Q&R score, as reported by the SCARF, across all included designs was 2.88 (Mdn = 3.14; possible range 0 - 4; actual range 1.5 - 3.53). Most (n = 102; 92%) designs had scores above 2.0; single case designs that scored below 2.0 (n = 9, 8%) came from a single peer-reviewed source.
Outcomes
Most outcome scores corresponded with functional relation determination (i.e., SCARF score of 3 or 4; see Figure 2), with no functional relation being identified in 15 (14%) designs. The median outcome score was 4, indicative of a functional relation with no weak effects (range: 0–4). Thus, 96 (86%) designs had data patterns consistent with a functional relation.
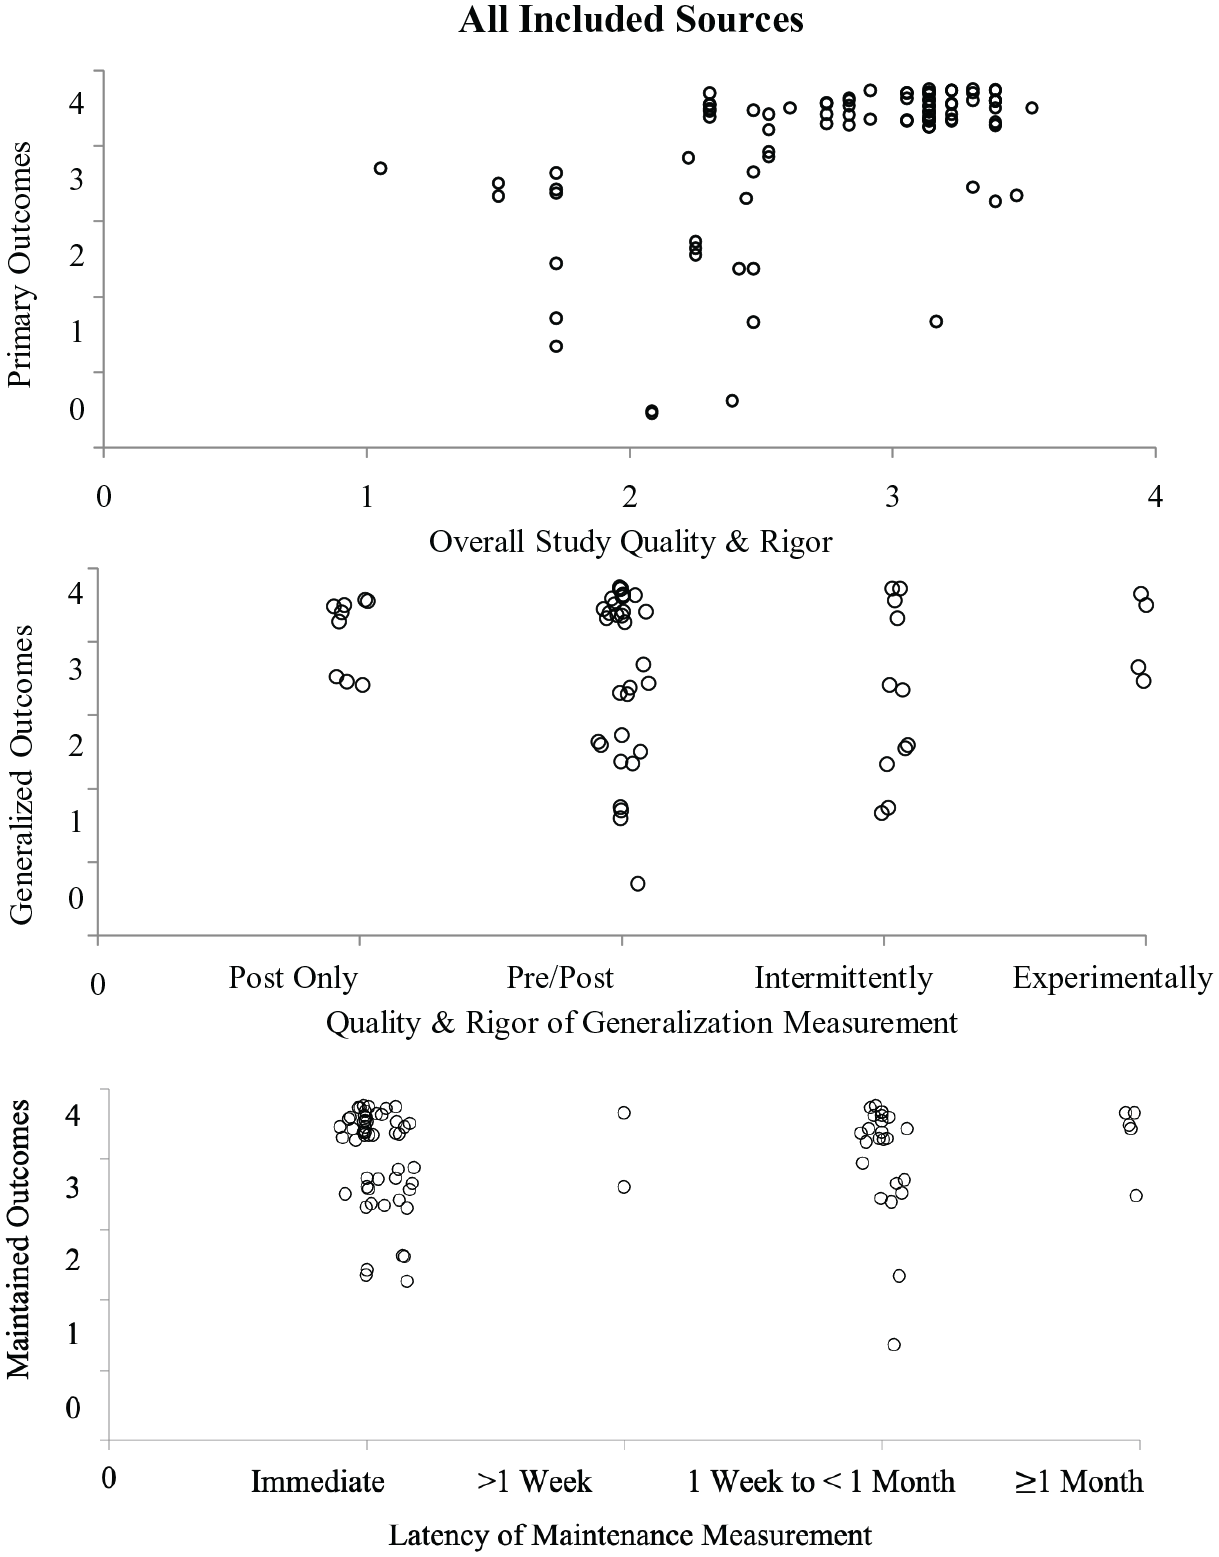
SCARF Data for Included Sources
Outcomes by Publication Status
As shown in Figure 3, published and unpublished studies had mixed outcomes, although unpublished studies had a smaller range of rigor scores, such that published studies contributed to all scores under two. There were 28 designs in unpublished sources, six of which did not demonstrate a functional relation (21%) and there were 83 published designs, nine of which did not demonstrate a functional relation (11%).
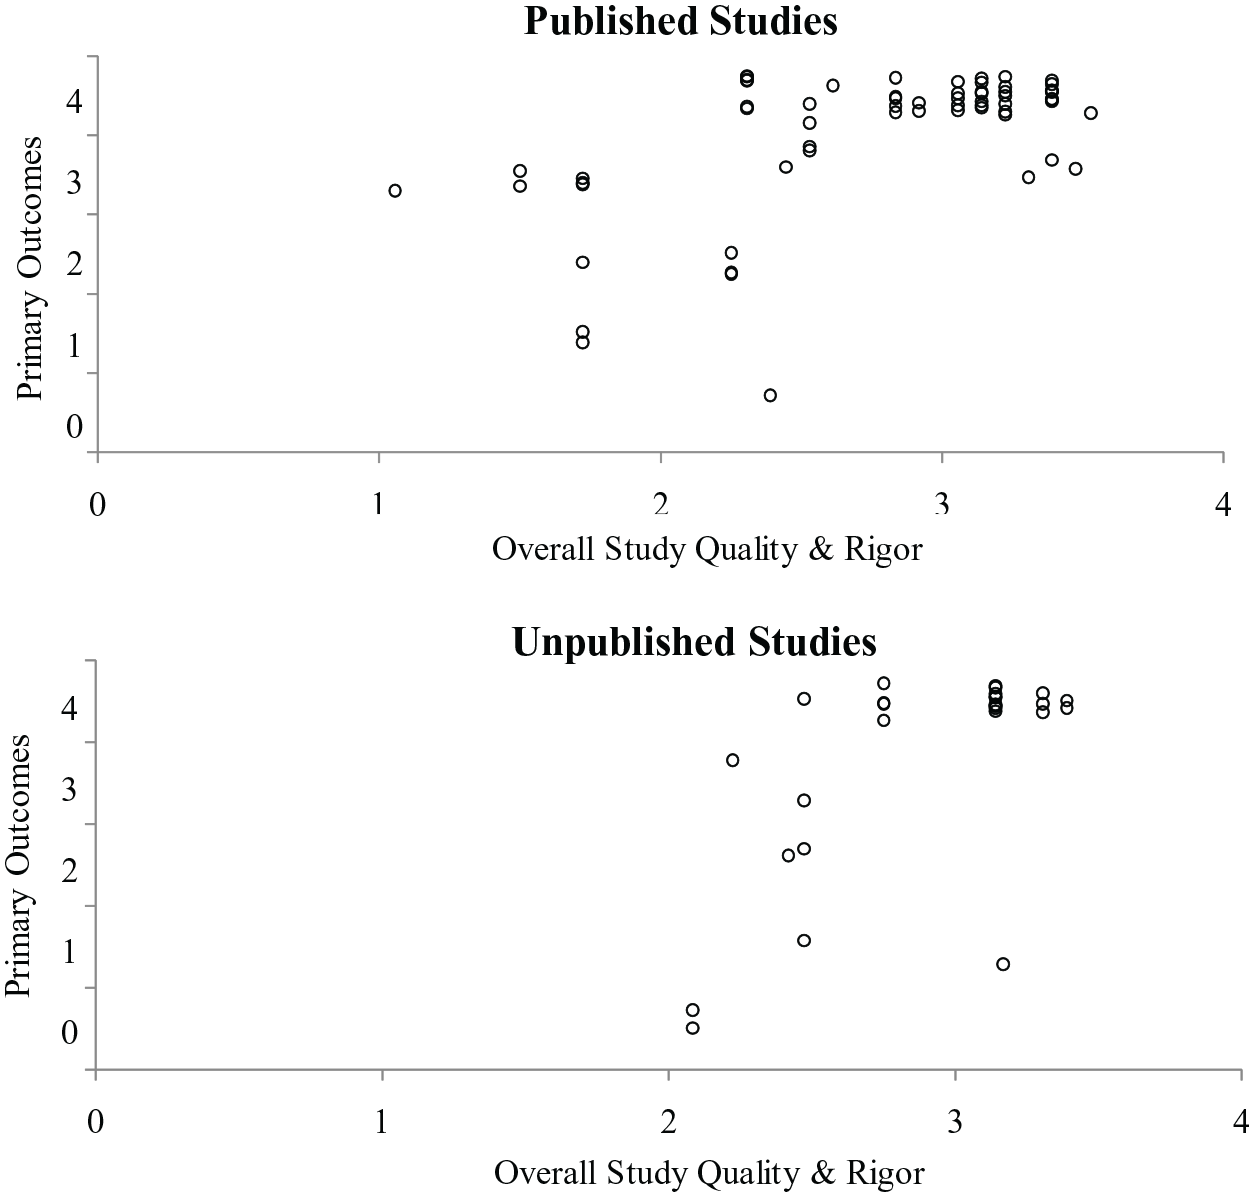
SCARF Data for Published vs Unpublished Sources
Outcomes by Behavior Topography
To explore whether outcomes varied based on the topography of the target behavior, we analyzed separately designs including measurement of a verbal behavior and those including measurement of a motor behavior. As shown in Figure 4, there was variability in both types, with 18 of 22 designs measuring motor behavior demonstrating a functional relation (82%), and 72 of 83 designs measuring verbal behavior demonstrating a functional relation (87%).
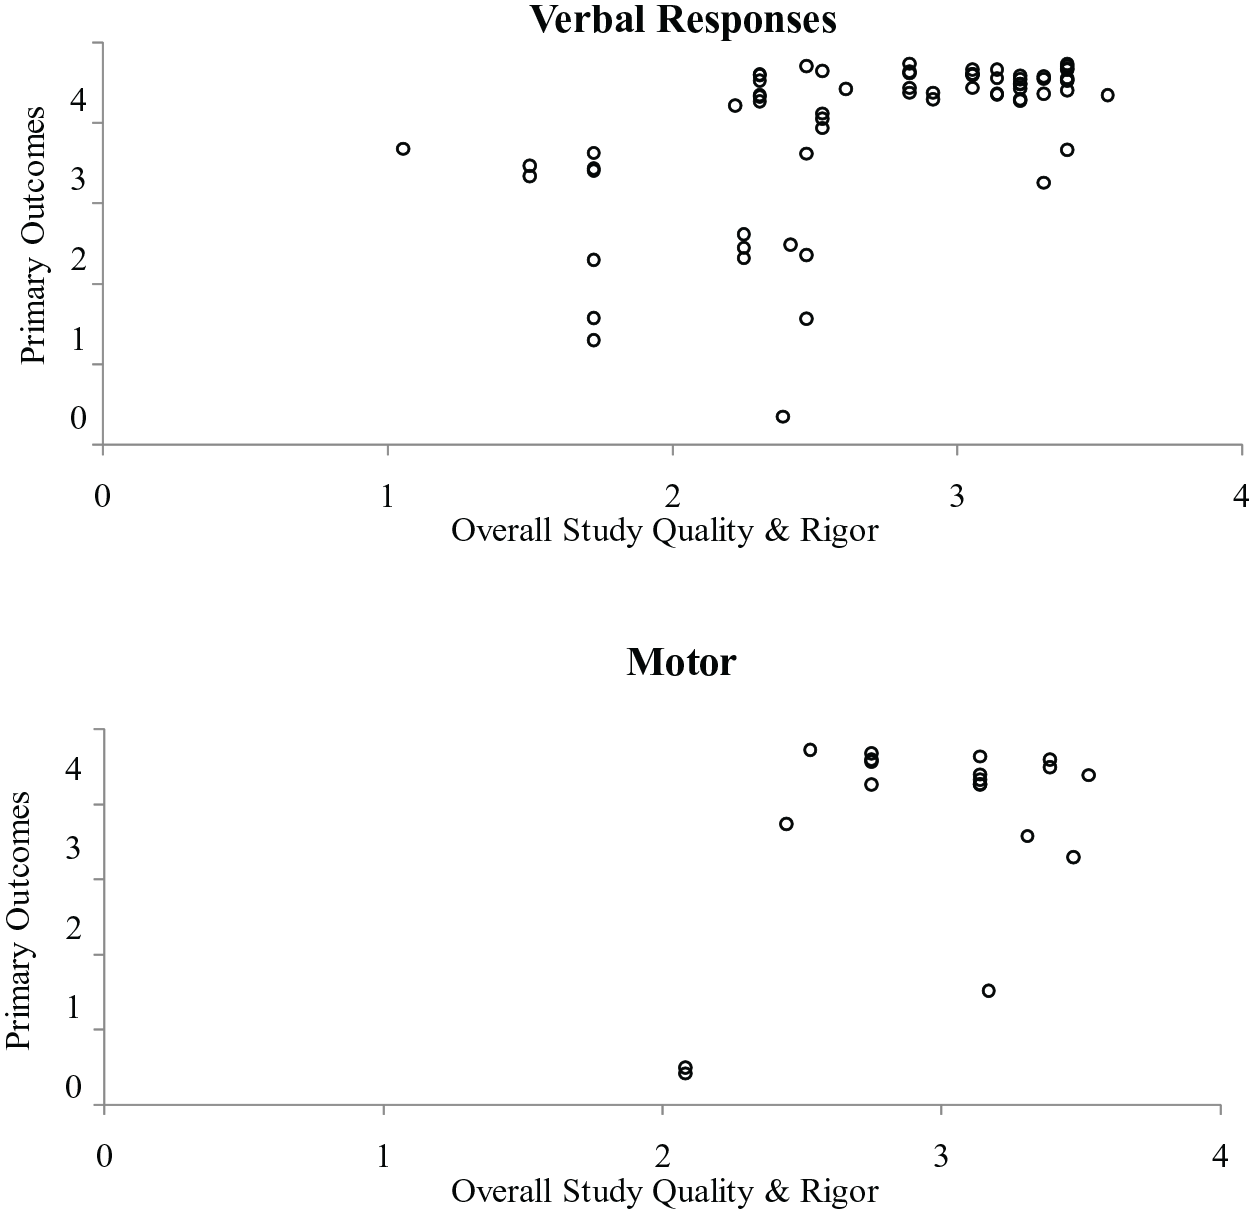
SCARF Data for Verbal vs Motor Responses
Outcomes by Instructional Arrangement and TD Type
We also explored whether outcomes were different based on instructional arrangement (one-on-one versus small group). As shown in Figure 5, most designs demonstrated a functional relation (58 of 64, 91%) when individual instruction was used. Fewer designs assessing small group instruction demonstrated a functional relation (43 of 53, 81%); however, this difference was partially explained by quality. When only considering designs with a score of at least two, more studies included data indicative of a functional relation (36 of 43, 84%). When analyzing the designs that were of high Q&R but demonstrated a non-effect, 10 out of the 12 designs evaluated the use of CTD rather than PTD.
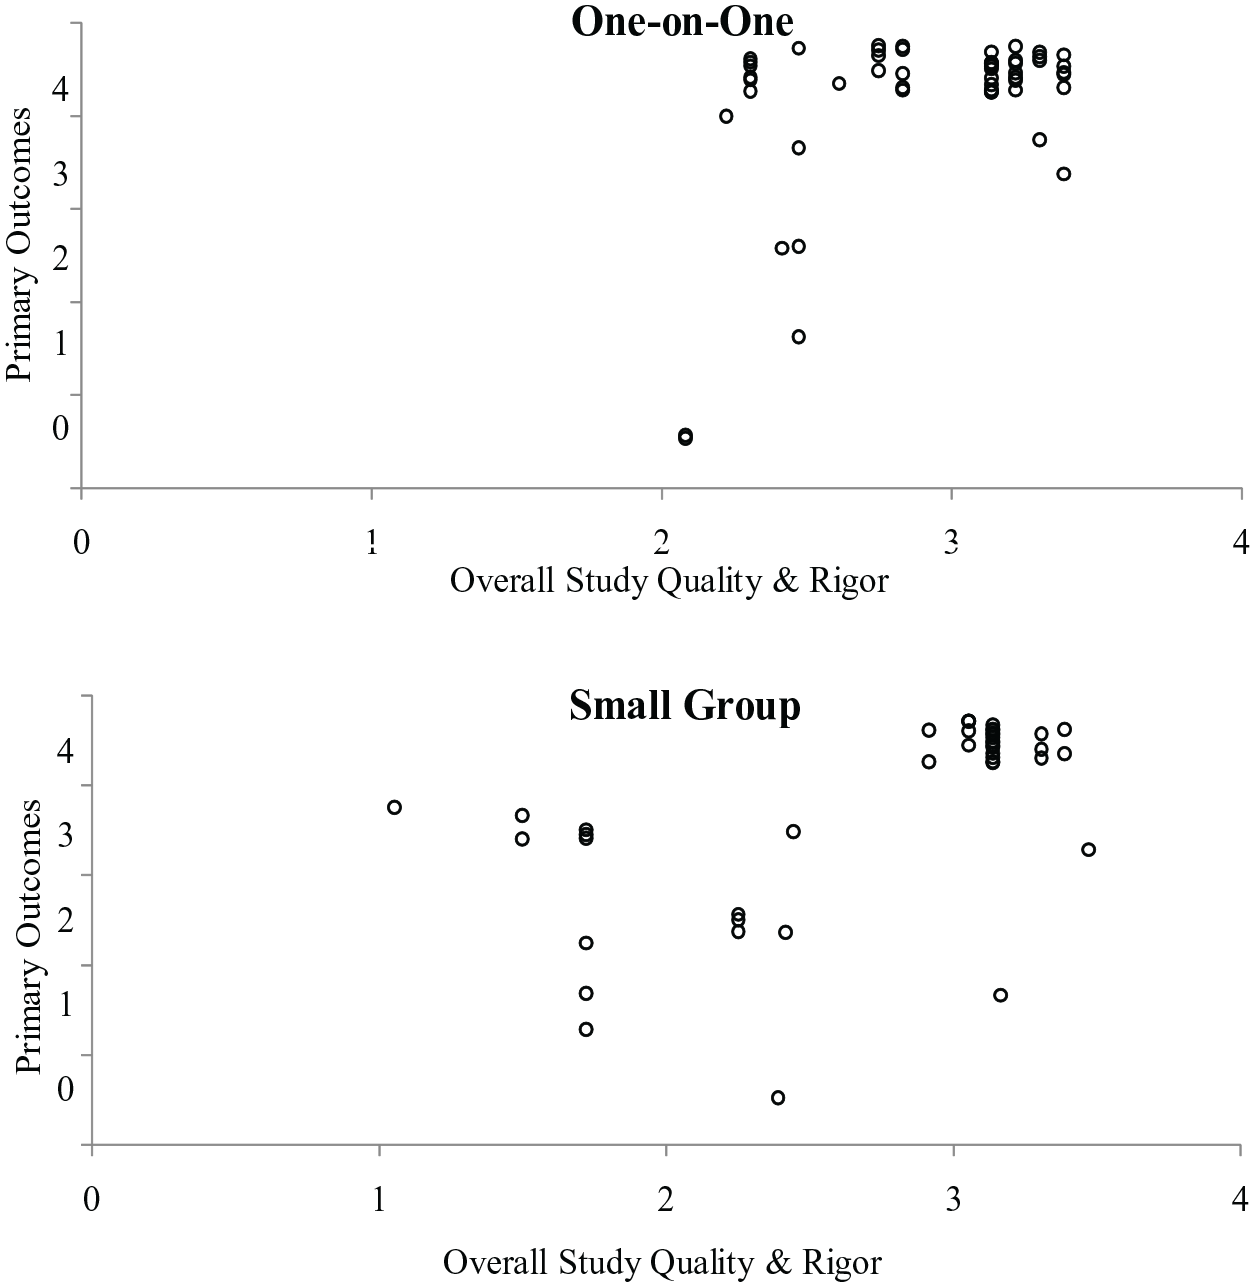
SCARF Data for TD Implementation in One-on-One vs Small Group Settings
Generalization Measurement and Outcomes
The most commonly reported form of generalization measurement was stimulus generalization with novel materials (n = 44, 40%), followed by contexts (n = 40, 36%), and social partners (n = 31, 28%). In 15 designs (14%), a behavior representing a generalized tendency (e.g., play behaviors) was measured. In one design, a specific behavior (or type of behavior) was taught, and a different specific behavior was measured (i.e., response generalization; Schrandt et al., 2009). Outcomes for generalization were mixed, with about half of the designs (n = 30; 48%) coded as having all strong positive effects (SCARF outcome = 4), followed by 15 designs (24%) coded as having at least one weak positive effect and one strong positive effect with no non-effects (SCARF outcome = 3; see Figure 2).
Maintenance Measurement and Outcomes
A total of 89 (80%) designs reported evidence of continued behavior change, following the removal of the intervention. Of those single case designs in which maintenance was reported, 54 (49%) were unclear in their reporting of maintenance or only reported maintenance immediately following completion of intervention. Designs that measured maintenance were coded as representing strong positive effects (SCARF outcome = 4; n = 60; 54%), followed by those that were analyzed to have a least one weak positive and one strong positive effect with no non-effects (SCARF outcome = 3; n = 20; 18%; see Figure 3).
To explore whether outcomes varied based on the target behavior domain, we analyzed separately the two most common outcome domains—social/communication/joint attention and academic behaviors. Data were similar for both (see graphical representation of all SCARF data via “All SCARF Data” in the Online Supplemental Materials), but maintenance data were discrepant, as shown in Figure 6. First, social behaviors were almost exclusively measured immediately after intervention was withdrawn (or timing of maintenance measurement was unreported). For these designs, 10 of 12 demonstrated positive maintenance outcomes (83%). Academic outcomes were also commonly measured immediately (n = 42) with primarily positive outcomes (40 of 42 designs, 95%). When measured at a longer duration (e.g., 1 week or longer; n = 31), outcomes were also mostly positive (27 of 31 designs, 87%).
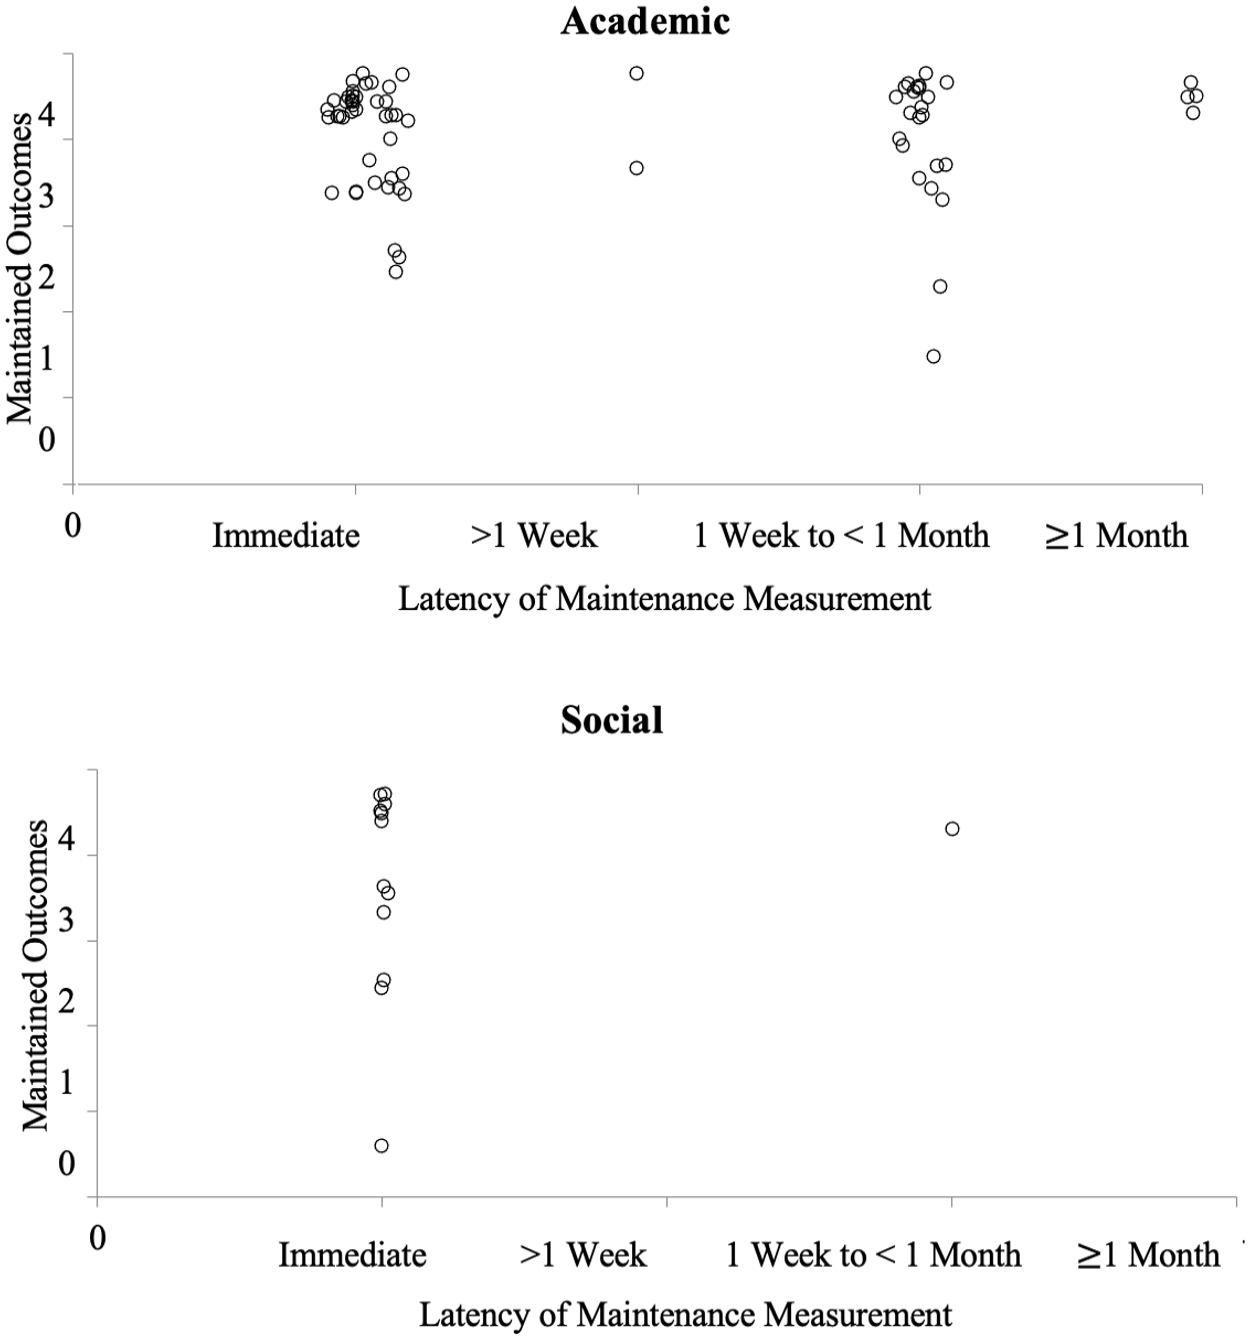
SCARF Maintenance Data for Academic and Social Behaviors
Discussion
The purpose of this review was to analyze the characteristics of the TD literature and evaluate the quality and outcomes, in relation to participant and variable characteristics, and with consideration for publication bias. A total of 33 eligible sources, including 111 single case demonstration designs were included in this analysis. Overall designs were of higher Q&R (M = 2.88) than previous reviews of other intervention types (Barton et al., 2020; Chazin et al., 2021; Ledford & Pustejovsky, 2023; Ledford & Windsor, 2022). Ninety designs that were high in Q&R were visually analyzed to be consistent with a positive functional relation, representing substantial, but not universal, evidence for the effectiveness of TD.
For Whom is TD effective?
The majority (79%) of included participants were diagnosed with a disability, with the most common being developmental and intellectual disabilities. It may be unsurprising that these participants comprised the largest group, since they might, in particular, be most likely to receive supplemental direct instruction during the early childhood years. Similar to previous reviews (Robertson et al., 2017; Severini et al., 2018), there was minimal reporting of participant race or ethnicity. Absent race and ethnicity data prevent future researchers from being able to identify and make the appropriate adjustments to mitigate potential over or under representation of marginalized communities in research (Pritchett et al., 2022).
When analyzing the single case designs that were of high Q&R but demonstrated a non-effect, 10 out of the 12 (83%) designs evaluated the use of CTD and not PTD. This is an important distinction to make when considering instruction for young children. Preschool-aged children are more developmentally likely to engage in more impulsive behaviors and are less likely to wait for a prompt (Ledford et al., 2019) when compared with older children or adults. In addition, the response guided increase in the delay interval required for PTD (Ledford et al., 2019) may make it difficult for endogenous implementers to achieve fidelity when tasked to remember various TDs across different target behaviors and children. In summary, we are most confident in the positive results of TD for children with autism and developmental delays, with preliminary indications that PTD might be more universally effective for young children than CTD.
For What Behaviors is TD Effective?
Most (83 of 111; 75%) designs that were analyzed using the SCARF evaluated TD for target behaviors that were verbal in topography. In contrast, only 22 (20%) designs evaluated TD for target behaviors that were gross or fine motor in topography. Thus, although both topographies were often associated with generally positive effects (see Figure 4), TD may have primarily been assessed with students who were already proficient at vocal imitation, indicating a need for future research evaluating the implementation of TD for children who are not consistently imitative. In addition, the majority (56%) of the DVs in which a modification was reported were imitative behaviors. This is strikingly different from the 12 percent of all DVs reported as imitative (see Table 3). This is interesting, because TD can also be used to teach imitation (Francis et al., 2020; Valk, 2003; Venn et al., 1993)—additional research may be needed to determine whether children who are not readily imitative can be taught to imitate using TD with physical prompts, which then allows them to be taught a variety of other skills using model prompts (i.e., teaching imitation with TD is a pivotal skill that allows for less intrusive prompts in later TD instruction).
Although both were consistent with positive effects, maintenance data discrepancies were observed when analyzing dependent variables. Maintenance data collected on academic tasks varied in the duration of time that lapsed after intervention was removed, whereas maintenance data collected on social behaviors predominately occurred immediately following the removal of the TD intervention (see Figure 6). Thus, while long- and short-term maintenance of academic skills were largely positive, conclusions about long-term maintenance of social behaviors are not possible. Additional research is needed to determine whether these social behaviors taught via TD maintain over time.
Under What Conditions is TD Effective?
Interventions were predominately conducted in a massed trial format. Previous research has shown that child preference for embedded trials versus massed is mixed (Ledford et al., 2017) and different benefits exist (i.e., massed trials are efficient while embedded trials allow for child-directed interactions). Most instruction occurred in special education settings, limiting conclusions about the extent to which TD can be used in inclusive classrooms and other typical settings. Thus, there is a need for additional research evaluating TD in an embedded and distributed trial formats, especially when multiple children are present (e.g., in typical classroom contexts), and in general education settings to increase the ecological validity of the TD procedure.
Recommendations and Future Directions
It is recommended that practitioners consider the necessary prerequisite skills (e.g., the ability to wait for prompt), target behavior, and implementer skill set (i.e., ability to implement each potential procedure to fidelity), when deciding which TD procedure to use (CTD, PTD). Practitioners may want to assess the child’s ability to wait for a prompt prior to implementation (e.g., determine if the child waits for help when known versus unknown targets are presented). If the child demonstrates the inability to consistently wait for a few seconds (e.g., 3 s) prior to the delivery of the prompt, the practitioner may want to consider implementing wait training (Ledford et al., 2019) prior to instruction.
The mixed results of this review indicate several areas of need that require additional research in the TD literature: First, additional research is needed regarding how to teach children the prerequisite skills required to benefit from TD instruction and to provide guidance to practitioners regarding which TD procedure to choose (CTD, PTD). Second, information about the effectiveness of TD for older children is needed, as the outcomes reported here may not generalize to older children with more instructional experience. Finally, additional research is also needed to allow for confident conclusions to be drawn for use of TD in typical settings (e.g., in a small or whole group classroom format). Moreover, research is needed to determine if teachers can and will use TD, and the contexts in which it is currently being used.
Limitations
The outcomes and recommendations presented in this review should be interpreted in light of several limitations. Due to time and resource constraints, we did not complete a forward and backward search of the included literature and limited our search to sources found via PsychInfo and ProQuest rather than other electronic databases (e.g., ERIC). In addition, participant experience with TD, prior to intervention, was not coded during this review, which may affect the interpretation of participant prerequisite skills. In addition, due to the small size of some of the sample groups, there may be some differences that can be attributed to unidentified factors. Finally, although we identified and included theses and dissertations in this review, other unpublished sources may exist (e.g., conference presentations) and may have been, therefore, excluded.
Conclusions
This review provides an updated analysis on the TD literature. Robust data suggest that TD is effective for teaching young children with intellectual and developmental disabilities to engage in novel behaviors, when used in a one-on-one massed trial format. Because there were relatively few comparisons that used different variations of the TD procedure (e.g., massed vs embedded TD instruction), additional research is needed to clarify under what additional conditions (e.g., embedded, distributed) and for whom (e.g., older children) the TD procedure will be most likely to result in optimal outcomes.
Footnotes
Acknowledgements
Special thanks to Sienna A. Windsor, Kelsey H. Smith, Anna E. Cantrell, Payton L. Watton, Lori B. Throne, and Jocelyn Ng for their assistance with data collection.
Declaration of Conflicting Interests
The author(s) declared no potential conflicts of interest with respect to the research, authorship, and/or publication of this article.
Funding
The author(s) disclosed receipt of the following financial support for the research, authorship, and/or publication of this article: This research was supported, in part, by the Office of Special Education and Rehabilitative Services (H190004).
Supplemental Material
Supplemental material for this article is available online.