
Abstract
Background
Resting quadriceps muscle thickness (QMT) is known to be associated with muscle strength; however, the clinical relevance of contracted QMT in identifying muscle weakness has not been fully clarified.
Objective
This study aimed to investigate the relationship between resting and contracted QMT and isometric peak knee-extension torque (PT) and to evaluate the diagnostic value of contracted QMT in predicting probable sarcopenia (PS).
Methods
Forty-two individuals with PS and sixty-two healthy controls were evaluated. QMT and PT were compared between groups. Linear regression analyses examined the associations between QMT, handgrip strength (HGS), and appendicular skeletal muscle mass. Logistic regression and receiver operating characteristic (ROC) analyses assessed the diagnostic performance of contracted QMT.
Results
Individuals with PS had lower contracted QMT and knee-extension strength than controls (all p < 0.01). Contracted QMT, rather than relaxed measurements, showed positive associations with HGS and appendicular skeletal muscle mass (ASMM) (all p < 0.05). Contracted QMT independently predicted PS (OR = 0.90, 95% CI: 0.82–0.99), and ROC analysis indicated moderate discriminatory performance (AUC range: 0.62–0.77).
Conclusions
While both measurements were reduced in PS, contracted QMT showed a stronger association with muscle mass and strength. These findings suggest that contraction-based ultrasound parameters may serve as a preliminary and exploratory adjunct for identifying early functional decline. However, given the moderate discriminatory power, further standardization and external validation are required before routine clinical adoption.
Introduction
Sarcopenia is an age-related skeletal muscle disorder characterized by progressive loss of muscle mass and strength.1,2 According to the European Working Group on Sarcopenia in Older People 2 (EWGSOP2) criteria, the first step in diagnosis is the identification of reduced muscle strength, and individuals with low strength but preserved muscle mass are classified as having probable sarcopenia (PS).3,4 This stage represents a critical early window for intervention.
Lower-limb muscles are the first to experience loss during the aging process and serve as a fundamental determinant of mobility and functional capacity in older adults.5–8 Therefore, assessing lower-limb muscles such as the isometric peak knee-extension torque (PT) is important for the early identification of PS. While handgrip strength (HGS) is frequently used as a low-cost and practical tool in sarcopenia diagnosis, it may remain insufficient for the early identification of PS due to its dependance on voluntary effort, the influence of conditions such as pain or osteoarthritis, and its inability to fully reflect lower-limb muscle strength.5,9
Ultrasound (US) is a reliable, accessible, and radiation-free method used widely in musculoskeletal assessment, and positive results have been reported for its use in sarcopenia screening.10–12 Previous studies have shown positive associations between quadriceps muscle thickness (QMT) and muscle strength13–15; however, most have focused on relaxed measurements.
Muscle thickness increases significantly during contraction due to changes in pennation angle and passive fiber recruitment. 16 Contracted QMT may better reflect functional muscle properties and early decline in strength than relaxed thickness, as reported in previous studies.16,17 Thus, contracted measurements may serve as a more valuable indicator of the primary feature of PS — loss of muscle strength.
This analytical cross-sectional study aimed to evaluate the ability of relaxed and contracted QMT to predict PT and HGS, as well as their associations with appendicular skeletal muscle mass (ASMM) and gait speed, and to determine the diagnostic performance of contracted QMT in PS.
Hypotheses
H1: Contracted QMT better reflects strength deficits than relaxed thickness in individuals with PS.
H2: Contracted QMT shows stronger positive associations with PT, HGS, and ASMM compared with relaxed thickness.
H3: Contracted QMT discriminates PS with higher accuracy than relaxed thickness
Patients and methods
Study design
This analytical cross-sectional study aimed to evaluate the relationship between QMT and PT in individuals categorized into PS and control groups according to the EWGSOP2 criteria. Furthermore, it investigated the role of ultrasound-measured QMT as an alternative marker for identifying PS. Ethical approval and written informed consent were obtained from all participants.
Setting
The study was conducted at the Akdeniz University Hospital Physical Therapy and Rehabilitation Clinic, Isokinetic Dynamometer Unit, between December 2022 and May 2023. Participants were invited based on specific inclusion criteria, and data were collected over six months. All participants were assessed on the same day.
Participants
A total of 125 individuals who underwent lower extremity muscle strength assessment using an isokinetic dynamometer were screened for eligibility. Twenty-one individuals were excluded due to comorbidities (n = 9), refusal to participate (n = 7), or protocol ineligibility/loss to follow-up (n = 5). Thus, 104 participants (42 with PS and 62 controls) were included in the final analysis (Figure 1).
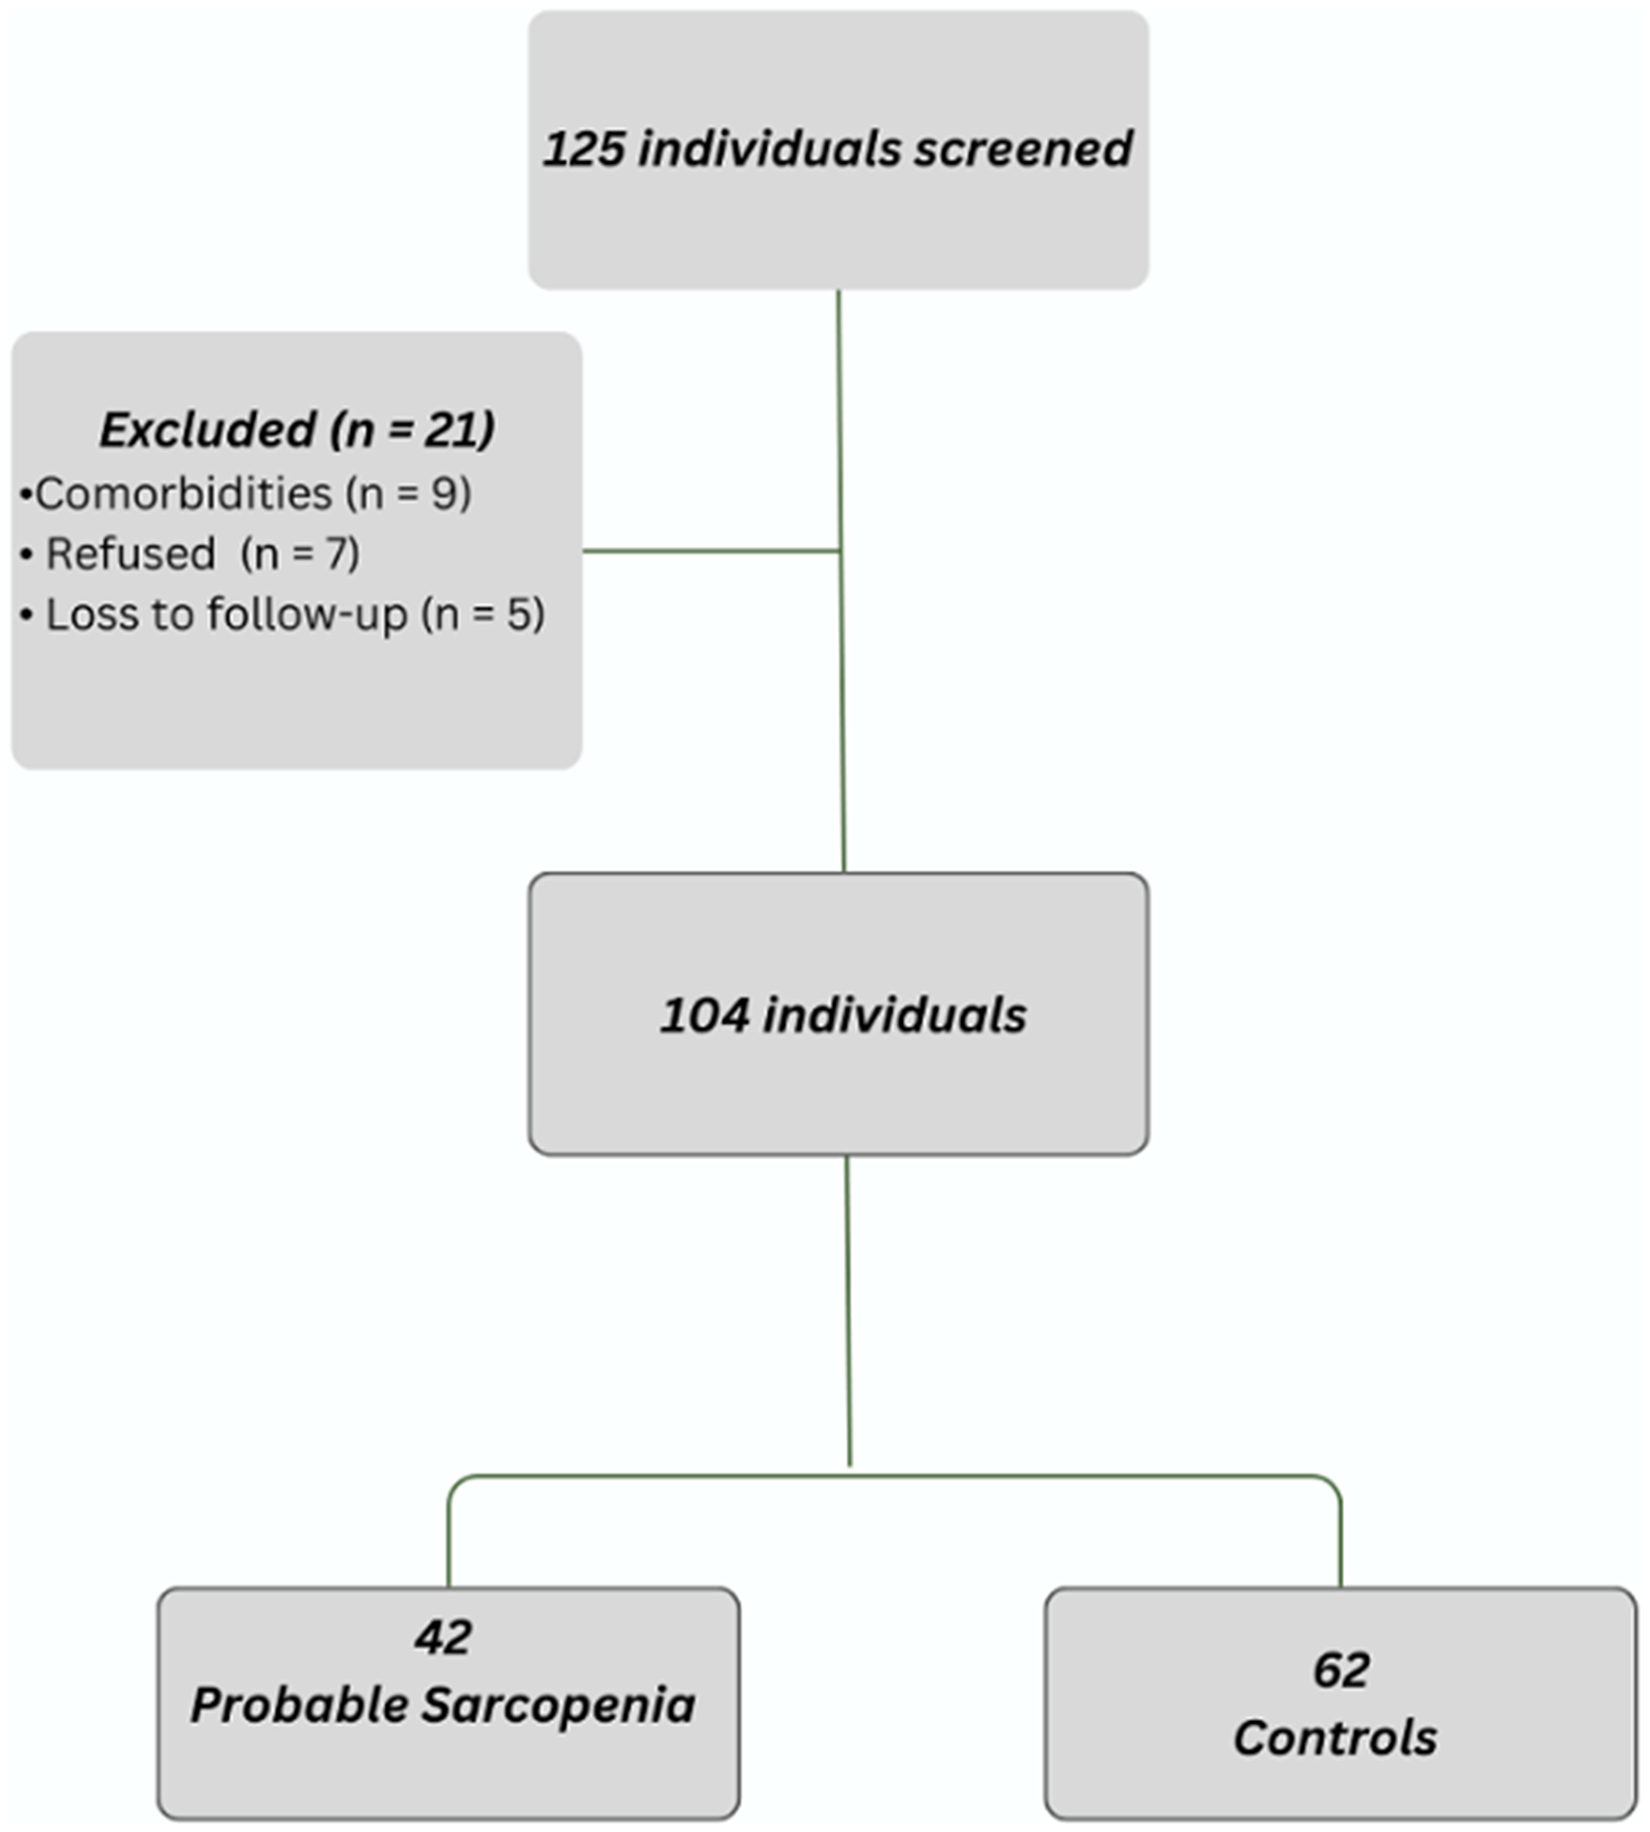
Participant flow diagram illustrating screening, exclusions with reasons, and final allocation into probable sarcopenia and control groups.
Participants were excluded if they had any inflammatory rheumatic diseases, malignancies, neurological disorders, or conditions that could cause muscle weakness, were using medications that could impact muscle strength or function (e.g., steroids), had cognitive impairments or conditions affecting their ability to provide informed consent, had uncontrolled chronic conditions such as diabetes or cardiovascular diseases, had significant lower extremity pain or musculoskeletal conditions that could interfere with performing maximal voluntary contraction during strength testing, or declined to participate in the study.
Participants were classified according to the 2019 revised diagnostic criteria of the EWGSOP2. 3 HGS was the average of two measurements taken from the dominant hand. HGS values of <27 kg for men and <16 kg for women were considered indicative of PS.
Variables
The primary outcome of this study is the QMT assessed using ultrasonography. The key variable is the PT measured with an isokinetic dynamometer. Other variables include HGS, the 4-meter walk test to assess gait speed, and ASMM. Potential confounding factors include age and sex.
Data sources/measurement
QMT (quadriceps muscle thickness)
QMT was measured using B-mode ultrasound (linear transducer, 5–12 MHz) with standardized musculoskeletal preset and a constant depth setting of 4–6 cm. Participants were positioned supine, and the knee was stabilized at 30° or 60° of flexion using a foam support placed under the leg. The ultrasound probe was positioned at the midpoint between the anterior superior iliac spine and the superior pole of the patella. Ample gel was applied and minimal probe pressure was maintained, and the combined thickness of the rectus femoris and vastus intermedius was measured. Relaxed measurements were obtained first. Without altering the probe location or pressure, an investigator applied counterforce at the ankle to prevent movement and elicit an isometric contraction, and the contracted thickness was recorded from the same anatomical site (Figure 2). All measurements were performed twice, with a 15-min interval between the first and second sets of assessments. The mean values of these two measurements were used for the final analysis. To ensure intra-rater reliability, the stability of these repeated measures was verified, and the results demonstrated high procedural consistency.
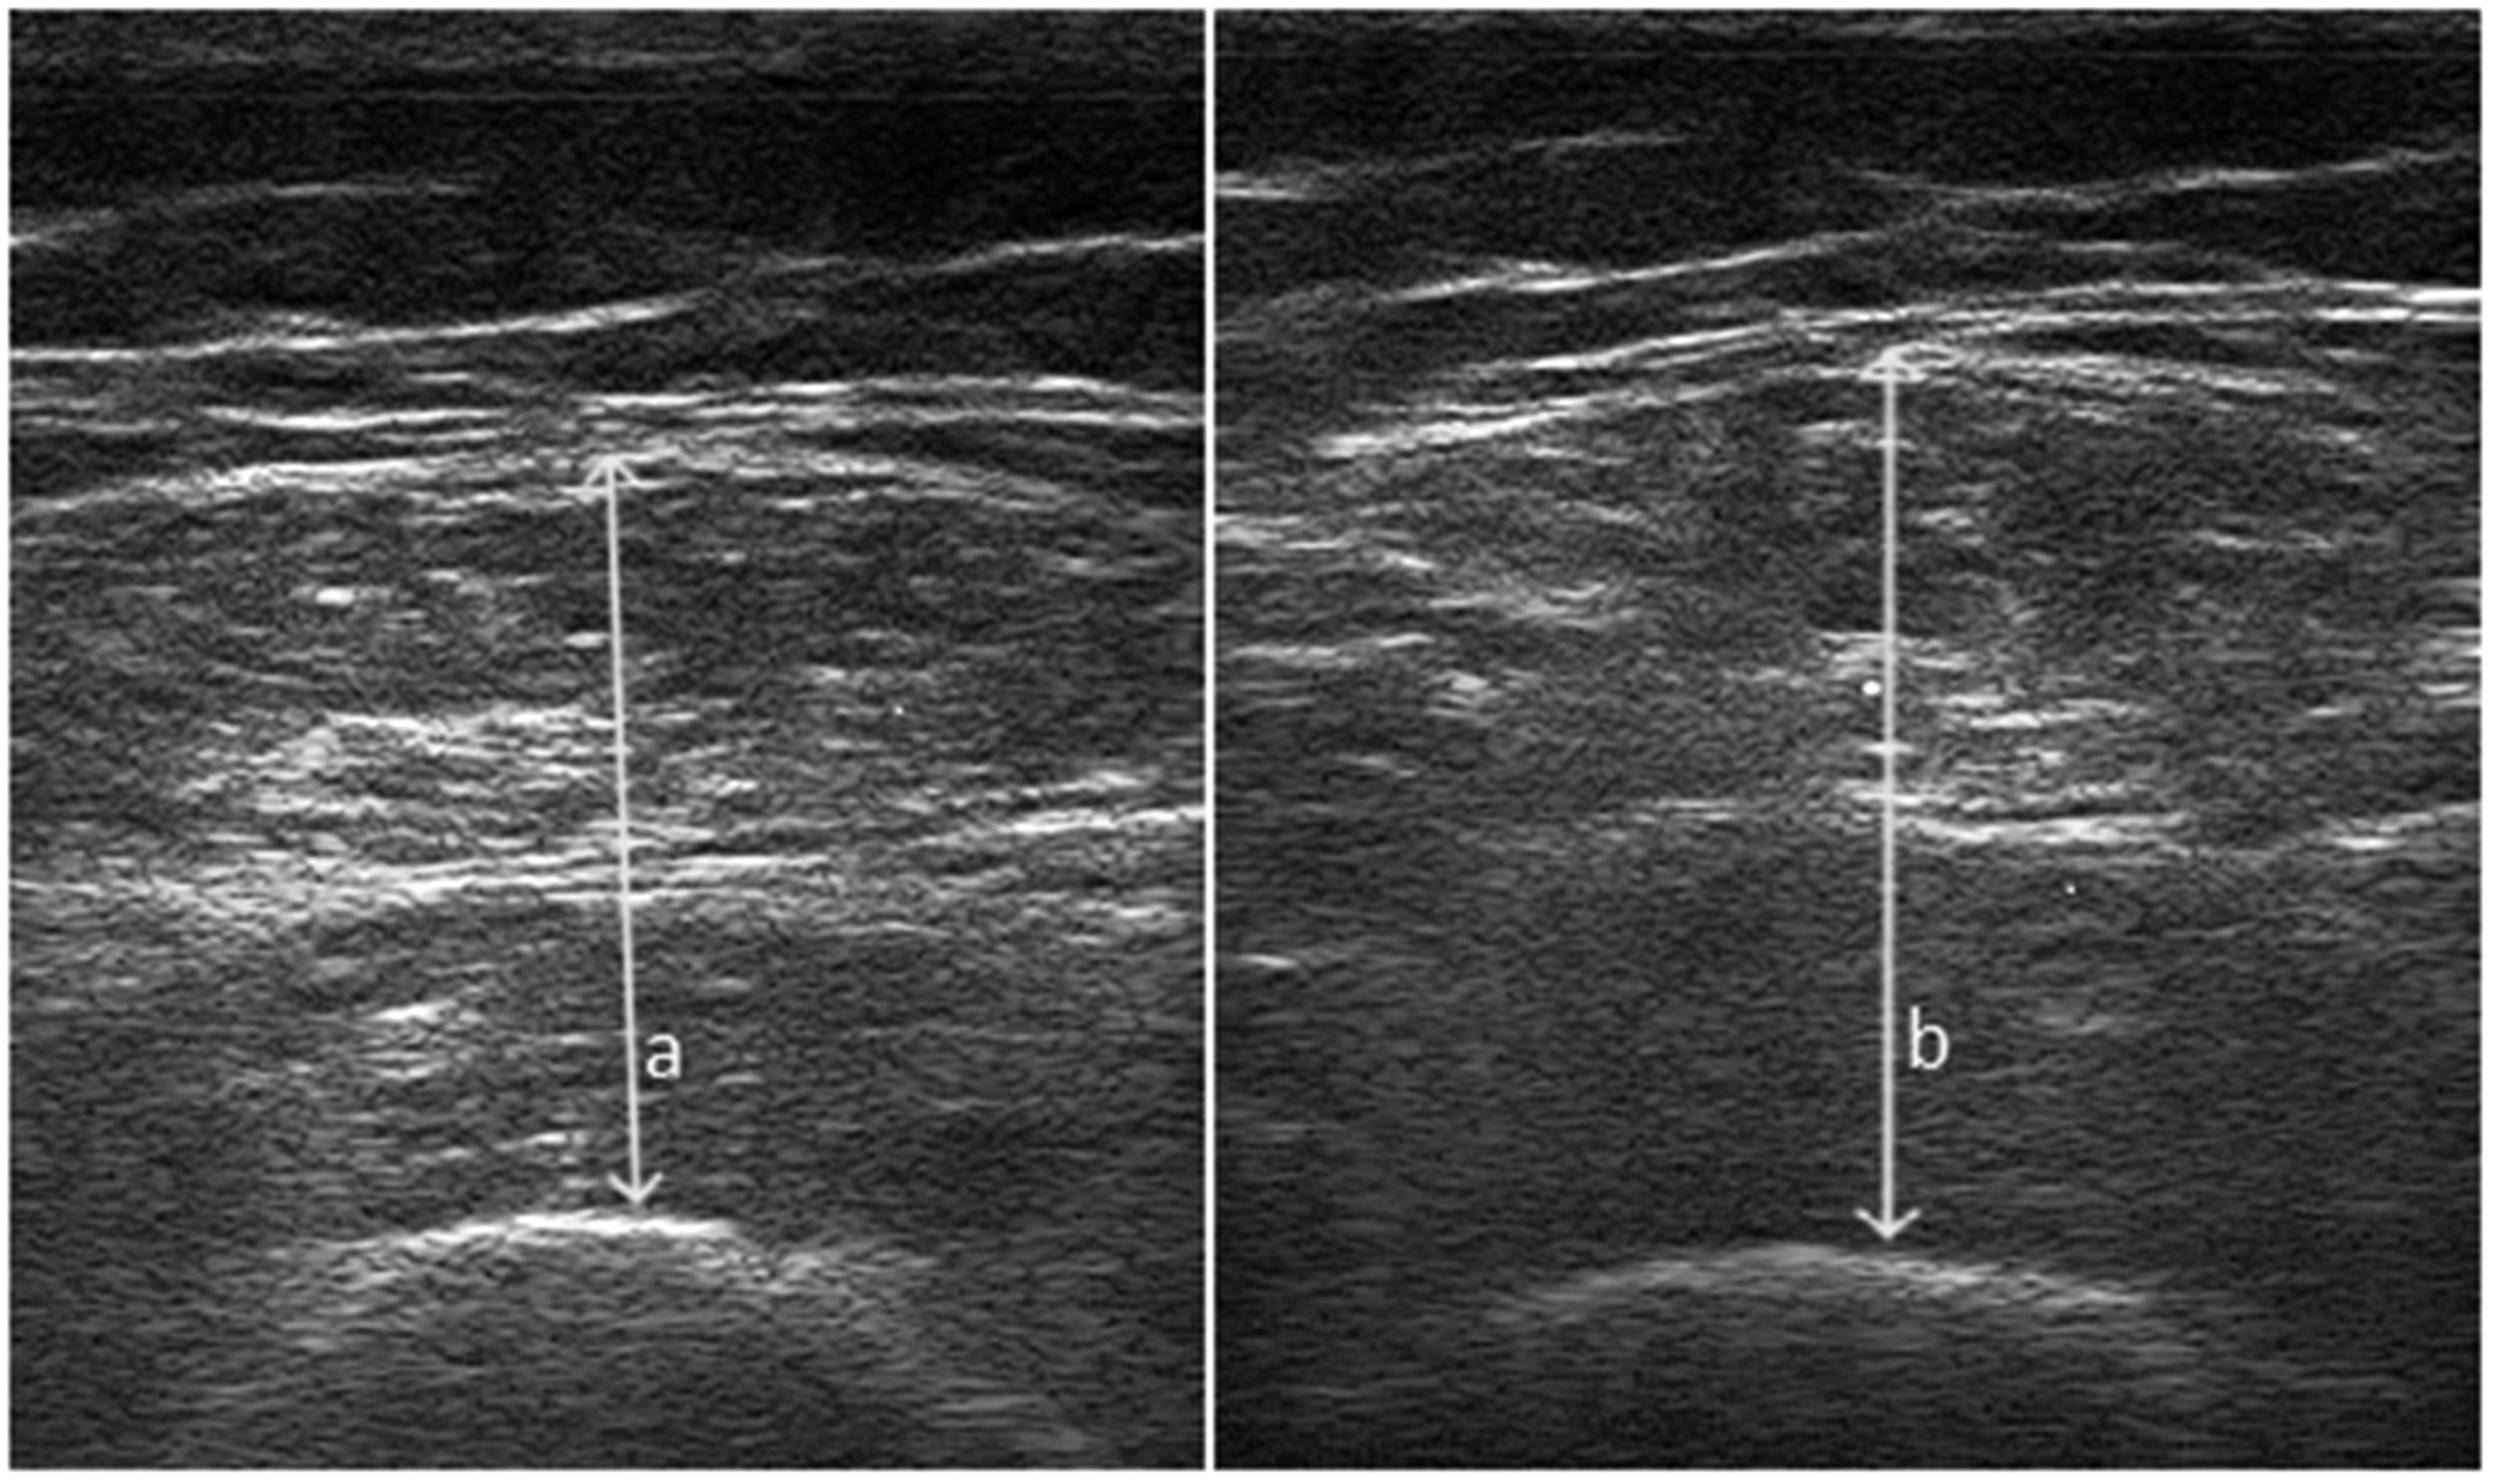
Ultrasound measurement of quadriceps muscle thickness (a: Relaxed, b: Isometrically Contracted).
All ultrasound assessments were performed by a single senior specialist with 13 years of experience in musculoskeletal sonography. The investigator, who holds international certifications in musculoskeletal ultrasound, was blinded to the participants’ clinical data and isokinetic strength results to prevent observer bias.
Measurements were obtained in both relaxed and contracted states at 30° and 60° of right and left knee flexion. Thickness values were reported in millimeters (mm).
All measurements were performed on the right and left knee. A single experienced sonographer performed all assessments and was blinded to muscle strength results.
PT (isometric peak knee-extension torque)
PT was measured isometrically at 30° and 60° of knee flexion using an isokinetic dynamometer (Cybex NORM 6000). In this procedure, patients were seated upright, and their pelvis and distal thigh belts were secured while allowing them to hold onto both sides of the chair with their hands. Subjects underwent isometric muscle strength assessments at 30 and 60 degrees of right and left knee flexion.
Before the formal measurements, participants conducted trial repetitions. A 20-s resting period was given between sets. Consistent verbal encouragement was provided throughout the testing process. The gravity compensation feature of the Cybex NORM system was utilized for all strength assessments. Prior to the measurements, the limb was weighed in a relaxed state at the testing angle, and the software automatically adjusted the torque values to account for the gravitational pull on the limb. This ensured that the recorded peak torque (PT) reflected purely muscular output. PT values were provided in newton-meters (Nm).
HGS: HGS was measured using a Jamar hand dynamometer (Lafayette Instrument, Lafayette, IN, USA) and recorded in kilograms(kg). Two measurements were taken from the dominant hand, and the average was calculated.
ASMM: Bioelectrical impedance analysis (BIA) was evaluated using the Body Composition Analyzer, model BC-418 (Tanita Corp, Tokyo, Japan). ASMM was calculated by summing the right and left arm and leg muscle mass.
Gait Speed: Assessed using the 4-meter walking test. Participants were timed using a stopwatch while walking at a 4-meter distance.
Bias
To minimize bias, the sonographer was blinded for muscle strength measurements and other values. To reduce measurement errors, all measurements were performed by standard protocols and the average of the two measurements was used for muscle thickness.
Study size
A revised power analysis was performed using G*Power 3.1
18
based on an independent two-group design, as recommended. QMT values reported by Barotsis et al.
19
(2.93 ± 0.68 vs. 2.55 ± 0.61) were used to calculate the effect size. The pooled standard deviation yielded an independent-groups Cohen's d of 0.59. For α = 0.05 and power = 0.80, the required total sample size was approximately 84 participants
Quantitative variables
For continuous data, means and standard deviations or median and Q1–Q3 were calculated. Participants were diagnosed with PS according to the relevant diagnostic criteria (i.e., HGS <27 kg for men and HGS <16 kg for women). 3
Statistical methods
Statistical analyses were performed using the SPSS 21 program. All variables were checked for completeness, and missing data patterns were evaluated using descriptive review and dataset integrity checks. No missing data were identified for any variable.
Intra-rater reliability for ultrasound measurements was assessed using the Intra-class Correlation Coefficient (ICC) based on the two sets of measurements taken 15 min apart. The analysis yielded an ICC = 0.846, indicating excellent measurement reliability.
The primary outcome was predefined as the ROC-AUC performance of 60° Cont- QMT in discriminating PS. Analyses involving relaxed measurements, alternative knee angles, and logistic regression models were classified as secondary/exploratory; therefore, no multiplicity correction was applied.
Right–left comparisons are presented in Supplementary Table 1. After evaluating side-to-side differences, the mean of bilateral measurements was used in all analyses to reduce dominance-related variability and obtain a more representative estimate of overall quadriceps morphology and function.
Descriptive Statistics: The demographic and clinical characteristics of the participants were summarized using mean, standard deviation, median, Q1-Q3, and percentiles.
Group Comparisons: The normality assumption was verified using the Shapiro-Wilk and Kolmogorov-Smirnov tests. Independent-sample T-tests were used for normally distributed data for two independent groups’ differences, and Mann-Whitney U tests were used for non-normally distributed data.
Correlation Analysis: The correlations were analyzed using the Pearson or Spearman correlation coefficients for relaxed and contracted QMT es measured at 30° and 60° flexion positions, with PT, age, BMI, HGS, ASMM, and gait speed.
Linear Regression Analysis evaluated the relationship between QMT and age, HGS, and ASMM predictors. The linear regression model assessed how well these independent variables predicted QMT by estimating the coefficients for each predictor and calculating the goodness-of-fit through R2 and F-statistics. The significance of each predictor was tested using t-tests, and confidence intervals for the coefficients were provided to determine the precision of the estimates.
Logistic regression analyses were performed to determine whether relaxed or contracted QMT could independently predict PS while adjusting for age, sex and PT. Potential mediators of muscle strength such as physical activity and comorbidities were not included to avoid overadjustment bias in the relationship between QMT and strength. Model adequacy was evaluated using the Events Per Variable (EPV) criterion. With 42 events in the PS group and four independent variables age sex QMT and PT the EPV was calculated as 10.5 which is above the commonly recommended minimum threshold of 10 for logistic regression 20 indicating sufficient sample size. The enter method was used for variable entry. Before modeling key statistical assumptions including linearity of continuous predictors with the logit absence of multicollinearity checked by variance inflation factor and absence of influential outliers checked by Cook's distance were evaluated and satisfied. Effect estimates are presented with 95% confidence intervals.
ROC (Receiver Operating Characteristic) analysis: ROC analysis was conducted to assess the predictive value of the relaxed or contracted QMT for PS.
Ethics statement
This study protocol was reviewed and approved by the ethics committee of A….. University, Faculty of Medicine (KAEJ-671,09.11.2022). It was conducted according to the ethical standards of the 2000 Declaration of Helsinki. Written informed consent was obtained after all participants were informed of the study.
This study adheres to STROBE guidelines and includes all required items accordingly (Supplementary Checklist).
Results
Participants and descriptive data
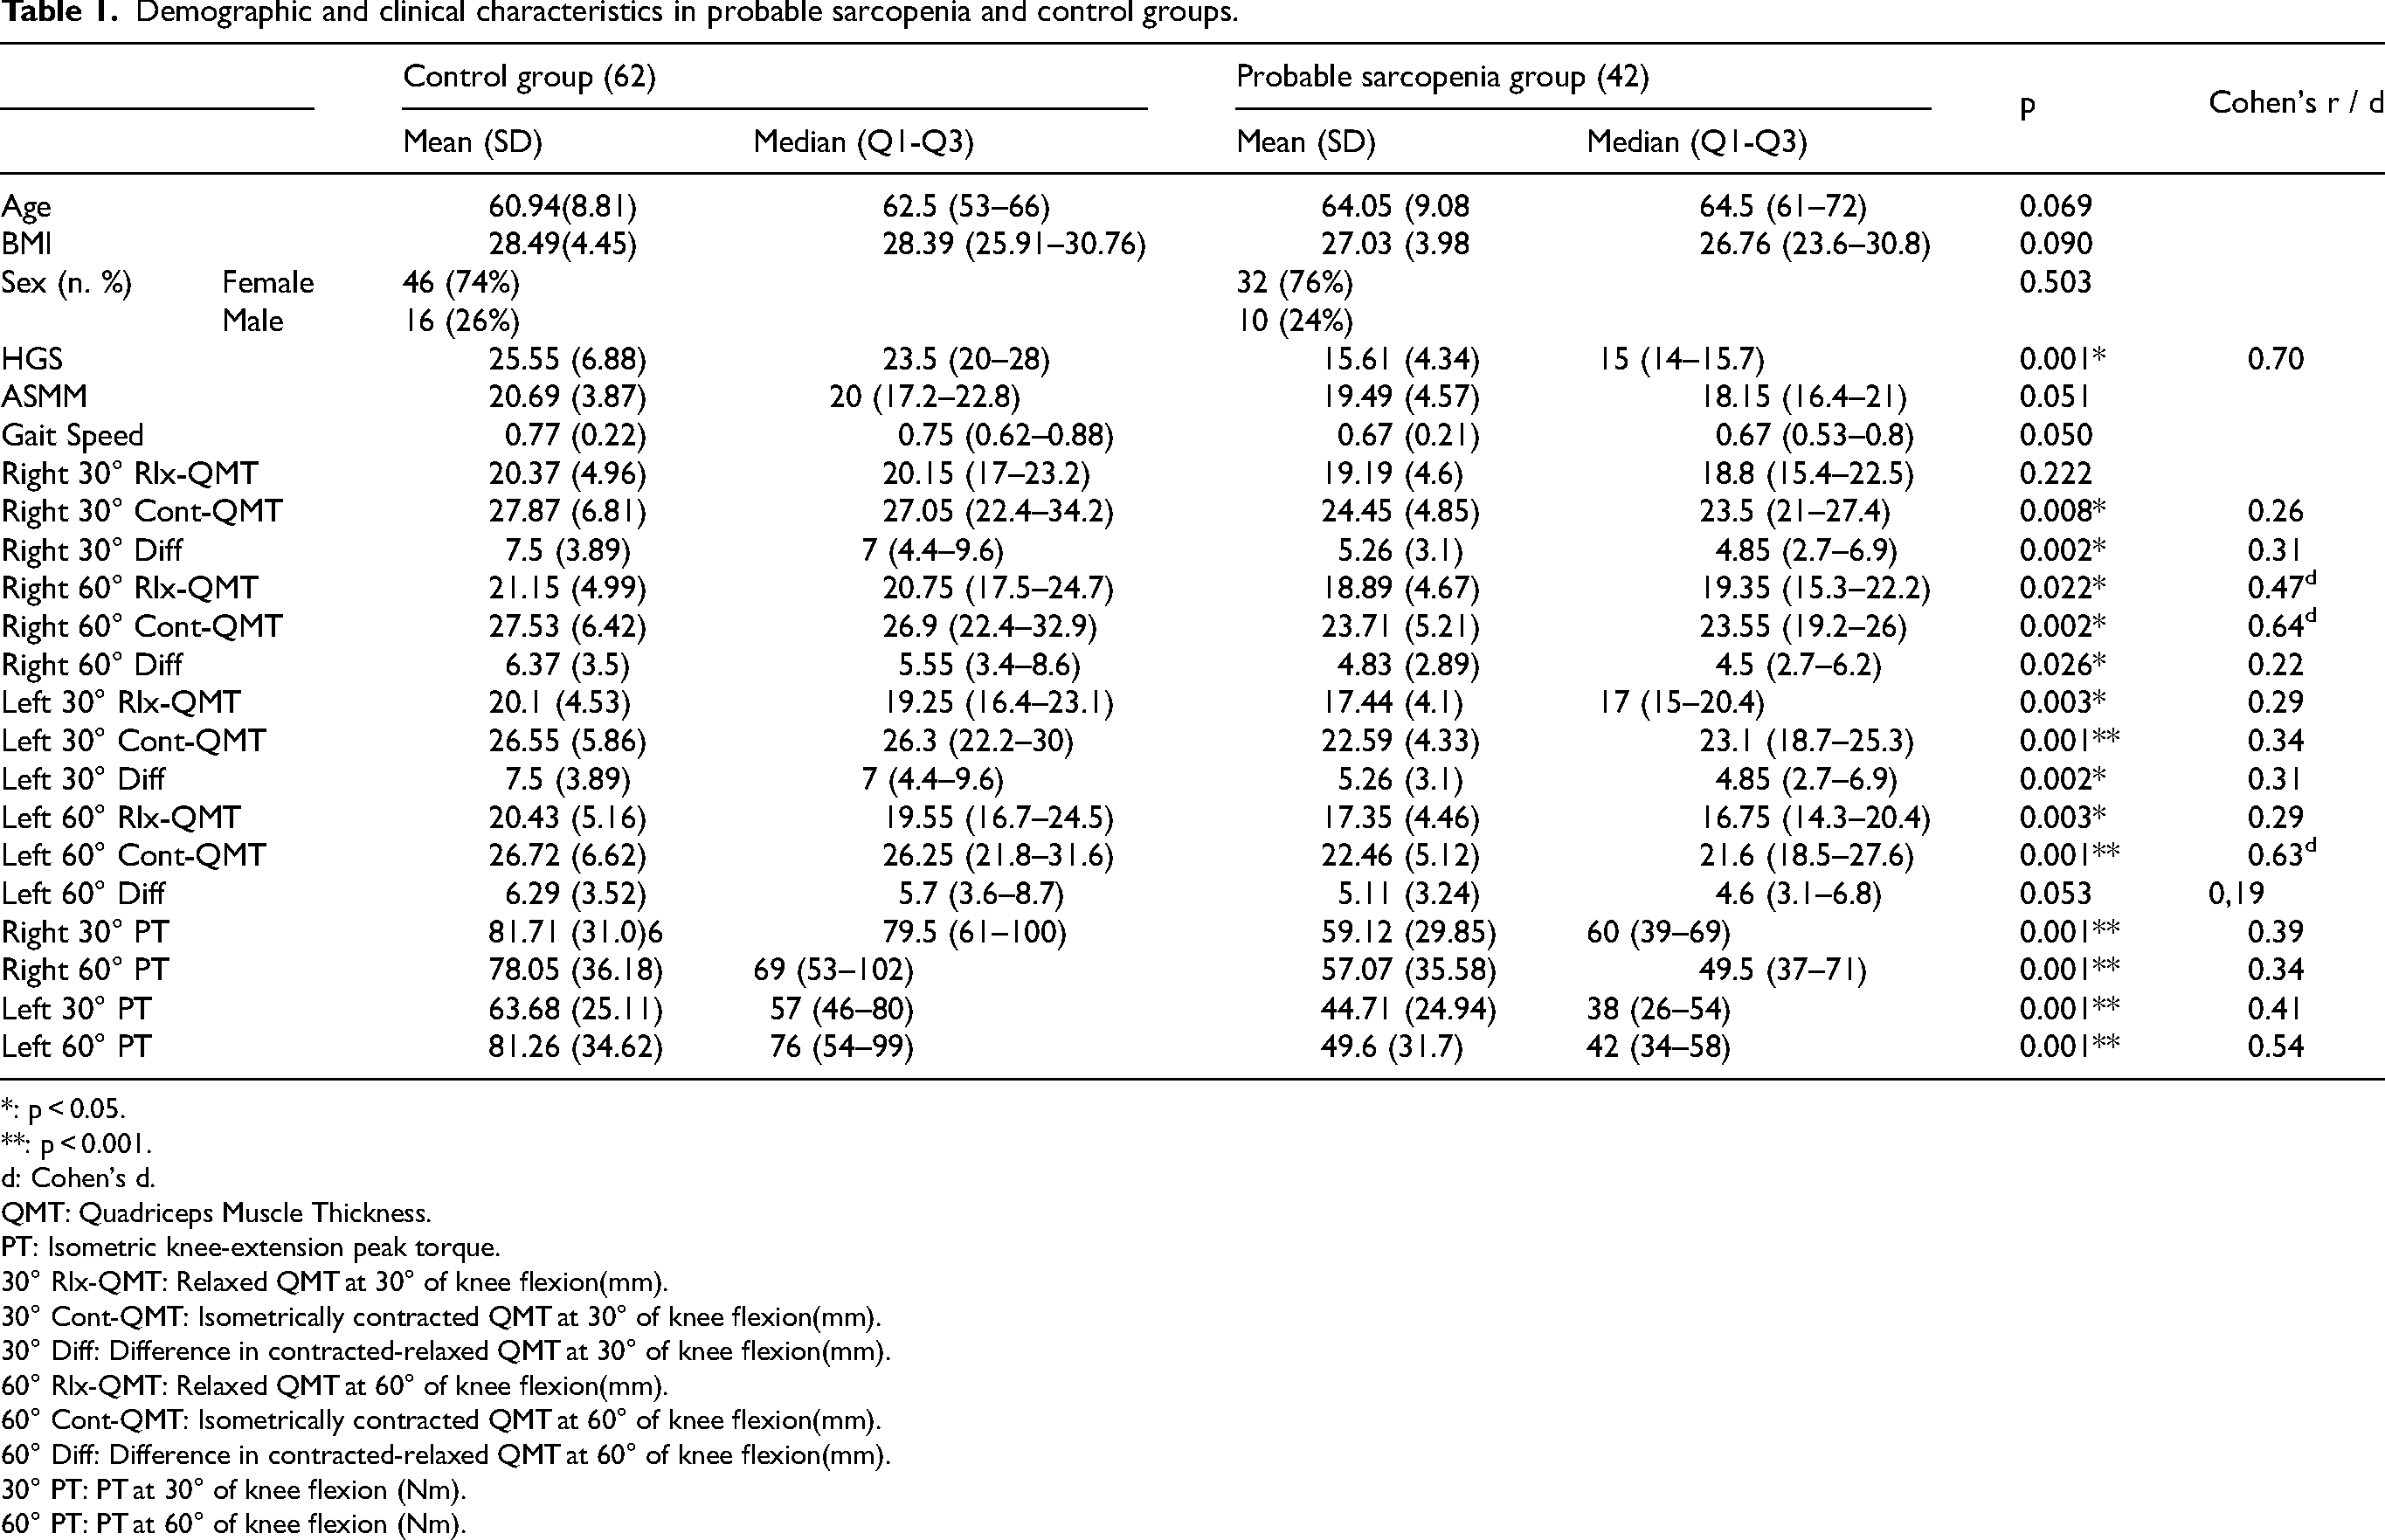
A total of 104 participants (42 with PS and 62 controls) were included in the final analysis. Data completeness was verified on a per-variable basis, and no missing data were identified. The groups were similar regarding age, sex, and BMI (all p ≥ 0.05). Detailed demographic and clinical characteristics are provided in Table 1.
Demographic and clinical characteristics in probable sarcopenia and control groups.
*: p < 0.05.
**: p < 0.001.
: Cohen's d.
QMT: Quadriceps Muscle Thickness.
PT: Isometric knee-extension peak torque.
30° Rlx-QMT: Relaxed QMT at 30° of knee flexion(mm).
30° Cont-QMT: Isometrically contracted QMT at 30° of knee flexion(mm).
30° Diff: Difference in contracted-relaxed QMT at 30° of knee flexion(mm).
60° Rlx-QMT: Relaxed QMT at 60° of knee flexion(mm).
60° Cont-QMT: Isometrically contracted QMT at 60° of knee flexion(mm).
60° Diff: Difference in contracted-relaxed QMT at 60° of knee flexion(mm).
30° PT: PT at 30° of knee flexion (Nm).
60° PT: PT at 60° of knee flexion (Nm).
Reliability
The reliability and absolute agreement between the two measurement sets (30° Rlx- QMT) were evaluated using the ICC based on a two-way mixed effects model with absolute agreement definition. The analysis yielded a single measures ICC coefficient of 0.846 with a 95% confidence interval ranging from 0.774 to 0.895, F(103, 103) = 12.726, p < .001). These values indicate an excellent level of reliability and consistency between the measurements. Furthermore, the Standard Error of Measurement (SEM) was calculated as 1.58, and the Minimal Detectable Change (MDC) at the 95% confidence level was determined to be 4.38, confirming the high precision and stability of the data.
Group differences
Individuals with PS had significantly lower QMT and PT compared with controls (all p < 0.01; Cohen's r = 0.22–0.54) (Table 1).
In the ≥60-year subgroup, PS participants showed significantly lower HGS, gait speed, most QMT measures (especially contracted values), and PT. These findings were consistent with the primary analysis, confirming that age-related heterogeneity did not affect the main study outcomes (Supplementary Table 2).
Correlations
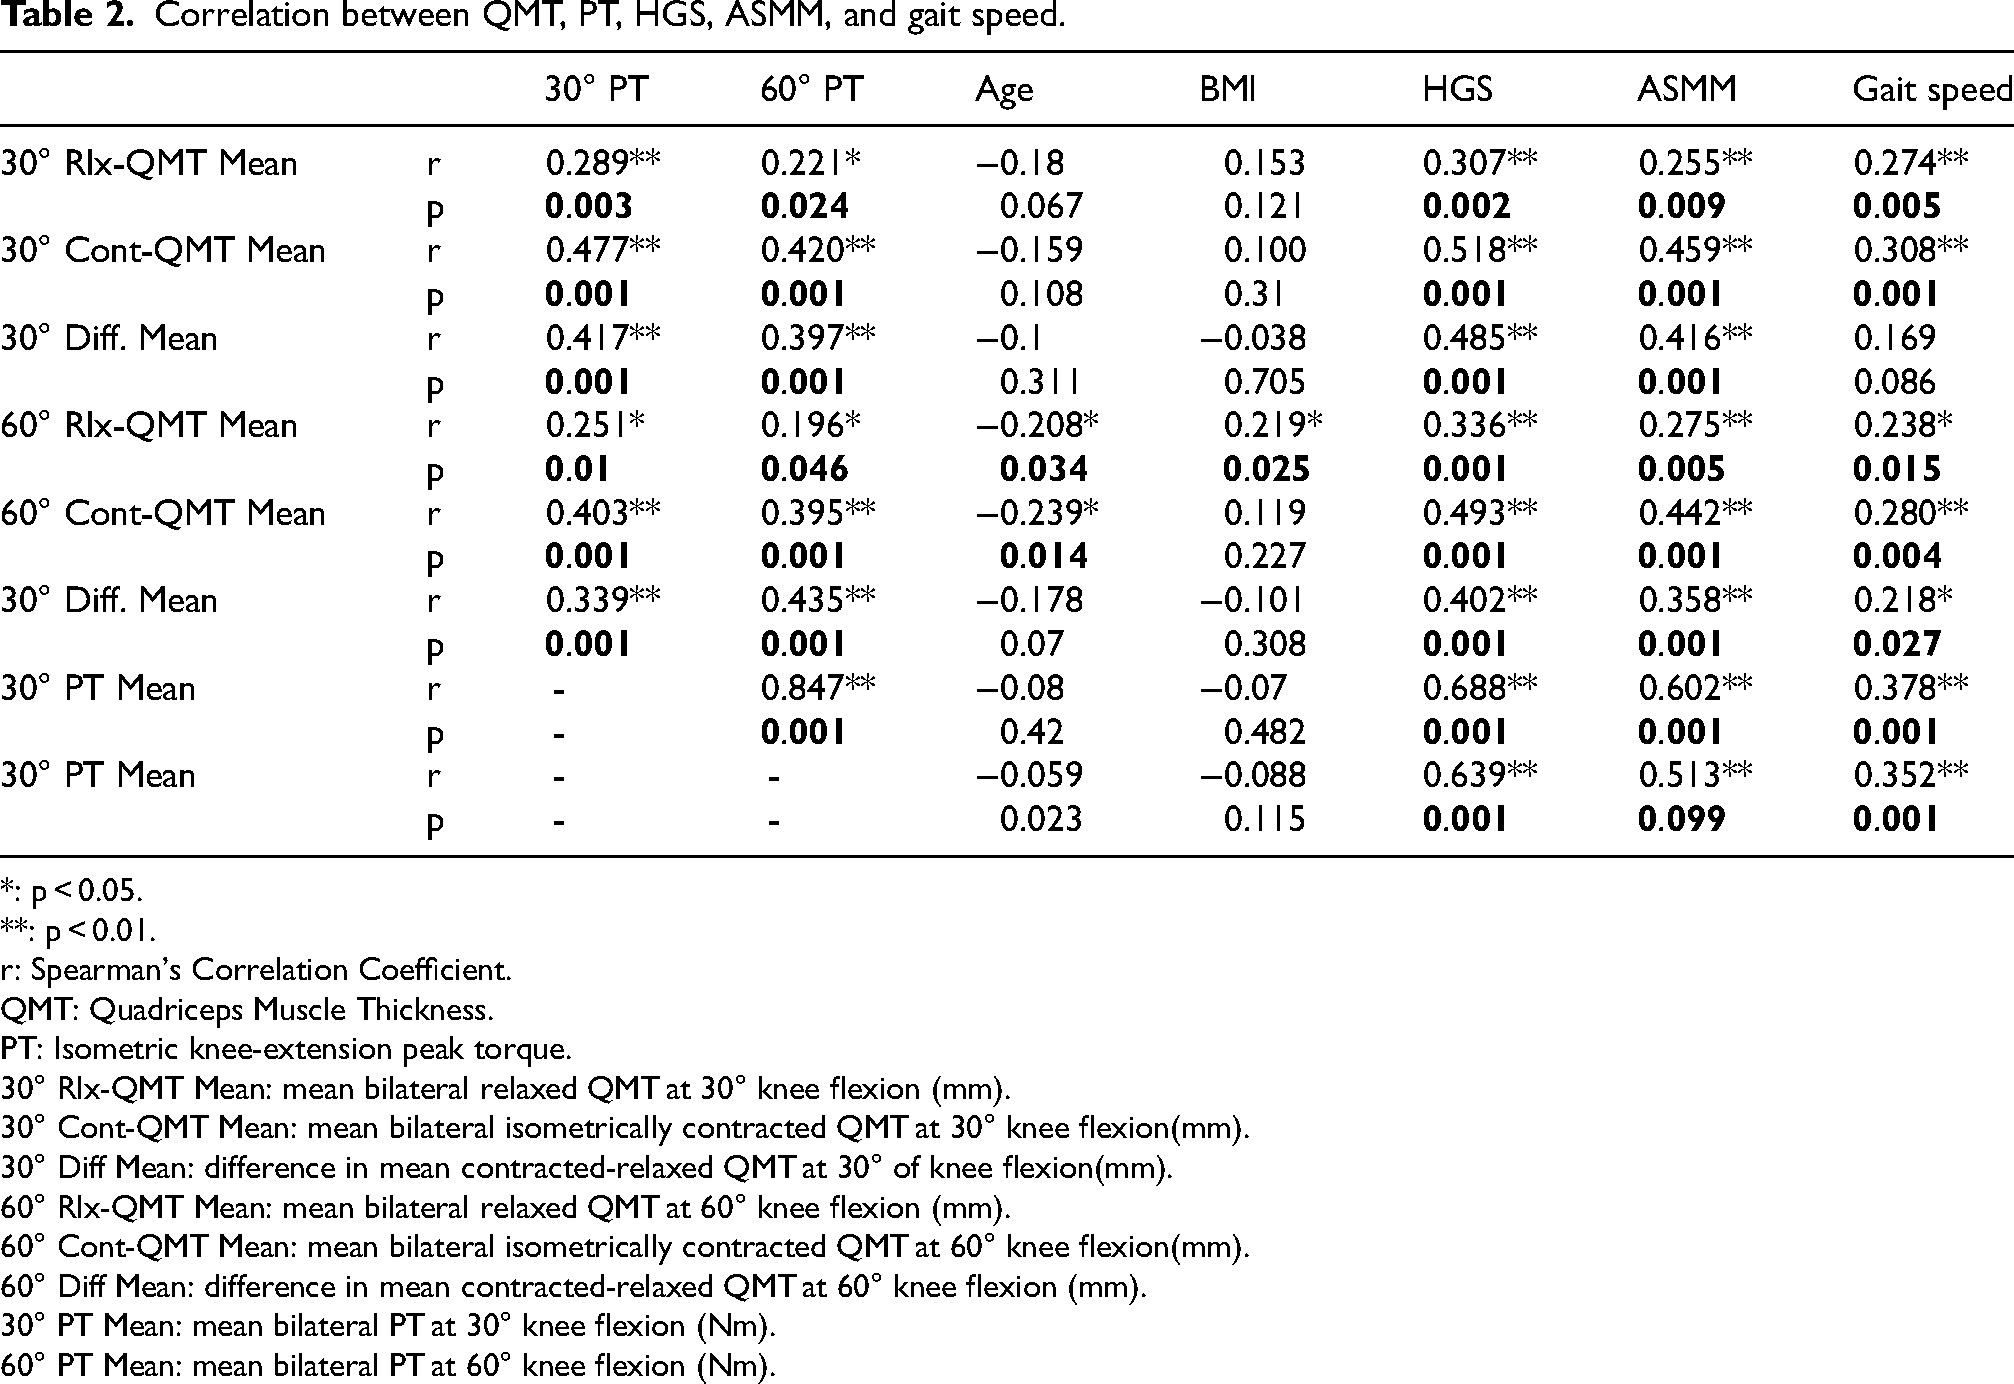
Both relaxed and contracted QMT were positively correlated with PT, HGS, ASMM, and gait speed (p < 0.05). However, contracted measurements demonstrated stronger associations (moderate-to-strong) compared with relaxed measurements (weak-to-moderate) (Table 2).
Correlation between QMT, PT, HGS, ASMM, and gait speed.
*: p < 0.05.
**: p < 0.01.
r: Spearman's Correlation Coefficient.
QMT: Quadriceps Muscle Thickness.
PT: Isometric knee-extension peak torque.
30° Rlx-QMT Mean: mean bilateral relaxed QMT at 30° knee flexion (mm).
30° Cont-QMT Mean: mean bilateral isometrically contracted QMT at 30° knee flexion(mm).
30° Diff Mean: difference in mean contracted-relaxed QMT at 30° of knee flexion(mm).
60° Rlx-QMT Mean: mean bilateral relaxed QMT at 60° knee flexion (mm).
60° Cont-QMT Mean: mean bilateral isometrically contracted QMT at 60° knee flexion(mm).
60° Diff Mean: difference in mean contracted-relaxed QMT at 60° knee flexion (mm).
30° PT Mean: mean bilateral PT at 30° knee flexion (Nm).
60° PT Mean: mean bilateral PT at 60° knee flexion (Nm).
Main results
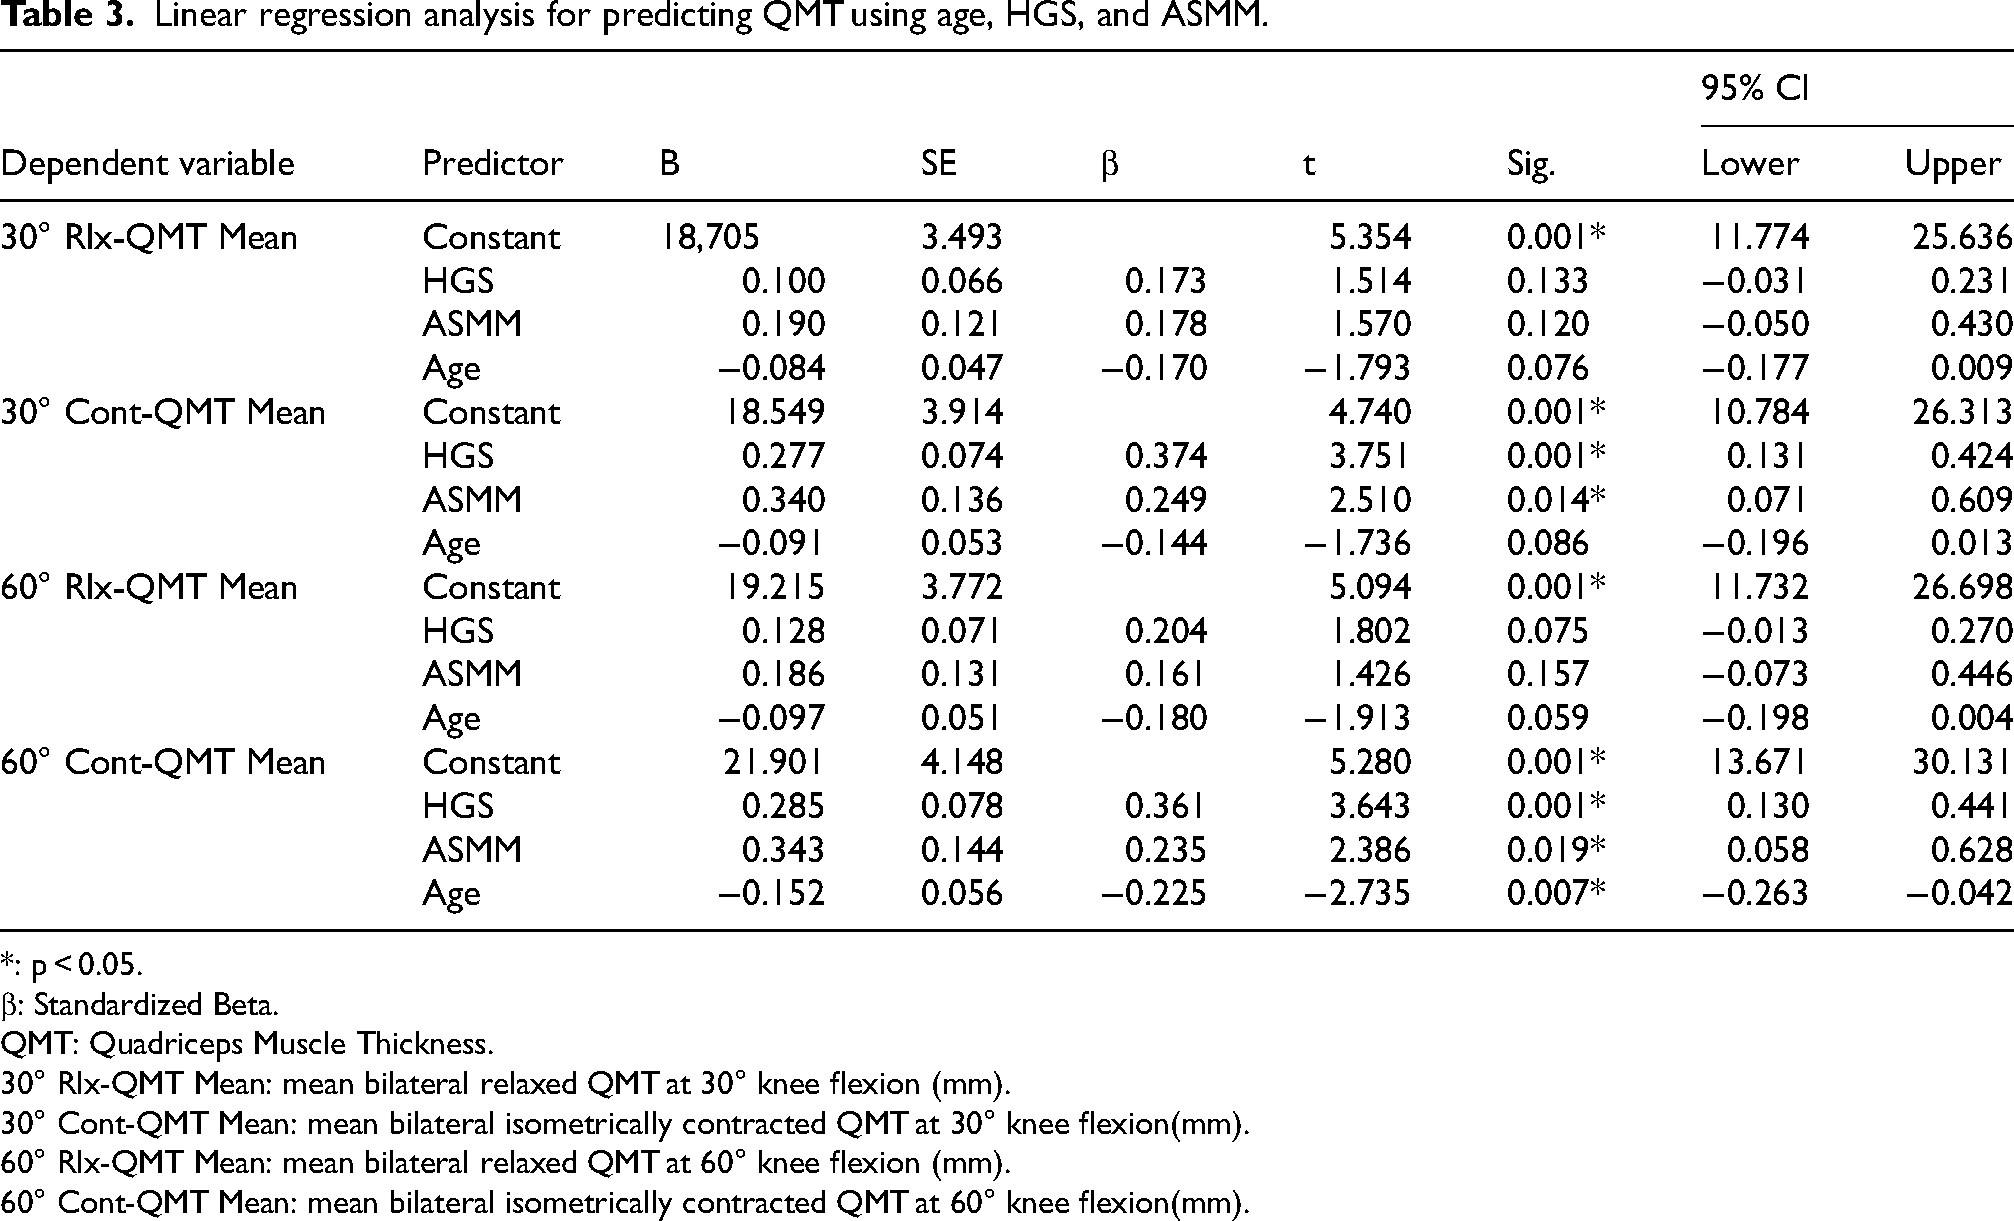
Linear regression analysis
Model predicting 30° Rlx- QMT: The model was significant (F(3100) = 4.895, p = 0.003; R2 = 0.128, Adjusted R2 = 0.102; VIF = 1.03–1.50), but age, HGS, and ASMM were not significant predictors.
Model predicting 30° Cont- QMT: The model was significant (F(3100) = 16.735, p < 0.001; R2 = 0.334, Adjusted R2 = 0.314; VIF = 1.03–1.50), and HGS and ASMM were significant predictors.
Model predicting 60° Rlx- QMT: The model was significant (F(3100) = 5.483, p = 0.002; R2 = 0.141, Adjusted R2 = 0.115; VIF = 1.03–1.50), but none of the predictors were significant.
Model predicting 60° Cont- QMT: The model was significant (F(3100) = 17.384, p < 0.001; R2 = 0.343, Adjusted R2 = 0.323; VIF = 1.03–1.50), and age, HGS, and ASMM were significant predictors.
Contracted QMT showed stronger associations with strength-related parameters than relaxed measurements (Table 3).
Linear regression analysis for predicting QMT using age, HGS, and ASMM.
*: p < 0.05.
β: Standardized Beta.
QMT: Quadriceps Muscle Thickness.
30° Rlx-QMT Mean: mean bilateral relaxed QMT at 30° knee flexion (mm).
30° Cont-QMT Mean: mean bilateral isometrically contracted QMT at 30° knee flexion(mm).
60° Rlx-QMT Mean: mean bilateral relaxed QMT at 60° knee flexion (mm).
60° Cont-QMT Mean: mean bilateral isometrically contracted QMT at 60° knee flexion(mm).
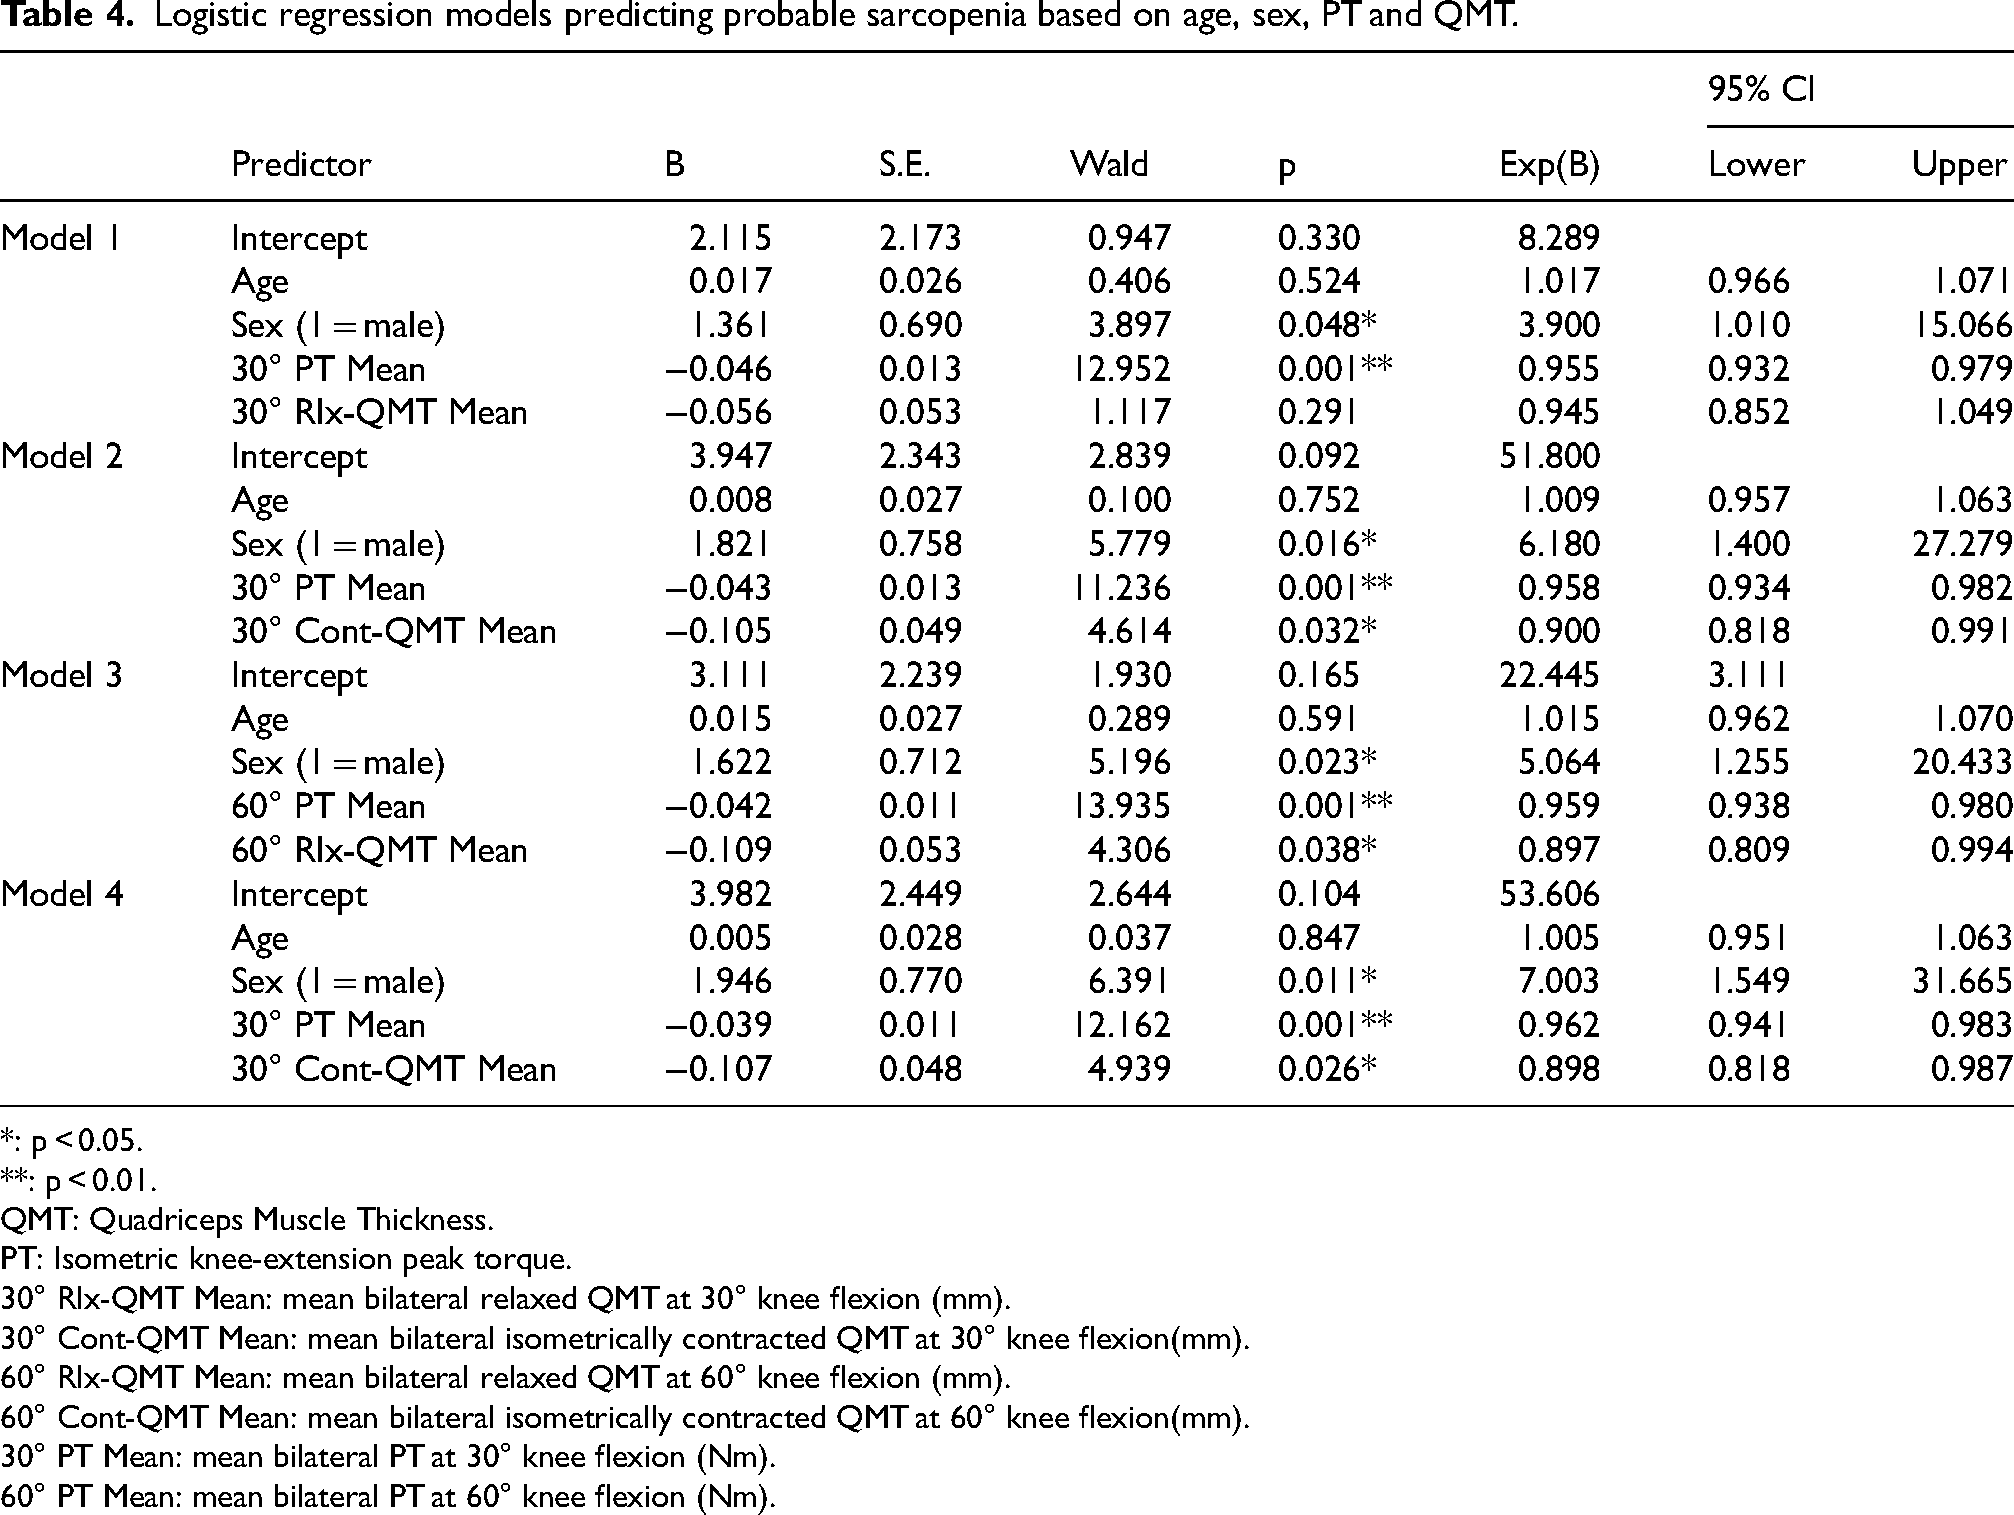
Logistic regression analysis
Model 1 (30° Rlx- QMT) was significant χ2(4) = 23.806, p < 0.001; Cox & Snell R2 = 0.205, Nagelkerke R2 = 0.276, AIC = 126, −2LL = 116.498, VIF = 1.07–1.56.
Model 2 (30° Cont- QMT) was significant χ2(4) = 27.716, p < 0.001; Cox & Snell R2 = 0.234, Nagelkerke R2 = 0.316, AIC = 123, −2LL = 112.588, VIF = 1.11–1.82.
Model 3 (60° Rlx- QMT) was significant χ2(4) = 28.865, p < 0.001; Cox & Snell R2 = 0.242, Nagelkerke R2 = 0.327, AIC = 121, −2LL = 111.439, VIF = 1.05–1.62.
Model 4 (60° Cont- QMT) was significant χ2(4) = 29.719, p < 0.001; Cox & Snell R2 = 0.249, Nagelkerke R2 = 0.336, AIC = 121, −2LL = 110.586, VIF = 1.20–1.83 (Table 4).
Logistic regression models predicting probable sarcopenia based on age, sex, PT and QMT.
*: p < 0.05.
**: p < 0.01.
QMT: Quadriceps Muscle Thickness.
PT: Isometric knee-extension peak torque.
30° Rlx-QMT Mean: mean bilateral relaxed QMT at 30° knee flexion (mm).
30° Cont-QMT Mean: mean bilateral isometrically contracted QMT at 30° knee flexion(mm).
60° Rlx-QMT Mean: mean bilateral relaxed QMT at 60° knee flexion (mm).
60° Cont-QMT Mean: mean bilateral isometrically contracted QMT at 60° knee flexion(mm).
30° PT Mean: mean bilateral PT at 30° knee flexion (Nm).
60° PT Mean: mean bilateral PT at 60° knee flexion (Nm).
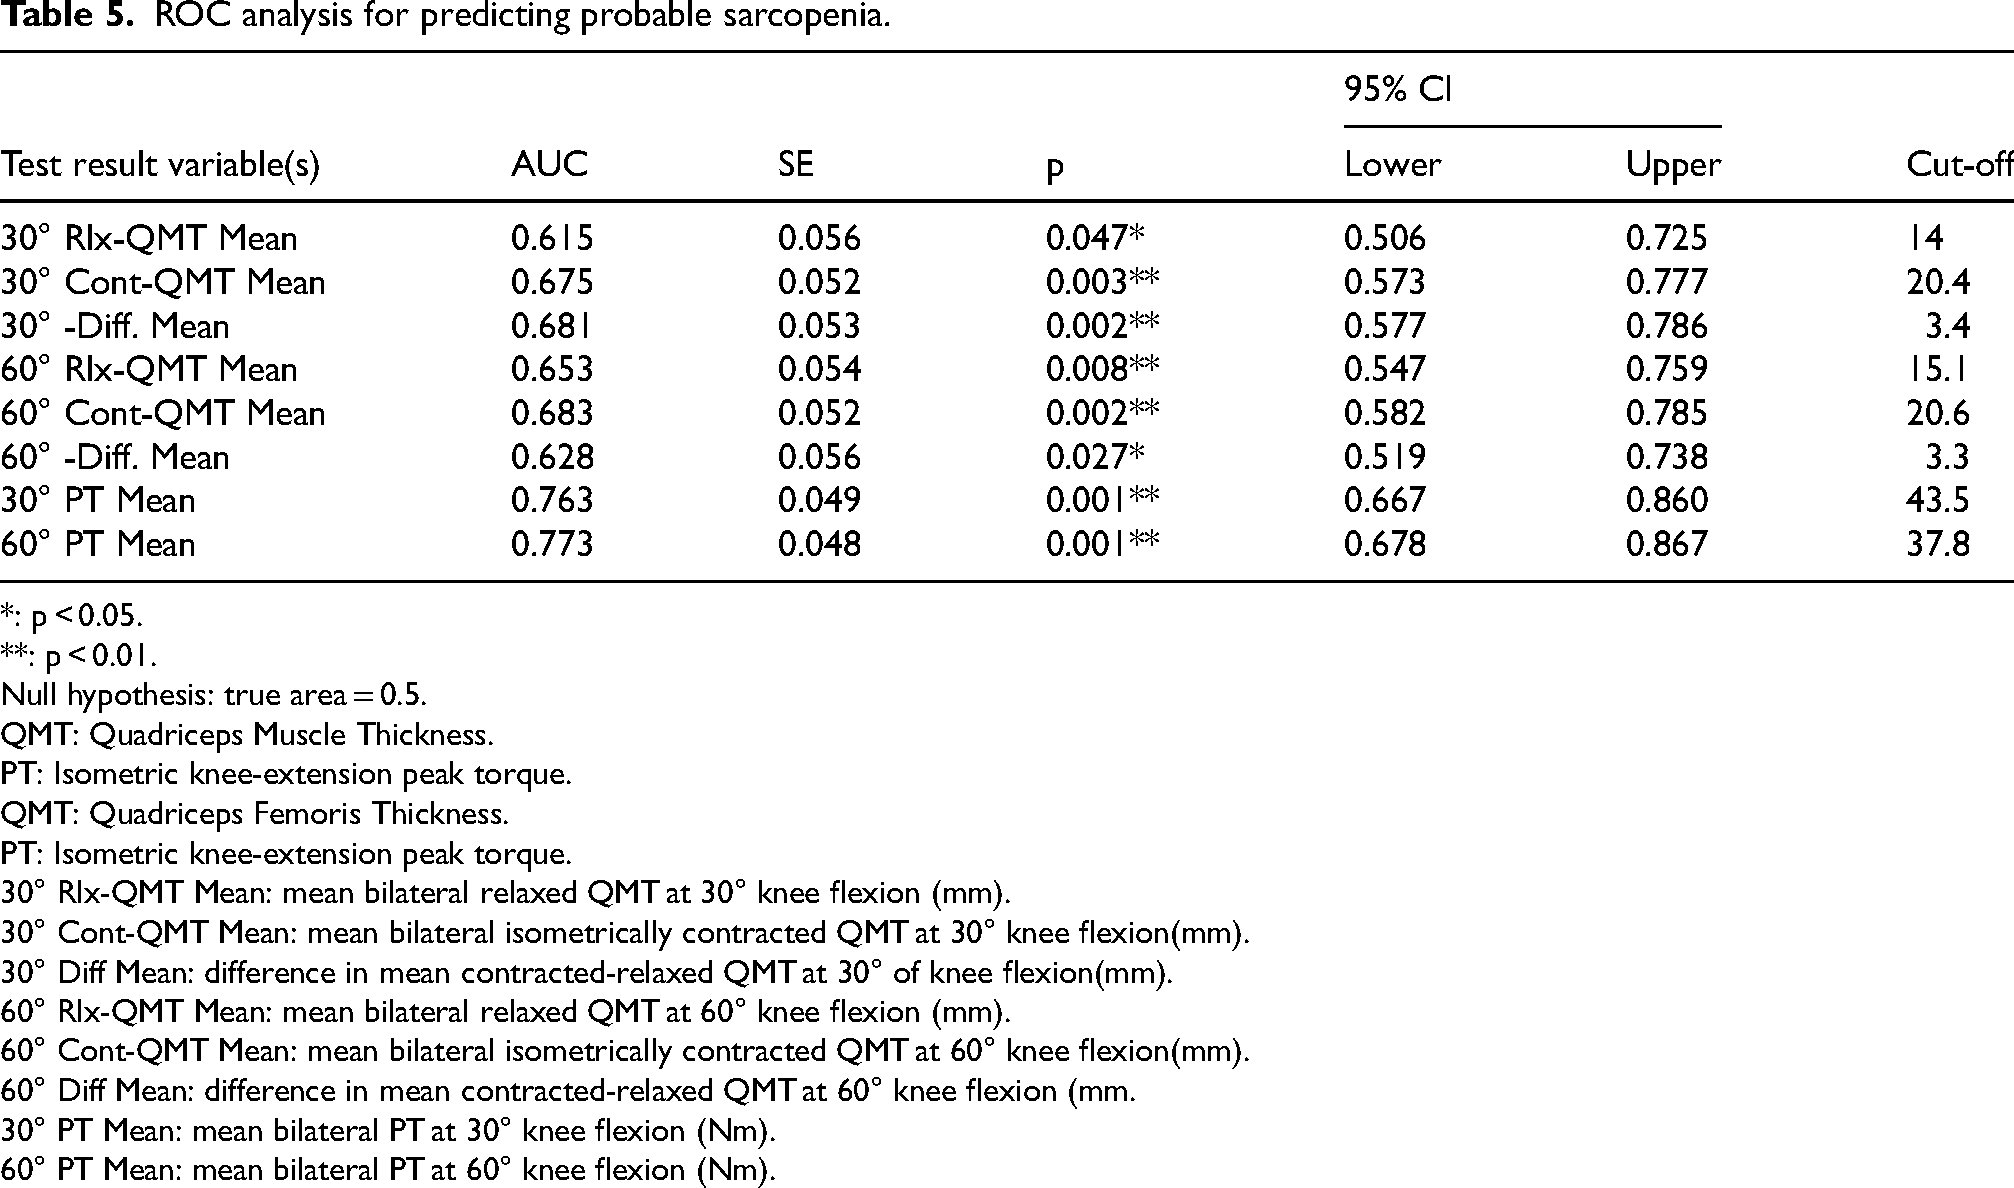
ROC analyses demonstrated that contracted QMT provided higher discriminatory performance for identifying PS compared with relaxed measurements, with AUC values ranging from 0.615 to 0.773 (all p < 0.05) (Figure 3, Table 5). Sensitivity analyses in participants aged ≥60 years yielded similar results, with contracted measurements maintaining stronger discrimination (AUC 0.662–0.696), indicating that age heterogeneity did not alter the overall findings (Supplementary Table 3).
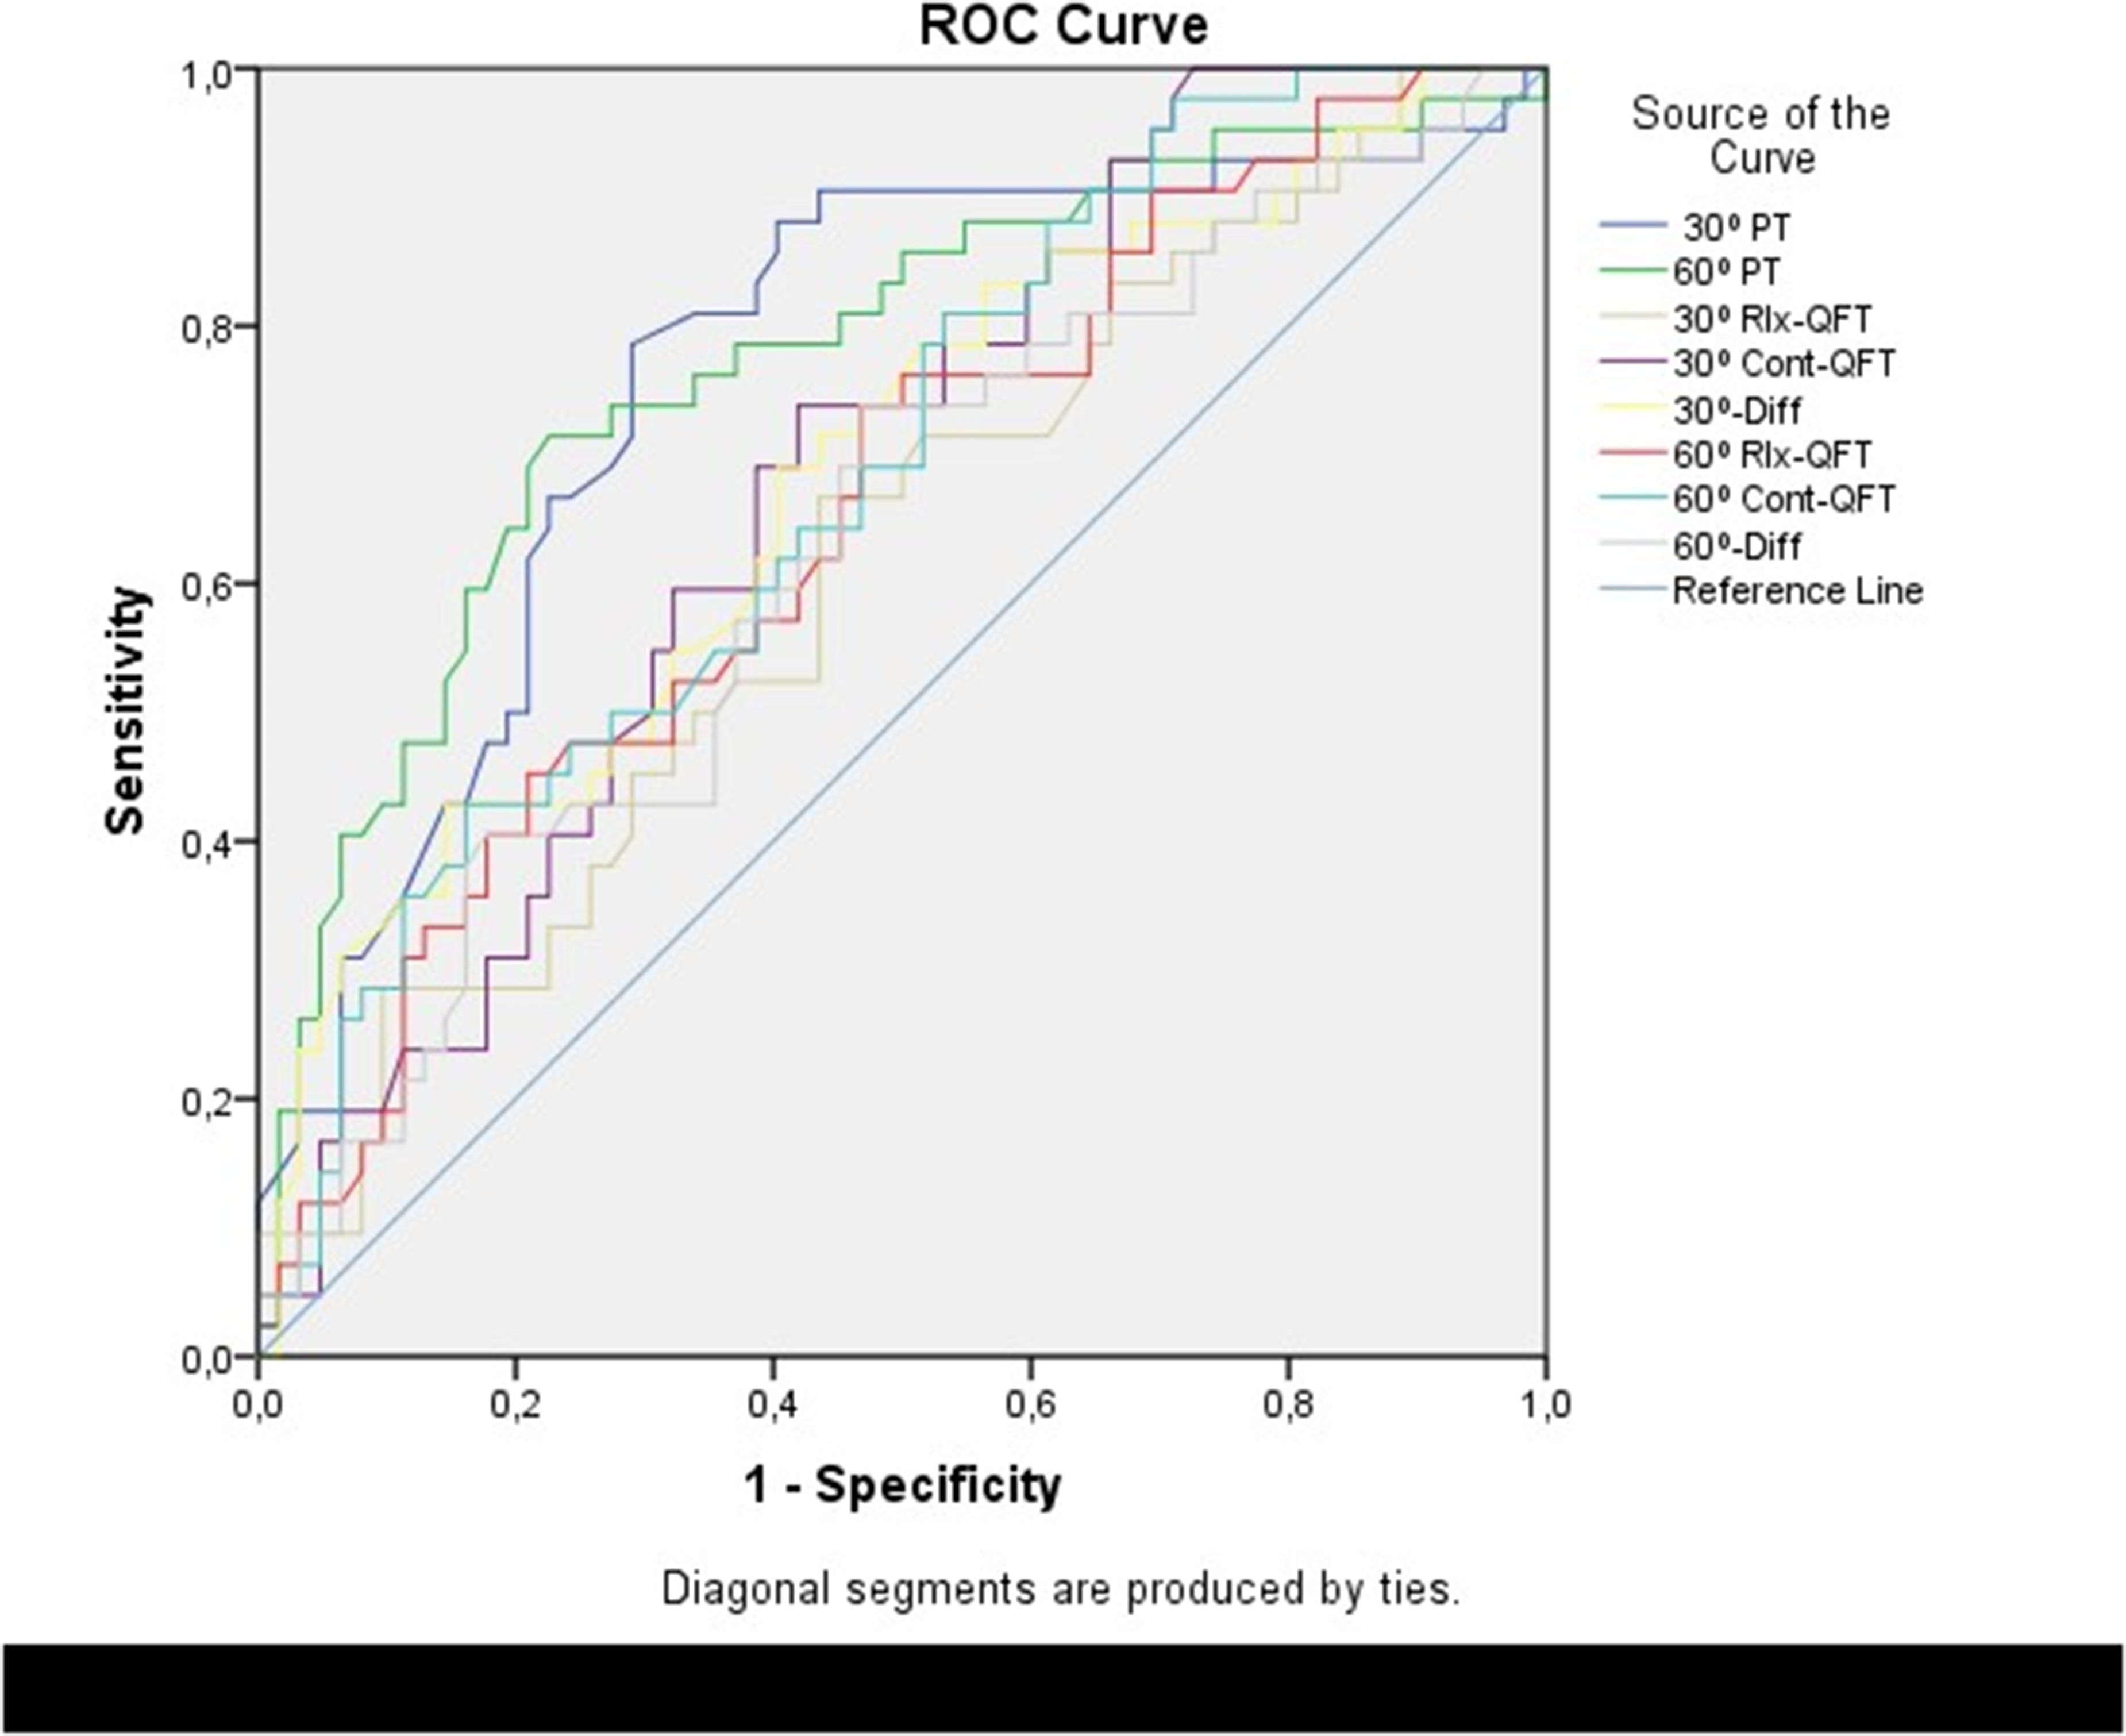
A ROC analysis of the QMT and PT for probable sarcopenia. Note: The label QFT (Quadriceps Femoris Thickness) in the image is synonymous with QMT (Quadriceps Muscle Thickness) used throughout the text. PT: Isometric knee-extension peak torque.
ROC analysis for predicting probable sarcopenia.
*: p < 0.05.
**: p < 0.01.
Null hypothesis: true area = 0.5.
QMT: Quadriceps Muscle Thickness.
PT: Isometric knee-extension peak torque.
QMT: Quadriceps Femoris Thickness.
PT: Isometric knee-extension peak torque.
30° Rlx-QMT Mean: mean bilateral relaxed QMT at 30° knee flexion (mm).
30° Cont-QMT Mean: mean bilateral isometrically contracted QMT at 30° knee flexion(mm).
30° Diff Mean: difference in mean contracted-relaxed QMT at 30° of knee flexion(mm).
60° Rlx-QMT Mean: mean bilateral relaxed QMT at 60° knee flexion (mm).
60° Cont-QMT Mean: mean bilateral isometrically contracted QMT at 60° knee flexion(mm).
60° Diff Mean: difference in mean contracted-relaxed QMT at 60° knee flexion (mm.
30° PT Mean: mean bilateral PT at 30° knee flexion (Nm).
60° PT Mean: mean bilateral PT at 60° knee flexion (Nm).
DeLong comparisons revealed no statistically significant differences between relaxed and contracted measurements (all p > 0.05), and this pattern remained consistent in sex-stratified analyses, where AUC values did not differ between males and females (all p > 0.05).
Although these AUC values indicate moderate diagnostic accuracy, contracted QMT still demonstrated clinically meaningful discrimination and may serve as a practical complementary screening tool alongside muscle strength assessments.
Discussion
This study aimed to evaluate the usefulness of QMT in the early identification of PS, and the findings demonstrated that contracted QMT was clearly superior to relaxed measurements in reflecting both muscle strength and muscle mass. Although QMT was reduced in individuals with PS under both conditions, only contracted QMT independently predicted PS after adjusting for age, sex, and PT, making it a promising ultrasound parameter with potential exploratory value for discriminating PS. Furthermore, contracted QMT showed stronger associations with HGS, ASMM, and gait speed, indicating that it is a more sensitive indicator of clinically meaningful and early functional impairment compared with resting morphology alone.
HGS is widely used in PS assessment because it is practical and directly measuring lower limb muscle strength is challenging. However, aging affects lower limb strength more prominently and this is a major determinant of mobility and functional independence in older adults.5–8 Yet, HGS may not fully reflect lower limb muscle strength. 5 Therefore, practical and reliable methods that directly assess lower limb muscle function, such as QMT evaluations using ultrasound, are critically important for the early detection of PS. In this context, assessing the QMT may provide complementary insights into PS screening. The findings of early ultrasound studies investigating the relationship between QMT, muscle strength, and muscle mass further support this approach.
Most previous studies have evaluated resting QMT as an indicator of muscle mass.12–15,21,22 However, resting morphology alone may not sufficiently reflect the early functional deterioration observed in PS. During contraction, muscle thickness increases substantially due to active recruitment of contractile fibers and changes in pennation angle, 16 suggesting that contracted measurements may better represent muscle strength. Indeed, the limited number of studies comparing relaxed and contracted measurements has shown that contracted muscle thickness is more strongly associated with strength than relaxed thickness.16,17,23,24
Consistent with the literature, our study found that relaxed QMT showed only weak associations with PT, HGS, and ASMM, whereas contracted QMT demonstrated moderate-to-strong correlations with all muscle function indicators. Moreover, PT and ASMM were significant predictors only for contracted QMT. These findings indicate that contracted measurements may better capture neuromuscular activation capacity, pennation angle changes, and contractile tissue engagement that underlie muscle function.16,17 This pattern also aligns with the concept of mass–strength decoupling in aging adults, where declines in muscle strength can occur earlier and more prominently than loss of muscle mass due to qualitative changes in muscle architecture, infiltration, and activation.25–29 Therefore, contracted QMT may serve as an early and indirect marker of muscle-quality impairment before measurable muscle mass loss occurs. Taken together, these findings support that contraction-based ultrasound assessments may provide more exploratory insight into early functional decline in PS than resting morphology alone.
Some echogenicity studies have reported that Quadriceps muscle echogenicity may better reflect muscle strength than muscle mass, showing a moderate negative association with muscle thickness and strength, while demonstrating no significant correlation with muscle mass.30–32
This study has several limitations. First, due to the cross-sectional design, the observed associations between QMT and PT cannot be interpreted as causal. Second, factors that may influence muscle health, such as physical activity levels, nutritional status, and existing comorbidities, were not assessed using standardized tools (e.g., International Physical Activity Questionnaire) or included as separate covariates in the statistical models. However, this was a deliberate methodological choice to maintain statistical power and avoid overfitting/multicollinearity, considering the EPV constraints of our sample size. We prioritized muscle ultrasound as a practical ‘clinical marker’ reflecting the net physical outcome of these cumulative processes. Nevertheless, residual confounding by these unmeasured or unadjusted factors is possible and could have either attenuated or exaggerated the observed associations between QMT and strength. Third, muscle-quality indicators, including echogenicity and elastography, could not be assessed due to equipment constraints. Finally, the wide age range of the sample (35–80 years) may limit the generalisability of our findings to very old adults and could attenuate or obscure age-related differences in muscle strength and thickness. Additionally, as the sample was predominantly female, the results may be more representative of community-dwelling women, and generalizability to older men or institutionalized populations may be limited.
Future studies should incorporate standardized physical activity measures, muscle quality parameters, and reproducibility analyses and ideally employ longitudinal designs to better elucidate the diagnostic value of contraction-based US measures in the early detection of PS.
This study demonstrated that both relaxed and contracted QMT were reduced in individuals with PS; however, contracted QMT showed stronger associations with PT and ASMM compared with relaxed measurements, and it was the only QMT parameter that independently predicted PS in adjusted models. These findings suggest that contraction-based ultrasound assessments may better capture functional muscle properties, such as neuromuscular activation and architectural changes, which are not sufficiently reflected by resting morphology alone. Given the moderate AUC values, contracted QMT should be considered a preliminary and exploratory adjunct in early PS screening. Standardized contraction protocols and longitudinal studies incorporating advanced muscle-quality measures (e.g., elastography, echogenicity) are needed to confirm and extend these preliminary results.
Supplemental Material
sj-doc-1-bmr-10.1177_10538127261444798 - Supplemental material for Contracted and relaxed quadriceps muscle thickness: A marker for muscle strength and probable sarcopenia?
Supplemental material, sj-doc-1-bmr-10.1177_10538127261444798 for Contracted and relaxed quadriceps muscle thickness: A marker for muscle strength and probable sarcopenia? by Serpil Demir, Özlem Karataş, Burak Elçin and Nilüfer Balcı in Journal of Back and Musculoskeletal Rehabilitation
Supplemental Material
sj-docx-2-bmr-10.1177_10538127261444798 - Supplemental material for Contracted and relaxed quadriceps muscle thickness: A marker for muscle strength and probable sarcopenia?
Supplemental material, sj-docx-2-bmr-10.1177_10538127261444798 for Contracted and relaxed quadriceps muscle thickness: A marker for muscle strength and probable sarcopenia? by Serpil Demir, Özlem Karataş, Burak Elçin and Nilüfer Balcı in Journal of Back and Musculoskeletal Rehabilitation
Supplemental Material
sj-docx-3-bmr-10.1177_10538127261444798 - Supplemental material for Contracted and relaxed quadriceps muscle thickness: A marker for muscle strength and probable sarcopenia?
Supplemental material, sj-docx-3-bmr-10.1177_10538127261444798 for Contracted and relaxed quadriceps muscle thickness: A marker for muscle strength and probable sarcopenia? by Serpil Demir, Özlem Karataş, Burak Elçin and Nilüfer Balcı in Journal of Back and Musculoskeletal Rehabilitation
Supplemental Material
sj-docx-4-bmr-10.1177_10538127261444798 - Supplemental material for Contracted and relaxed quadriceps muscle thickness: A marker for muscle strength and probable sarcopenia?
Supplemental material, sj-docx-4-bmr-10.1177_10538127261444798 for Contracted and relaxed quadriceps muscle thickness: A marker for muscle strength and probable sarcopenia? by Serpil Demir, Özlem Karataş, Burak Elçin and Nilüfer Balcı in Journal of Back and Musculoskeletal Rehabilitation
Footnotes
Acknowledgments
The authors thank the expert evaluators who participated in the scoring process.
Ethics approval and consent to participate
This study protocol was reviewed and approved by the ethics committee of A……University Faculty of Medicine (KAEJ-671,09.11.2022). It was conducted according to the ethical standards of the 2000 Declaration of Helsinki. After all participants were informed of the study, written informed consent was obtained.
Consent for publication
Not applicable. This manuscript does not include identifiable data from human participants.
Author contributions
Funding
The authors received no financial support for the research, authorship, and/or publication of this article.
Declaration of conflicting interests
The authors declared no potential conflicts of interest with respect to the research, authorship, and/or publication of this article.
Availability of data and materials
The datasets are available from the corresponding author upon reasonable request.
Supplemental material
Supplemental material for this article is available online.
References
Supplementary Material
Please find the following supplemental material available below.
For Open Access articles published under a Creative Commons License, all supplemental material carries the same license as the article it is associated with.
For non-Open Access articles published, all supplemental material carries a non-exclusive license, and permission requests for re-use of supplemental material or any part of supplemental material shall be sent directly to the copyright owner as specified in the copyright notice associated with the article.