
Abstract
Context
Hospice is a core component of end-of-life care in the United States, designed to provide comprehensive support for patients and their families. While utilization has expanded, concerns remain about whether growth has translated into equitable access. Geographic, socioeconomic, and organizational factors, such as ownership and quality, may shape the availability and type of hospice care patients receive.
Objectives
To examine geographic and sociodemographic disparities in access to hospice providers across Pennsylvania, a geographically and demographically diverse state.
Methods
This study used 2023 Centers for Medicare & Medicaid Services (CMS) Provider of Services data to identify hospices by ownership type and quality rating. Provider addresses were geocoded, and 60-minute drive-time catchments were generated. Census tract-level hospice access was assessed using the Getis-Ord Gi* statistic to identify cold spots, defined as clusters of tracts with significantly lower access relative to statewide patterns. Tract-level sociodemographic characteristics were drawn from the 2023 American Community Survey, and mean differences were evaluated using two-sample t-tests.
Results
In total, 2.3 million Pennsylvanians, or 17% of the state population, reside in census tracts classified as cold spots. Cold spots were concentrated in rural and socioeconomically disadvantaged regions. Compared with other tracts, cold spot tracts were lower income, less educated, older, more reliant on public insurance, and less racially diverse. Patterns were consistent when restricting to high quality hospice and nonprofit hospices.
Conclusion
Geographic disparities in hospice access compound existing sociodemographic inequities. Addressing these inequities will require efforts to expand high-quality hospice availability in underserved communities.
Keywords
Introduction
Hospice care, first introduced in the United States in the late 1960s, is designed to provide patient-centered care for individuals nearing the end-of-life. 1 Since the creation of the Medicare Hospice Benefit in 1983, hospice utilization has grown steadily, increasing from 21% of Medicare decedents in 2000 to more than 50% by 2019. 2 Hospice utilization has been linked to improvements in patient and caregiver experiences, reductions in burdensome interventions, and lower rates of hospital utilization at the end of life.3-6 Despite overall growth in utilization, access and quality of hospice care remains uneven. Disparities in access have been documented across sociodemographic lines, including race, ethnicity, income, insurance status, and geographic location. 7 Research highlights inequities in access across patient populations and by ownership structures.7-9 Ownership status is also associated with differences in care quality, with for-profit hospices more often associated with lower caregiver-reported quality and higher rates of live disenrollment.10-14
In light of concerns about variation in hospice quality, policymakers have sought to expand transparency through public reporting initiatives. To inform decision-making, the Centers for Medicare & Medicaid Services (CMS) launched the Care Compare website, which reports Consumer Assessment of Healthcare Providers and Systems (CAHPS) Hospice Survey Star Ratings. These ratings provide a standardized summary of family caregivers’ experiences across multiple domains of care. 15 Public reporting of these measures, first introduced in 2022, allows patients and families to directly compare hospice providers.16,17 These ratings are currently the most widely available standardized indicator of hospice quality and are intended to support patient choice.
Transparency initiatives aim to support patient choice, but access is ultimately constrained by the distribution of providers. Even when quality data are available, patients cannot act on them if geographic barriers remain. Carlson et al. (2010) found that although 88% of the population lives within 30 minutes of a hospice, certain states have up to 48% of their population with more than a 30-minute distance away. 18 Subsequent studies confirm that rural residents face reduced availability and longer travel times compared to urban populations.18-20 Rural communities also have fewer hospice providers per capita and more limited staffing capacity, constraining both the availability and quality of services.21-23 Collectively, this literature demonstrates that geographic and sociodemographic disadvantages restrict hospice availability and raise concerns about whether patients and families can realistically exercise choice at the end of life.
Although prior research has shown that hospice access varies by geography, ownership, and quality, little is known about how these factors intersect within local markets. Existing research has not integrated spatial analysis with ownership and quality data to identify where patient access is most constrained. Nor has prior work mapped how these access patterns correspond to underlying community characteristics. Addressing this gap is essential for understanding where structural barriers most severely limit patient access and for designing policies that target these inequities.
Building on the current body of evidence, the present study examines hospice access across Pennsylvania, a state with a diverse mix of large urban centers, mid-sized towns, and rural communities. Using current CMS provider and quality data, we identify regions where patients lack access to (1) any hospice provider, (2) a nonprofit provider, or (3) a high-quality provider as measured by CAHPS star ratings. Through geospatial analysis, we identify statistically significant cold spots—clusters of Census Tracts with limited access relative to statewide patterns—and then link these clusters to sociodemographic characteristics from the American Community Survey. This approach allows us to examine not only where hospice providers are located, but also how disparities in provider ownership and quality intersect with geographic and population-level disadvantages. By highlighting areas where patient choice is most constrained, our study aims to inform future efforts to promote equitable hospice provision.
Methods
We conducted a cross-sectional geospatial analysis to characterize geographic variation in hospice access and describe the sociodemographic composition of communities with differing levels of access across Pennsylvania. We combined administrative data on hospice providers with census tract–level sociodemographic characteristics and spatial accessibility measures. We then applied spatial statistics to identify clusters of limited access and compared the characteristics of tracts inside and outside these clusters.
Data
We identified hospice locations and ownership types using the CMS Provider of Services (POS) files. We obtained hospice provider addresses and ownership type (for-profit, not-for-profit) from the Q4 2023 POS files, restricting records to those with active hospice provider category codes and removing closed facilities. We categorized hospice providers by ownership type and quality rating. We obtained quality ratings from the CMS Care Compare CAHPS Star Ratings, with providers receiving a rating of 4 or higher classified as “high quality.”
To assess sociodemographic characteristics, we used tract-level data from the U.S. Census Bureau’s American Community Survey (ACS) 2023 5-year estimate, including household income, age, racial and ethnic composition, and educational attainment. 24 We used the U.S. Department of Agriculture’s Rural–Urban Commuting Area (RUCA) codes to assign census tract-level rurality. We categorized tracts as urban (codes 1-3), large town (codes 4-6), or rural (codes 7-10). 25
Geocoding Hospice
We geocoded provider addresses using the Bing Maps Geocoding API using the scripts developed in R Statistical Package v4.3.1. We then calculated drive-time catchment areas around each hospice provider using the HERE Isoline API, accessed via the hereR package. We defined a catchment area as all census tracts that can be reached from a provider’s location within a specified travel time, based on the underlying road network. We performed all drive-time calculations in 2024, using average weekday traffic at 10 a.m. We generated polygons whose perimeters represent equal travel times (isolines) from each hospice provider’s location. In this context, an isoline defines the boundary of the 60-minute drive time, and the area within the boundary constitutes the catchment area. We selected the 60-minute threshold to align with prior literature used to measure geographic access to hospice care.18,21
Geospatial Methodology
To identify geographic clusters of limited hospice access, we employed the Getis-Ord Gi* statistic, which assesses local spatial autocorrelation by identifying statistically significant “hot” and “cold” spots across the state (ie, clusters of high and low access). 26 We computed Gi* scores for 60-minute drive-time catchments to hospice providers, using a spatial weights matrix based on Queen’s contiguity. Under Queen’s contiguity, we considered census tracts neighbors if they shared either a common border or a single point (ie, including diagonals, similar to a chess queen’s movement). We assessed statistical significance at the 95% confidence level. We focused on identifying significant cold spots, representing geographic clusters of census tracts with limited geographic availability to hospice services.
The Gi* statistic produces z-scores, which quantify the magnitude and statistical significance of hot or cold clustering. We defined areas with significant negative z-scores as cold spots, which indicate a statistically significant lack of nearby hospice providers within the specified drive-time threshold relative to the expected hospice access in the sample. Cold spots reflect a geographic cluster of census tracts where the presence of hospice providers within a 60- minute drive is significantly lower than would be expected by chance, relative to the distribution of hospices across Pennsylvania. This approach identifies regions with relatively low hospice presence. However, this measure does not capture absolute tract-level access.
We then quantified the extent of access gaps by calculating the proportion of Pennsylvania census tracts and the share of the state’s population residing within cold spots. We conducted separate Gi* analyses for overall hospice access, for access limited to not-for-profit providers, and for access limited to high-quality providers (defined as those with a CAHPS star rating of 4 or higher). Finally, we compared sociodemographic characteristics of tracts inside vs outside cold spots using descriptive statistics. All analyses were conducted in R (v4.3.1).
Sociodemographic Disparities Methods
To evaluate sociodemographic disparities in hospice access, we compared the characteristics of census tracts located in cold spots of limited access to those outside of these clusters. We conducted separate comparisons for cold spots defined by lack of access to (1) any hospice provider, (2) a nonprofit hospice, and (3) a high-quality hospice (defined as ≥ 4 stars on the CAHPS Hospice Survey). We obtained tract-level sociodemographic indicators from the 2023 American Community Survey (ACS) 5-year estimates. We used two sample t-tests to assess mean differences in key sociodemographic variables between tracts inside and outside cold spots for each hospice access category. We assessed statistical significance at the 95% confidence level.
Results
Our analytic sample included 3379 census tracts across Pennsylvania, representing approximately 13 million residents. This analysis identified substantial variation in access to hospice care across Pennsylvania. While most of the state’s population live within 60 minutes of a hospice provider, large portions of the state exist in hospice cold spots. Spatial analysis using the Getis-Ord Gi* statistic revealed substantial geographic disparities in hospice access across Pennsylvania.
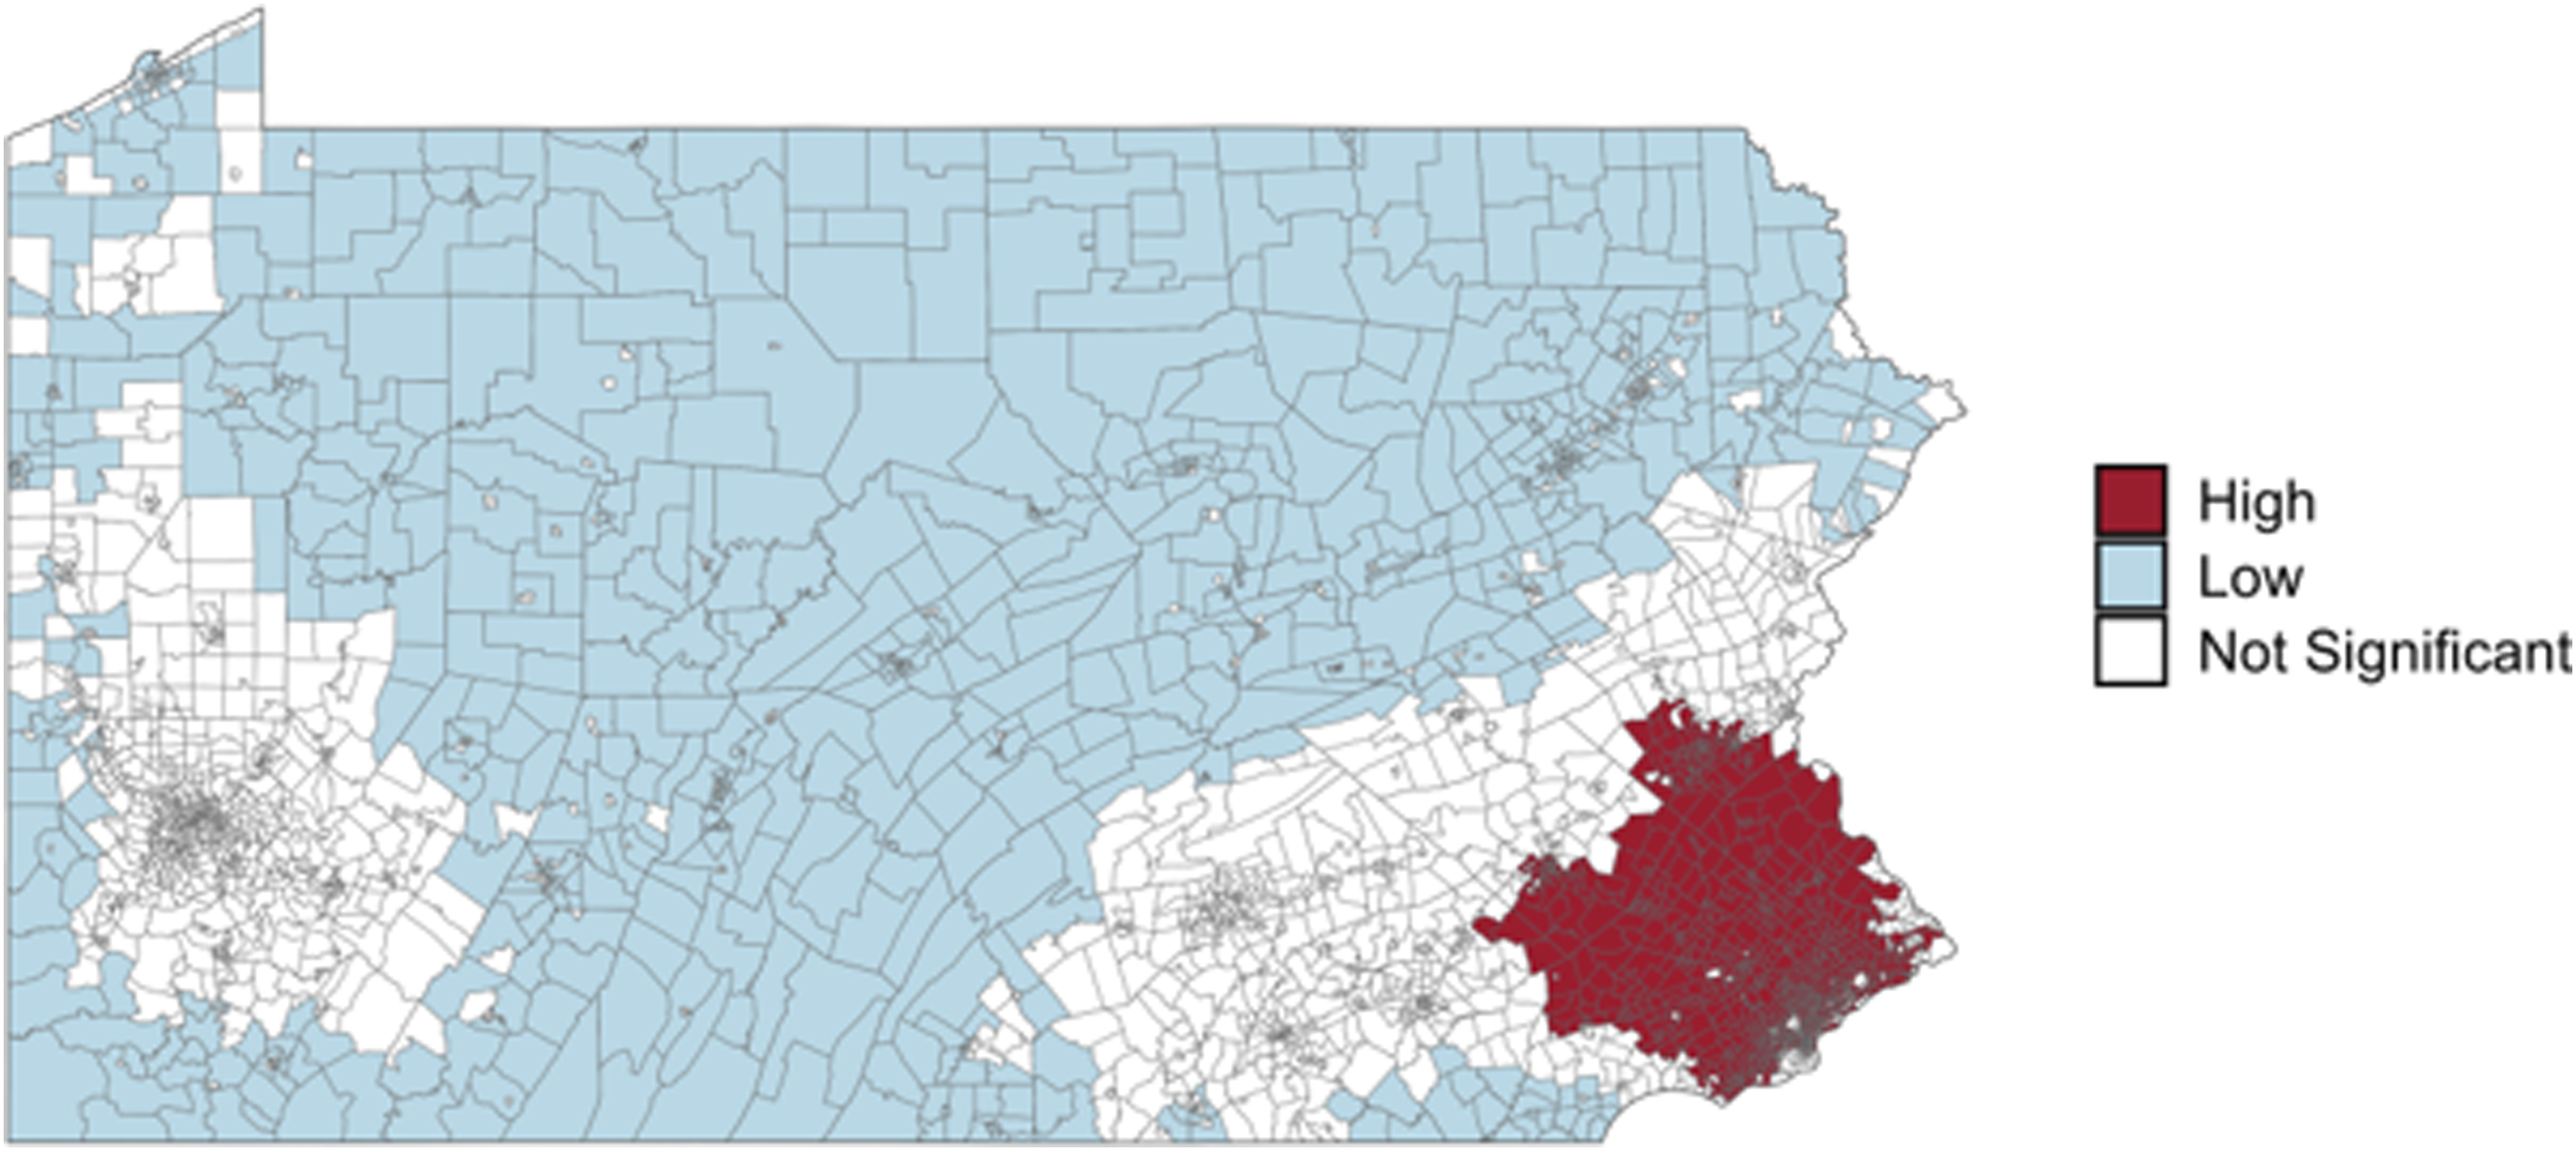
Figure 1 displays statistically significant cold spots (blue) and hot spots (red) based on 60-minute drive-time access to any hospice providers. Census tracts shown in white represent areas that are neither statistically significant cold nor hot spots. In total, 2.3 million Pennsylvanians, or 17% of the state population, reside in census tracts classified as cold spots (Table 1). These 506 tracts have significantly lower-than-expected access to hospice care relative to the statewide distribution of providers. In contrast, hot spots were concentrated around major metropolitan areas, including Philadelphia, Pittsburgh, and Harrisburg, where hospice providers are densely clustered. Geographic clustering of hospice access across Pennsylvania. Map displays statistically significant cold spots (blue) and hot spots (red) identified using the Getis-Ord Gi* statistic based on 60-minute drive-time catchments. Cold spots represent clusters of census tracts with significantly lower-than-expected access to hospice providers relative to statewide distribution, while hot spots represent areas with higher-thanexpected access. Yellow dots indicate the location of hospice providers. Large cold spots were concentrated in rural northern and central Pennsylvania, whereas hot spots were clustered around urban centers Philadelphia, Pittsburgh, and Harrisburg Characteristics of Census Tracts in Hospice Cold Spots vs All Other Tracts, Pennsylvania Notes. Values represent tract-level means or percentages unless otherwise specified. Cold spots are defined as census tracts located in statistically significant clusters of limited hospice access using the Getis-Ord Gi* statistic. P-values reflect two-sample t-tests comparing tracts in cold spots vs all others.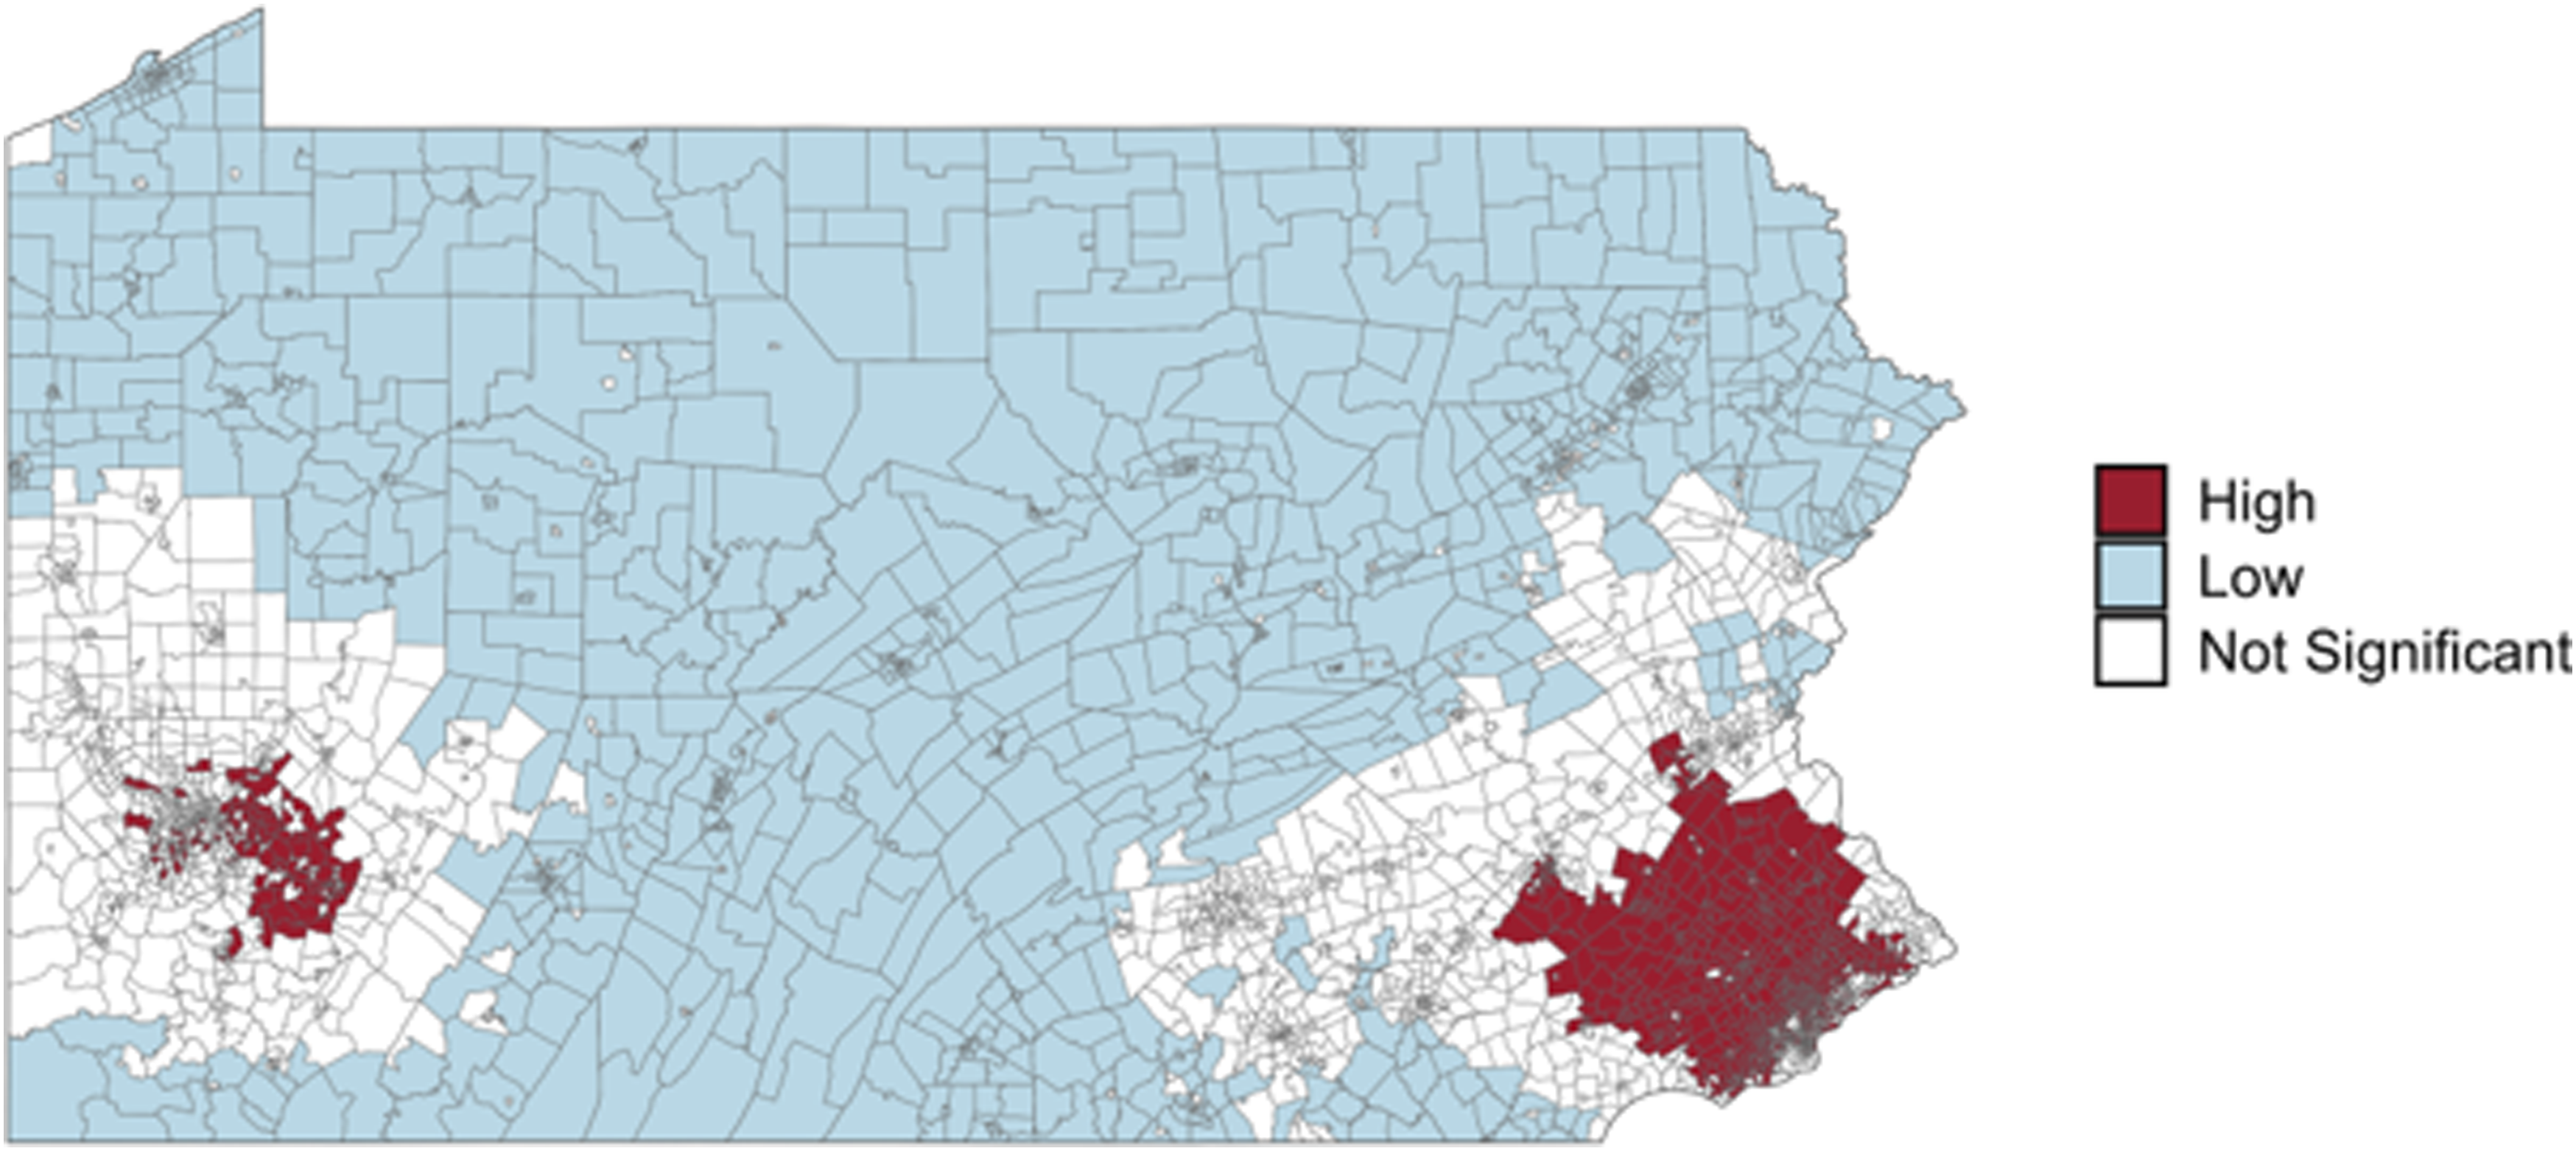
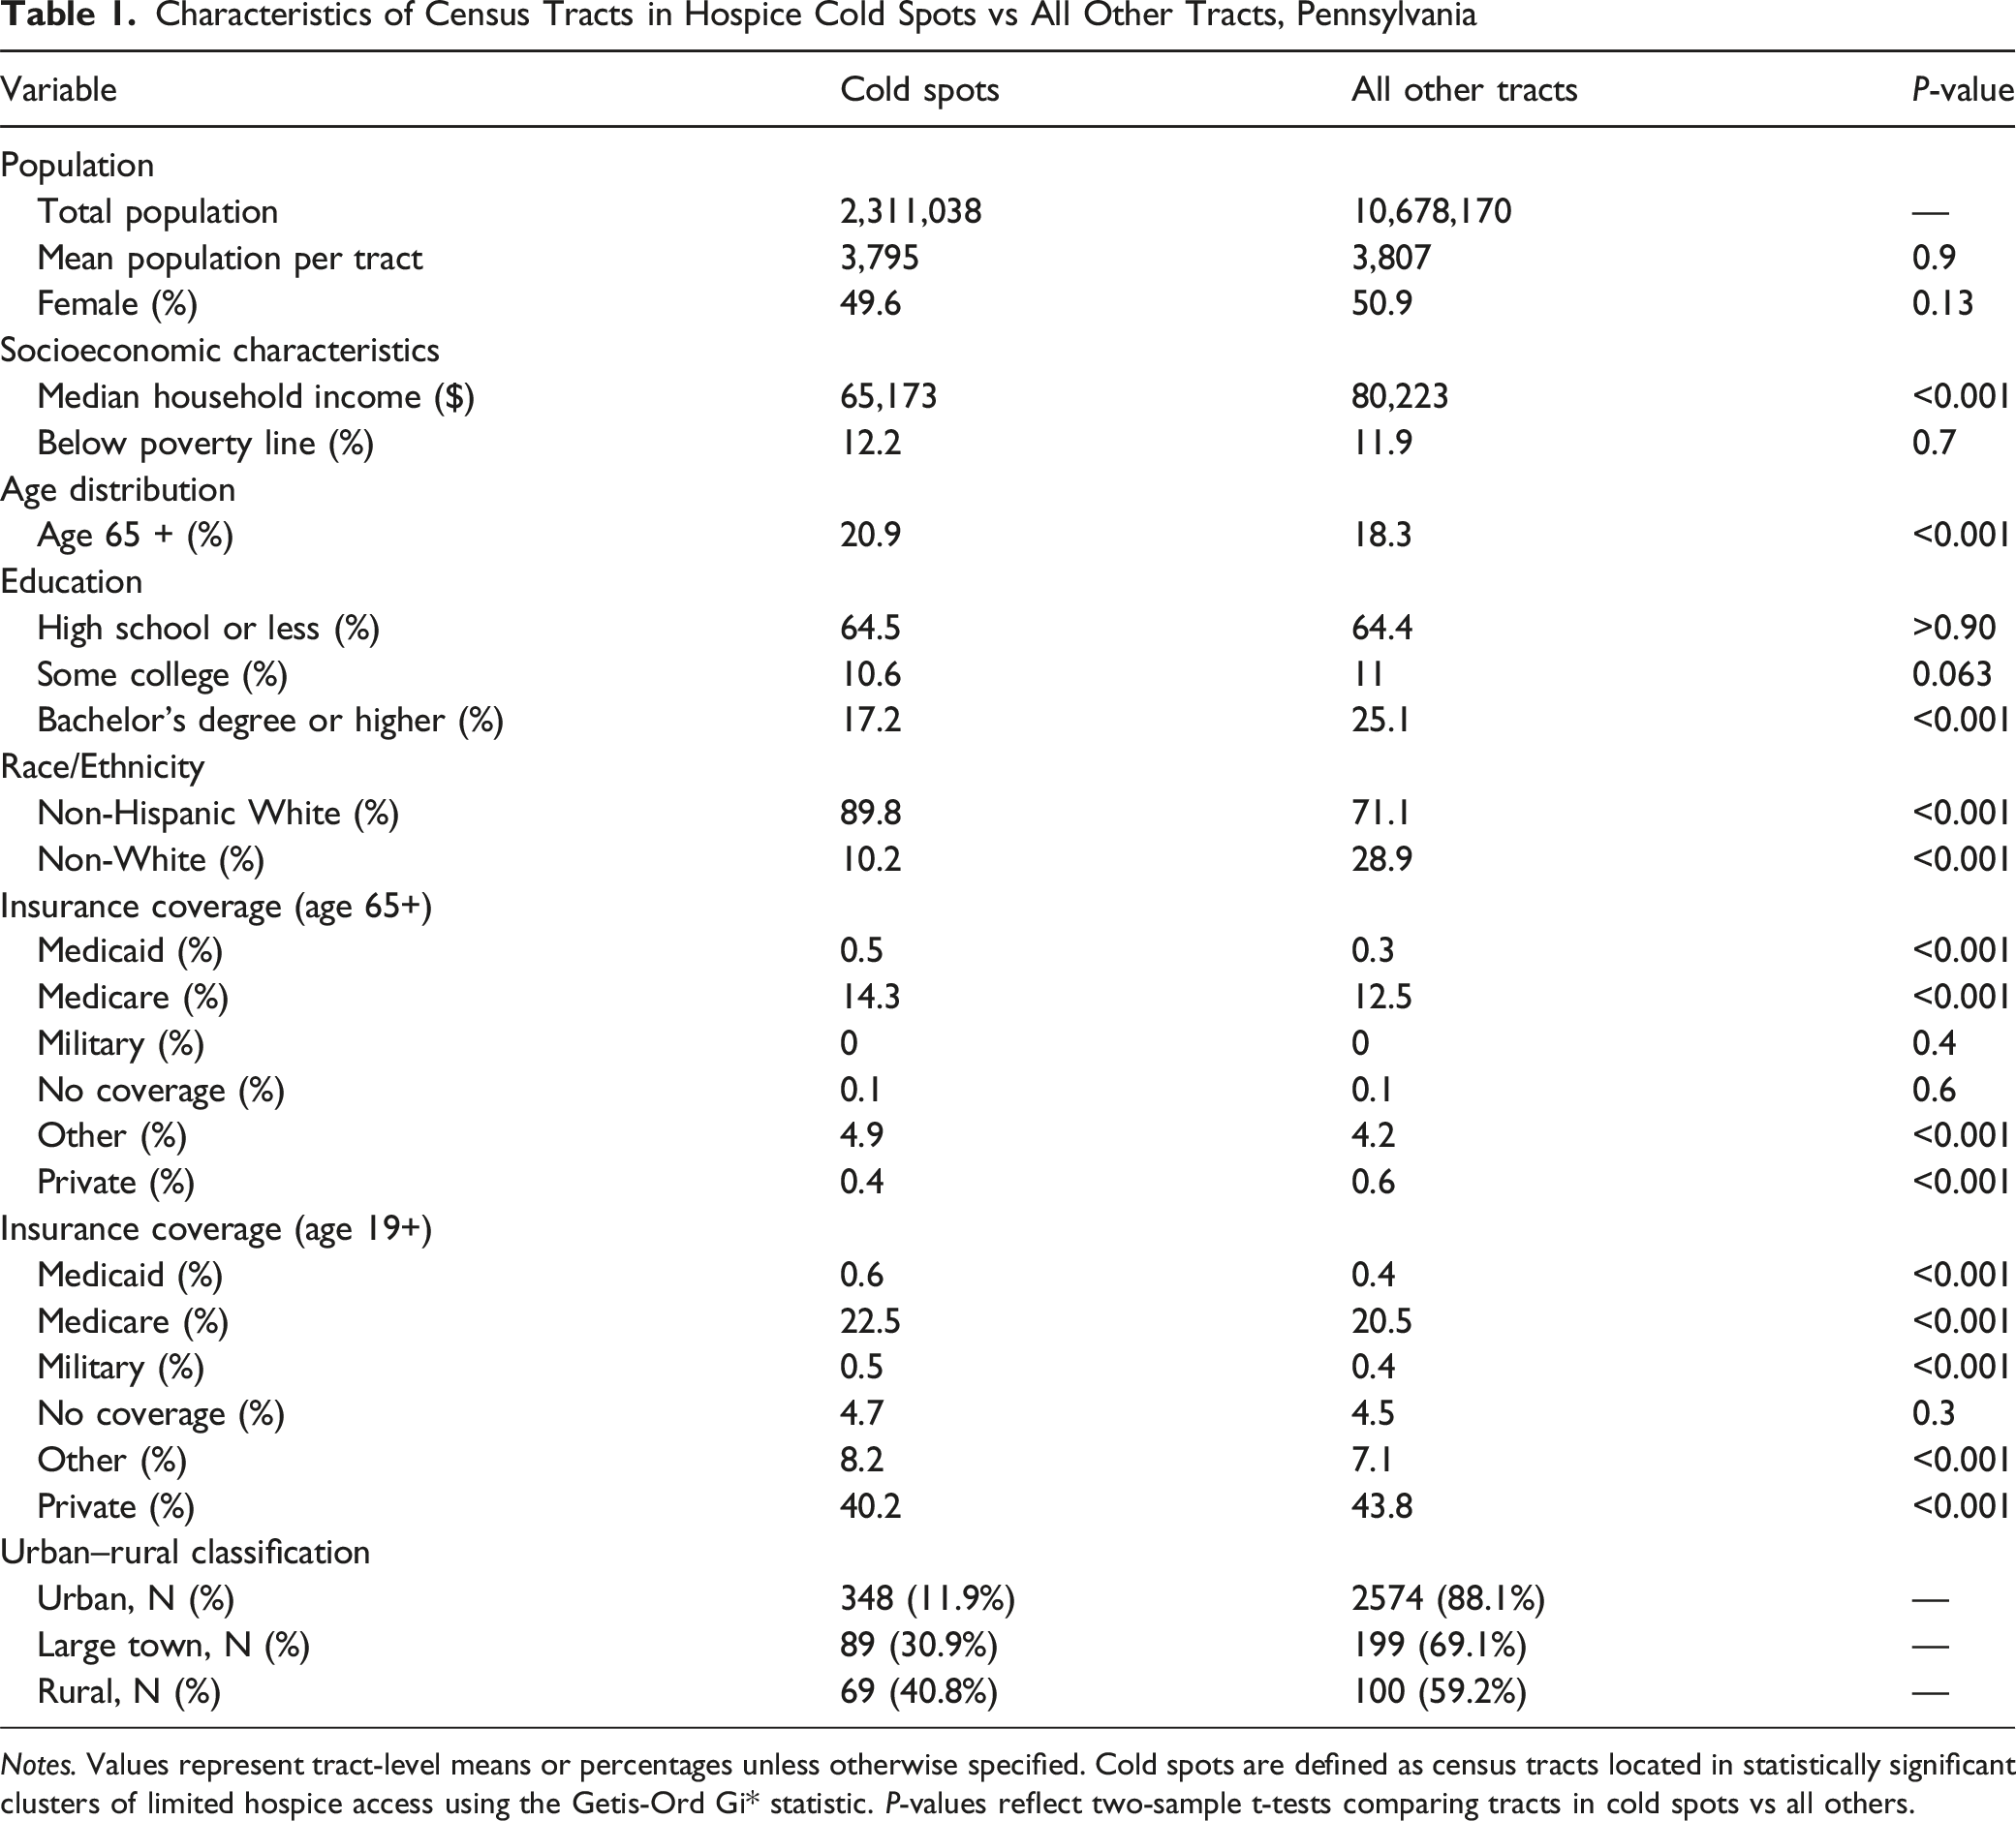
Census tracts located within cold spots were more socioeconomically and demographically disadvantaged than other areas (Table 1). Median household income was substantially lower ($65,173 vs $80,223; P < .001), as was college attainment (17.2% vs 25.1%; P < .001). These tracts also had a higher share of older adults (20.9% vs 18.3%; P < .001) and were less racially diverse (89.8% of residents were non-Hispanic White in cold spot census tracts compared to 71.1% in other areas (P < .001)). Insurance coverage patterns reflected higher reliance on public insurance, with higher enrollment in Medicare (22.5% vs 20.5%; P < .001) and Medicaid (0.6% vs 0.4%; P < .001), and lower rates of private coverage (40.2% vs 43.8%; P < .001). Urban–rural differences were also striking: 11.9% of urban census tracts were in a hospice cold spot, compared to 30.9% of tracts in large towns and 40.8% of rural tracts.
Characteristics of Census Tracts in Nonprofit Hospice Cold Spots vs All Other Tracts, Pennsylvania
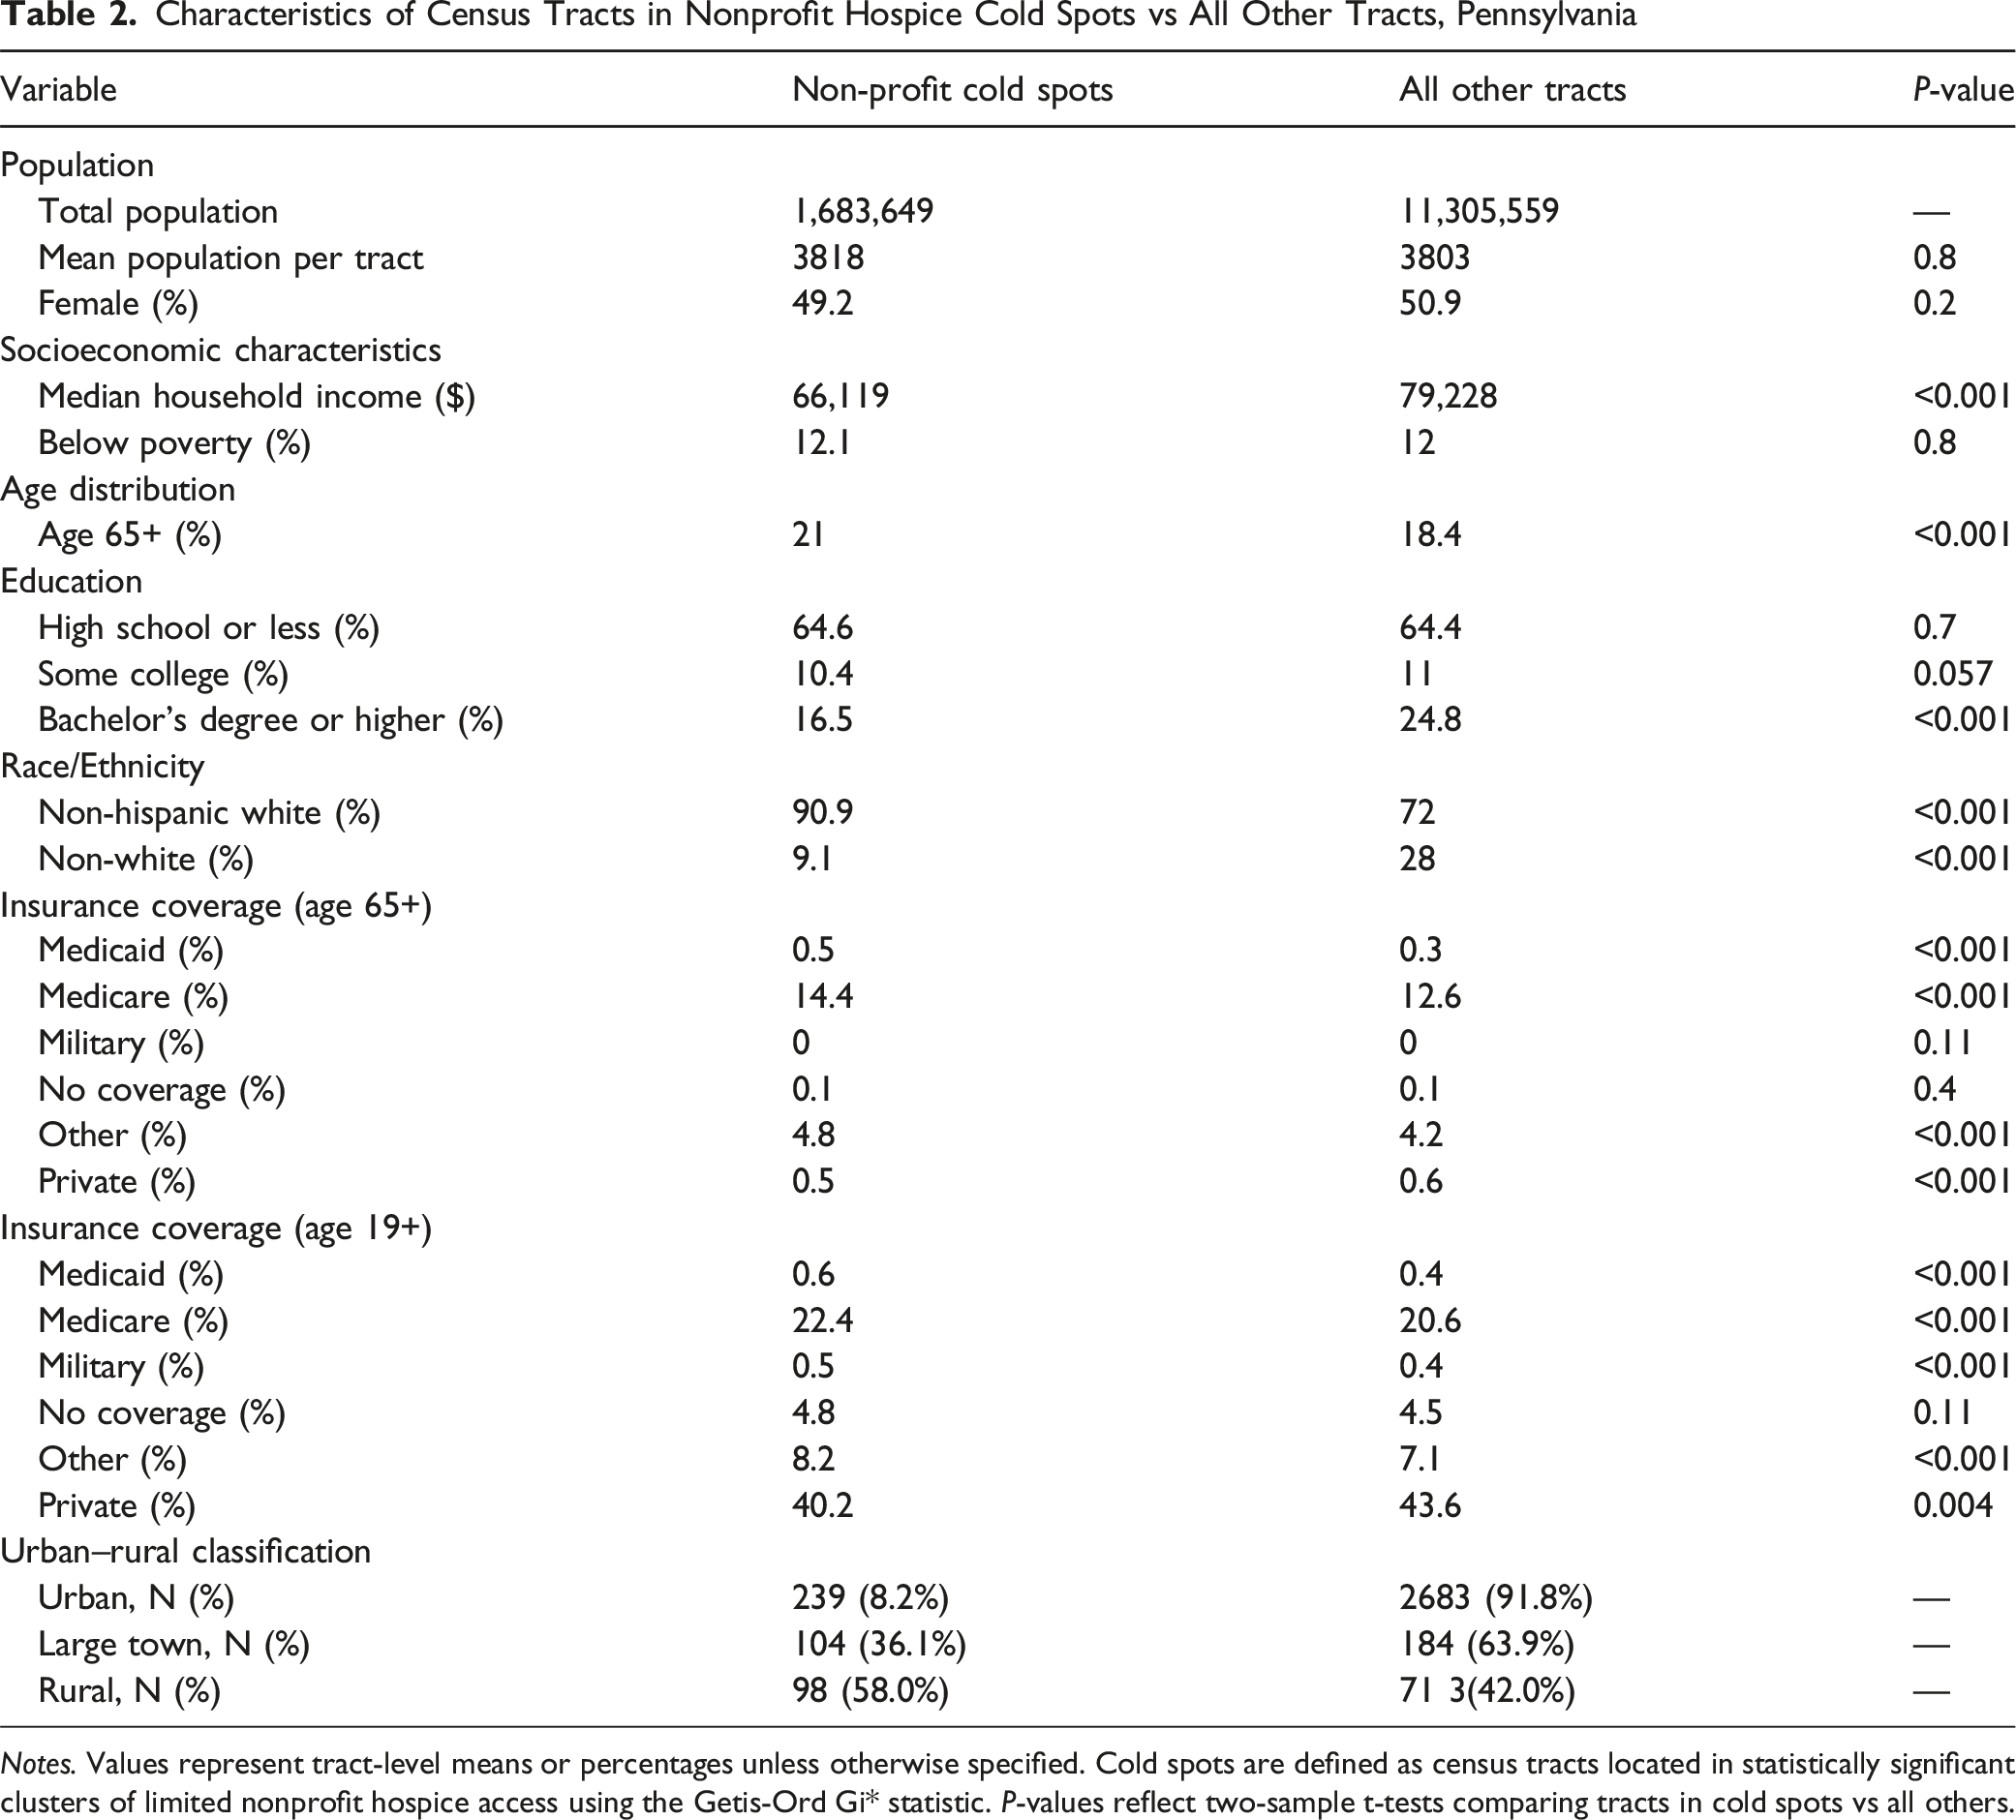
Notes. Values represent tract-level means or percentages unless otherwise specified. Cold spots are defined as census tracts located in statistically significant clusters of limited nonprofit hospice access using the Getis-Ord Gi* statistic. P-values reflect two-sample t-tests comparing tracts in cold spots vs all others.
Characteristics of Census Tracts in High Quality Hospice Cold Spots vs All Other Tracts, Pennsylvania
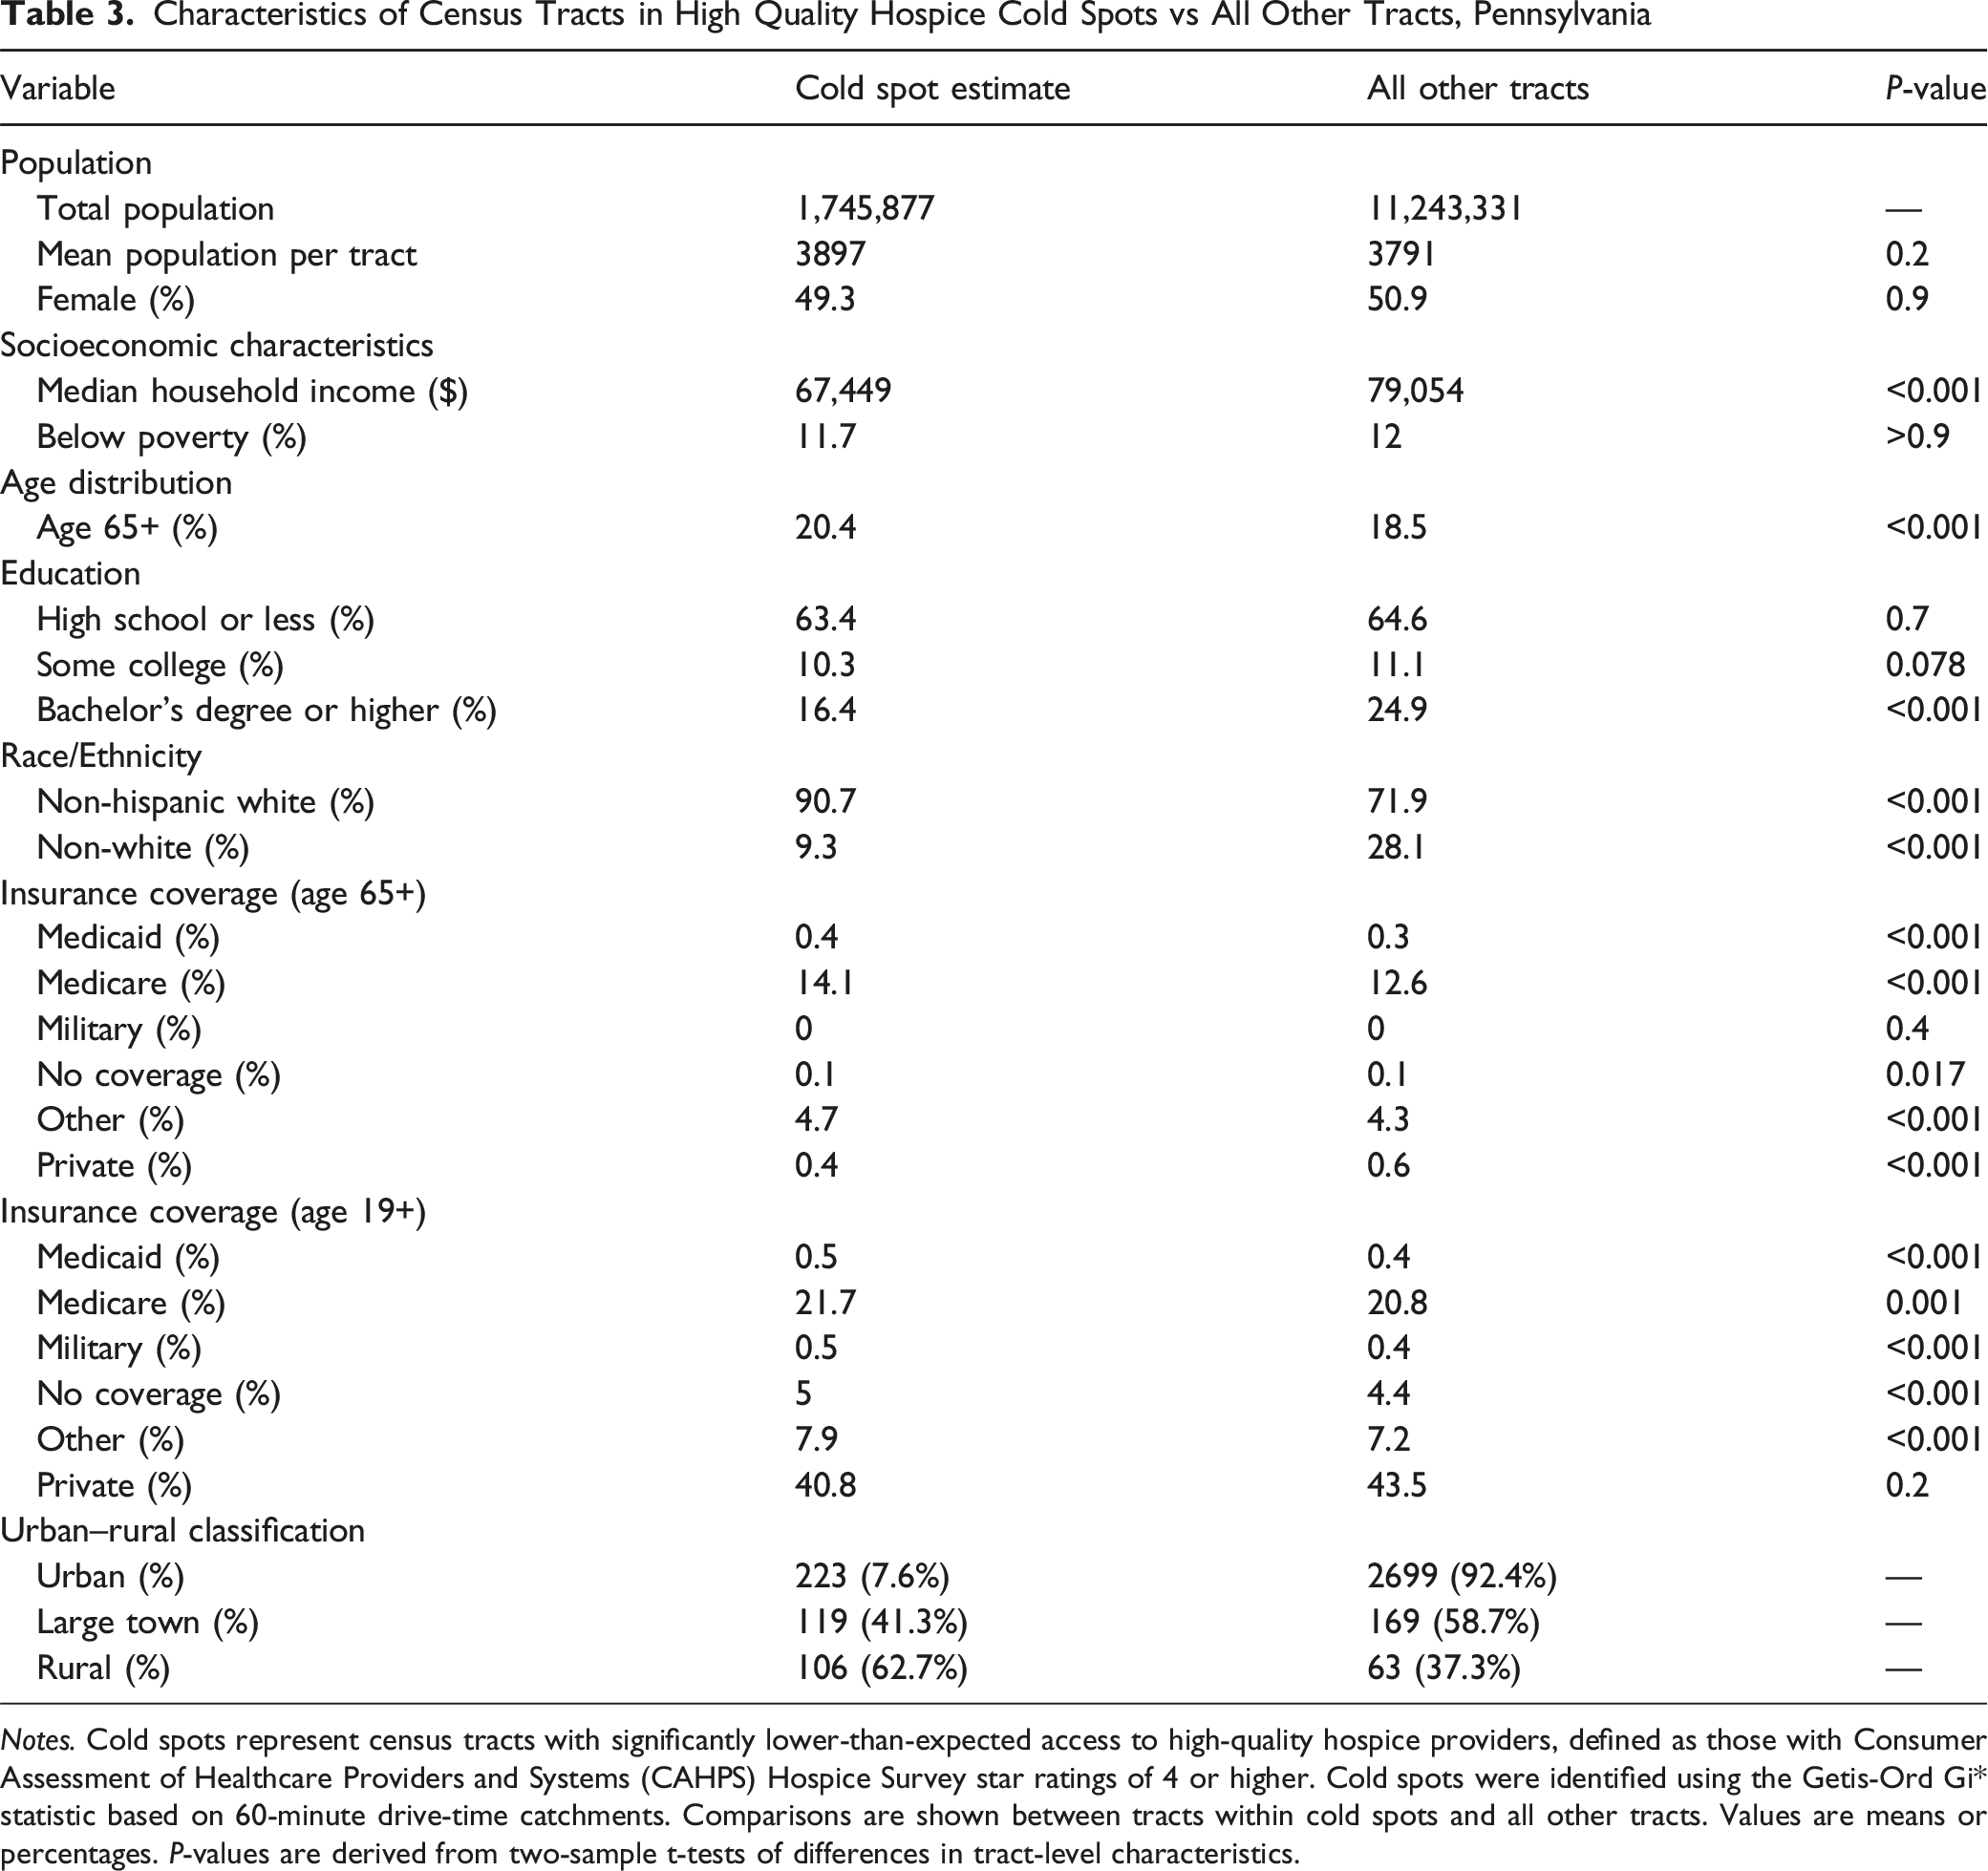
Notes. Cold spots represent census tracts with significantly lower-than-expected access to high-quality hospice providers, defined as those with Consumer Assessment of Healthcare Providers and Systems (CAHPS) Hospice Survey star ratings of 4 or higher. Cold spots were identified using the Getis-Ord Gi* statistic based on 60-minute drive-time catchments. Comparisons are shown between tracts within cold spots and all other tracts. Values are means or percentages. P-values are derived from two-sample t-tests of differences in tract-level characteristics.
Geographic clustering of nonprofit hospice access across Pennsylvania. Map displays statistically significant cold spots (blue) and hot spots (red) identified using the Getis-Ord Gi* statistic based on 60- minute drive-time catchments. Cold spots represent clusters of census tracts with significantly lower-thanexpected access to nonprofit hospice providers relative to statewide distribution, while hot spots represent areas with higher-than-expected access. Yellow dots indicate the location of hospice providers. Large cold spots were concentrated in rural northern and central Pennsylvania, whereas hot spots were clustered around Philadelphia
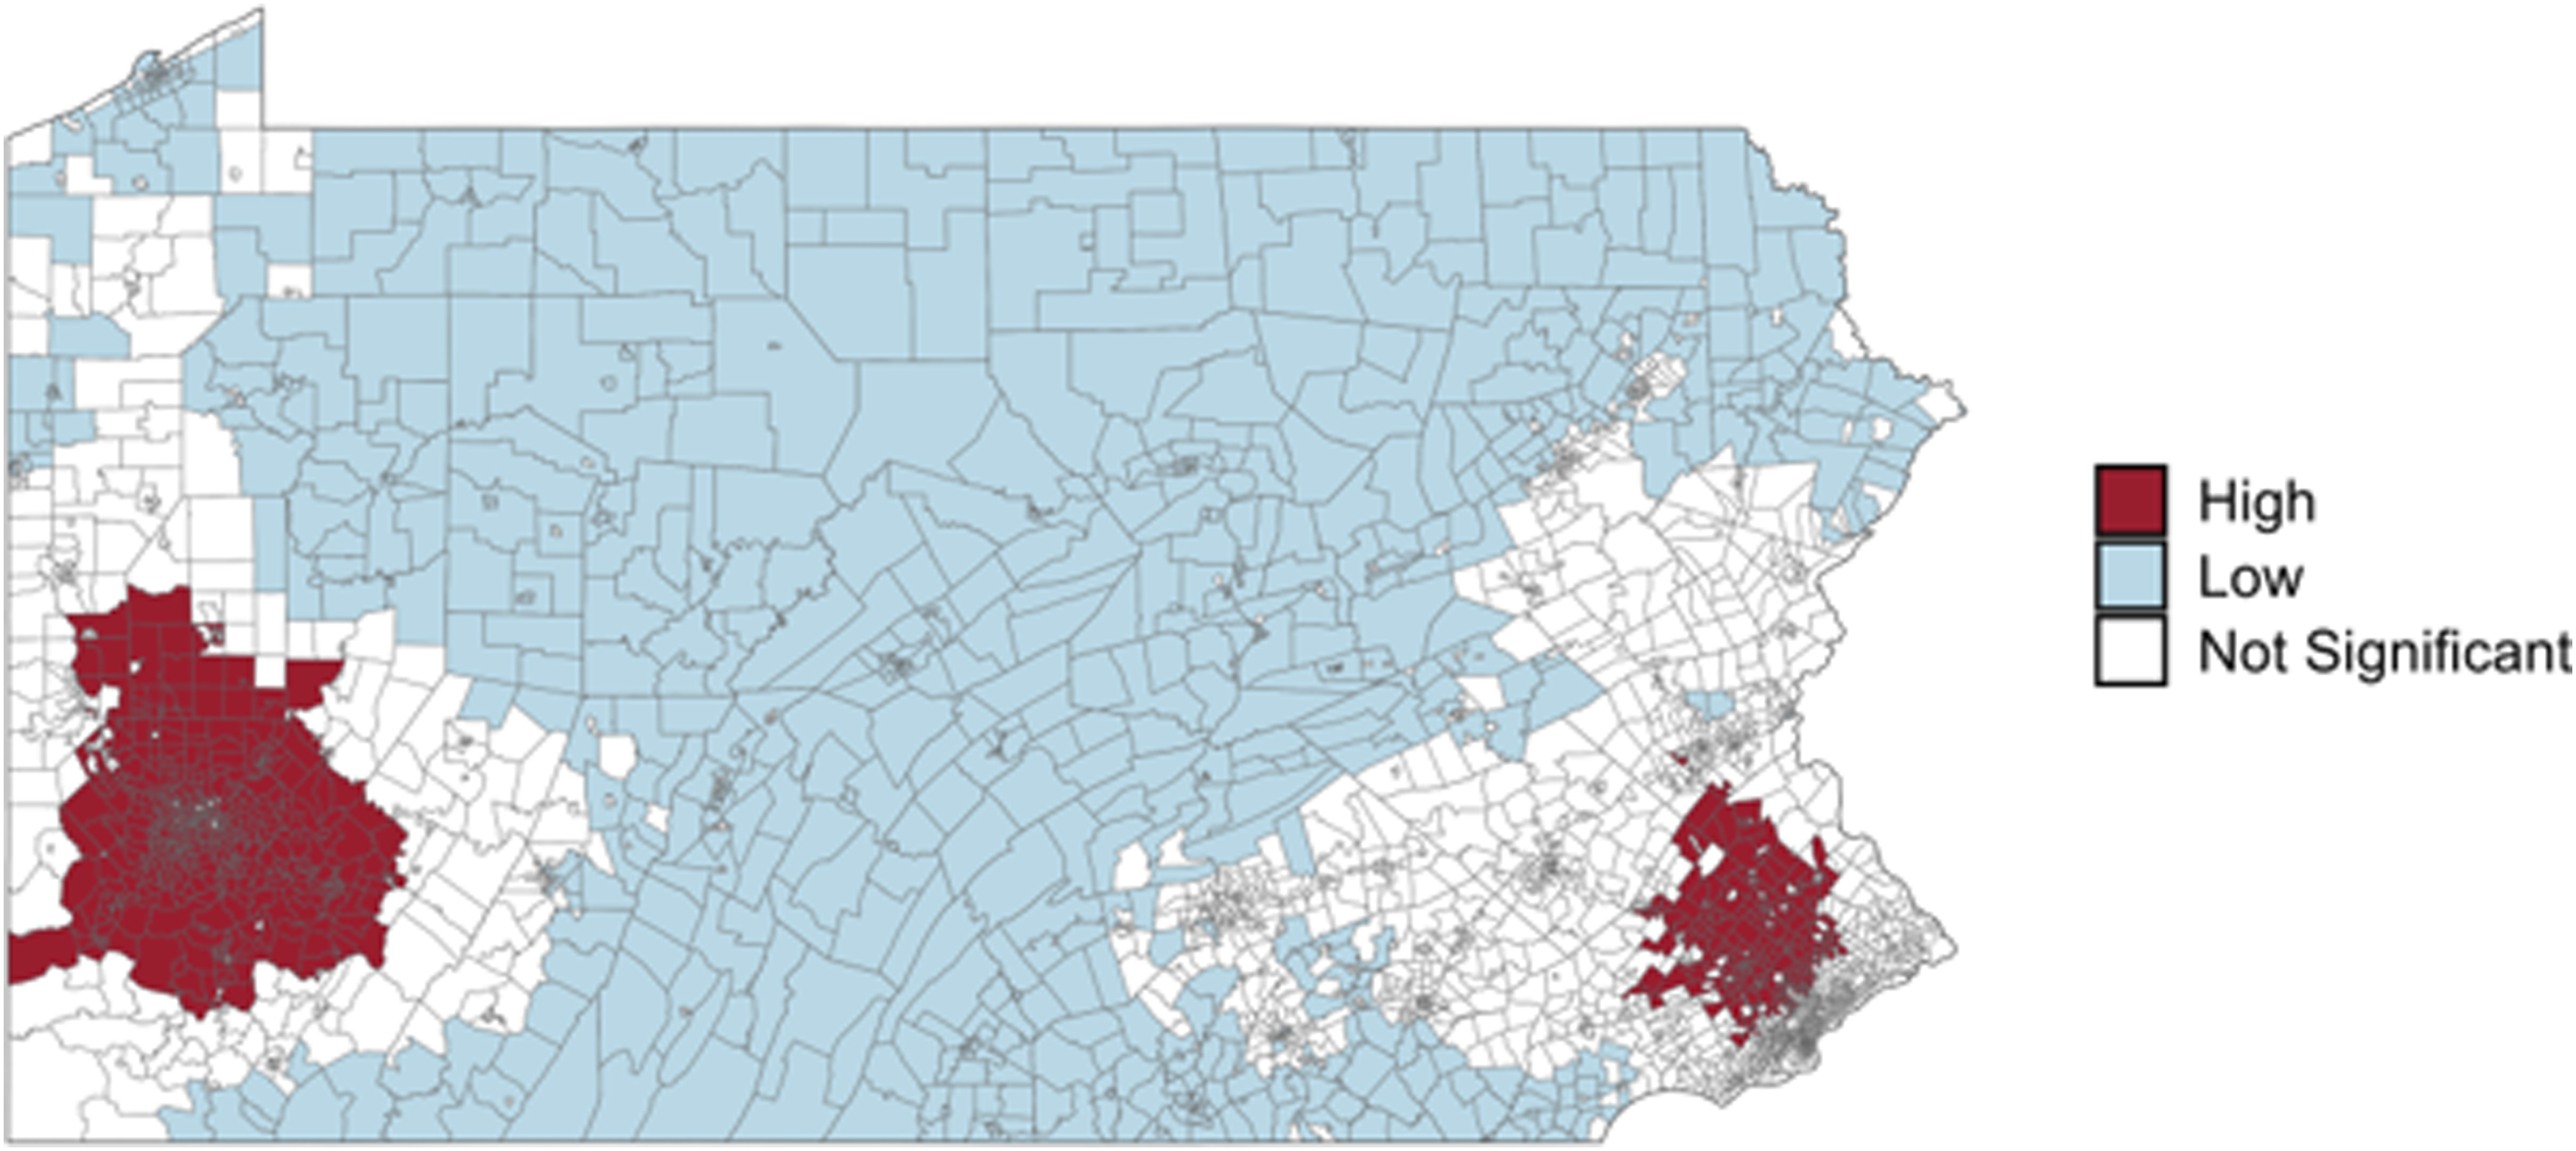
Geographic clustering of high-quality hospice access across Pennsylvania Map displays statistically significant cold spots (blue) and hot spots (red) identified using the Getis-Ord Gi* statistic based on 60- minute drive-time catchments. Cold spots represent clusters of census tracts with significantly lower-thanexpected access to high-quality hospice providers relative to statewide distribution, while hot spots represent areas with higher-than-expected access. Yellow dots indicate the location of hospice providers. Large cold spots were concentrated in rural northern and central Pennsylvania, whereas hot spots were clustered around Pittsburgh and Philadelphia
Discussion
Our analysis found that access to hospice care is unevenly distributed across Pennsylvania. Hospice cold spots were concentrated in rural and less densely populated regions. These areas were not only geographically isolated but also disproportionately older, whiter, lower income, less educated, and more reliant on public insurance. The disparities were especially pronounced when restricting the hospice sample to nonprofit or high-quality providers. Rural tracts were six to eight times more likely than urban tracts to be in a cold spot across each category. These patterns reflect geographic disadvantages and point to persistent inequities in the delivery of end-of-life care.
Pennsylvania’s geographic diversity makes it a useful setting to study these disparities. The state has a wide range of community types, with two densely populated urban centers in Philadelphia and Pittsburgh, mid-sized cities such as Harrisburg, Erie, and Allentown, and remote rural areas across the Appalachian regions. These geographic contrasts allow for the examination of how hospice services are distributed across varied settings and how location may influence the availability of hospice care. Rural areas often face provider shortages, longer travel distances for in-home services, and more limited healthcare infrastructure, all of which can constrain access to hospice care. 20 Importantly, although Pennsylvania includes mountainous terrain and river systems, it does not contain large-scale geographic barriers that render travel infeasible or isolate entire regions from the road network. As a result, observed disparities are more plausibly driven by provider distribution rather than unavoidable physical obstacles to travel. Insights from Pennsylvania are therefore likely to be informative for understanding and addressing similar disparities nationwide.
These findings are consistent with prior evidence documenting geographic inequities in access to health services in Pennsylvania, particularly in rural communities. For example, research identifying pharmacy deserts in Pennsylvania has similarly shows that limited access to community pharmacies clusters in rural regions of the state and disproportionately affects older, predominantly non-Hispanic White populations. 27 Similarly, prior studies on hospice access have shown that rural areas face longer travel distances, fewer providers per capita, and more limited healthcare infrastructure, all of which constrain access to hospice and palliative care services.18-23
Although prior studies have documented lower hospice utilization in rural areas, few have systematically examined geographic clustering of hospice availability using spatial statistics. By identifying statistically significant cold spots, our study demonstrates not only where hospice providers are lacking, but also how these gaps cluster across regions. The limited availability of nonprofit hospices and top-rated providers in disadvantaged communities raises important concerns about what kind of care is available to patients at the end of life.
Current Medicare policy assumes beneficiaries can evaluate and select among hospice providers, aided by transparency tools such as CMS Care Compare. Yet in many communities, patients may have no meaningful options, with the nearest available provider being for-profit, low quality, or lacking a reported quality rating. These findings highlight the structural nature of geographic hospice disparities. Policy responses could strengthen quality reporting requirements or financially incentivize hospices to expand into underserved regions. At a broader level, the results underscore the importance of considering geography in federal quality initiatives. Provider transparency is of limited use if patients lack local access to providers.
This study has several limitations. First, the Getis-Ord Gi* statistic is a widely accepted approach for detecting spatial clustering, but it assesses relative clustering of hospice proximity across census tracts rather than providing a direct tract-level measure of access. As a result, a tract with hospice providers within a 60- minute drive could still be classified as a “cold spot” if the neighboring tracts lack similar access. Conversely, tracts without hospice providers nearby may appear in “hot spots” if they are surrounded by neighbors with access. This means our results highlight regional clustering of hospice presence rather than individual tract–level access, and findings should be interpreted in that context. Second, our analysis focused on geographic accessibility measured by drive-time. Geographic availability is a necessary but not sufficient condition for realized hospice access. Other barriers—such as staffing shortages, capacity constraints, insurance coverage, or patient and family preferences—also shape whether services can be used. Moreover, the presence of a hospice provider within a 60-minute drive does not guarantee service availability or quality for all individuals in that area. Despite these limitations, this analysis offers policy-relevant evidence on the geographic distribution of hospice providers, highlighting regions where limited availability may limit patient care at the end of life.
Future research should examine whether growth in hospice providers has translated into expanded access in underserved communities. Linking geographic access measures to patient-level utilization and outcomes would help clarify whether residence in hospice cold spots is associated with delayed enrollment or greater reliance on hospital-based end-of-life care. Additional work could assess how changes in ownership, market entry, and provider capacity shape access over time, and whether targeted policy interventions can reduce persistent geographic inequities.
Conclusion
This study demonstrates significant geographic and sociodemographic disparities in access to hospice care across Pennsylvania. While most residents live within an hour of a hospice provider, millions reside in regions with systematically fewer or no hospice options. These disparities disproportionately affect rural and socioeconomically disadvantaged communities, reinforcing broader structural inequities in end-of-life care. Our findings underscore the limitations of assuming patient “choice” in hospice enrollment when geography and provider mix constrain available options. More broadly, our results suggest that equitable access to hospice care requires not only transparency but also attention to the geographic distribution and ownership of providers.
Footnotes
Author Contributions
Funding
The authors disclosed receipt of the following financial support for the research, authorship, and/or publication of this article: This project was supported by NIH grant P30CA047904 awarded to UPMC Hillman Cancer Center. Dr. Schenker was supported by K24AG070285.
Declaration of conflicting interests
The authors declared no potential conflicts of interest with respect to the research, authorship, and/or publication of this article.