
Abstract
Nearly 550,000 people release from state and federal prisons each year and there are no specialized measures to assess their stabilization and progress after release beyond assessments of risk to recidivate (Carson, 2021; Pettus et al., 2021). We propose a new outcome construct entitled reentry well-being (Pettus et al., 2021). Reentry well-being is defined as a state of satisfying and productive engagement with one's life and realization of one's full psychological, social, and occupational potential during the transitional period from incarceration to community stabilization (Carruthers & Hood, 2007; Harper Browne, 2014; Pettus et al., 2021). The reentry timeframe, which is seen as a critical time for individuals to achieve stability in the community, is often defined as the 6 months prior to release and lasting through the first year in the community (Jonson & Cullen, 2015; Petersilia, 2009; Travis, 2005). Reentry well-being is of relevance for individuals leaving incarceration because it affords important protective factors in the face of stress and difficulty. Well-being is a malleable construct that can be both achieved and increased despite adversity and social inequality (Ryff, 2016). A focus on well-being in the reentry contexts capitalizes on an expanding research base in medicine, psychology, public health, education, sociology, occupational therapy, recreation and leisure studies, and social work (e.g., Boehm et al., 2012; Carruthers & Hood, 2007; Davidson & McEwen, 2012; Manderscheid et al., 2010; Ryff & Singer, 1996).
As an initial approach to operationalizing reentry well-being, we created and validated a measure entitled the Reentry Well-Being Assessment Tool (RWAT; Veeh et al., 2018). The RWAT is a first step towards two simultaneous goals: (1) an alternative outcome measure to risk assessment and recidivism tools and (2) a practice tool that responds to the dual challenges of planning program services and evaluating program effectiveness. In more concrete terms, the RWAT is intended to provide a more holistic picture of how an individual is doing following incarceration beyond only the event of recidivism back to the criminal justice system. Social work researchers and practitioners can use the RWAT to get a more nuanced understanding of an individual returning from incarceration across important life domains such as quality of interpersonal relationships, use of leisure time, coping with stressful life situations, employment that is fulfilling, and thinking that is flexible, empathic, and hopeful for their own future. The current study is the first investigation into the factorial validity of the RWAT. The goal was to identify the most parsimonious number of items for RWAT, both in terms of total items as well the response structure for each respective item, that measured each dimension of the underlying reentry well-being construct. To achieve this goal, the research team employed confirmatory factor analysis (CFA) that was based on the principles of item response theory (IRT) to determine the best-preforming items for the RWAT.
Conceptual Framework for the RWAT
The conceptual framework that informed the development of the RWAT is the Well-Being Development Model (WBDM; Pettus et al., 2021). The WBDM provides an alternative to prominent deficits-oriented models guiding reentry services that have been used for decades with little success. In contrast, the WBDM aims to increase incarcerated and formerly incarcerated individuals’ capacity to reach their full potential while addressing common barriers to success during reentry. The WBDM supports the development, implementation, and assessment of innovative reentry interventions designed to increase well-being among individuals returning from incarceration. The WBDM was created through a synthesis of theory, empirical research, and the practical experiences of a multidisciplinary team who worked to capture the critical ingredients of well-being development. The WBDM comprises five malleable factors—the key facilitators of well-being development which are Healthy Thinking Patterns, Meaningful Work Trajectories, Effective Coping Strategies, Positive Social Engagement, and Positive Interpersonal Relationships.
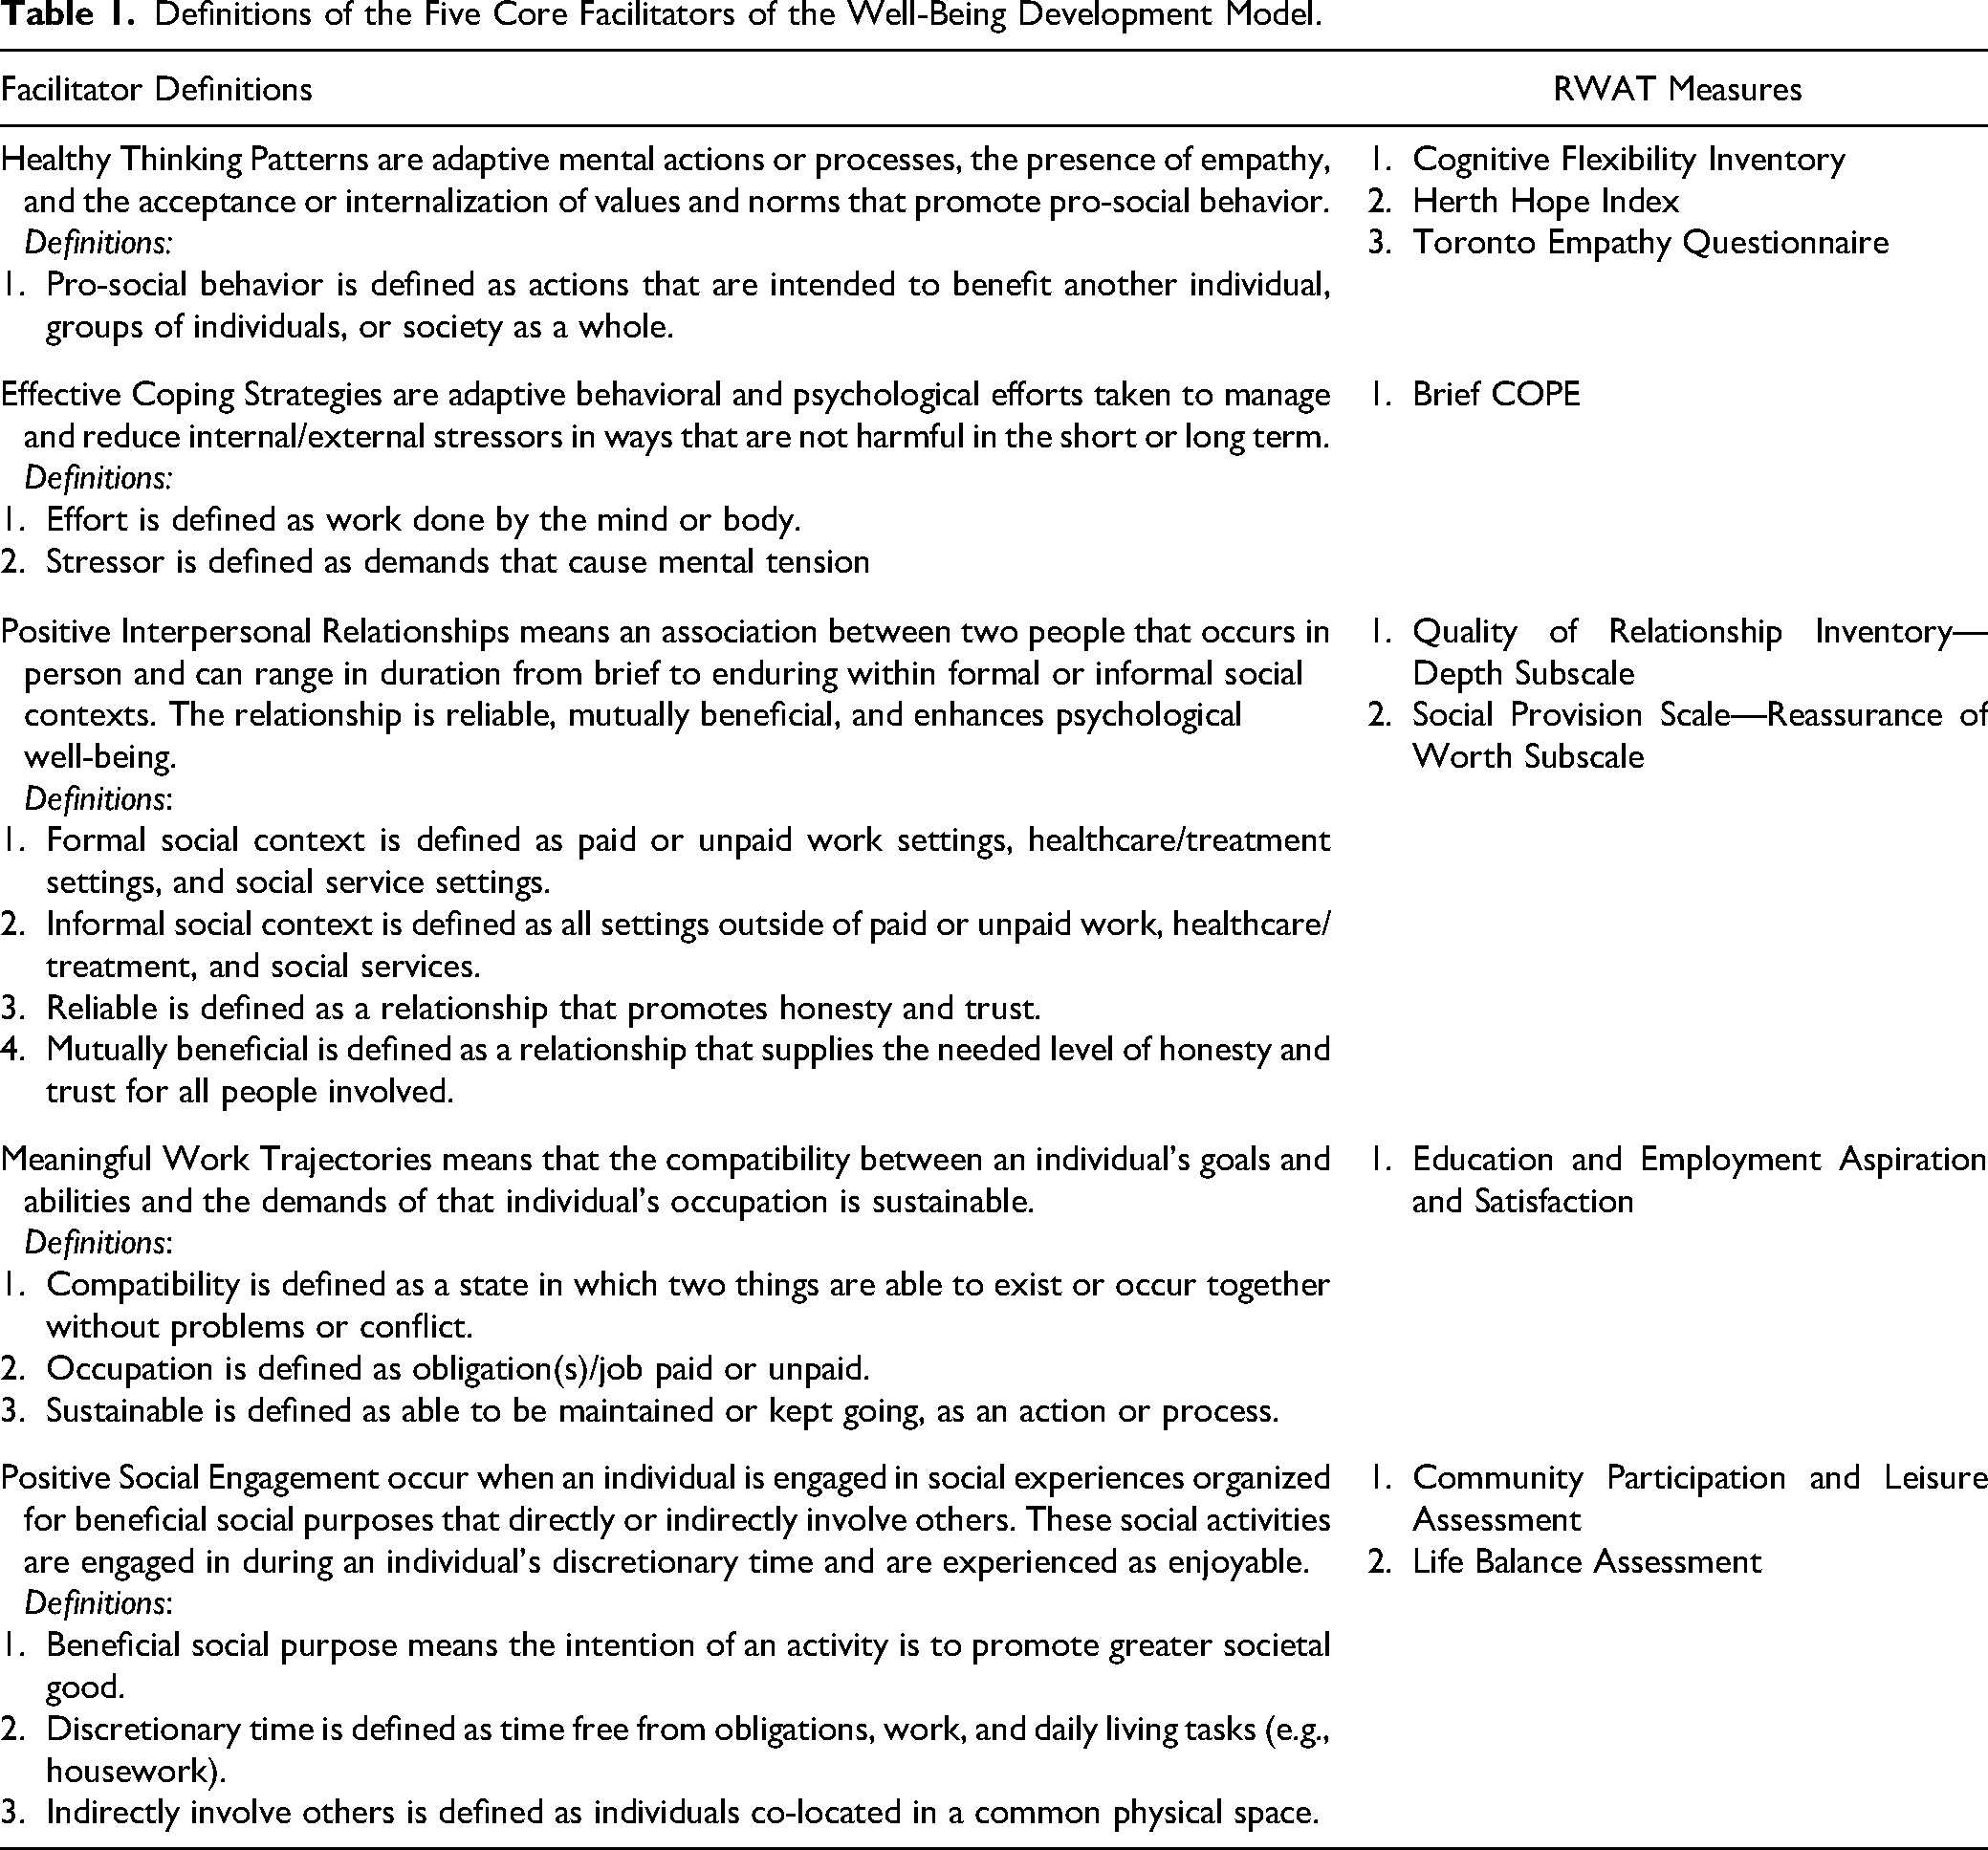
The RWAT was developed as a tool to promote reentry service planning and examine program effectiveness among interventions developed using the principles of the WBDM. See Table 1 for definitions of each of the five key facilitators of well-being development and the corresponding measure(s) selected to capture each facilitator. Therefore, the RWAT provides a structured process for a practitioner to assess an individual's progress in reentry services and make decisions to step-up, step-down, or maintain an individual's intensity or type of service within a reentry services program. Additionally, the RWAT was designed to be administered at multiple time points to explore changes along the five key facilitators of well-being development that might occur over time. Further, the RWAT has the potential to eventually serve as a consistent, universal outcome of reentry program effectiveness despite the unique characteristics of any given reentry services program.
Definitions of the Five Core Facilitators of the Well-Being Development Model.
Development of the RWAT
The RWAT was developed by a team comprised of researchers, corrections professionals, reentry practitioners, and formerly incarcerated individuals. The development process began with a researcher-led comprehensive search for any existing measure that assessed each of the five key facilitators of well-being development as well as overall well-being. Following the identification of measures, the research team then completed a thorough item review to select the measures most appropriate for individuals receiving reentry program services. Any measures that were free to use and publicly accessible were given priority to increase accessibility of the RWAT for reentry practitioners, researchers, and organizations (for a detailed description see Veeh et al., 2018).
Next, selected measures for potential inclusion in the RWAT underwent cognitive testing processes with eight individuals with incarceration histories; all these individuals had served at least 1 year in a state correctional facility in their lifetime and volunteered to participate in a community advisory board convened by the authors to receive feedback on the study. Cognitive testing was conducted in dyads with one interviewer who asked the questions and one volunteer with an incarceration history responding. Each question was read aloud by the interviewer and the volunteer would provide their response using a set of response cards. This structure replicated the interview process that would be used when administering these questions in the actual study. Following each question and response, the interviewer then asked the volunteer three follow-up questions to assess his/her understanding of what was being asked. The three follow-up questions were (1) what did you think the question was asking?; (2) why did you answer the question the way you did?; and (3) were the provided response options clear? The three follow-up questions were created with the goal for the respondent to explain both the question and response in their own terms, which then allowed the study investigators to ensure that the questions were being understood as intended. The interviewer used a table to record the volunteer's response data for each item.
Using data from the cognitive testing procedures, we then revised each item for clarity. Next, we met with corrections professionals and reentry practitioners to review the RWAT. Our main goal was to assess face validity of the tool and whether these professionals believed that it would be beneficial and feasible to implement the tool in their service settings. Data were informally collected through meeting notes and the tool was slightly revised accordingly. These revisions mostly included changes to the overview of the tool, tool instructions, item-based examples, and the format of the tool. Once all revisions to the RWAT occurred, a graduate student compiled the different items across the RWAT measures and grouped them by either subscale or full scale depending on the factor structure found in the existing psychometric literature. Then within those WBDM key facilitators that included more than one measure (i.e., Healthy Thinking Patterns, Positive Interpersonal Relationships, and Positive Social Engagement), the graduate student did a comparison of items across the different measures of the respective key facilitator to identify any conceptual overlap. Ultimately, the results of this comparative exercise found conceptual overlap in the measures of the Quality of Relationship Inventory (QRI) and Social Provision Scale (SPS) that were assigned to Positive Interpersonal Relationships. The recommendation was to use the Depth subscale for the QRI and the Reassurance of Worth Subscale for the SPS. No changes were recommended for the measures assigned to Healthy Thinking Patterns and Positive Social Engagement. The research team reviewed all original items and the proposed changes and determined the final set of items to comprise the RWAT.
The original RWAT included nine measures comprised of 134 items. Administering the RWAT takes 30–45 min. The nine measures are each closely connected to one of the key facilitators. The key facilitator of Healthy Thinking Patterns is composed of three measures, which are Cognitive Flexibility Inventory (CFIn) (Dennis & Vander Wal, 2010), Herth Hope Index (HHI) (Herth, 1992), and Toronto Empathy Questionnaire (TEQ) (Spreng et al., 2009). Effective Coping Strategies are measured by the Brief COPE (BC) (Carver, 1997), and Meaningful Work Trajectories are captured by Employment and Education Satisfaction and Aspiration (EEAS) (Rich & Delgado, 2010). Positive Interpersonal Relationships were measured by the QRI—Depth scale and the SPS—Reassurance of Worth scale (Cutrona & Russell, 1987; Pierce et al., 1991). Lastly, Positive Social Engagement was measured by the Community Participation and Leisure Assessment (CPLA) and the Life Balance Assessment (LBA) (Sheldon et al., 2010). See Supplemental Table 1 for full list of original measure items.
Present Study
Given the length of the RWAT, the research team aimed to ensure that the most parsimonious set of items was included while retaining adequate information for each of the WBDM five key facilitators. Therefore, the current report focuses on the first test of factorial validity for the RWAT using CFA based on the principles of IRT. We used IRT principles because it departs from the assumption of classical test theory that a longer measure with more items will more reliably capture the assessed construct. IRT instead aims to develop the most precise measure using only the best-performing items. IRT uses this approach because the inclusion of poorly performing items often works against the development of a precise measure in most cases. To achieve this goal, a multiple-step analysis process was undertaken. The first step was a thorough review of each item across the nine measures to see if there was any consolidation of the response options prior to CFA. Second, the nine measures were each tested as a unidimensional construct through CFA, which is an important assumption to meet within IRT. Once unidimensionality was confirmed, the same approach to CFA was used to test the multi-factor models for those WBDM key facilitators with more than one factor. Finally, all measurement factors found to achieve adequate model-to-data fit in the prior two steps were then tested in a multidimensional CFA model.
Method
Overview of Primary Study
The current study is an analysis of data originally collected on individuals who consented for an experimental study to pilot test a prison reentry program entitled the 5-Key Model for Reentry (See Pettus-Davis et al., 2019 for a detailed description of the program). Participants were recruited from over 70 state prison sites located across four states, three states are located in the South U.S. Census region and the fourth is located in the Northeast U.S. Census region. Within each of these four states, incarcerated individuals were only able to participate if they were releasing to study counties that represented urban, suburban, and rural communities.
All study procedures used to recruit and consent individuals were approved by a university Institutional Review Board. This study was not preregistered. Individuals were recruited based on lists that were provided by each state's department of corrections to the research team that identified all individuals over the age of 18 and scheduled to be released to a study county in the next four to six months. Study recruitment occurred between May 1, 2018 and February 13, 2019. Researchers scheduled consent sessions with eligible individuals in a private room at the prison facility. Each meeting began with screening questions to confirm that the participant planned to release to a study county and determine whether the individual is conversational in English and cognitively capable to participate in a prison reentry program. Individuals were deemed eligible if they could demonstrate understanding of informed consent by responding to a five-question screener; for example, is participating in this study voluntary? Once individuals provided informed consent to participate in the study, interviews were conducted with those participants immediately following consent. The research interviews typically lasted approximately two hours where the questions were read aloud by the trained interviewer using the REDCap Mobile app, a computer-assisted interview software. Within the research, interview packet was the RWAT. The data for the current study are drawn from those baseline RWAT interviews.
Participants
The study sample was 1,539. Details on participant demographics can be seen in Table 2. The average age of the sample was 36.74 years old (SD = 11.07). Approximately 49% of participants identified themselves as Black, 33% identified as White, and 9% of both identified as either Latine or other/multiracial. A majority of participants identified themselves as male (90%) and single/not in a relationship (78%). Education level at the time of interview was higher than expected with 25% reporting less than a high school diploma or its equivalent. A little over half of the participants (54%) reported working at least part-time prior to their incarceration. On average, participants had been incarcerated 1.57 (SD = 1.61) times previously in their respective state, and the mean number of years for their current sentence was 5.46 (SD = 6.49). Among those individuals in the study, 39.31% had ever been convicted of a violent offense in their respective state, and most were at a low custody level (62.64%) prior to their release from prison.
Participant Demographics (N = 1,539).
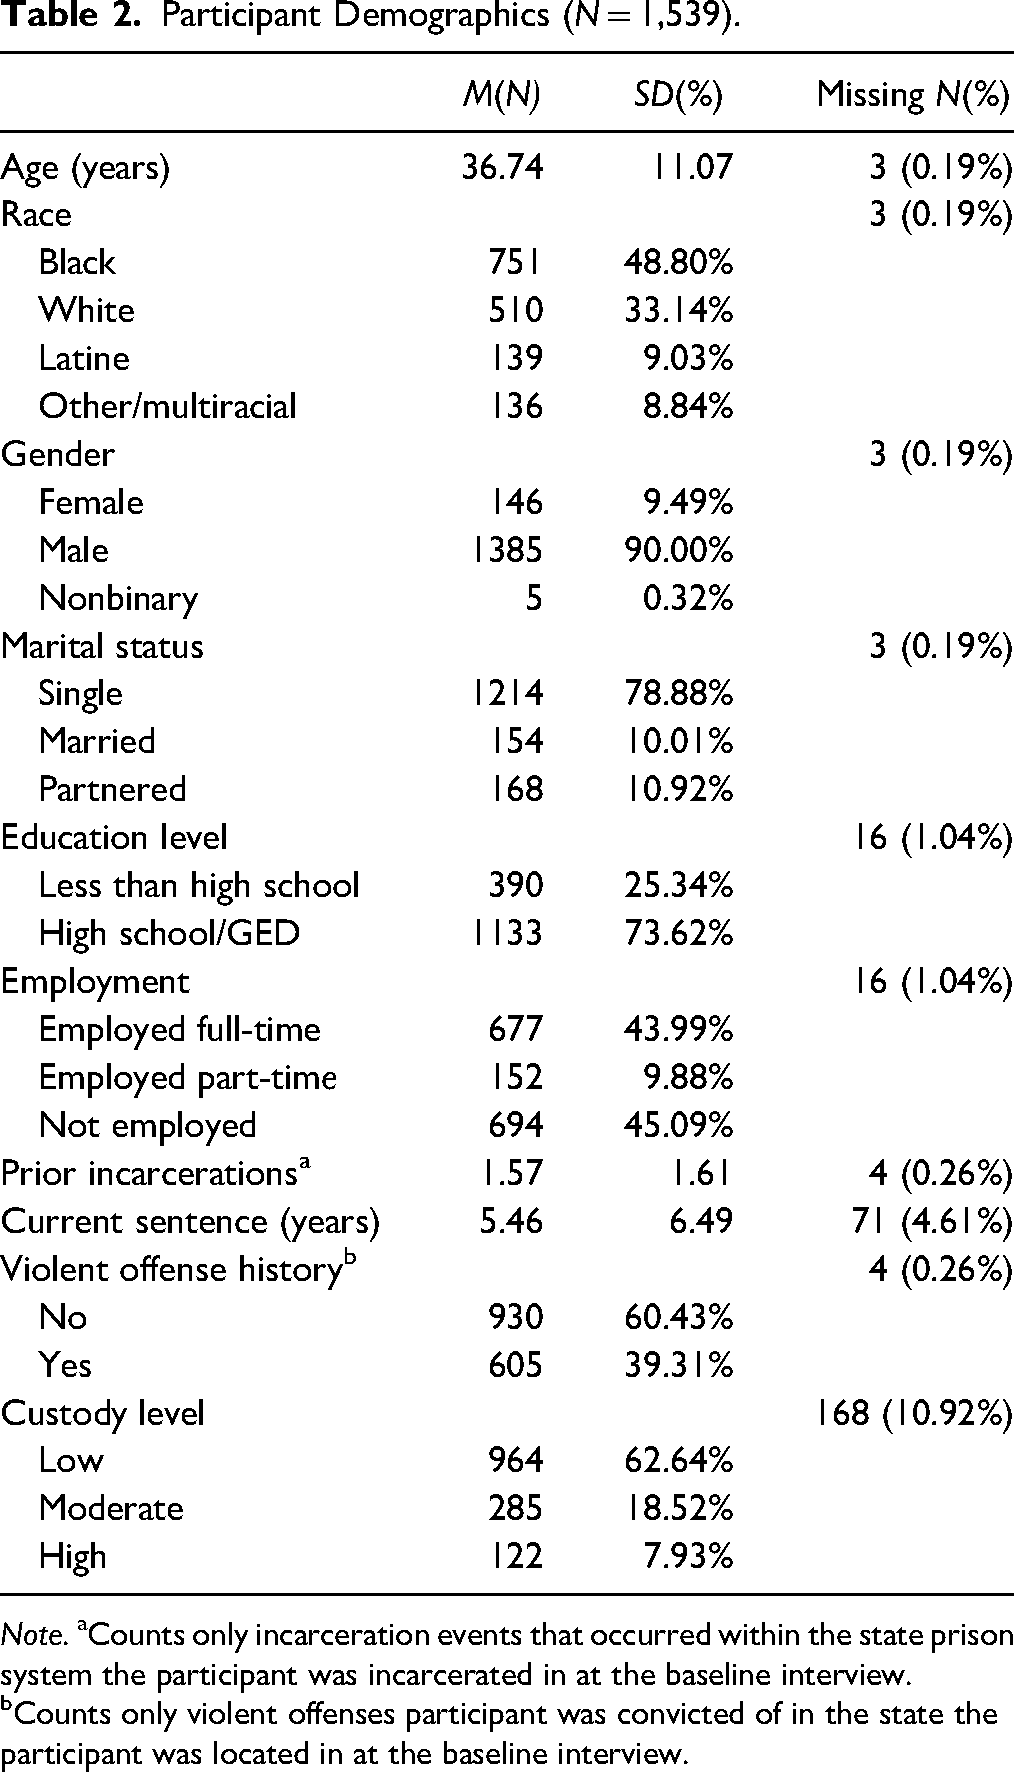
Note. aCounts only incarceration events that occurred within the state prison system the participant was incarcerated in at the baseline interview.
Counts only violent offenses participant was convicted of in the state the participant was located in at the baseline interview.
Sample Size and Power
An item-to-participants ratio between 1:10 and 1:20 is recommended to have adequate power to estimate a factor model (Mundfrom et al., 2005). This study's item-to-participants ratio of 1:11.49 meets the benchmark for power.
Measures
Cognitive Flexibility Inventory
The CFIn is a 20-item measure that was designed to assess an individual's ability to challenge and replace maladaptive thoughts (Dennis & Vander Wal, 2010). The CFIn is a multidimensional measure that captures two unidimensional aspects of cognitive flexibility. The Alternatives subscale comprises 13 items to measure the ability to generate alternative explanations and solutions to a difficult situation (Dennis & Vander Wal, 2010). The Control subscale comprises seven items to measure the ability to perceive difficult situations as controllable (Dennis & Vander Wal, 2010). All items on the CFIn used a 7-point Likert scale from strongly disagree to strongly agree. In the initial validation study with 196 college undergraduates, the CFIn demonstrated excellent internal consistency as measured by Cronbach's α (Alternatives subscale = 0.91; Control subscale = 0.84) and strong test-retest reliability over a seven-week period (Alternatives subscale [r = 0.75]; Control subscale [r = 0.77]; Dennis & Vander Wal, 2010). Limited psychometrics analyses have been done on the CFIn beyond this initial validation study with Australian older adults and university students in Italy and Iran, but the reliability of the Alternatives scale ranged between 0.82 and 0.91 and the Control scale ranged between 0.75 and 0.87 (Johnco et al., 2014; Kurginyan & Osavolyuk, 2018; Portoghese et al., 2020).
Herth Hope Index
The HHI is a 12-item measure created to assess hope in a clinical setting, particularly for ill and elderly patients (Herth, 1992). The HHI conceptualizes the measurement of hope as multidimensional with three subscales, with four items each. The three subscales are labeled as temporality and future (i.e., the cognitive-temporal dimension), positive readiness and expectancy (i.e., the affective-behavioral dimension), and interconnectedness (i.e., the affiliative-contextual dimension). Items on the HHI used a 4-point Likert scale from strongly disagree to strongly agree. The first validation study by Herth (1992) used a sample of 172 ill adults accessing healthcare services via inpatient, outpatient, and home care. Results from Herth (1992) showed adequate internal consistency across the three subscales (α = 0.78–0.86) and the total score (α = 0.97); however, a 2-week test-retest reliability was only reported for the total score that combined the three scale dimensions (r = 0.91; Herth, 1992).
Toronto Empathy Questionnaire
The TEQ is a 16-item measure designed to create a unidimensional assessment of empathy. TEQ items use a 5-point Likert scale from never to always to indicate how frequently a respondent experiences each item. Spreng et al. (2009) conducted a series of exploratory factor analyses (EFA) with a sample of 200 college undergraduates on 55 existing items that measured empathy to identify a set of common items across the different empathy scales. A forced one-factor model identified 16 items that loaded at 0.40 or greater. Then in a follow-up, unconstrained EFA focused on these 16 items, results showed a discontinuity in eigenvalues between one factor (5.23) and two factors (1.43; Spreng et al., 2009). Initial validation of this 16-item, one-factor TEQ demonstrated the measure to have good internal consistency (α = 0.85) and test-retest reliability (r = 0.81; Spreng et al., 2009).
Brief COPE
The BC is a 28-item measure with 14 subscales to assess a range of coping styles. Participants are asked to respond with a 4-point Likert scale that ranges between I don't do this at all to I do this a lot (Carver, 1997). The types of coping assessed by the BC are self-distraction, active coping, denial, substance use, emotional support, instrumental support, behavioral disengagement, venting, positive reframing, planning, humor, acceptance, religion, and self-blame. Initial validation of the BC was completed by Carver (1997) with a sample of 168 adults impacted by a major hurricane; however low reliability (α <0.50) was found for a number of the two-item scales. The original design of the BC was meant to be used adaptively depending on the “needs and imagination of the researcher using them” (Carver, 1997, p. 99).
Given this flexible design, the existing research on the BC has used a variety of statistical approaches (e.g., both exploratory factory analysis and CFA) but failed to find a consensus factor structure (Power et al., 2021). Nevertheless, there have been two studies that evaluated the psychometric properties of the BC in a sample of individuals in the criminal justice system. The first by Lynch et al. (2012) analyzed 168 incarcerated women with principal component analyses and identified a two-factor with 19 of the 28 BC items that included a 13-item adaptive coping measure (α = 0.85) and a six-item maladaptive coping measure (α = 0.72). A more recent study by Power et al. (2021) used EFA to identify an eight-factor structure based on 23 of the 28 BC items with a sample of 377 adults incarcerated in Canadian correctional facilities. The eight factors were support seeking (α = 0.86), acceptance (α = 0.76), disengagement (α = 0.75), active coping (α = 0.64), substance use (α = 0.90), humor (α = 0.78), religion (α = 0.83) and self-blame (α = 0.77; Power et al., 2021).
Social Provisions Scale—Reassurance of Worth
The SPS is an assessment to which respondents perceive their social network provides six different dimensions of support. In contrast to the QRI, the SPS does not ask the respondent to think about a specific relationship but rather about their social relationships more generally (Cutrona & Russell, 1987). The SPS is based on Weiss’s (1974) theory of the six functions of a social relationship: attachment, social integration, guidance, reliable alliance, reassurance of worth, and opportunity for nurturance. Like the QRI, not all SPS subscales were used. The items that comprise the SPS reassurance of worth subscale were determined by the research team to be most aligned with the definition of positive interpersonal relationships in the WBDM and thus were the only items included in the RWAT for parsimony. Participants respond to SPS items using a 4-point Likert scale from strongly disagree to strongly agree. Validation of the SPS subscales was conducted with a sample of 1,792 individuals, which included 1,183 college undergraduates, 302 public school teachers, and 306 nurses from a military hospital (Cutrona & Russell, 1987). Results on internal consistency (α = 0.67; Cutrona & Russell, 1987) were not strong in the original sample, but the research team determined the reassurance of worth subscale items was the best available self-report measure of social support publicly available that measured this dimension of positive interpersonal relationships.
Quality of Relationship Inventory—Depth
The QRI is a 25-item relationship-specific measure of social support. The QRI asks a respondent to rate the availability of support, interpersonal conflict, and relationship depth for two significant interpersonal relationships: the person they feel closest to and the person they spend the most time with (Pierce et al., 1991). For the RWAT, the depth subscale was the only construct used for analysis in order to reduce redundancies with items on the SPS that were also selected to measure the positive interpersonal relationships key in the WBDM. The QRI depth items are measured on a 4-point Likert scale from not at all to very much. Validation of the QRI depth subscale was first completed with 210 college undergraduates; results found the QRI depth to have strong internal consistency across a range of significant relationships identified by respondents (i.e., mother [α = 0.83], father [α = 0.86], and friend [α = 0.84]; Pierce et al., 1991).
Education/Employment Aspiration and Satisfaction
EEAS is a 13-item measure developed to assess four distinct dimensions: employment aspiration, education aspiration, employment satisfaction, and education satisfaction (Rich & Delgado, 2010). The EEAS was developed for individuals participating in mental health outpatient treatment. Respondents are asked to rate their level of agreement on a 4-point Likert scale from strongly disagree to strongly agree. The only psychometric analysis conducted on this measure was completed by the creators. Rich and Delgado (2010) studied the EEAS in a sample of 358 adults enrolled in mental health outpatient services and found the four scales to have reliability between 0.79 and 0.90. Validity of the EEAS items was supported by a series of bivariate comparisons. First. individuals who completed a work recovery plan reported higher scores on the employment aspiration scale; individuals who were not working or volunteering reported lower scores on employment satisfaction; individuals with a completed education recovery plan reported higher scores on education aspiration; and a positive correlation was found between educational satisfaction and the level of school completed by an individual (Rich & Delgado, 2010).
Guernsey Community Participation and Leisure Assessment
The Guernsey CPLA is a nine-item scale that asks respondents about both the frequency of participation across different domains of activity and leisure as well as the mode of contact most often used by the individual (Baker, 2000). The CPLA was developed for two purposes with individual with intellectual disabilities. First, to identify community participation and leisure needs of the individual, and second, to monitor the outcome of interventions that are attempting to increase community participation and leisure activities (Baker, 2000). The only psychometric analysis on the CPLA was completed by the measure developer using individuals with intellectual disabilities in the United Kingdom. The first sample included 12 individuals who lived in two public residential facilities for individuals with intellectual disabilities, and the second group of nine attend two adult training centers. Inter-rater reliability was assessed by having both the home supervisor and the individual's keyworker for the sample of 12 complete the CPLA, which found acceptable levels of reliability (α >0.70; Baker, 2000). Test-retest reliability used the nine individuals from the adult training centers and their care workers; results showed acceptable reliability across the different items (Baker, 2000). Internal reliability was higher for both the frequency items (α = 0.93) and the mode of contact items (α = 0.82; Baker, 2000). Moreover, concurrent validity was supported by a positive correlation to an adaptive behavior scale (r = .33) and a small negative correlation with a measure of problem behaviors (r = −0.11; Baker, 2000).
For the current study, the nine items that assessed the frequency of participation were adapted for leisure activities that could be completed by an individual while incarcerated. Adaptation of the items was guided by consensus agreement among the research team members on how-to-word questions suitable for the controlled environment of incarceration. These adapted items were then cognitively tested with individuals with incarceration histories to ensure the wording was consistent with the type of community and leisure experiences they had during their time incarcerated. Given the controlled environment of a prison, the items that assess the mode of contact (e.g., as part of a program, on their own, or with a friend) while participating in each activity were dropped for these baseline items.
Life Balance Assessment
The LBA is a measure of individual's actual time-use profile compared to one's ideal time-use profile across major life domains. The assumption behind the creation of the LBA is that a balanced person is one who spreads their time out fairly evenly across major domains of life while also feeling that one's use of time approximates how one would ideally like to use their time on an average day (Sheldon et al., 2010). The major life domains identified on the LBA are sleeping, school, paid work, household chores, community, recreation, commuting, personal relationships, health and self-maintenance, spirituality or religion, and an “other” category for any time used outside the other life domains (Sheldon et al., 2010). Development of the LBA was conducted with a split sample of 350 undergraduate students in the United States (n = 196) and India (n = 154). No measure of reliability was assessed in the initial validation study. Validity was assessed with a positive correlation between life balance and positive/negative affect (r = .32; Sheldon et al., 2010). In a second study of college undergraduates, life balance was also associated with less time stress (β = −0.49; Sheldon et al., 2010). No further psychometric work has been completed beyond the initial validation of the LBA.
Plan of Analysis
Step 1: Item-Scaling Analysis
The first step in the analysis plan was an examination of every item across all nine measures to assess for item-level distributions and to collapse any underused response option for an item (<5% response rate). The assessment of item-level distributions was conducted to determine whether each scale should be treated as categorical or continuous. Given that all nine of the measures within the RWAT use multiple-ordered categories on a Likert scale, the estimator of weighted least squares multivariate (WLSMV) would be the correct estimator to use for all analyses moving forward (Rhemtulla et al., 2012). The type of estimator is important because the use of the WLSMV estimator with items that have ordinal response categories provides global fit indices and is equivalent to the normal ogive model in traditional IRT software (Beaujean & Sheng, 2010).
Step 2: Factor-Level and Item-Level Analyses
After the item-scaling analysis was completed, CFAs using Mplus 8.5 were conducted in the following stepwise process. IRT departs from the assumption of classical test theory that a longer measure with more items will more effectively capture the assessed construct (Demars, 2010). IRT instead aims to develop the most precise measure using only the best-performing items. IRT uses this approach because the inclusion of poorly performing items often works against the development of a precise measure in most cases. Every CFA model was run with all items freely estimated and the variance for all latent constructs set to one, which differs from the classical test theory approach to CFA where one item is constrained to one and the variance for all latent constructs is freely estimated.
First, CFA models were run for each unidimensional scale across the nine RWAT measures. Within each of these unidimensional models, item-level analysis was undertaken to identify potential redundancy and negative item loadings. This analysis helped to confirm the assumption of IRT that the item responses are unidimensional. Items were reviewed for removal based on standardized loadings (<0.20), recommended residual item correlation from modification indices, and the R2 for each item. When an item or items were identified for potential removal, the removal process moved forward in a stepwise fashion until no further items met the criteria for further removal.
CFA models at each step of analysis were compared using the fit indices of root mean square error of approximation (RMSEA), comparative fit index (CFI), and Tucker-Lewis index (TLI). Acceptable model fit was determined to be achieved with an RMSEA below 0.10 and CFI as well as TLI above 0.90 (Browne & Cudeck, 1993). Relative model fit across nested model specifications was considered using a chi-square difference test corrected for the WLSMV estimator.
Once unidimensionality was confirmed across the different measures, the analysis moved to multidimensional models to analyze both those core facilitators with multiple measurement dimensions as well as the final model with all unidimensional measure components of the RWAT combined. The first multidimensional model tested was based on the original WBDM configuration with the five keys correlated with each other. Second, the multidimensional model of the RWAT measures loading a second-order factor of reentry well-being was tested.
Data and study materials can be requested from the study's principal investigator, Carrie Pettus, at carrie@justicesystempatners.com.
Results
Participant Flow and Missing Data
All reported models include the full sample of 1,539 who completed the study's baseline interview.
Missing data was low across most variables, with most items reporting less than 2.75% missing. The exceptions were items on the CPLA and QRI. For the CPLA, the amount of missing data across the nine items ranged between 1.10% and 4.29%. The QRI was found to have the highest proportion of missing data with a range of 5.78%–6.63%, depending on the item. Given these rates of missing data, complete case analysis was run for each model using full information maximum likelihood, the default option in Mplus.
Step 1: Item-Scaling Analysis
Review of the items that originally comprised each of the nine RWAT measures uncovered a pattern in the response options used by the study participants. For seven of the nine measures, the response options on the lower end of the response scale were those found to be underused. The specifics for how each scale was recoded prior to conducting CFA modeling are detailed below.
Cognitive Flexibility Inventory
The 7-point response scale was found to have consistently lower use (< 5%) for the options of strongly disagree, disagree, and neutral. Items on the CFIn were recoded to condense these response options into a new combined category, thus creating a 4-point Likert scale for all items.
Herth Hope Index
Similar to the CFI, the response options in the HHI of strongly disagree and disagree were condensed to create a new 3-point Likert scale.
Toronto Empathy Questionnaire
For the TEQ, the response options of never, rarely, and sometimes were consistently underused by participants. These three response options were recoded into a new combined category, thus creating a 3-point Likert scale for these measure items.
Brief COPE
The BC was the most difficult to determine a consistent pattern in how the response options were used across the 28 items, which is to be expected given the BC has been found to be sample specific in prior studies (Power et al., 2021). Given the differences identified by item in how participants responded, an individualized approach on how to recode items was taken by looking at each pair of items originally grouped by Carver (1997) for each coping style.
The following items (see supplemental materials) were used in analysis with the measure's original 4-point Likert scale because participants were shown to be using the entire response scale consistently: bc3, bc5, bc8, bc9, bc10, bc13, bc15, bc18, bc21, bc22, bc23, bc26, bc27, and bc28. These items correspond to the following coping styles on the BC: instrumental support (bc10 and bc23), religion (bc22 and bc27), emotional support (bc5 and bc15), venting (bc9 and bc21), humor (bc18 and bc28), denial (bc3 and bc8), and self-blame (bc13 and bc26).
Recoding of the response options of never and rarely into a combined category was found to be needed for the following items: bc1, bc2, bc7, bc12, bc14, bc17, bc19, bc20, bc24, and bc25. The items correspond to the following coping styles: active (bc2 and bc7), planning (bc14 and bc25), positive reframing (bc12 and bc17), acceptance (bc20 and bc24), and self-distraction (bc1 and bc19). The result of this recoding created a 3-point response scale for the items.
Finally, a third set of items from the BC required the response options of often and always to be condensed. The items recoded were bc4, bc6, bc11, and bc16. The items correspond to the following coping styles: substance use (bc4 and bc11) and behavioral disengagement (bc6 and bc16). The result of this recoding created a 3-point response scale for the items.
Quality of Relationship Inventory—Depth
In terms of the Quality of Relationship Inventory items, the response options of not at all and a little were condensed to create a new 3-point Likert scale.
SPS—Reassurance of Worth
Items on the SPS were recoded to condense the response options of strongly disagree and disagree. The result of the item recoding created a 3-point response scale.
Education/Employment Aspiration and Satisfaction
Parallel to what was found with the SPS, the response options of strongly disagree and disagree were combined for these items. This recode created a 3-point response scale.
Community Participation and Leisure Assessment
Items on the CPLA items departed from the larger pattern found with the majority of the other RWAT measures. Rather than underusing the options on the lower end of the response scale (e.g., less often), participants were found to underuse the options on the higher end of the response scale (e.g., more often; aka weekly and daily). Thus, the response options of weekly and daily were combined to create a new 4-point Likert scale for these items.
Life Balance Assessment
The LBA was found to present a unique challenge for how to recode the items prior to CFA. The creators of the LBA intended respondents to report a numerical value for both the actual hours and the ideal hours the individual spent within each life domain for a typical 24-h day to compute a discrepancy score. Given the structure of response options for the other eight measures on the RWAT was in Likert format, an attempt was made to also recode values of hours spent into mutually exclusive categories that would approximate a Likert scale.
Based on a thorough review of the participant's discrepancy score distributions, the following initial recode was completed: −40.00 to −1.01 h equals −2.; −1.00 to −0.01 equals −1; zero hours equals 0; 0.01–1 h equals 1; and 1.01–40 h equals 2. Once this first recode was completed, distributions of these new categories were reviewed to ensure that participants provided a sufficient number of responses within each category. Based on this second review of the new recoded categories, it was determined to conduct a second recode that condensed these initial five response options into three response options. The final three response options were: negative discrepancy values equal −1; discrepancy value of zero equals 0; and positive discrepancy values equal 1.
Step 2: Factor-Level and Item-Level Analysis—Unidimensional Models
Cognitive Flexibility Inventory
The original factor structure identified by Dennis and Vander Wal (2010) included two unidimensional subscales and an overall total score for all items on the CFIn. First test was undertaken to test whether a single factor with all 20 items would fit the data well. This first combined model showed poor fit (x2(170) = 4725.37, p <.001; RMSEA = 0.13 [0.129–0.136]; CFI = 0.84; TLI = 0.82). Since this initial model fit was poor, the two subscales of Control and Alternatives were separated and tested individually. The full model with all original seven items on the Control subscale showed excellent model fit (x2(14) = 47.74, p <.001; RMSEA = 0.04 [0.028–0.052]; CFI = 0.97; TLI = 0.99). Next, the Alternative subscale was tested with all 13 items from the original scale developed by Dennis and Vander Wal (2010). The model fit for the 13-item Alternative subscale did not meet all recommended cutoffs (x2(65) = 1144.83, p <.001; RMSEA = 0.10 [0.099–0.110]; CFI = 0.95; TLI = 0.94). Review of modification indices found that items cfi18 and cfi20 showed considerable cross loading. With items cfi18 and cfi20 dropped, the final Alternatives model demonstrated excellent model-to-data fit (x2(44) = 565.35, p <.001; RMSEA = 0.09 [0.082–0.095]; CFI = 0.96; TLI = 0.95). Given the results of these models, it was decided to use the Control subscale and the Alternatives subscale has separate factors in all analyses moving forward.
Herth Hope Index
Similar to the CFIn, the original factor structure of the HHI developed by Herth (1992) included four unidimensional subscales and an overall total score. Analysis began with testing a single-factor model that included all 12 of the original HHI items. This combined model showed adequate model fit (x2(54) = 696.15, p <.001; RMSEA = 0.09 [0.082–0.094]; CFI = 0.97; TLI = 0.97). Given this combined model fit the data adequately, the HHI has a single-factor model that was carried forward for future analysis.
Toronto Empathy Questionnaire
Spreng et al. (2009) created the TEQ as a single factor with 16 items. Thus, the first model tested was a single factor with all 16 items, but this model showed a poor fit to the data (x2(104) = 1467.00, p <.001; RMSEA = 0.09 [0.088–0.097]; CFI = 0.91; TLI = 0.89). A review of modification indices, item loadings, and R2 values found that item teq11, “I become irritated when someone cries” did not fit well the remaining TEQ items. Thus, a second model was ran dropping teq11, this second model with 15 items did demonstrate good model-to-data fit (x2(90) = 1198.76, p <.001; RMSEA = 0.09 [0.085–0.094]; CFI = 0.92; TLI = 0.91). Chi-square difference test corrected for the WLSMV estimator found this second model to be a significant improvement (x2(14) = 268.24, p <.001).
Brief COPE
The BC was theorized by Carver (1997) to be a sample-dependent measure. Prior research has largely supported this hypothesis that there is not a reproducible structure to the BC across different samples (see Power et al., 2021). For the purposes of the RWAT, we wanted to investigate whether there was any type of coping factors that could be reproducible using different samples of adults incarcerated in state prison across multiple state locations.
In order to examine whether a reproducible structure to the BC could be found, the study authors conducted a second study using EFA with adults preparing for release from prison in different states than those used in the current study (Veeh et al., 2022). The findings from this analysis showed a structure of three factors: active coping (bc1, bc19, bc2, bc7, bc12, bc17, bc14, bc25, bc20, bc24, bc22, and bc27), support coping (bc5, bc15, bc9, bc10, and bc23), and low avoidant coping (bc8, bc4, bc11, bc6, bc16, bc13, and bc26; Veeh et al., 2022).
Active Coping
Support Coping. Initial model with the five items for the support coping factor showed poor model fit (x2(5) = 118.82, p <.001; RMSEA = 0.12 [0.105–0.142]; CFI = 0.98; TLI = 0.96). Examination of model results showed bc5 with the most cross loadings with other items as well a low standardized loading and R2 value relative to other scale items. With bc5 dropped, the final four-item support coping factor had an excellent model fit (x2(2) = 8.95, p <.05; RMSEA = 0.05 [0.019–0.082]; CFI = 0.99; TLI = 0.99).
Low Avoidant Coping
The initial five-item factor for low avoidant coping demonstrated poor model fit (x2(5) = 205.21, p <.001; RMSEA = 0.16 [0.144–0.182]; CFI = 0.78; TLI = 0.56). Review of model output identified item bc13 has the only item with multiple cross loadings and low R2 value relative to other scale items. The next four-item model with bc13 dropped showed good model-to-data fit (x2(2) = 8.07, p <.05; RMSEA = 0.05 [0.016–0.079]; CFI = 0.99; TLI = 0.97).
Quality of Relationship Inventory—Depth
The depth subscale from the QRI was created as a single factor with six items. The initial model analysis tested the six QRI items as a single factor and found excellent model-to-data fit with no modification (x2(9) = 50.02, p <.001; RMSEA = 0.06 [0.041–0.072]; CFI = 0.99; TLI = 0.99).
SPS—Reassurance of Worth
The original four-item scale for Reassurance of Worth showed a very poor model fit (x2(2) = 665.22, p <.001; RMSEA = 0.47 [0.437–0.496]; CFI = 0.88; TLI = 0.64). After a thorough review of the model output and discussion among study investigators, there was no viable way forward with the Reassurance of Worth items as a standalone scale. Described in the following section are the steps taken to see if any SPS items could be added with the QRI items to create a unidimensional measure.
Combined Measure of Quality of Relationship Inventory—Depth and SPS—Reassurance of Worth
A review by study investigators identified the items of sps3 and sps4 from the SPS—Reassurance of Worth as the most conceptually similar to the 6-item QRI—Depth scale. A preliminary model with sps3, sps4, and the six QRI items did not demonstrate adequate model-to-data fit (x2(20) = 1665.62, p <.001; RMSEA = 0.23 [0.223–0.242]; CFI = 0.88; TLI = 0.83). Review of the output for this eight-item factor that a decision would need to be made to choose either sps3 or sps4 for a final model. The consensus among study investigators identified sps4 as the best item to remain in the model. Final results for the seven-item factor with sps4 and the QRI items showed excellent model fit (x2(14) = 65.22, p <.001; RMSEA = 0.05 [0.037–0.061]; CFI = 0.99; TLI = 0.99).
Education/Employment Aspiration and Satisfaction
Confirmatory factors analysis for each of the four scales of education aspiration, employment aspiration, education satisfaction, and employment satisfaction was completed with no modifications. The only model that was not just identified with more than three items comprising the factor was the education aspiration scale. The four-item education aspirations scale showed excellent model-to-data fit with no modifications (x2(2) = 2.45, p = 0.29; RMSEA = 0.01 [0.000–0.054]; CFI = 1.00; TLI = 1.00). The remaining models were all just identified with only three items per factor. A review of local fit for all three of these subscales showed significant standardized loadings that ranged between 0.72 and 0.95. Thresholds were also examined to confirm adequate local fit. Since the items had three response categories, two threshold values were reported for each item. All threshold values were correctly ordered in value relative to the response categories for each item. Moreover, there were no large differences in the threshold values for each item, with the largest difference being 2.15.
Community Participation and Leisure Assessment
The adapted version of the CPLA was found to have an excellent model fit with no modification (x2(27) = 255.73, p <.001; RMSEA = 0.07 [0.066–0.083]; CFI = 0.94; TLI = 0.92).
Life Balance Assessment
Following the recode of the LBA items from number of hours to a categorized variable as described above in the item-scaling analysis, an initial model was run with the nine LBA items excluding lba1. This initial model showed poor model fit (x2(27) = 237.00, p <.001; RMSEA = 0.07 [0.063–0.080]; CFI = 0.53; TLI = 0.37). After a review of the model output, it was decided that there was no viable way forward with the recoding scheme developed for this study. As an alternative, we returned to the original LBA data and instead computed a proportion value for each life domain based on a 24-hour day. This alternative model was estimated with maximum likelihood based on the continuous proportion data being used for each item. The alternative model with proportion data for the nine LBA life domains excluding sleep failed to converge. Based on these different attempts to identify a viable model for CFA, the study investigators came to the consensus to remove the LBA from any further analysis with the remaining RWAT measures. Future use of the LBA to compliment the RWAT will be detailed in the discussion section below.
Step 2: Factor-Level and Item-Level Analysis—Multidimensional Models
Completion of analysis on the unidimensional measures of the RWAT resulted in a total of 13 unidimensional measures meeting the benchmark for model-to-data fit. Next, the research team investigated whether the unidimensional measures associated with each of the WBDM core facilitators are measuring a shared latent factor.
Healthy Thinking Patterns
The original design of the RWAT, as guided by the definitions from the WBDM, posited that the measures of CFIn–Alternatives, CFIn—Control, HHI, and TEQ are different dimensions of a single underlying factor called Healthy Thinking Patterns. Now that each of these unidimensional pieces has been validated, the next CFA model tested the combination of these four measures as indicators of the second-order factor Healthy Thinking Patterns. Analysis of this second order model showed acceptable model-to-data fit with no modifications (x2(941) = 4,579.10, p <.001; RMSEA = 0.05 [0.049–0.052]; CFI = 0.93; TLI = 0.93).
Individual items loadings across CFIn—Alternatives, CFIn—Control, and HHI were statistically significant, and all were greater than 0.40. For the TEQ items, 13 of the 15 items also met these criteria. For the remaining two items of teq7 and teq15, the loadings were statistically significant, but the values were below 0.40 with 0.26 and 0.36, respectively. Each unidimensional factor showed significant association with the second-order factor with values between 0.44 and 0.82.
Effective Coping Strategies
Similar to Healthy Thinking Patterns, the original design of the RWAT identified that the three unidimensional factors of active coping, support coping, and low avoidant coping were indicators of the single underlying factor of Effective Coping Strategies. A test of this second-order model with the three coping factors found that the standard errors of the model could not be computed because of the relationship between the second-order factor of coping and the unidimensional factor of active coping.
Therefore, as a follow-up to the second-order model, a correlated model between all three factors of coping was tested. This initial correlated model showed adequate model-to-data fit (x2(87) = 759.77, p <.001; RMSEA = 0.07 [0.067–0.076]; CFI = 0.94; TLI = 0.93). Nevertheless, upon review of the model output for this initial correlated model, it was found that item bc26 on the low avoidant coping factor has a negative standardized loading. A second correlated model was then run with bc26 dropped from the model; this correlated three-factor coping model showed excellent model-to-data fit (x2(74) = 557.35, p <.001; RMSEA = 0.07 [0.060–0.071]; CFI = 0.96; TLI = 0.95).
Meaningful Work Trajectories
The four scales found for EEAS were tested to investigate whether they were indicators of the single underlying factor of Meaningful Work Trajectories. The second-order model that included these four scales found that the standard errors of the model could not be computed because of the relationship between the second-order factor of Meaningful Work Trajectories and the unidimensional factor of employment aspiration. In follow-up to the failure with the second-order model, a correlated model was tested with all four measures. The correlated model with all four factors showed satisfactory model-to-data fit with no modifications (x2(59) = 943.33, p <.001; RMSEA = 0.10 [0.094–0.105]; CFI = 0.98; TLI = 0.97).
RWAT Model
Original RWAT Model. Based on these findings that examined each of the unidimensional components of the RWAT, we tested the multidimensional model as hypothesized by the WBDM. This original model included each of the unidimensional measures grouped by its respective WBDM key facilitator. Despite the multidimensional models for the core facilitators of Meaningful Work Trajectories and Effective Coping Strategies not holding together as a second-order factor, we wanted to test whether they would operate better when combined into a single model. Results from this original WBDM model were found to not be positive definite, with the problematic item identified as eeas7 from the education satisfaction scale for Meaningful Work Trajectories.
RWAT Second Order Factor Model. Next, a multidimensional second-order model that only included the components validated by prior CFA results was tested. This included the multidimensional factor for Healthy Thinking Patterns but removed the multidimensional factors for Meaningful Work Trajectories and Effective Coping Strategies and replaced each of these with their respective unidimensional components. Similar to the first multidimensional model based on the WBDM, findings for this second model again showed the result to not be positive definite with the same item of eeas7 identified as causing the issue.
Meaningful Work Trajectories Update. Given the consistent results across these two multidimensional models identifying item eeas7 as problematic, the researchers returned to the correlated model for Meaningful Work Trajectories to determine whether any further changes could be made to improve model fit. Based on a review of the output from the final correlated model for Meaningful Work Trajectories, a notable correlation was identified between the measures of education aspiration and employment aspiration (r = 0.74). There were two remaining correlations between employment satisfaction and education satisfaction (r = 0.41) as well as employment satisfaction and employment aspiration (r = 0.34) that also rose above a value 0.30. All remaining correlations did not exceed the value of 0.11, with even a negative correlation found between education satisfaction and education aspiration (r = −0.07). Based on this pattern of correlations among the factors of Meaningful Work Trajectories, it was determined to test a model with only the correlations between education aspiration and employment aspiration as well as education satisfaction and employment satisfaction. This new model with a single aspiration correlation and single satisfaction correlation did show a better model fit that the original fully correlated model (x2(63) = 785.84, p <.001; RMSEA = 0.09 [0.081–0.092]; CFI = 0.98; TLI = 0.98). Chi-square difference test corrected for the WLSMV estimator also supported this as a significantly better model for Meaningful Work Trajectories (x2(4) = 157.49, p <.001). Moreover, an alternative model was also tested with a single employment correlation and a single education correlation; this alternative model showed significantly worse fit (x2(63) = 6,028.04, p <.001; RMSEA = 0.25 [0.244–0.254]; CFI = 0.87; TLI = 0.83).
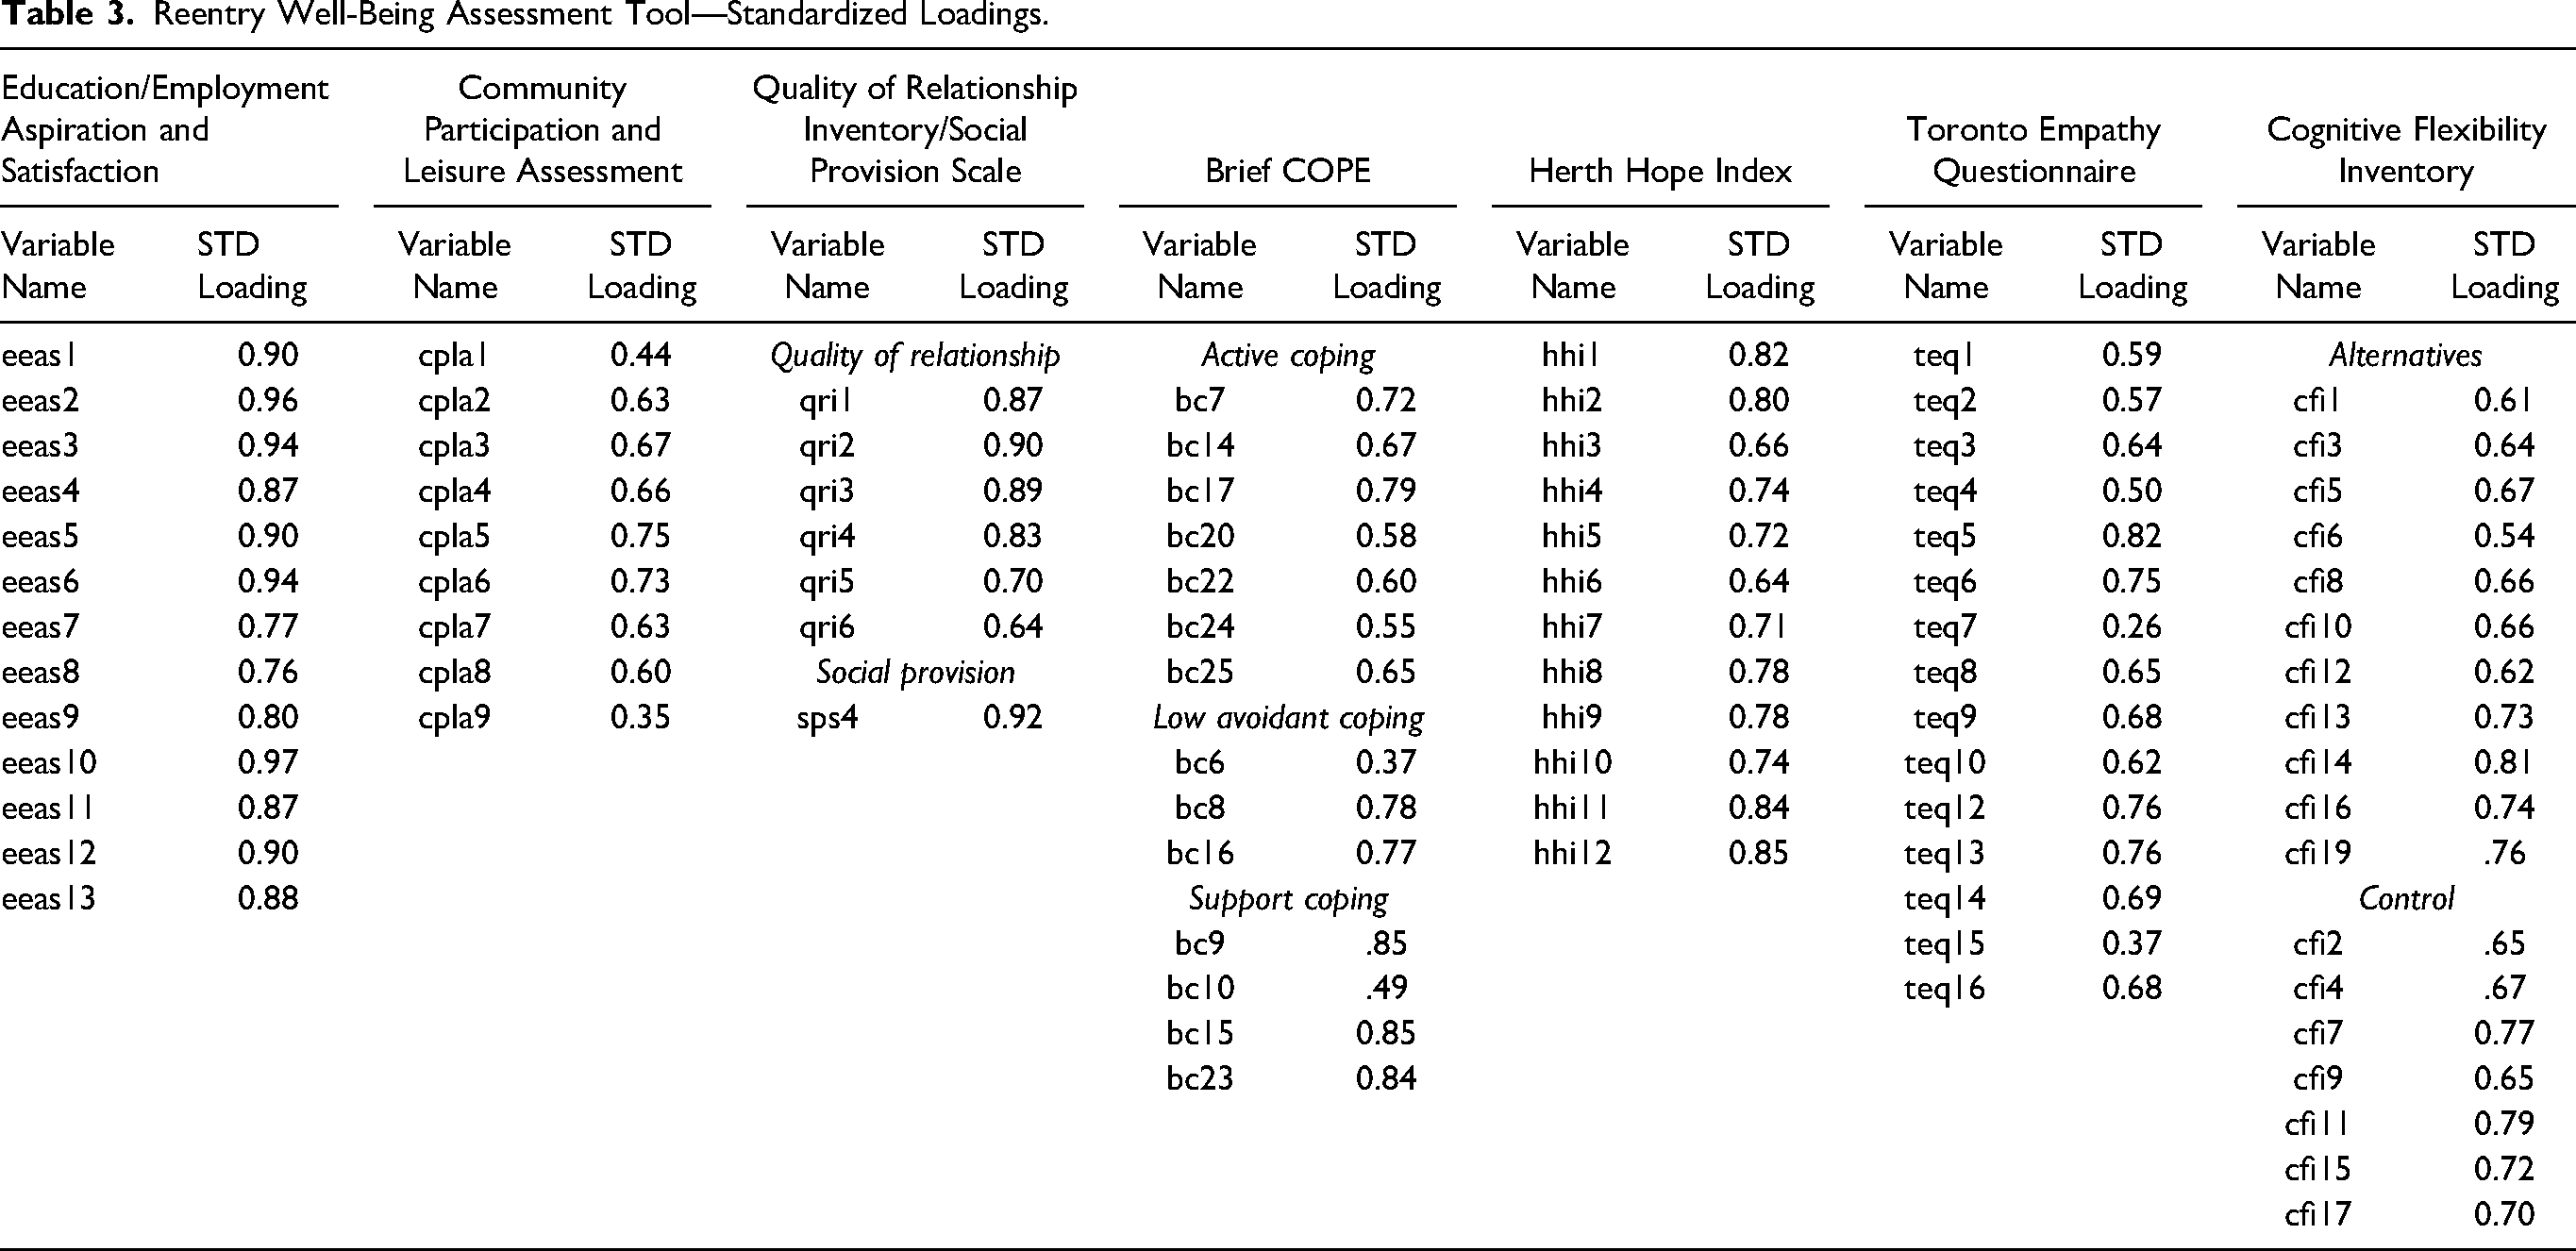
RWAT Second-Order Model With Meaningful Work Trajectories Update. The final CFA ran was an integration of the previous findings combined into a single model. Similar to before, we tested two multidimensional models with the new aspiration correlation and satisfaction correlation for Meaningful Work Trajectories. For the first model, the original WBDM model again showed the results to not be positive definite with the problem now involving the latent factor for Meaningful Work Trajectories. Next, the second model tested the new correlations for Meaningful Work Trajectories in a second-order model. This was proved to be our final model tested with no further modifications. Results from this updated second-order model showed adequate model-to-data fit (x2(3,724) = 12,564.27, p <.001; RMSEA = 0.04 [0.039–0.040]; CFI = 0.91; TLI = 0.91). The standardized loadings for all items were statistically significant and are detailed in Table 3 below. See Figure 1 for a graphical display of the final model.
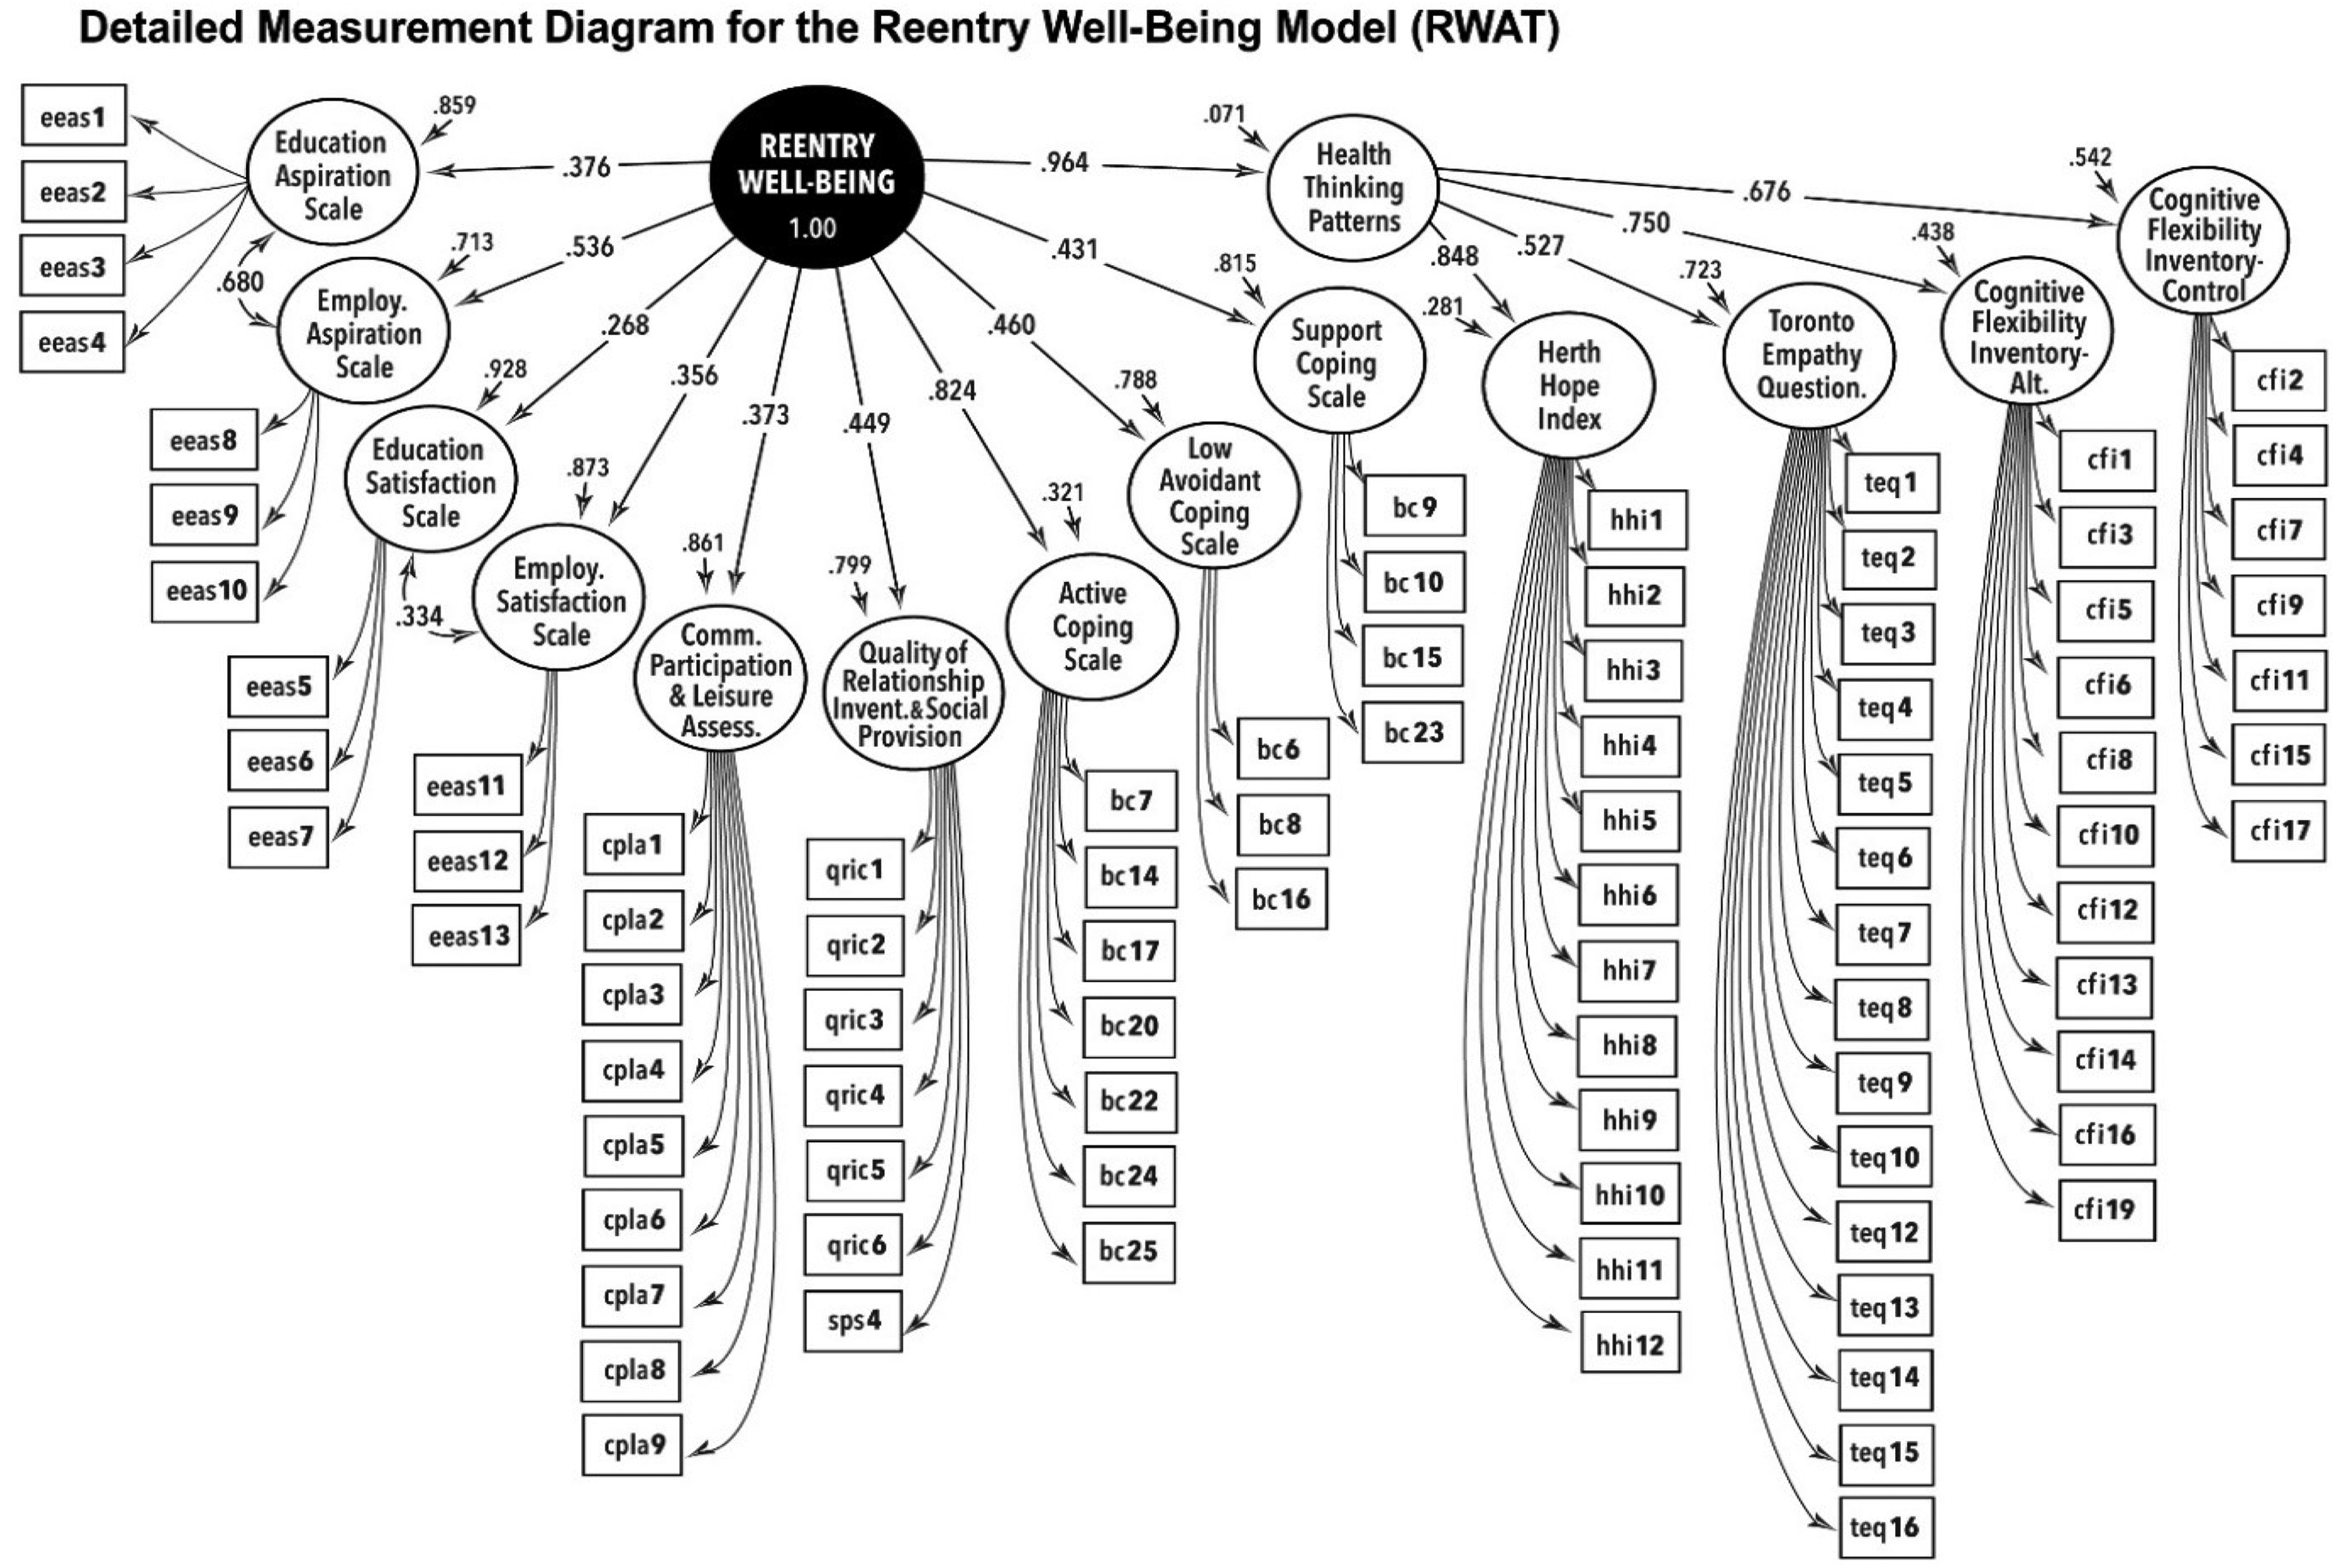
Reentry Well-Being Assessment Tool—Final Model.
Reentry Well-Being Assessment Tool—Standardized Loadings.
Discussion and Applications to Practice
Based on the study findings, the RWAT is a tool that demonstrates adequate factorial validity to assess the five key facilitators that comprise the WBDM. The final model for the RWAT is composed of seven scales containing 89 items. A finished version of the RWAT is provided in Figure 2. Overall, this study supports continued investigation into the RWAT as an alternative approach to measuring both individual and programmatic success during the reentry period.

Reentry Well-Being Assessment Tool.
The final RWAT model that achieved model-to-data fit confirmed that the set of measures in the RWAT fit together as dimensions of a shared concept we identify as reentry well-being. This set of measures was brought together to provide a new way to understand what factors are most likely to benefit the psychosocial well-being of individuals in the reentry timeframe. We believe this is the first study of its kind to assess factorial validity for a set of measures to assess characteristics of well-being on a large sample of individuals preparing for release from incarceration. These results represent an important step away from a single focus on risk to a more holistic view of individuals participating in correctional rehabilitation like prison reentry programs.
As detailed in the WBDM by (Pettus et al., 2021), assessment of risk will remain an important aspect of individuals involved in the criminal justice system. What the WBDM and, in turn, the RWAT is attempting to do is provide a more dynamic and holistic view of both incarcerated and formerly incarcerated individuals as greater than their life's worst decisions. A more expansive view of this population is particularly important for researchers and practitioners who want to provide effective and engaging services that can benefit the formerly incarcerated for the long term. When using the RWAT with an individual transitioning from incarceration, the strengths-based focus of the RWAT (i.e., improved well-being) will help to re-orient the focus of both individual interactions between practitioner and client, as well as the overall program, away from a deterrence model where services are viewed as only a way to minimize individual risk towards a well-being model that is focused on building-up these individuals to be successful postrelease.
Reflecting on the results from the study, the infrequent use of the negative response categories across most of the RWAT measures suggests that typical Likert scale construction with equally weighted response options in both the affirmative and negative may need to be revisited. Positive factors such as those assessed for in the RWAT appear to be viewed by participants through a hopeful lens as an individual is preparing for release from incarceration. Researchers and practitioners that use measures such as the RWAT during a time filled with anticipation and hope for the future may need to provide more nuanced affirmative options to better assess variation across individuals. Future work with the RWAT could explore whether the same type of response patterns is also seen once formerly incarcerated individuals are released from prison and living back in the community. In the final version of the RWAT provided in Figure 2, we have maintained the original response items to help facilitate the replication of these current results in different samples of individuals returning from incarceration.
Conflicting findings with the measures originally proposed to assess the core facilitator of Positive Interpersonal Relationships led to the creation of a new combined measure. The SPS—Reassurance of Worth scale was not able to be validated; in contrast, the QRI—Depth scale was validated with no modifications. Based on the definition of Positive Interpersonal Relationships in the WBDM, study investigators determined the best way forward would be to salvage as much information as possible from the SPS. Given the SPS is already very brief at a total of four items, it required difficult decisions to be made regarding which SPS item would be most conceptually relevant for the RWAT. The item (sps4) was ultimately determined the best preforming item which was a welcomed result since it allows information regarding an individual's self-perceived worth to others to continue to be included in the RWAT. Future investigation is needed into whether the SPS—Reassurance of Worth items continues to fail to converge as a unidimensional measure even when formerly incarcerated individuals are back embedded in their community-based social relationships.
The adapted version of the CPLA used in this study was designed in an effort to assess an individual's use of leisure activities while incarcerated in order to prepare treatment planning post-release. The assessment of leisure was thought to be one of the most difficult to utilize effectively when an individual resides in a total institution like a prison where their movements and activities are strictly controlled. However, determining an individual's use of leisure time needs to at least be approximated to provide a practitioner with an initial understanding for treatment planning prior to release from incarceration. The finding that model-to-data fit was achieved without any modifications does suggest that the adapted CPLA is assessing meaningful information in regard to leisure time. Perhaps the most effective use of the CPLA adapted for incarceration is to act as a facilitator to a larger conversation by social workers working with this population around how leisure operates for the individual while their incarcerated and how that may compare or contrast to their use of leisure time during the reentry timeframe following release back to the community.
Important limitations need to be considered when interpreting the findings of this study. First, the primary objective of the study from which the current data was derived focused on the evaluation of a prison reentry program based on the WBDM, which also informs the RWAT. However, the ability to conduct additional investigation into convergent validity, discriminant validity, and predictive validity will require a future study where a range of relevant measures can be administered along with the core measures of the RWAT. Second, since the RWAT is based on the WDBM, there may be further aspects of reentry well-being that are outside the purview of the WDBM but would help to provide a more holistic picture of well-being as individuals transition out of incarceration. Third, this analysis only utilized a single wave of data that was collected six to eight months prior to their release from incarceration. A benefit from the current study based around the pilot of a reentry program is the ability to utilize the follow-up waves of data once individuals release to investigate the utility of the RWAT and its constituent measures longitudinally.
Moreover, all data collected in this investigation were based on self-report so there is always the risk of social desirability biasing the responses given by the incarcerated participants. For example, research conducted by Cummins (1998) into the measurement of life satisfaction, a construct related to well-being, demonstrated a consistent positivist bias—or the tendency to overestimate one's well-being, in participants’ responses. The current study findings mirror (Cummins, 1998) in that respondents infrequently rated themselves on the lower end of the response scale when answering questions focused on their well-being. In addition to exclusively relying on self-report to collect the data, there is also possible bias from the risk of common method variance since all data were collected via in-person interviews using the computer-assisted interview software of REDCap. Future work would possibly benefit from adopting a triangulation approach that also collects data on the participant's well-being from third-party stakeholders like social support and service providers to reinforce findings based on self-report data. Finally, while a strength of this study was the heterogenous sample of incarcerated individuals located across four different states, it is important to be mindful that these individuals did volunteer to participate in a pilot of a prison reentry program. The voluntary status of the current sample may have resulted in it having unique characteristics that are not representative of the total general population of incarcerated individuals across the United States. Therefore, it is vital that ongoing research to further validate the RWAT is conducted. Future research with the RWAT is described in more detail below.
Study participants represented a heterogenous sample of incarcerated individuals across four states that were geographically dispersed across the Eastern United States. These four states represent distinct prison systems and reentry contexts that these individuals must navigate following their release from prison. The diverse composition of the individuals who completed the RWAT in this study suggests that it will have favorable generalizability to other states as well. The ability of the RWAT to be used across different state prison systems also provides preliminary support that the measure of reentry well-being as captured in the different dimensions of the RWAT could eventually serve as a standardized measure of well-being across the field of prison reentry.
An important limitation on the generalizability of these findings is the small proportion of individuals who identify as either female (9.49%) or nonbinary (0.32%) in the study sample. Both females and nonbinary individuals represent populations that are unfortunately seeing increases in the rate of involvement with the criminal justice system. The use of the RWAT should be further validated in samples that are majority female or nonbinary to investigate whether the RWAT measures operate similarly to the current majority male sample. Understanding the psychometric properties of the RWAT with a female-only sample increases the suitability of its use in both the research and clinical setting.
While the current investigation was a critical first step in the creation of a measure of reentry well-being, there is future psychometric analysis and research that needs to be completed. We propose a future research agenda to build this knowledge. First, we believe more work should be completed specifically around the replication of a BC factor structure and utilize latent class analysis to see if we are able to distinguish group variations in coping styles among justice-involved individuals. In a similar fashion, research should be conducted to explore if the RWAT is appropriate to be used amongst different racial and ethnic populations and if the sensitivity of the measure remains amongst these groups. Validation of the RWAT with different racial and ethnic populations will improve the practical application and utility of the measure. Specifically utilizing an item response analysis focused on differential item functioning across different racial groups may identify important variations in reentry well-being that are relevant for both researchers and practitioners.
Moreover, considering clinical relevance and utility, it will be vital to test the longitudinal invariance of the different dimensions of the RWAT to further support that a comparison of factor means can be reliably made to detect change over time as an individual move through the reentry timeframe. Similarly, the test-retest reliability of the RWAT measures needs to be examined as well. Construct and discriminant validity analysis is also needed to test whether the RWAT model is both positively correlated with other well-being measures (i.e., Ryff Scale of Psychological Well-Being) and negatively correlated with measures that assess constructs of poor well-being like depression, anxiety, and stress.
The development and validation of the RWAT have important implications for social work grand challenge of smart decarceration. As researchers and practitioners seek new frameworks for thinking about reentry that extend beyond a sole focus on risk, they will need new tools to measure well-being and human potential within the reentry context. The RWAT is an innovative measure designed as a first step toward achieving these goals. The results presented in this report provide support that the RWAT needs to be further investigated to move it further toward consideration as a standardized and cohesive measure of reentry well-being to guide service delivery and program evaluation. Ultimately, the RWAT has the potential to amplify data-driven policy and practice reforms designed to help individuals develop well-being and thrive after they leave incarceration and return home.
Footnotes
Declaration of Conflicting Interests
The authors declared no potential conflicts of interest with respect to the research, authorship, and/or publication of this article.
Funding
The authors disclosed receipt of the following financial support for the research, authorship, and/or publication of this article: This work was supported by the Charles Koch Foundation.
Supplemental Material
Supplemental material for this article is available online.
References
Supplementary Material
Please find the following supplemental material available below.
For Open Access articles published under a Creative Commons License, all supplemental material carries the same license as the article it is associated with.
For non-Open Access articles published, all supplemental material carries a non-exclusive license, and permission requests for re-use of supplemental material or any part of supplemental material shall be sent directly to the copyright owner as specified in the copyright notice associated with the article.