
Abstract
Background. Over the past ten years, we carried out several comprehensive studies in the area of
Aim. The studies we present investigated if the
Method. We show traditional summative output-oriented results and more profound results based on our
Results. The results of five studies are summarized, and show an overall increase in the participants’ knowledge of
Keywords
According to the German Ministry of Economics and Technology, there was and still is a great demand over the last decade for teaching and training entrepreneurship in German universities, and also in the field of startup consulting. Starting a new company is a complex task, and requires that its founders possess a wide range of personality traits, competencies, and knowledge (Kriz & Auchter, 2006). In 2004, we began a series of studies in the area of entrepreneurship education with business simulations that simulate startup business processes, i.e. startup business simulations (Kriz, Auchter, & Wittenzellner, 2008). The purpose of our evaluation was to find out the extent to which the simulations contribute to the qualification and motivation of those who study to embark on an entrepreneurial path. Additionally, significant gender-based differences were identified in all of our studies. We examined the reasons for these gender differences and, on the basis of these insights, we also reviewed new approaches to gender-related seminar designs that seek to diminish these differences. We dedicated our latest study to the examination of the long-term effects of the EXIST priME Cup (further called EPC). Therefore, from 2012-2014 we used a follow-up survey to assess the long-term effects of the program on participants’ entrepreneurial competencies and behavior (Auchter & Kriz, 2014). In this article, we present the results from this study.
Entrepreneurship Education With Simulation Games
Startup simulations are business simulation games that teach the skills that are believed to be necessary for the successful management of tasks in a new company. The main focus is on the action and decision-making processes in the startup stage. The early stages of a startup provide prime examples of complex tasks. As a result, simulations provide a particularly appropriate learning environment (see Kriz et al., 2008; Low, Venkataraman, & Srivatsan, 1994; Neemuchwala, 2012).
So far only a few studies on general aspects of gaming for entrepreneurship training and education exist. The existing articles tend to focus on short-term effects (see Hindle, 2002; Rahn & Rehg, 2014; Wolfe, 2004; Wolfe & Bruton, 1994). Some publications describe business games for entrepreneurship education and their potential benefits. They do not, however, provide deeper empirical evidence of real learning effects (see Feldman, 1995; Murff & Teach, 2009; Thavikulwat, 1995). If a discussion of the longitudinal data of experiential entrepreneurship training takes place, it is unfortunately not explicitly connected to business games as experiential learning environments (see Parry, Wharton, & Fugate, 2003).
Our evaluation approach is unique; to date, no other thorough scientific assessment of the long-term effects of simulation game methodologies in entrepreneurship education has been completed. In our research, we were particularly interested in the effects of startup simulation games on the competencies, knowledge and motivation of participants (students in German universities) to start companies.
For the past 15 years, “TOPSIM START-UP” provided a newly-developed strategic entrepreneurship simulation game that concentrates on startups, and which realistically simulates the various stages of opening these businesses. The startup simulation was developed by the firm Topsim (now known as Tata Interactive Systems) in cooperation with the University of Applied Sciences Regensburg and the Hans Lindner Institute. The computer-supported business simulation game TOPSIM START-UP represents the complexity and relevant variables in several startup scenarios. The game covers all stages of a startup business; from collecting information and evaluating the business concept to transforming the idea into a successful company in a competitive environment (Auchter, 2003; Auchter & Keding, 2004). In all of the studies discussed in this article, the same simulation game is used (TATA Interactive Systems, 2007). The studies discussed in this article place a strong emphasis on a realistic simulation of the startup phases within the first two years of a new venture.
All participating teams go through seven phases:
Formation of teams and briefing of the game.
Obtaining information: The business idea is checked for practicality; the criteria include market size, competitive edge, and the financial feasibility of the business intention, among other factors.
Business plan: Teams are required to prepare a detailed business plan. The plan should contain an adequate description of all relevant characteristics of the proposed startup that will lead to success. The “Business Plan Assistant” software supports this document. This business plan is the basis for the allocation of business capital and the granting of loan support. Participants must also negotiate with capital providers at this stage.
Start-up: Decisions about constituents take place at this stage. These decisions include, but are not limited to, the legal structure of the startup, rent for the building or office, purchase of supplies for the business, and the appointment of personnel, as well as training.
Market entry/Competition: Competitors are the competing teams over a period of two years. Up to five teams compete against each other for up to eight quarters (2 years). One round in the simulation game is equal to one real business quarter. Every team has to make decisions each quarter. These decisions include purchases, hiring and dismissals, investments in machines, financing, and the composition of the marketing mix at the time of the newly-founded company’s market entry. A detailed reporting facility supports the decision-making and feedback processes for each company.
Conclusion/Evaluation of success: The winner is the team that achieves the best performance for one or a combination of criteria. Examples of the criteria used to determine the winner include company survival, annual cumulated surplus, the value of the startup’s shares, and development of the company value.
Debriefing: During this phase, individual and group debriefing on the experiences during the gameplay takes place. Participants discuss the differences and similarities between the game and reality and define the key lessons they learned from the simulation game.
The main goal of this startup business simulation game is to support the acquisition of competencies and professional knowledge for entrepreneurial and management activities and to foster the students’ motivation to launch startups.
Summative and Output-Oriented Evaluation Results in an Educational Program
The classic approach used to address the question of a startup business simulation game’s effectiveness as a tool for entrepreneurship education looks at the assessment results from students who participated in these games. This summative and output-oriented (Faria, 2001; Feinstein & Cannon, 2002; Gosen & Washbush, 2004; Kriz & Hense, 2006) approach shows how effective students believe the educational tool to be. In this approach, students rate their acceptance of the startup business simulation game as well as their learning experience, the motivational effects they experienced, and their overall satisfaction with their participation in the game. This assessment is completed using questionnaires after the debriefing stage (Kriz, Auchter, & Wittenzellner, 2011).
In part, our studies examine the learning effects and assessment feedback of university students participating in Germany’s national “EXIST priME Cup” (EPC) competition. This program was (and its successor is) carried out in approximately 150 German universities and 30 leading companies. From 2007-2012, more than 8,000 students participated in the competition and completed feedback questionnaires.
The annually organized EPC has four levels (see figure 1). The Campus Cup level teams compete within their university. The best two teams of each university are allowed to enter the next level, the Master Cup, in which teams from different universities compete. The two winning teams of each Master Cup enter the next level; the Professional Cup. Master and Professional Cups take place in universities and partner companies. The last level is the Champions Cup, in which the best student teams compete to win the German national championship. The German Federal Ministry of Economics and Technology funded the program from 2007 to 2012. Since 2013, the EPC has been organized and funded by the Primecup Academy AG, a private firm. The program is a voluntary activity for all currently-enrolled students at German universities, regardless of their department or course of study.
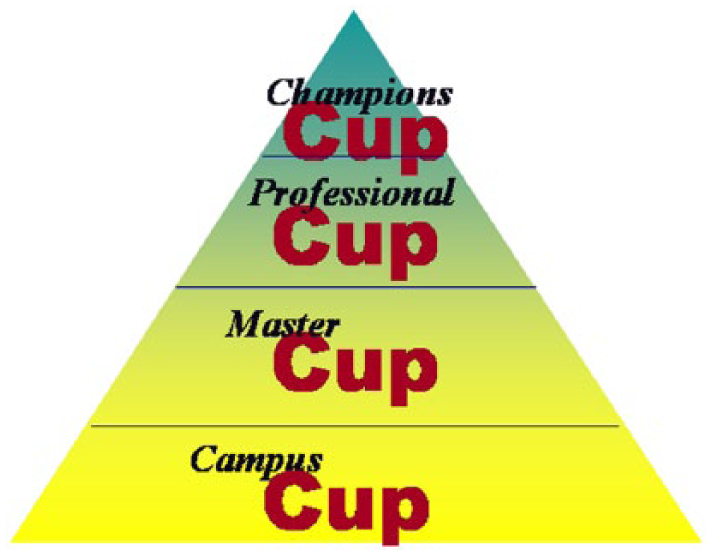
Structure of the EPC program.
On each level, the qualified student teams participate in two-day cup activities. In each cup activity, 4-6 teams of 3-6 members each compete against each other. Master Cup-level teams also have to present their results and defend their decisions. They are also expected to give clear and well-grounded statements about future strategies in front of a jury of real company founders and top managers of partner companies, as well as business professors from partner universities. The program uses the same business game for all levels, but the complexity and difficulty level increase as the teams proceed toward the Champions Cup.
For the summative assessment, an evaluation questionnaire is handed out after each cup activity. This questionnaire contains 33 assessment items on a 6-point Likert scale (1 = very good assessment or total agreement with a statement; 6 = very bad assessment or total disagreement with a statement). It also contains questions that are designed to gain knowledge of the participants’ sociodemographic data, personality aspects related to entrepreneurship research and pre-knowledge, experiences, and attitudes about topics such as business knowledge, teamwork, and simulation games. We used a special coding system for the participants that allowed us to link individual participant data at different cup levels (for those participants who qualified for the next levels). This system made it possible to calculate paired sample results.
The average rate of return for questionnaires in 2007-2012 was 97%, a very high percentage. In 2007, N = 815 students participated in the evaluation. The 2008 evaluation had N = 1706 participants, and in 2009 N = 1624 students participated. The 2010 questionnaire had N = 2090 respondents, and 2011’s questionnaire received N = 2665 replies. The last questionnaire, for 2012, received N = 3621 replies, bringing the total number of respondents to N = 12521 students in more than 500 cups. All significant results presented are significant on alpha probability value p<.001.
We performed a factor analysis with the data from all participants using the 33 assessment questions that remained constant for all four questionnaires of the four different cup levels (Eigenvalue > 1; varimax-rotation). We created six scales (additional analysis of reliability show high Cronbach Alphas >.86) and six factors explained more than 91% of the total variance:
Organization and facilitation of the simulation game (including assessment of facilitator quality and debriefing); 6 items
Room setting and time schedule; 2 items
Acquisition of personal and social skills through playing the game; 8 items
Satisfaction with the gameplay (competition and teamwork); 4 items
Acquisition and increase of business knowledge and entrepreneurship skills and increase in participant motivation to own a startup; 8 items
Overall satisfaction with cup event and game; 5 items
Our main research question examines the learning effects of numbers three and five in the list above. The other scales relate to the appreciation participants felt for the game. Therefore, we only display the results for numbers three, five and, to demonstrate the students’ satisfaction, number six (for more information see Kriz et al., 2011).
The results shown in Table 1 demonstrate a very positive assessment of all cup levels and on all dimensions. We calculated the average scores for each gameplay event and found that none of the 509 gameplays received a rating worse than M = 2.5 on a six-point scale (1= very good, 6=very bad).
Assessment of Startup Games in EPC (Means).
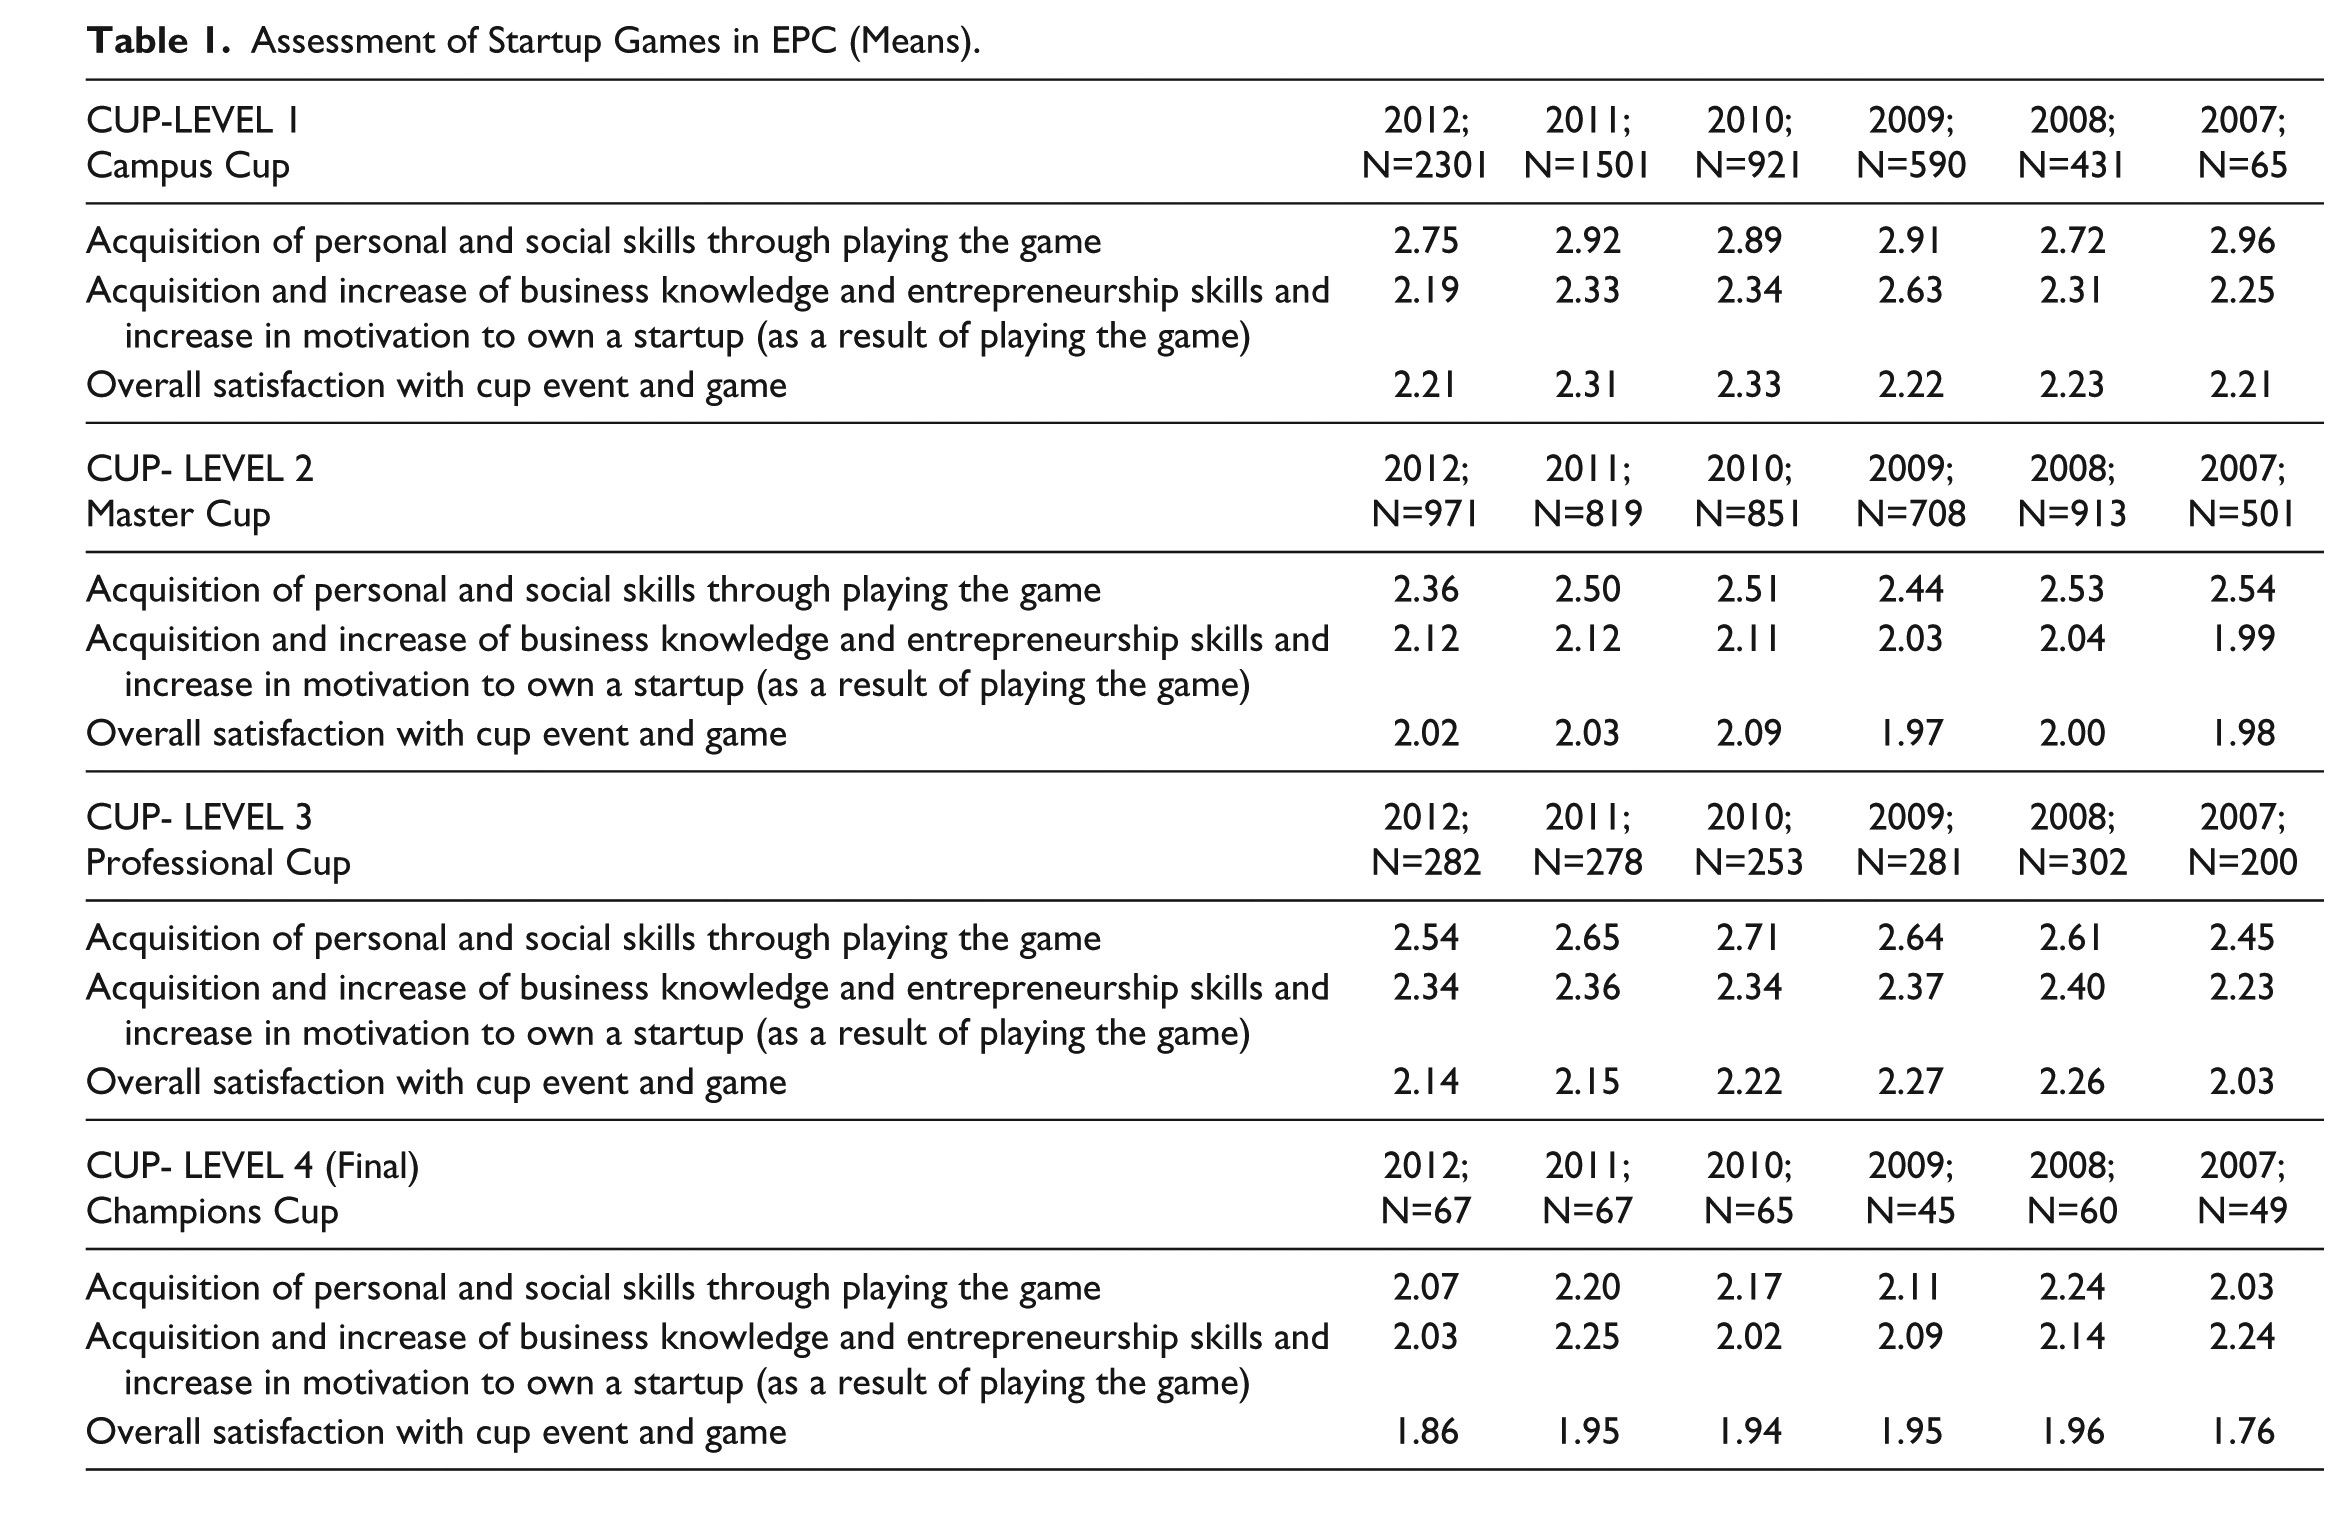
From 2010-2012, we asked participants to compare the learning effects and the motivational impact of the simulation game with those of traditional university management and entrepreneurship seminars that do not use simulation games. The mean results of M = 1.59 (learning effect) and M = 1.35 (motivational effect) show that the game is seen as much better suited to support learning and motivation than traditional seminars. For reference, 1 = very good assessment and 6 = very bad assessment.
The results allow us to support a conclusion that the program and simulation game used are successful for supporting learning and motivation in gaming at the level of a summative evaluation model. Students report an increase of competencies and entrepreneurial motivation through the simulation game. In general, the startup games and the EPC can be considered an effective educational method for entrepreneurship education from the students’ perspective. The startup simulation game has an outstanding degree of acceptance from the students’ perspective. Analyzing the questionnaires answered by participants from the different levels, we found a small decrease in all six years from the Master to the Professional level, as well as an increase at the Champions level. This effect is significant (several t-tests with paired samples). The main explanation is that participants on the Professional level see the lowest additional benefit or increase in their competencies. Other analysis based on several t-tests and analysis of variances methods showed that participants with higher entrepreneurial competence and predisposition assessed the cups significantly better and were more satisfied with the experience as well as their learning (Kriz et al., 2011). These participants were characterized by their higher attitude to risk, propensity to lead, belief in internal control/internal causal attribution, and motivation to achieve, as determined by data derived from additional questionnaires.
There are no significant differences in the assessments of different age groups or students from different courses of study. We found significant differences as verified by t-test between men and women. We discuss this gender effect in detail in the next sections of our article.
Such results from a summative and output-oriented approach are interesting and provide hints about the effects of a simulation game. According to Kirkpatrick and Kirkpatrick (1994) training evaluation model, however, they only show only the appreciation and satisfaction of the students and are not enough to prove real learning effects or long-term effects on behavior. We needed a more sophisticated approach that we present in the next sections.
The Theory-Based Evaluation Approach
Most research on the effects of simulation games attempts to answer summative evaluation questions. Summative evaluations, according to the terminology introduced by Scriven (1991), are aimed at making final judgments on the merit or worth of a finished product or program. Therefore, they focus on determining the outcomes or effects of a gaming simulation, as is the case with most the results presented in the preceding section. We began with a summary evaluation, and thus, output-oriented approach. Most studies concentrate on showing whether simulations are effective vis-à-vis an alternative teaching method (Wolfe, 1997), and therefore they fall short of investigating the specific conditions and factors that make a simulation game an effective learning tool. The problem of knowing if an educational method such as simulation gaming works is relevant only if we also know how it works (Bedwell, Pavlas, Heyne, Lazzara, & Salas, 2012; Hense, Kriz, &Wolfe, 2009; K. A. Wilson et al., 2009). Additionally, formative aims of our evaluation approach exist, such as creating a scientific basis for the further development of business games and contributing to the optimization of the cups program.
It is important to make two clarifications when using theory-oriented approaches to evaluation. The first clarification is terminological. Several labels for these approaches are used, including theory-driven evaluation (Chen, 1990, 2005), theory-based evaluation (Weiss, 1997), program theory evaluation (Rogers, Petrosino, Huebner, & Hacsi, 2000), and theory-oriented evaluation (Stame, 2004). A second clarification concerns the term theory. In the discussion of theory-oriented evaluation, it does not refer to a theory of evaluation. Instead, it refers to the theoretical assumptions that underlie the program evaluated and its evaluation design. Since the meaning of the term theory is not always clear and tends to be too strong in practical contexts, we prefer the term logic model (Hense & Kriz, 2008b; Kriz, Auchter & Wittenzellner, 2009).
The central thesis of the theory-oriented approach is that evaluations should be based on a logic model. The logic model explains how the interaction of a program, its participants, and its environment is expected to elicit the program’s desired outcomes. In the case of gaming simulations as learning tools, logic models must be based on theoretical assumptions and empirical evidence derived from learning psychology, education, and gaming simulation research and theory. The learning model should also describe how the simulation’s features, learner characteristics, and context conditions interact to generate its intended learning outcomes (Kriz & Hense, 2006).
Logic models typically consist of several variables that are relevant in the context of the evaluated program and state their mutual relationships. Usually, at least three kinds of variables are contained in a logic model. These are antecedent variables (input), variables related to program activities (process), and variables related to program effects (outcomes). Often, logic models are represented graphically with boxes and arrows depicting variables and their mutual causal relationships.
Our approach to evaluating the effectiveness of the startup simulation game used in the university courses was based on a logic model (see Figure 2). This model provides a framework for interpreting what takes place during a startup simulation. The logic model helps to identify those elements responsible for the learning processes that emanate from start-up business simulations. We derived all the variables in the logic model from previous research, including: research on simulations (Garris, Ahlers, & Driskell, 2002; Hindle, 2002; Kriz & Brandstätter, 2003); approaches to situated learning or ‘problem-oriented learning’ (Brown, Collins, & Duguid, 1989; Gruber, Law, Mandl, & Renkl, 1995); and more general models concerning the quality of teaching and the learning environment. Further, all dimensions (factors) in the logic model were measured using questionnaires, tests, and interviews involving participants (students) and facilitators.
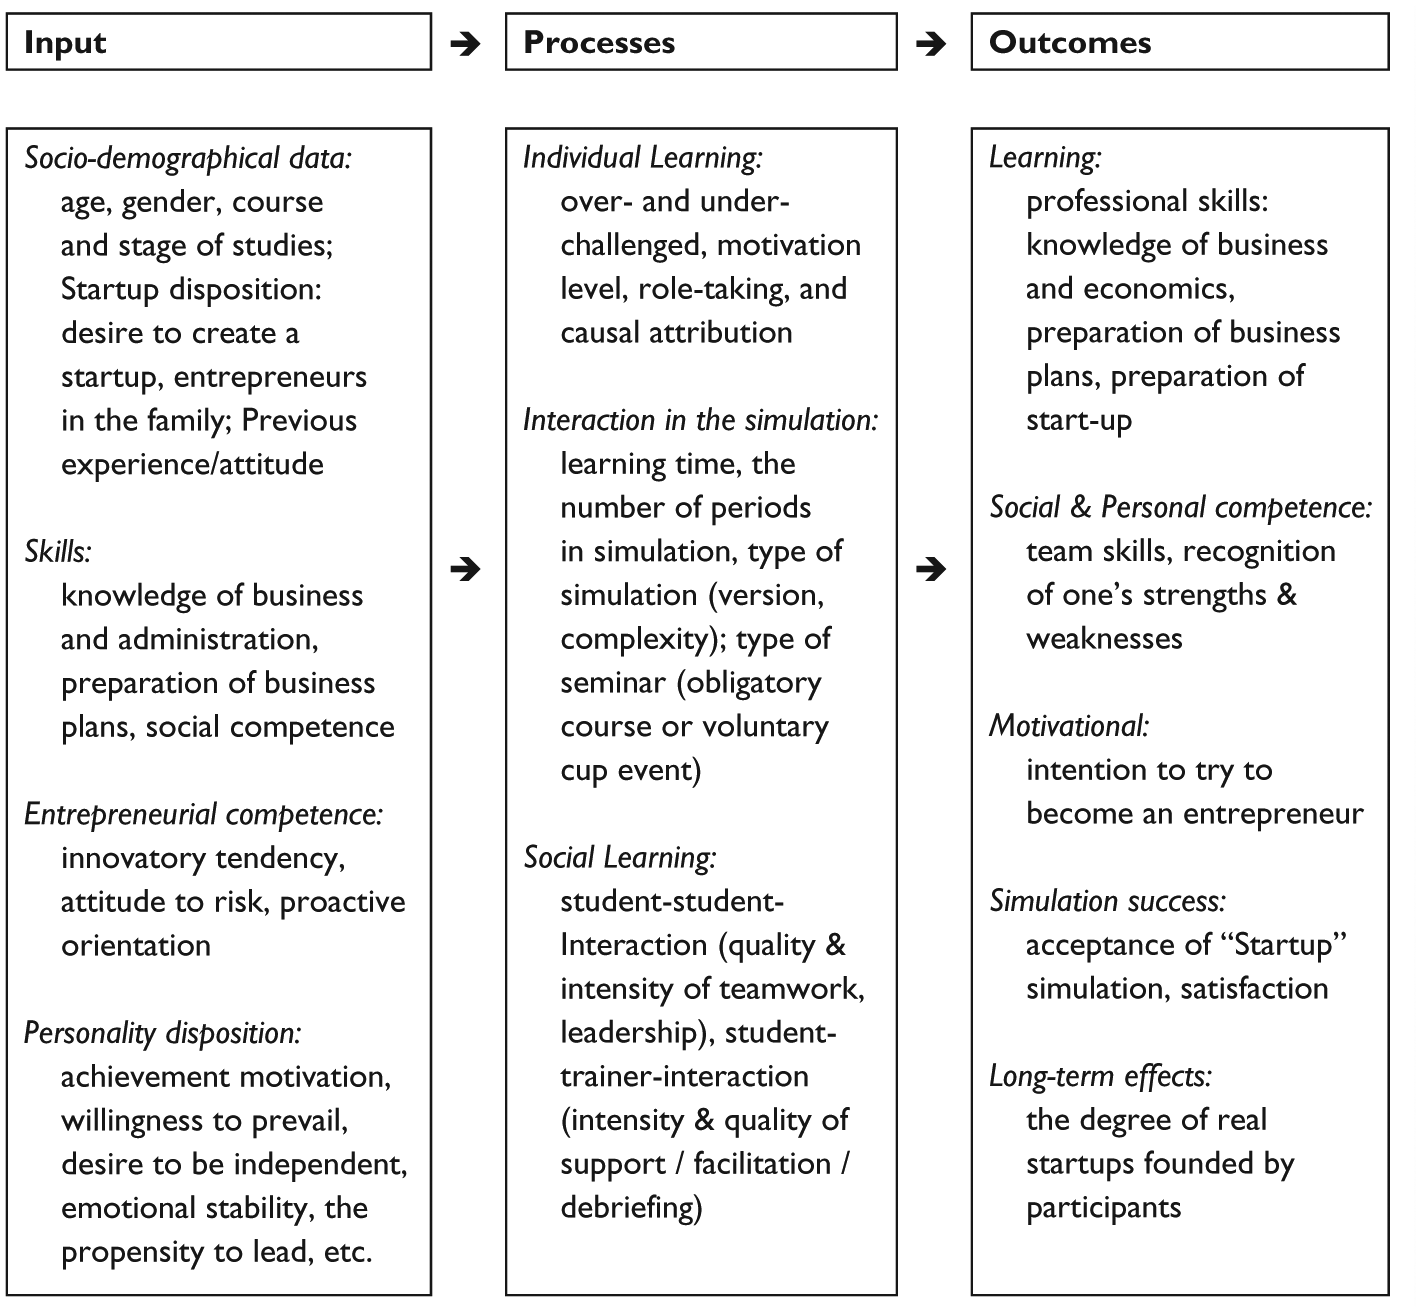
Logic model of entrepreneurship education with start-up simulations.
The input domain of the model comprises essential preconditions for learning in the game. On the students’ side, it contains primarily cognitive, motivational, and demographic aspects. Atkinson’s (1974) model of cumulative learning exemplifies the importance of prior knowledge and experience. Empirical studies have repeatedly confirmed that it is one of the most powerful predictors of learning success (Helmke & Weinert, 1997). Research has long neglected affective preconditions of learning such as motivation and expectancies, yet they are known to exert substantial influence on learning processes and outcomes (Pekrun & Schiefele, 1996). Students’ age was included in the model since, from the viewpoint of developmental psychology, it is expected to correlate significantly with learning. Finally, gender was included to take into account potential gender-specific predispositions concerning the preferred learning environment. In entrepreneurship and education, gender differences have been shown (Maxfield, 2007; F. Wilson, Kickul, & Marlino, 2007).
Brinckmann, Salomo, and Gemünden’s 2006 model describes technical, methodological, and social competencies. The model also describes entrepreneurial skills as key factors that led to the profit and market success of 180 German startup companies that took part in a research study carried out in 2005. There is significant discussion of entrepreneurial behavior as a success factor in the existing literature (e.g. Frank, Korunka, & Lueger, 2002). Entrepreneurial activities are widely believed to be traceable to specific bundles of competencies and motivation. Personality traits and positive examples in an entrepreneur’s family influence these bundles (Kriz et al., 2008). Competencies that make an individual stand out as an entrepreneur (as opposed to a manager) must be taken into account. There is a one to one correspondence between competence in this sense and the idea of entrepreneurial posture in the conceptual model of Covin and Slevin (1991). In this respect, entrepreneurial posture is made operational by three sub-features: risk taking (preference for highly risky projects with the chance of making a very high profit), proactive orientation (the willingness to initiate action and projects that competitors are forced to react to) and innovation (the willingness to innovate, even when this involves taking on risks). Therefore, personality traits and entrepreneurial competence were also included as input variables. In addition to the bundles of competencies, we explicitly recorded also the participants’ intention to found a startup (Krueger, Reilly, & Carsrud, 2000).
In the model’s process component, variables on three levels were incorporated: individual learning, social learning, and interactions with the learning environment. The specific variables included on each of these levels were mainly derived from the research on effective learning and teaching, as well as the simulation and gaming literature. The intensity of involvement variable stands for the individual learner’s degree of participation in the game. In cooperative learning settings, individuals can engage in social loafing and free-rider behavior. Hence, we included this variable (Salomon & Globerson, 1989).
Another condition of individual learning is the need for an optimal fit between task difficulty and learners’ abilities (Brophy & Good, 1986). The over-/under-challenged variables covered this aspect, and in contrast to all other factors of the model, were expected to exert a negative influence on student outcomes. Within the “interaction with the game” component, two aspects of Slavin’s (1994) well-known QUAIT-model were included (time-on-task and appropriateness), together with debriefing. Debriefing refers to the phase after playing the game. During debriefing, learners recapitulate what happened during the game, reflect on their learning experience and thus are expected to gain a deeper understanding of the subject matter (Hill & Lance, 2002; Kriz, 2010; Peters & Vissers, 2004).
Finally, important aspects of social and cooperative learning were considered (Slavin, 1990). Student-student interaction was divided into a quantitative element (intensity) and a qualititave element (quality). Intensity refers to the sheer amount of cooperation of an individual, and quality represents the degree to which cooperation was productive and task-directed. Similarly, the teacher-student interaction contained a quantitative and a qualitative component: instruction in the model described the amount of additional instructional input teachers delivered during the game. Support mirrors whether this input was adequate for helping the students during the learning process.
Elements in the model’s output domain were derived primarily from project materials and stakeholder input. The short-term outcomes comprised immediate cognitive, social and motivational learning effects, as well as students’ and facilitators’ acceptance of the game. While the short-term outcomes referred to operational goals the long-term outcomes represent goals that are not directly attainable during the EPC project’s runtime (see below for our new study on long-term effects).
Methodology and Hypotheses
We focused our interest on the following research question:
Is the use of a startup business simulation in university education programs an effective way of conveying the necessary competencies and increasing the motivation of the participants to start companies?
We conducted two studies into the use of a startup simulation game as a mandatory component of a university course. We developed three questionnaires to collect data concerning the variables described in Figure 2. We administered Questionnaire 1 before the startup simulation game commenced, and it served to measure the input variables. Participants received Questionnaire 2 during the business game. It measured the process variables. Questionnaire 3, administered after the business game, was used to measure the output variables, as well as to collect more data about the process variables. Where appropriate, the participants were asked to rate the questionnaire items on the basis of a 6-point Likert-type scale. We collected the data for Study 1 in 2005 and 2006. A total of 606 participants from five technical universities took part in the investigation of 31 startup simulations. Study 2 replicated Study 1 and included a total of 202 students who participated in 11 further training courses in 2006 at the same universities as in Study 1. In Study 2, however, a multiple-choice test was administere both pre- and post-simulation to assess the improvement in the students’ business knowledge. For more detailed information see Kriz and Auchter (2006).
Study 3 took place in 2009. Seven term-long simulation seminars based on the same startup simulation and the same methodology as studies 1 and 2 were carried out. The participants were business students (N = 99). To trace gender effects such as the ones we found in previous studies, (see results below), we designed this additional study by creating single-sex teams of either male or female participants. For more detailed information, see Auchter and Kriz (2011).
Study 4 was carried out in 2011-2012 as a further evaluation of the national competition. In this study, we initiated two specific changes in an attempt to enhance the impact of the national competition on the development of entrepreneurial competencies and motivation in female participants. We used a board-based (Riva-SysTeamsBusiness) simulation with the same contents of a phase within which participants developed business plans followed by a phase of simulating the management of the companies in competition with other teams. Next, we introduced an extended debriefing session into the board-based simulations. These special cups were for women only, and all the participants and instructors were female. The results we present below are based on 3 cup competition seminars with N = 64 women.
Study 5: Previous studies neglected an important part of our evaluation model; the examination of long-term effects. Therefore, from 2012-2014, we initiated a new study in the form of a follow-up survey of the game-based entrepreneurship competition EPC. This study aimed to assess the long-term effects of the program. Part of the online survey was a retrospective assessment of the cup seminars using a questionnaire with 16 items. The annual standard evaluation forms of the EPC used some these items in an identical form. Another part of the survey with N = 1217 former participants included several career-related questions about how the former participants evolved professionally after their participation (cf. Auchter & Kriz, 2013).
Results and Discussion
Studies 1 and 2
In studies 1 and 2, the relation of outcome variables with their potential predictors in the input and process variables (see the logic model for startups in Figure 2) was investigated via regression analyses. To maximize the analysis’ precision, we only used cases without missing data in the variables for regression (list-wise deletion). This resulted in a reduced sample size of N = 208 in study 1 and N = 86 in study 2. All variables derived from rating scales were z-standardized prior to the analysis. Overall, the combined factors of the input and process components of the models provided an explanation for 39% (Rcorr2) of the variance in students’ post-test scores (study 2), 53% of the variance in students’ post-game business knowledge, and 56% in students’ post-game business plan quality as assessed by their teachers (study 1) as well as for 58% (study 1) and 66% (study 2) of the variance in students’ post-game entrepreneurial intention and entrepreneurial self-confidence. The main significant factors (with highest beta values; β) of the four models are shown in Figure 3, as are the corrected partial correlations. They show that several input variables and process variables have a significant effect on the outcome variables.
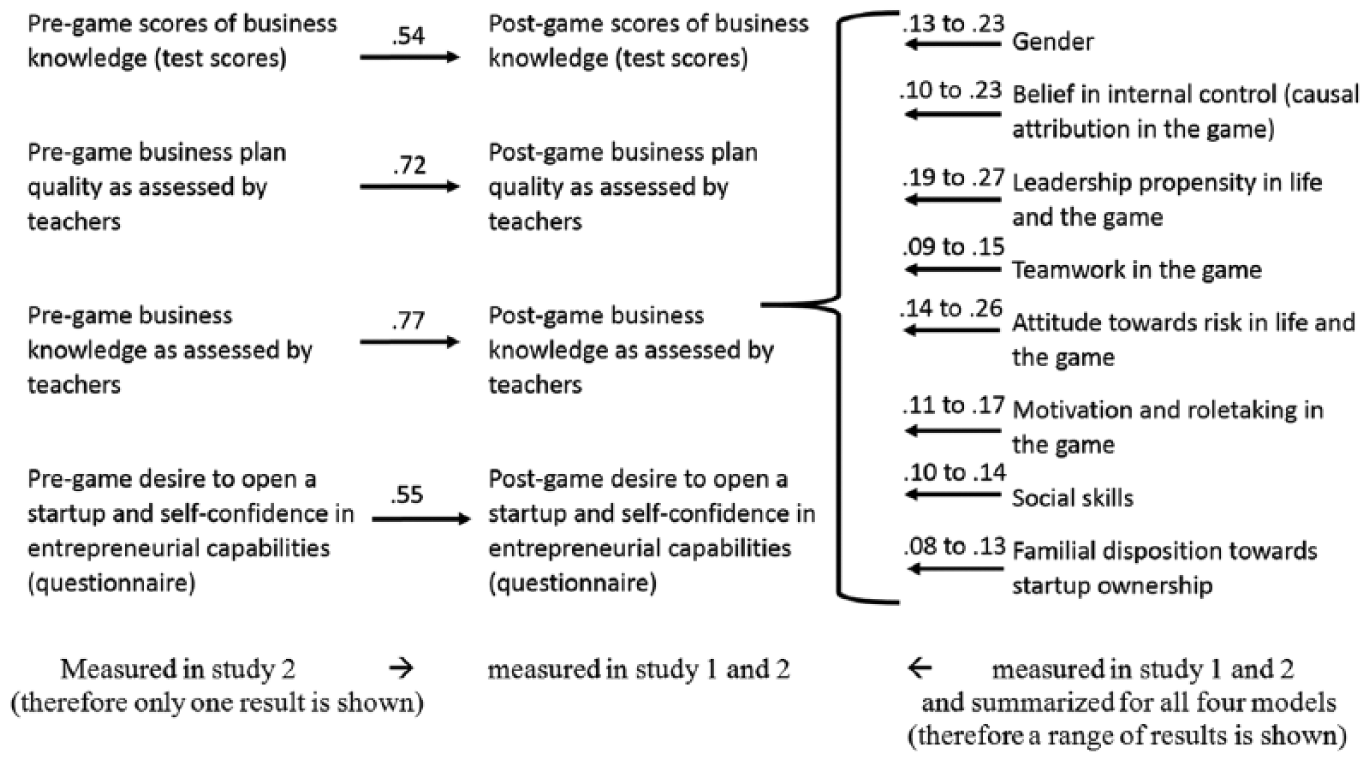
Partial correlations of the regression models used to predict outcome variables of the startup game.
In the figure below, we show the predictors with the strongest corrected partial correlations on the left side. The predictors on the right side influence the entire set of outcome variables. The figure only shows the range of results. For example, gender has a significant effect of .13 to .23 on the four outcome variables, as shown in the middle column of Figure 3.
All results presented are significant on alpha probability value p<.001 (based on t-tests and analysis of variance models). Self-assessment of the overall satisfaction of students shows similar results as in the study already presented in the section on summative output-oriented evaluation. As no added value arises from the detailed discussion of these results, we skip them. Our studies show a significant overall increase in the knowledge and business administration skills required in a startup, as measured by tests before and after the game. This is a clear learning effect.
As a whole, the main results of the two described evaluation studies show the importance of the relationship between the complexity of a simulation and the respective target group. Analysis based on the games’ logic model that we conducted in our studies provided important hints about the conditions under which a simulation game achieves better results. Our results showed successful variations of the games in conducting and debriefing that led to increased learning (e.g. number of game rounds played, debriefing methods, reducing or adding complexity and number of “game elements”, and optimal number of players per group.)
Gameplay and debriefing proved to be important factors, ensuring that participants do not feel over-challenged or under-challenged (part of student-teacher interaction). Perceived facilitator quality and debriefing significantly influenced the players’ role taking and motivation during game play. The adoption of an entrepreneurial role in the game and the student-student interaction and group dynamics during gameplay significantly affected the outcome variables (cognitive, social and motivational learning effects and the acceptance of the game as learning method). Preconditions including previous knowledge or experience with gaming simulation methods, expectancies of participants and facilitators, and gender significantly affected the outcome variables (Kriz et al., 2008, 2009). As an example, in the next sections we discuss some of the gender effects that we found in our studies.
In contradiction to the program’s intentions to force entrepreneurial motivation, our analysis detected decreased motivation. To some extent, this result is not only negative. For most of the students, the simulation game was the first authentic situation in which they experienced what it could mean to start their own business. It is understandable that, for the majority of students, this experience led to the conclusion that they are not willing to take the risk or do not have the energy and ambition to be entrepreneurs.
As Figure 4 shows, there was a significantly steeper drop in the interest of women in starting up a business after the simulation seminar. In fact, the results for the men stayed constant. The drop in interest for the whole sample is thus due to women.
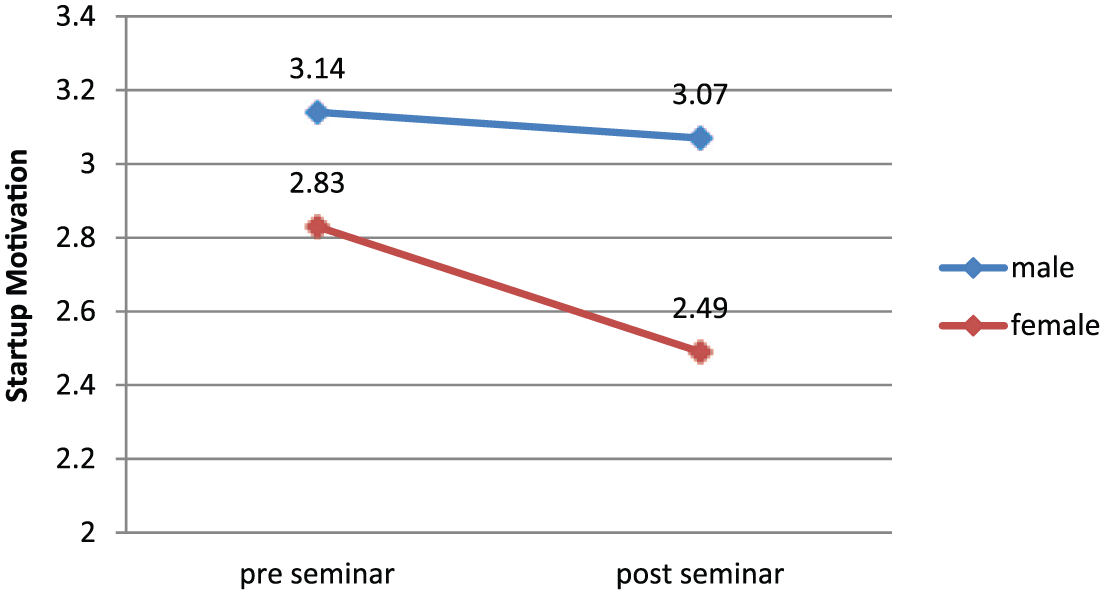
Development of motivation in start-up simulation seminars.
Compared to their male peers, women had better knowledge of business administration and created better business plans before and after the simulation. Women’s predisposition to start a business is significantly less before and after the simulation. In comparison to men, women demonstrate less inclination to take risks and their leadership qualities are less pronounced. They were also more overburdened in the simulation than men. Women took fewer leadership roles and reported lower motivation. However, certain gender stereotypes play a role. Even before the simulation, women were less inclined to start a business, and this must have made them less able to put themselves in the role of an entrepreneur. As a consequence, they were less motivated by the experience than their male participants (see Table 2). We recommend further research on this issue.
Significant Gender-Differences Results in Business Simulations as Measured by t-Test.
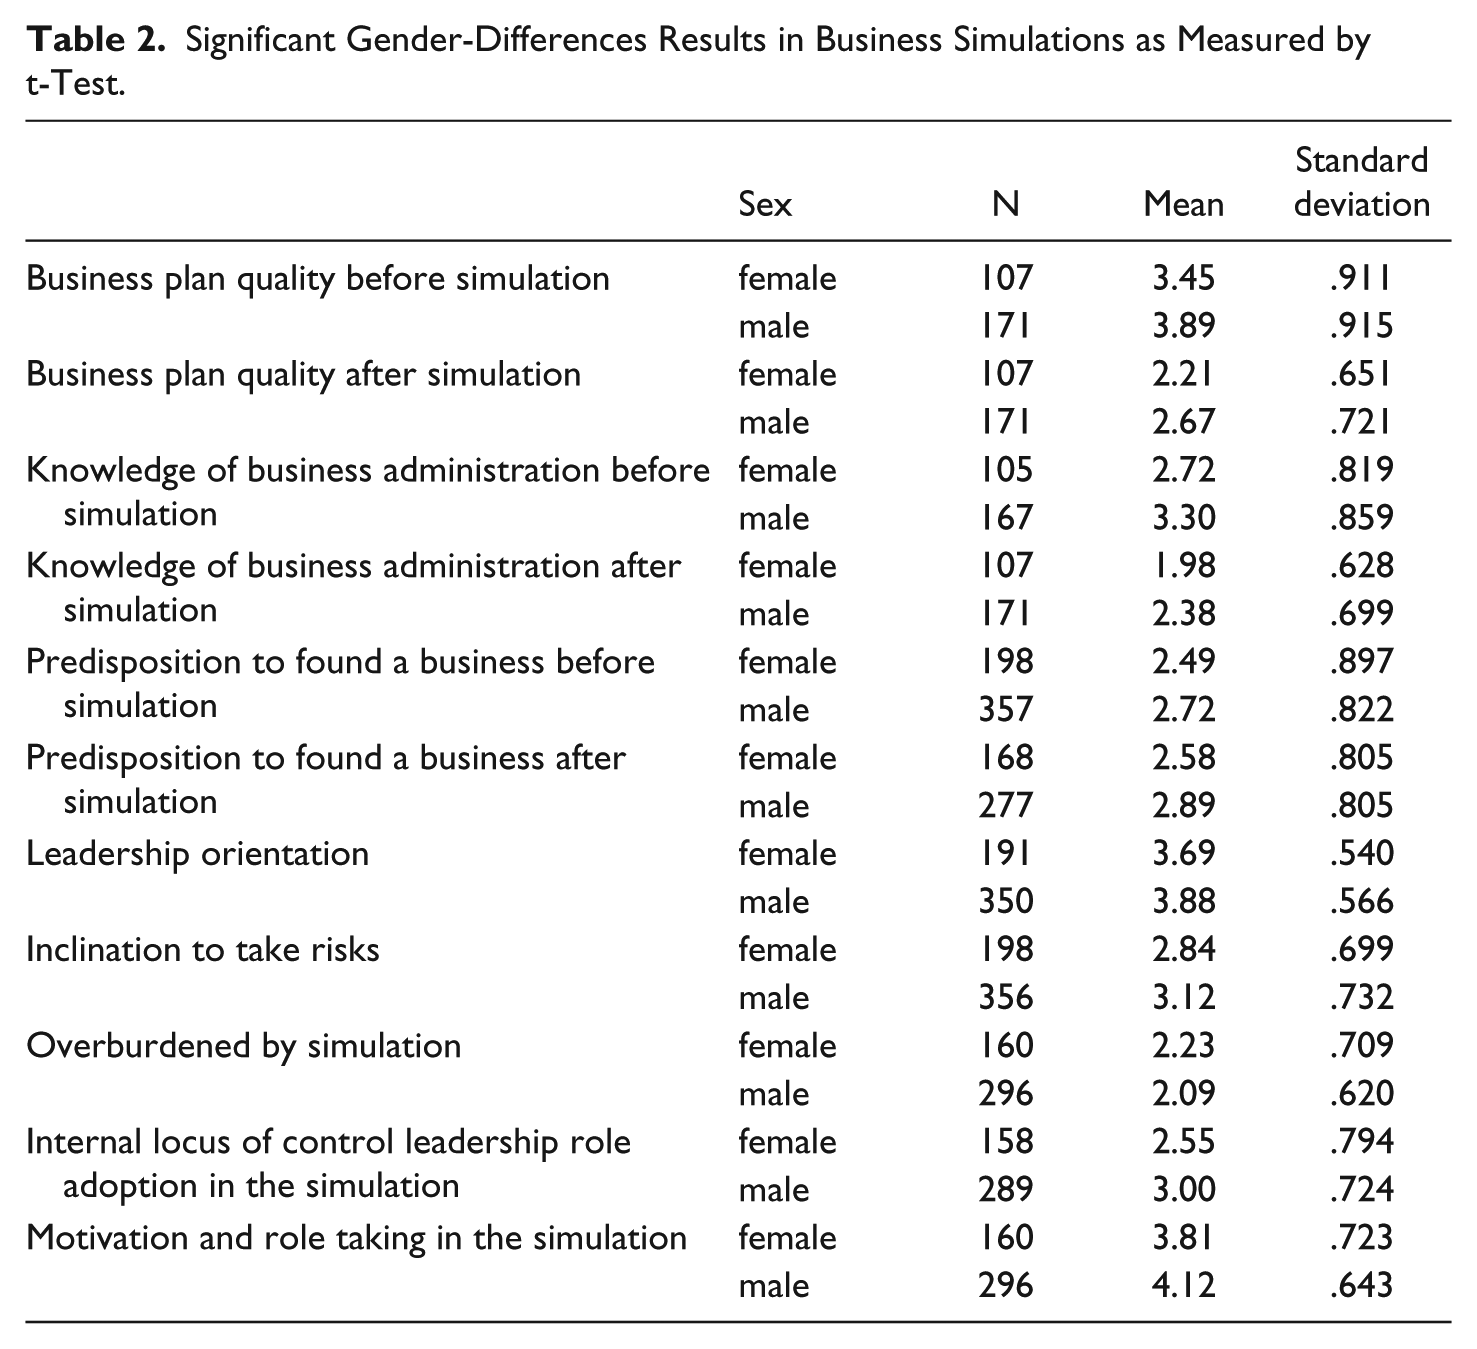
It is important to note that in the above table, lower scores for variables regarding the quality of business plans and knowledge mean better results.; 1 = very good, 6 = very bad. Also, for the overburdened by simulation variable, a lower score is more favorable. For all other variables, including leadership orientation, motivation and role-taking in the simulation, internal locus of control, and predisposition to found a business and inclination to take risks, a higher score implies more favorable results.
Hypothesis 1 was confirmed: Students assessed the simulation game as a tool that increased their competency as potential startup owners and business managers.
Hypothesis 2 was not confirmed: Students did not report increases motivation to run a startup or manage a business after playing the game. A decrease in motivation is apparent, especially and significantly for female students.
Hypothesis 3 was confirmed: The simulation game improved the participants’ business knowledge, as reflected in tests that participants took before and after game play.
Hypothesis 4 was confirmed: The simulation game positively improved the students’ ability to write a business plan. Lecturers assessed the quality of business plans written by students before and after game play. Comparison before and after gameplay showed a significant increase in quality of business plans.
Hypothesis 5 was partially confirmed: Different sociodemographic variables such as age, course of study, and semester of study had no effect on the participating students’ knowledge, skills, or motivation. However, as we stated in the results regarding hypothesis 2, we found that gender affected students’ desire to launch a startup.
Study 3
By dividing seminars into 4-5 single-sex teams, we intended to identify if women’s motivation benefitted from participation in female-only teams. In other words: Did this setting reduce or equalize the decreased interest in founding a firm shown in study 1 and 2? This research design was motivated by prior research that suggested learning outcomes are signfiicanlty better for female pupils in technical subjects if their classes exclusively include female participants (see IEA, 1998; Joffe & Foxman, 1988; Kessels, 2002). Our results showed no significant effects resulting from the use of single-sex teams. We found the same results as previously discussed; hypothesis 6 was not confirmed.
Study 4
As a test scenario, the directors of the nationwide business game-based German EPC competition tried three special seminars for women only. Additionally, a board-based simulation game was applied. The debriefing was changed due to results from participant interviews conducted. The interview results showed that women are more ‘content oriented’, while men are more ‘competition oriented’ (see Auchter & Kriz, 2014). Women expressed that they would like to receive more feedback about their strengths and weaknesses and wished for more detailed discussion of game results.
We believe that the extended debriefing process introduced into the board simulation seminars was most likely responsible for the significantly better assessment outcomes (compared with mixed-gender cups). Hypothesis 7 was confirmed. However, the study had several weaknesses that must be examined. First, it is based on only 3 cups and a smaller number of participants (N = 64). Second, the improvement was only tested through the subjects’ self-assessments. Third, we do not know what caused the better results; we can only prove that the combination of a mono-gender setting, use of board games, and the intense debriefing was successful. We, therefore, need to conduct more detailed future research using variations of these variables in larger samples. Nevertheless, these results indicate some possible factors that can be used to optimize future game-based programs for gender effects.
For more detailed information on results and the instruments used in studies 1-4, see the reports we prepared for the German Ministry of Economics and Technology (Kriz & Auchter, 2007-2012).
Study 5: Long-Term Effects
The research for this study began when we invited all former participants from the 2007 to 2011 year groups to participate in an online survey. Alongside the evaluation of the effects of the program in the form of a longitudinal analysis (two to five years after participation), we wanted to find out what had become of the former participants. Although more than 8,000 students participated in the program in the years 2007-2011, only N = 5988 addresses of the former participants were still valid. Overall, N = 1217 individuals took part in the online survey. This represents a response rate of 20%, assuming that the former participants were potentially reachable. As this is a new study, we show the results in detail.
We compared the demographics of those who responded and those who did not respond and tested for a positive self-selection bias from particularly enthusiastic former students (see Wolfe & Roberts, 1993). We found no significant differences between these two groups.
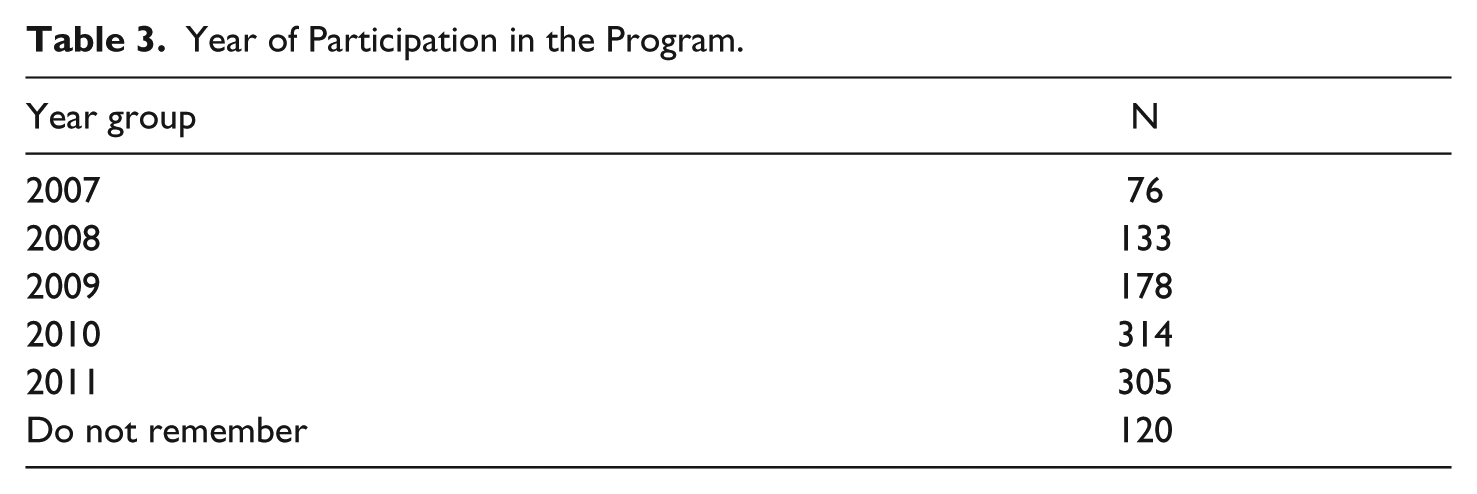
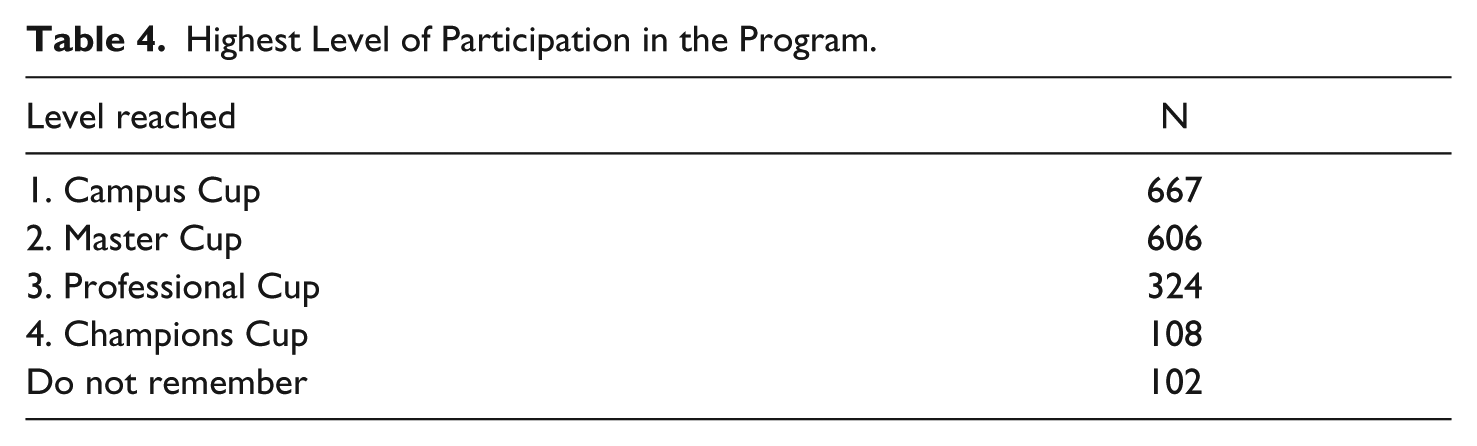
Table 3 shows the distribution of the participants based on the year of their participation in the program. They took part in our online survey 2-5 years after participation in the EPC. Table 4 shows the distribution of the participants according to the highest level of competition they reached.
Year of Participation in the Program.
Highest Level of Participation in the Program.
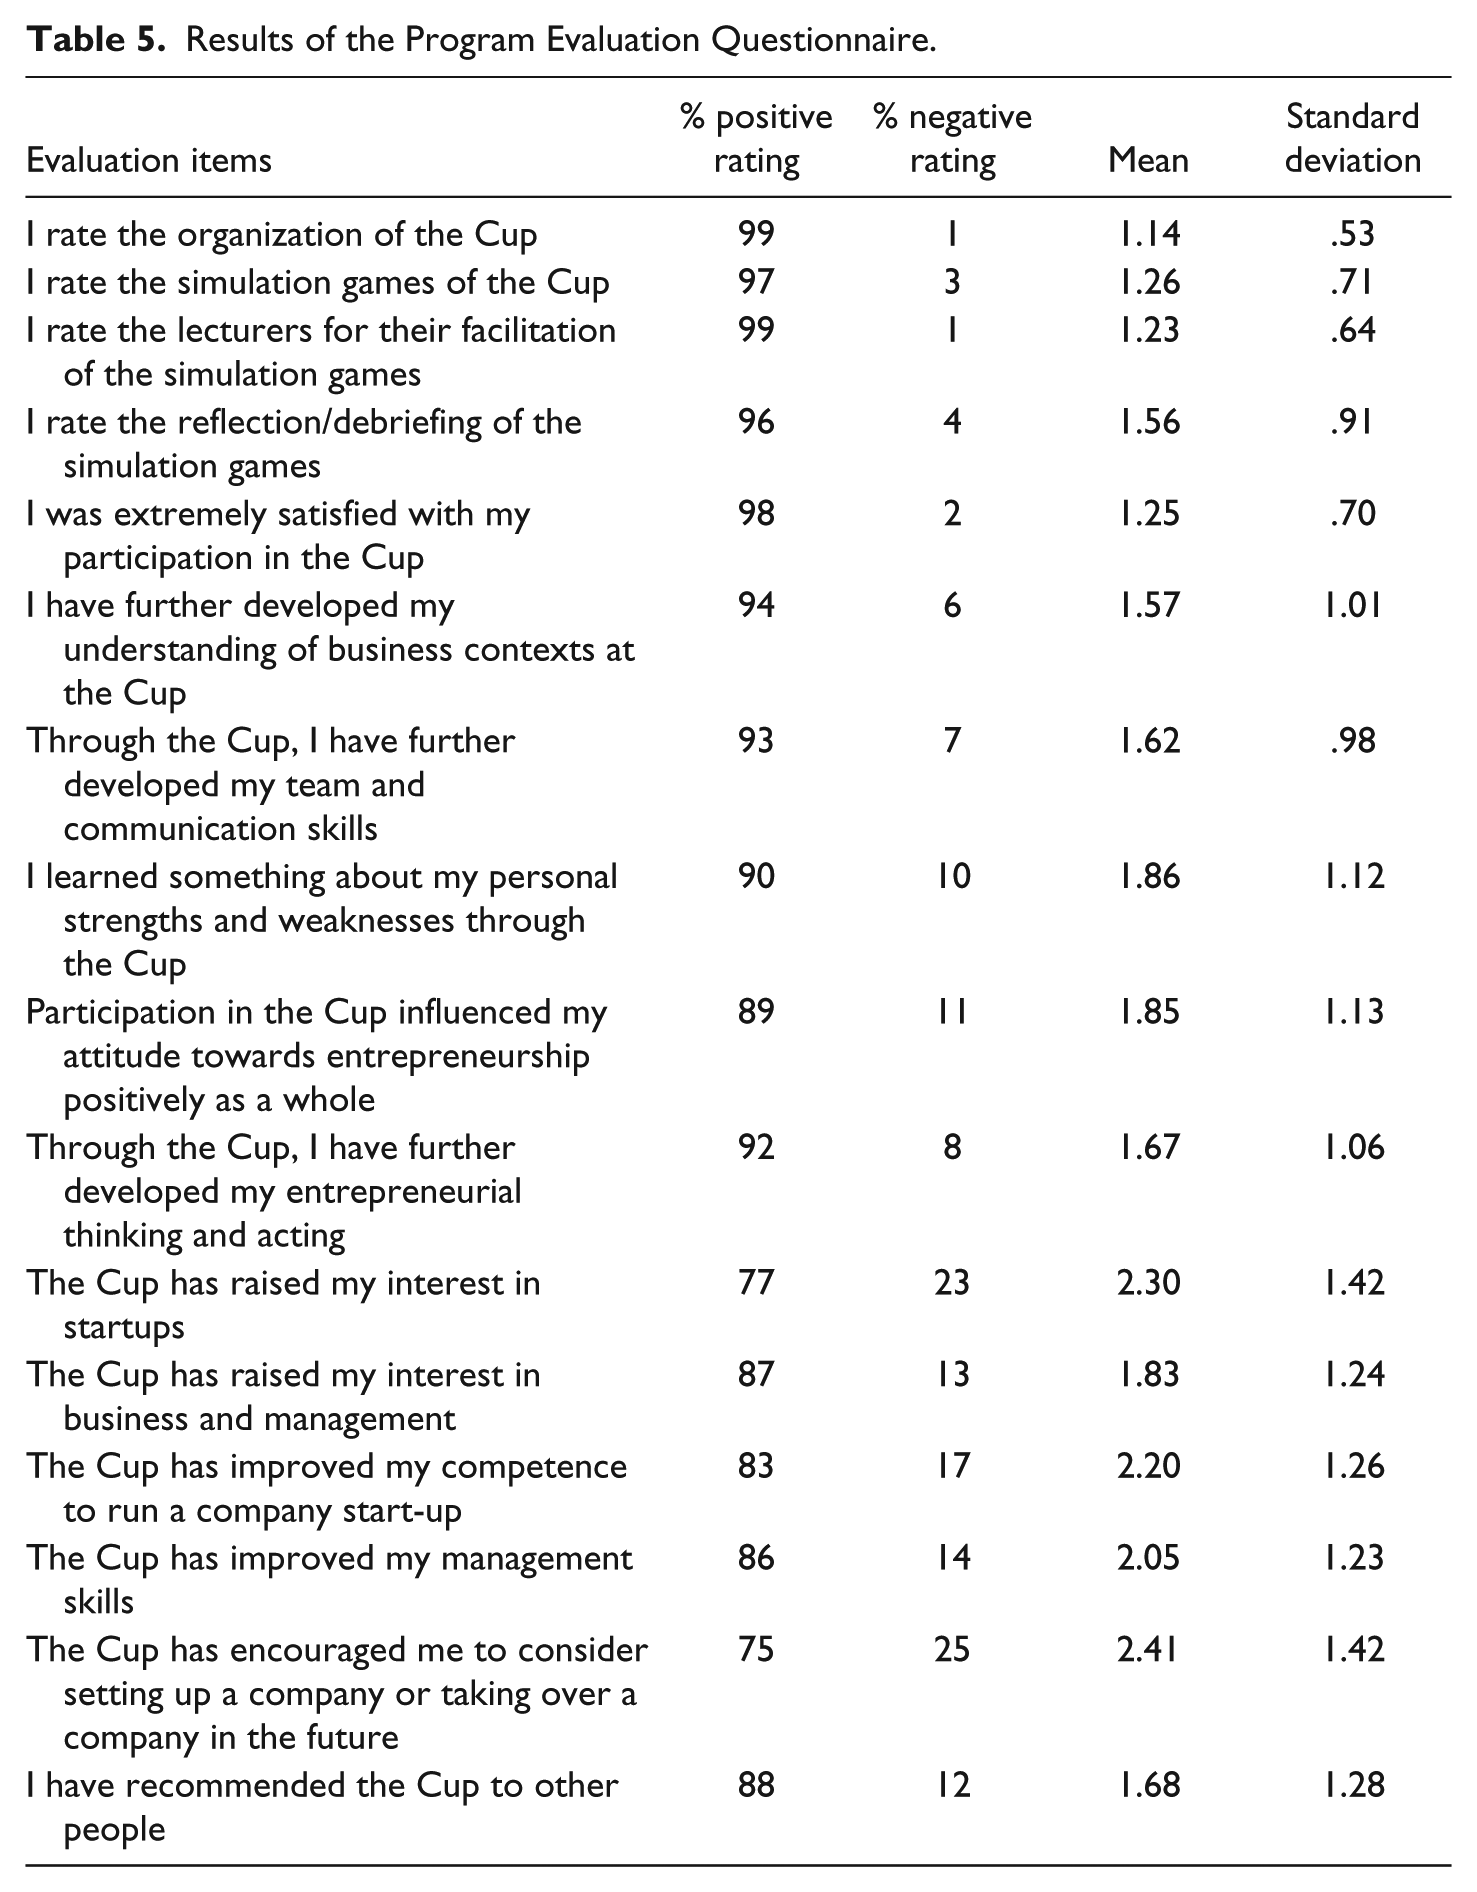
The results show excellent reviews, as only averages of very good to good were scored. The overall rating of all participants (N = 1217) across all 16 assessment questions is M = 1.71 (average) on a six-point Likert-scale (with one being the best score and six the lowest). 98% of the survey participants indicated that they were extremely satisfied with the EPC.
In Table 5 (below) an overview of all of the evaluation questions in the online questionnaire is presented. The EPC annual evaluation used some of these questions in an identical or similar form. In the table, the 16 items are displayed together with the percentage of participants (calculated without those who have missing values) as positive (rating 1-3) or negative (4-6). The mean and standard deviation of all ratings of all participants for each item are specified. Averages from 1.0 to 3.5 give an affirmative/positive rating; averages from 3.51 to 6.0 give a deprecating/negative rating.
Results of the Program Evaluation Questionnaire.
Using a special coding system, we were able to link the participants’ data from this online survey study with the evaluation data from previous studies. The evaluation results were significantly better after 2-5 years; the original measurement being the yearly evaluations that follow the cup competition. The new resssults werrre compared with the assessment scores of the same participants immediately after the cup, as explored in the annual evaluations. The more recent assessment shows that participants were more appreciative (using t-Test for paired samples; p<.001).
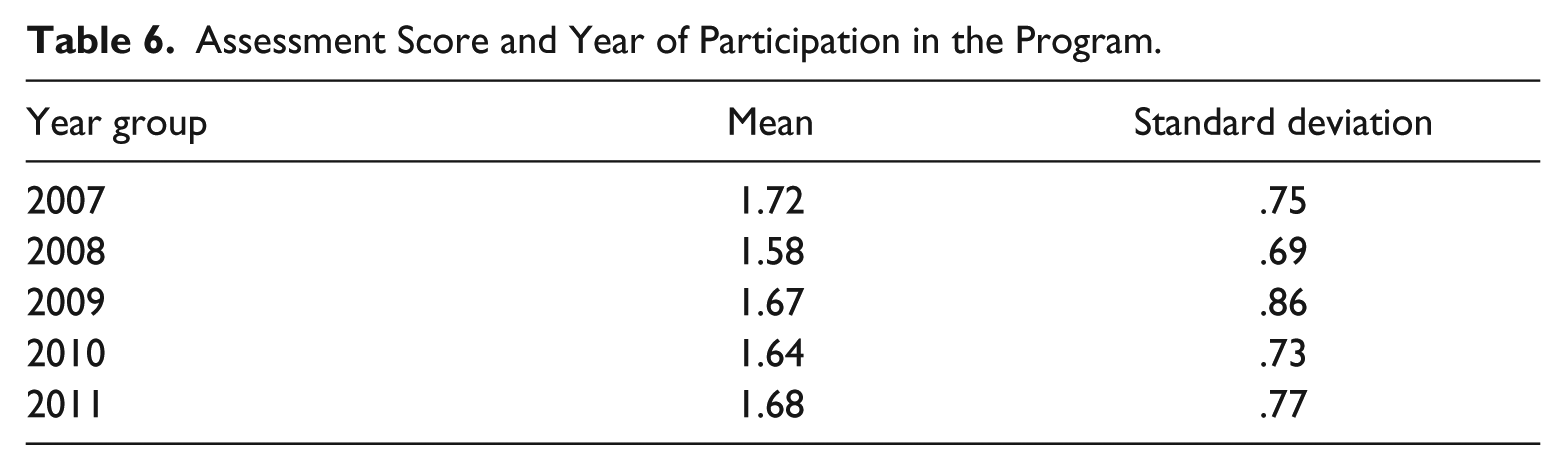
We conducted an analysis of the evaluation differences between sub-samples to determine if any significant variations were present. For this, a new value was calculated which represents a global rating. This provided the average of all 16 evaluation questions (see Tables 6 and 7). The global rating, based on the total sample, has a mean of M = 1.71. The two following tables show how this global rating is characterized by the perspective of different year groups and related to the four program levels.
Assessment Score and Year of Participation in the Program.
Assessment Score and Highest Competition Level Reached in the Program.
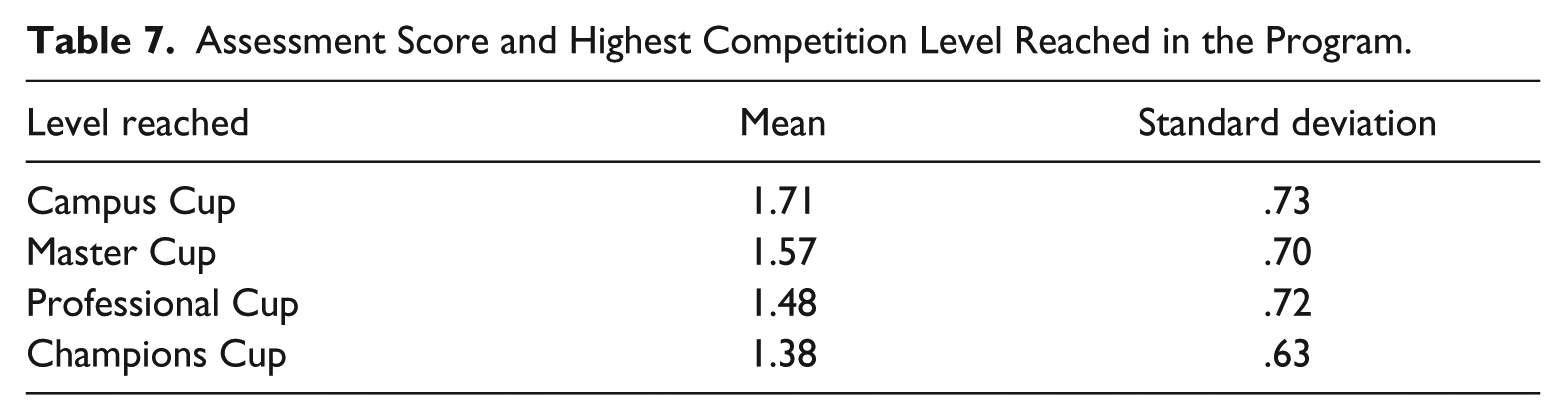
Based on the year groups, we found no significant differences. Despite a substantially higher number of participants in the competition over the past couple of years, extremely high ratings were still achieved, which speaks to the quality of the program. With the cup levels, it is interesting that there is a continual improvement. As we expected, we found that the higher these participants ranked in the cup competition, the higher their assessment of the program was.
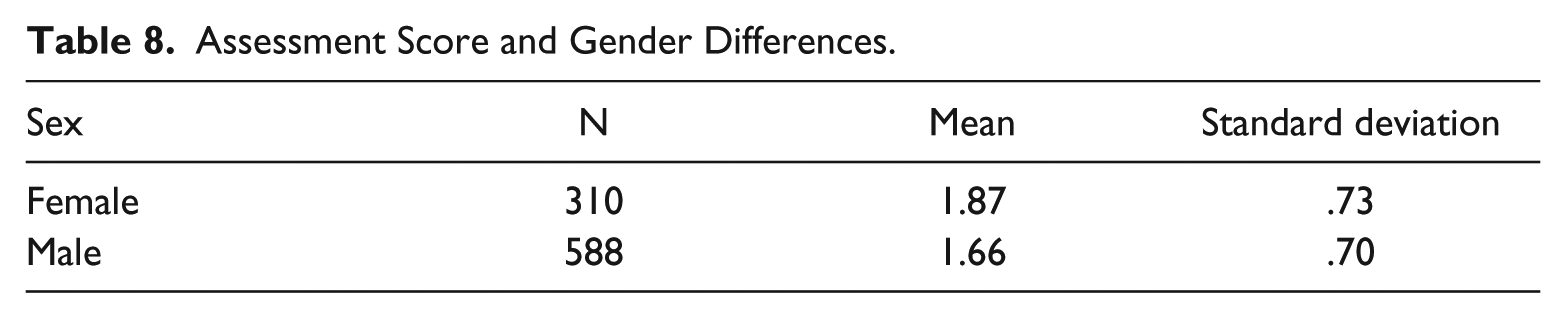
The age of the respondents does not correlate (r = .07) with the assessment scores, i.e. young and old rate the same. The follow-up survey, however, revealed a well-known result from the standard evaluation reports – the presence of a gender difference. Men gave significantly higher ratings than women (t-Test; p<.001; see table 8). In this regard, the program had already reacted by introducing special opportunities such as a Ladies’ Cup that has already witnessed good results. These campaigns do not cause the gender difference to disappear from the study, however, and in the follow-up survey sample the effects of these special opportunities are barely noticeable (see below).
Assessment Score and Gender Differences.
We then posed the question as to how the former participants had evolved professionally after their participation. The following table gives the individual options and their answers, as well as the global ratings of groups of people who indicated a certain category as being applicable. Responses from all respondents who chose a certain category were used to determine the percentages in the table. Multiple answers are possible and are not yet differentiated (e.g. students who are already working besides their studies; see below).
Table 9 shows the overall results of graduates of the program in the evaluation. The differences in ratings in the professional development categories are not significant. It is possible to link the data of the participants in the standard annual evaluation of the EPC with the data of this follow-up survey by using a special coding system. As expected, the evaluation after 2-5 years is significantly and comparatively better than the evaluation that was given immediately after the cup. The graduates’ evaluation of the program improves with their increasing rank in the EPC. The longer they were able to take part in the competition, and the closer they came to winning the competition. The graduates are noticeably more appreciative in this review.
Professional Development After Participation in the Program.
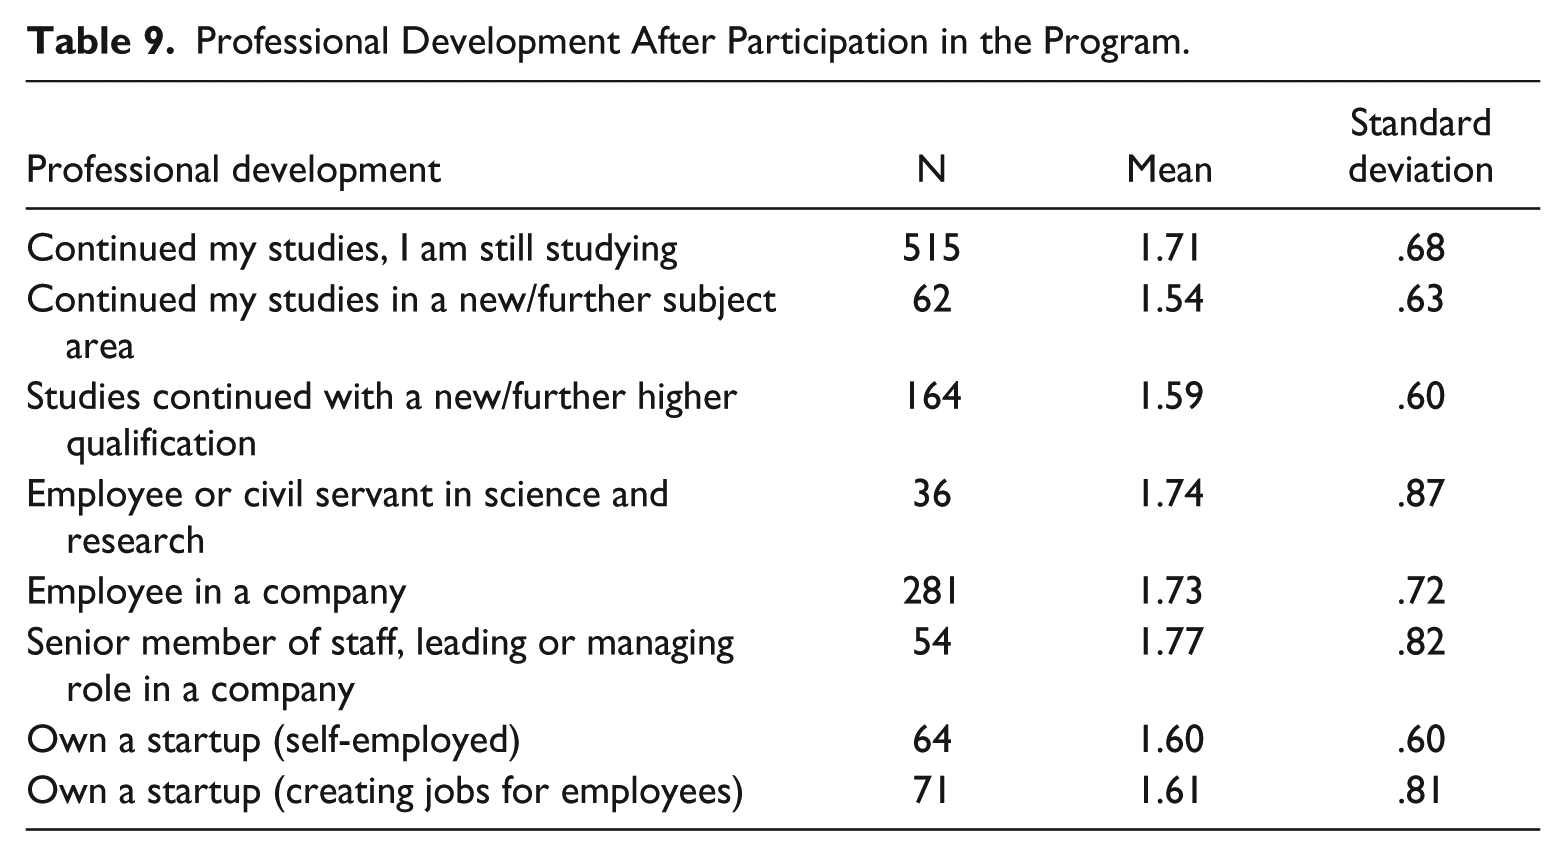
A closer examination of the 71 startup founders who took part in the survey and are actively creating jobs shows that 26 of them are still studying. Of the 506 participating persons who are no longer studying, the proportion of startup owners is high (9%). Additionally, there are almost as many individuals are self-employed (7%). The percentage of startup owners who graduated from the EPC, as already mentioned (see above), is relatively high. Consider the study of Kerst and Minks (2009) a reference value for Germany. This so-called HIS (University Information System) study is a representative survey of graduates of students one and five years after completing their studies and focused on self-employment and entrepreneurship. In their study, 7-9% were measured, cohort depending. In the further HIS graduate survey of 2009, one year after graduation, the researchers noted a value of approximately 7%. In the HIS study, however, all types of self-employment and entrepreneurship were grouped together. To obtain a comparison value, we have to calculate our two categories: self-employed workers and those who and own a startup that is actively creating jobs for employees together. For our study, this results in a startup ownership rate that is approximately twice as high (around 16%) as the rate Kerst and Minks noted in the HIS study. We need to take into account the potential self-selection bias of participants in our study. Those who responded and participated in this survey are not demographically different from those who did not respond; both groups also expressed similar levels satisfaction immediately after the simulation game. Thus, one potential source of bias is disproven. Participation in the cup is voluntary, however, and it is possible that people with more interest in startups participated more strongly in the original simulation game. Nevertheless, the EPC is a successful initiative in that it raises awareness of startups.
We collected employee statistics and industry sectors from the founders, and 12 of the 71 participating founders (approx. 17%) already have more than ten employees. The largest of these companies employed 25 people at the time we collected this data. Approximately 38% had 1-3 employees. A quarter (26%) of these businesses were in the IT or internet sectors. Other services made up approximately 63% of the remaining startups. 7% of the startups were in the technical sector and producing or processing sector, and another 3% were in the education and research sector.
Hypothesis 8 was confirmed. Years after participation, the students assessed their long-term learning positively. Former students of the game-based cup competition opened more startups than their cohorts who did not participate in the competition.
Summary and Conclusion
Together, the studies discussed in this article show a significant overall increase in business knowledge and business planning skills that are necessary for management and entrepreneurship. We interpret this as an increase in entrepreneurial competencies as a result of startup simulation courses and cup competitions.
Our findings show that the typical gender effects in startup behavior and motivation in the simulation courses are close to those observed in reality. They also clearly demonstrate how adapting the simulation and course setting can diminish these effects and help encourage women to open startups. The introduction of board-based simulations and extended debriefing sessions for the women-only seminars resulted in a significant reduction in the gender differences, improved learning, and higher motivation than the computer simulation game. Before we can draw conclusions about the significance of these findings, further research with larger samples and greater variation of testing conditions is necessary.
In our latest study, we examined the long-term effects of a game-based entrepreneurship education program. As already seen in the annual evaluations, men assess the simulation games and cups significantly better than women, but both groups rate the experience positively. Most importantly, the startup ownership rate and self-employment rate is approximately twice as high as the national startup rate for German students.
The results show some strengths of a theory-based evaluation that may contribute to the improvement in educational measures. Such optimization is the final aim of all efforts in the context of education and training. Better results in the most recent studies show that feedback taken from previous evaluation studies was successfully implemented in the facilitation of the simulation game. For example, the facilitator quality and the debriefing time and methods were improved. The evaluation may lead to the use of different game formats and program structures for specific target groups to support learning and increase the motivational effects of the simulation game. Our future theory-based evaluation research will focus on the investigation of the causes and effects of these adaptions, as well as the effects of varying startup simulations.
Footnotes
Acknowledgements
We thank our colleague Helmut Wittenzellner for his feedback and for the support in the data collection.
Authors’ Note
This article is an augmented and enhanced version of a paper presented by Willy C. Kriz and Eberhard Auchter entitled “The Impact of Business Simulations as a Teaching Method on Entrepreneurial Competencies and Motivation - A Review of 10 Years of Evaluation Research in Entrepreneurship Education” at the 45th annual international conference of the International Simulation and Gaming Association (ISAGA), Dornbirn, Austria, July 7-11, 2014.
Declaration of Conflicting Interests
The authors are not the designers of the simulation games used in the program described, nor are they the designers of the educational programs. They have not facilitated any seminar or cup in the programs discussed. The authors were engaged by the German Ministry of Economy and Technology as independent evaluators. Therefore, the authors declare no potential conflicts of interest with respect to the research, authorship, and publication of this article.
Funding
The author(s) disclosed receipt of the following financial support for the research, authorship, and/or publication of this article: The German Ministry of Economy and Technology sponsors the program that is described in this article.
Author Biographies
Contact:
Contact: