
Abstract
This study investigates the shear performance monitoring of concrete beams reinforced with Glass Fiber Reinforced Polymer (GFRP) bars using piezoelectric sensors. The research explores the effect of shear damage in the shear span region on the response signals of the concrete beams under loading. Piezoelectric ceramic sensors were attached as actuators and receivers to the concrete beams, and loads were applied until shear failure occurred. When cracks developed in the shear span, stress waves propagated through the material and interacted with the cracks, leading to reflection and refraction, which caused the attenuation of the wave energy. While piezoelectric sensing and wavelet-based analysis have been explored in RC structures, real-time quantitative monitoring of brittle shear failure in GFRP-reinforced beams remains largely under-investigated, especially in relation to crack localization and damage indexing. Time-domain signal amplitude and wavelet packet energy were analyzed under different damage states. Frequency-domain analysis confirmed that high-frequency components (40–80 kHz) in the healthy state and low-frequency components (10–30 kHz) in the damaged stage were most sensitive to shear crack propagation, validating the effectiveness of frequency-domain analysis in shear damage assessment. The Shear Damage Index (SDI), proposed in this study, decreased from 1.0 (undamaged state) to approximately 0.0 (severe damage) as the shear cracks propagated. Among the sensors, those located at the bottom of the beam exhibited the fastest signal degradation, allowing for the identification of crack height progression. Finite element simulations confirmed that increasing crack length and inclination enhanced stress wave attenuation, with their time-domain, frequency-domain, and energy attenuation trends consistent with experimental results—validating the theoretical model’s ability to replicate stress wave attenuation behavior under shear damage. These findings demonstrate that the proposed monitoring method enables real-time, quantitative evaluation of shear damage in GFRP-reinforced concrete beams, providing a practical and sensitive tool for structural health monitoring.
Keywords
Introduction
Since the invention of reinforced concrete in the mid-19th century, it has become widely used in buildings, bridges, railways, airports, and other infrastructure due to its excellent mechanical properties and relatively low cost. As a result, reinforced concrete has become one of the most widely used materials in civil engineering (Zhang et al., 2018). However, the corrosion of steel reinforcement can cause cracking in the concrete, leading to degradation of the structural performance and significantly shortening the service life of reinforced concrete structures (Ahmad, 2003). To address this issue, engineers have employed various methods, such as applying protective coatings on the steel surface and using cathodic protection (Wang et al., 2024). However, these measures can only delay the corrosion process to a certain extent and do not fundamentally solve the problem. Therefore, finding more sustainable and effective solutions to tackle the corrosion of steel reinforcement has become crucial. In this context, the use of Fiber Reinforced Polymer (FRP) bars as an alternative to traditional steel reinforcement has been proposed (Ahmed et al., 2020). FRP bars, composed of fibers and a resin matrix, offer advantages such as a higher strength-to-weight ratio, lower stress relaxation, superior fatigue performance, corrosion resistance, and non-magnetic properties compared to steel (Ye and Feng, 2006). As a result, FRP bars are considered an effective replacement for steel reinforcement in reinforced concrete structures, solving the issues of steel corrosion and cracking, while improving durability and extending the service life of concrete structures (Lignola et al., 2014; Oller et al., 2015; Wang et al., 2014).
There are significant differences in material properties between FRP bars and traditional steel reinforcement, which lead to notable differences in the shear failure behavior of FRP-reinforced concrete (FRP-RC) structures compared to conventional reinforced concrete (RC) structures. Since FRP bars are linear elastic materials that do not exhibit a yield stage under tensile loading, internal force redistribution is not possible during the shear process of FRP-RC beams (Wu et al., 2010). This lack of internal force redistribution leads to more severe and unstable shear failures in FRP-RC beams, making traditional shear design models for reinforced concrete beams unsuitable for FRP-RC beams. Currently, the shear design codes for FRP-RC beams in various countries are derived from those for conventional reinforced concrete, resulting in discrepancies in calculation models and inaccurate predictions (El-Sayed and Soudki, 2011). Additionally, many studies have been conducted on the shear capacity of FRP-RC beams, but due to the complexity of shear failure mechanisms and the brittle nature of shear failures, experimental results often show high variability, which increases the difficulty of conducting theoretical analysis on the shear performance of FRP-RC beams (Di et al., 2025; Jiang et al., 2019, 2021). At present, there is relatively limited research on health monitoring for brittle failures in FRP-RC beams, making the development of a monitoring method for such failures highly necessary.
Piezoelectric materials, with their unique ability to sense and actuate, have been widely applied in structural health monitoring (SHM). Based on whether piezoelectric sensors actively excite the structure, piezoelectric sensor-based structural health monitoring can be categorized into active and passive health monitoring (Jiao et al., 2020; Li et al., 2025). Passive health monitoring involves directly analyzing the structural condition based on the response signals collected by the piezoelectric sensors, which allows for the assessment of the health status of the structure (Nasrollahi et al., 2018). Active piezoelectric SHM requires at least one actuator–sensor PZT pair. One sensor acts as the actuator to emit a specific excitation signal, which propagates through the medium and is received by the other sensor. Data processing and analysis of the received signals are then used to evaluate the structural health (Aabid et al., 2021; Nasrollahi et al., 2018; Yang et al., 2023). Zeng et al. (2015) used piezoelectric sensors to monitor bond slip behavior in steel-concrete composite structures. In their experiment, a shear-mode SA and a piezoelectric ceramic sensor were placed in the concrete and steel plates, respectively. The SA acted as the actuator, and the piezoelectric sensor as the receiver. Shear stress generated by the SA propagated along the interface between the concrete and steel plate, and when bond slip occurred, the stress wave energy attenuated. The results demonstrated that shear-type stress waves could effectively monitor bond slip between the concrete and steel, detecting the occurrence and development of bond slip. Zhou et al. (2020) applied a wave propagation analysis method to study the damage process of Basalt FRP-RC (BFRP-RC) beams under four-point bending tests. Four smart aggregates (SA), the encapsulated piezoelectric ceramic sensors bonded to the beam surface, were attached to the concrete beams. The experimental results showed that the wave propagation analysis method could accurately assess the damage process and mechanisms of BFRP-RC beams, and successfully monitor the status of these structural components. Despite the extensive application of piezoelectric sensors in structural health monitoring, critical gaps remain in addressing the unique challenges of FRP-RC beams. Unlike conventional RC structures, FRP-RC beams exhibit brittle shear failure without a yield plateau due to the linear elastic nature of FRP bars, leading to sudden and unstable failure modes. Existing studies primarily focus on flexural performance monitoring or bond behavior monitoring of steel-RC structures, with limited research on real-time quantitative monitoring of brittle shear failure in large-scale FRP-RC beams. Compared with our recent study (Li et al., 2025), which primarily addressed generic crack identification and localization in conventional RC structures, the present work focuses specifically on shear performance monitoring of GFRP-reinforced concrete beams. GFRP-RC beams exhibit brittle shear-compression failure with no yielding plateau, presenting unique monitoring challenges not covered in previous work. Furthermore, unlike our earlier study, this research introduces a Shear Damage Index (SDI) based on wavelet packet energy for quantitative evaluation of shear damage severity, and combines finite element modeling and DIC validation to provide a more comprehensive assessment of structural health.
This study uses piezoelectric sensor-based wave propagation analysis to monitor shear-compression failure in concrete beams, analyzing how signal changes correlate with the development of cracks in the shear span region to track the damage progression of Glass FRP-RC (GFRP-RC) beams from loading to failure. Additionally, a Shear Damage Index (SDI) based on wavelet packet energy is proposed to monitor the damage state in the shear span region of GFRP-RC beams. The main works of this study are as follows: Section 1 introduces the background of this research, as well as the application of piezoelectric sensors in structural health monitoring, with a focus on the wave propagation analysis method used in active monitoring technologies. Section 2 details the use of piezoelectric ceramic sensors for monitoring shear-compression failure in concrete beams. A four-point bending test is conducted, and data is collected during the loading process using the wave propagation analysis method, while Digital Image Correlation Technology (DIC) is used to monitor crack propagation. Section 3 analyzes and discusses the experimental results, using signal variations to assess the health condition of the shear span region in the concrete beams and proposing an SDI based on wavelet packet energy to evaluate crack progression. It demonstrates the effectiveness of using piezoelectric ceramic sensors for monitoring shear crack identification and development in concrete beams. Section 4 utilizes finite element simulations to investigate the stress wave propagation process in concrete beams, theoretically validating the proposed method.
Shear performance monitoring experiment of FRP-RC beams
Specimens
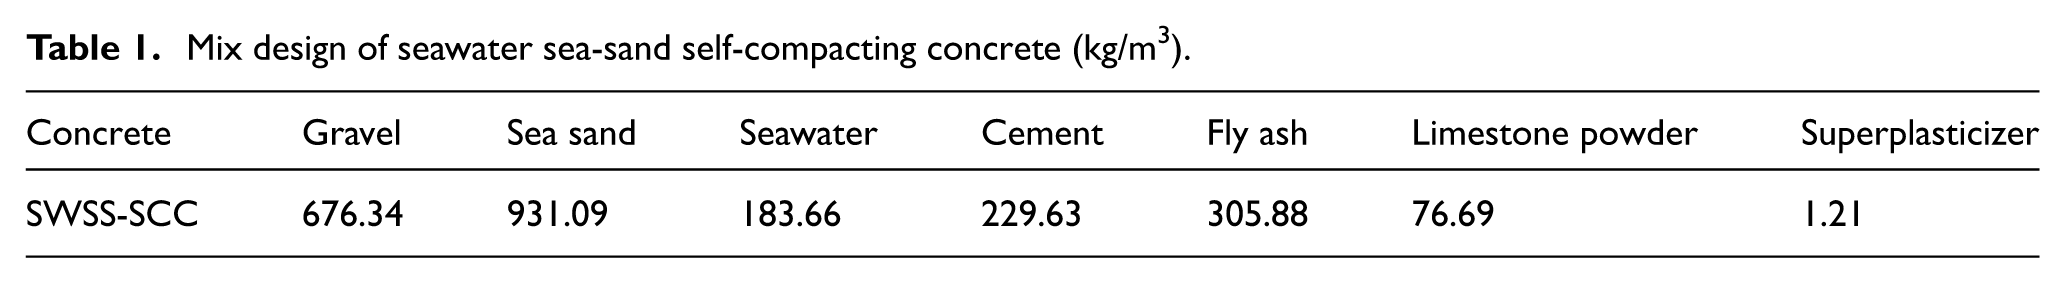
The concrete used in this experiment is seawater sea-sand self-compacting concrete (SWSS-SCC), with the mix design shown in Table 1. The seawater was simulated as per the guidance of ASTM standard D1141 with the ingredients detailed in our previous study (Zhou et al., 2023), whereas the sea-sand was harvested from South China Sea. For each beam specimen, three standard concrete cubes (150 mm × 150 mm × 150 mm) as per Chinese design code GB50107-2010 were prepared for concrete strength tests. The average concrete cubic compressive strength for each beam specimen was summarized in Table 2.
Mix design of seawater sea-sand self-compacting concrete (kg/m3).
Details of the experimental beams.
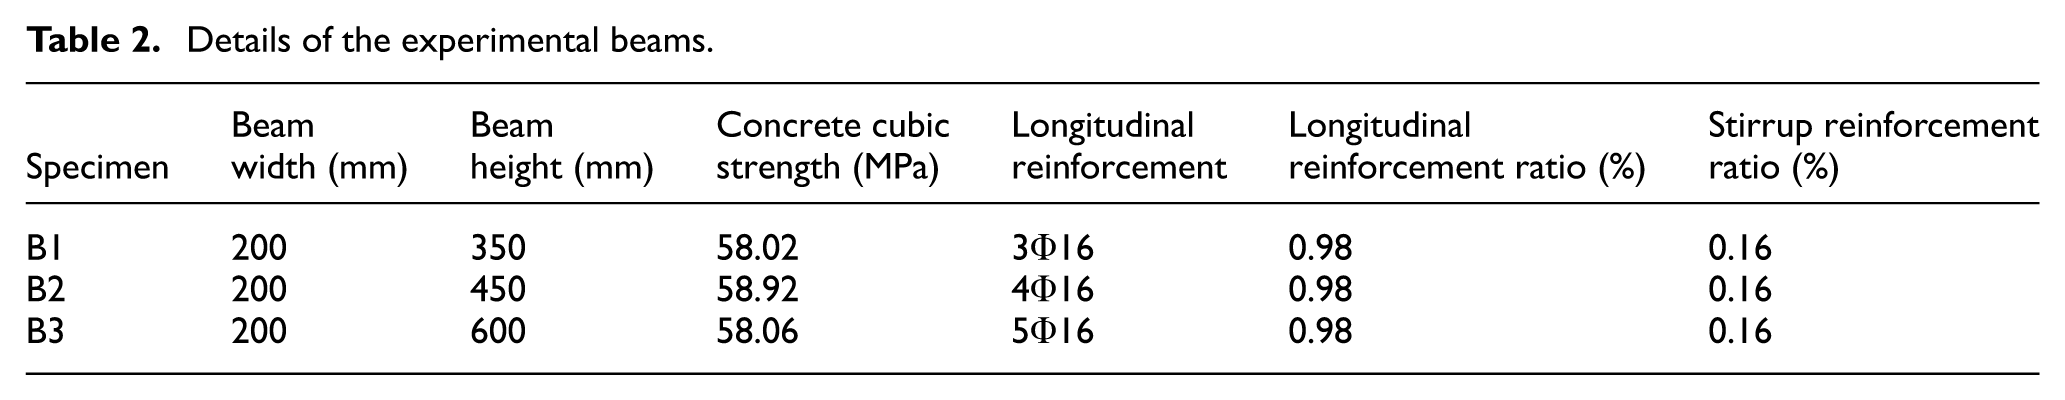
Three concrete beams (B1, B2, and B3) were designed following ACI 440.1R-15 for the experiment. Glass Fiber Reinforced Polymer (GFRP) longitudinal reinforcement was used, and Carbon Fiber Reinforced Polymer (CFRP) strips were used for transverse reinforcement in the cross-section. In the shear span region of the concrete beam, CFRP strips of 16 mm width were arranged as stirrups, with a spacing of 50 mm between adjacent stirrups. The stirrups were applied by manually wrapping three layers of CFRP strips. All beams had a length of 2000 mm, a width of 200 mm, and a clear span of 1800 mm, with a concrete cover of 40 mm. To avoid flexure failure, the beams were reinforced with an enough longitudinal GFRP reinforcement ratio (greater than three times balanced reinforcement ratio). Detailed design parameters of the beams are shown in Table 2.
During the pouring process, the concrete beams were cast in layers, with each layer vibrated to eliminate air bubbles. The formwork was removed 2 days after pouring, and the beams were covered with burlap for water curing over 56 days. The preparations of experimental beams are shown in Figure 1.
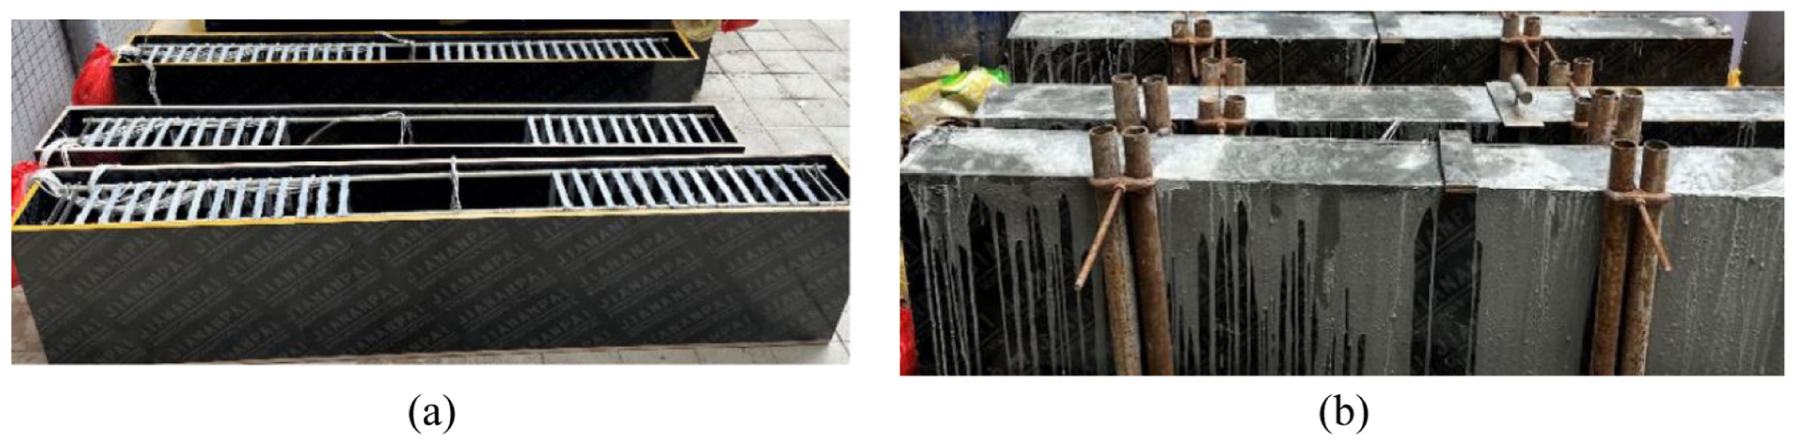
The experimental beams: (a) before and (b) after pouring.
Piezoelectric sensors and DIC arrangement
This experiment focuses on monitoring the development of inclined cracks in the shear span region of the beams. Therefore, SA were applied externally at the loading and support points. The SA at the support were used as actuators, and those at the loading points were used as receivers. In this configuration, SA0 served as the actuator, and the other sensors functioned as receivers. Detailed sensor placement diagrams for the beams are shown in Figure 2. The PZT sensors used in this experiment were PZT-5A ceramic disks with a diameter of 10 mm, thickness of 0.5 mm, and a resonant frequency of approximately 100 kHz.
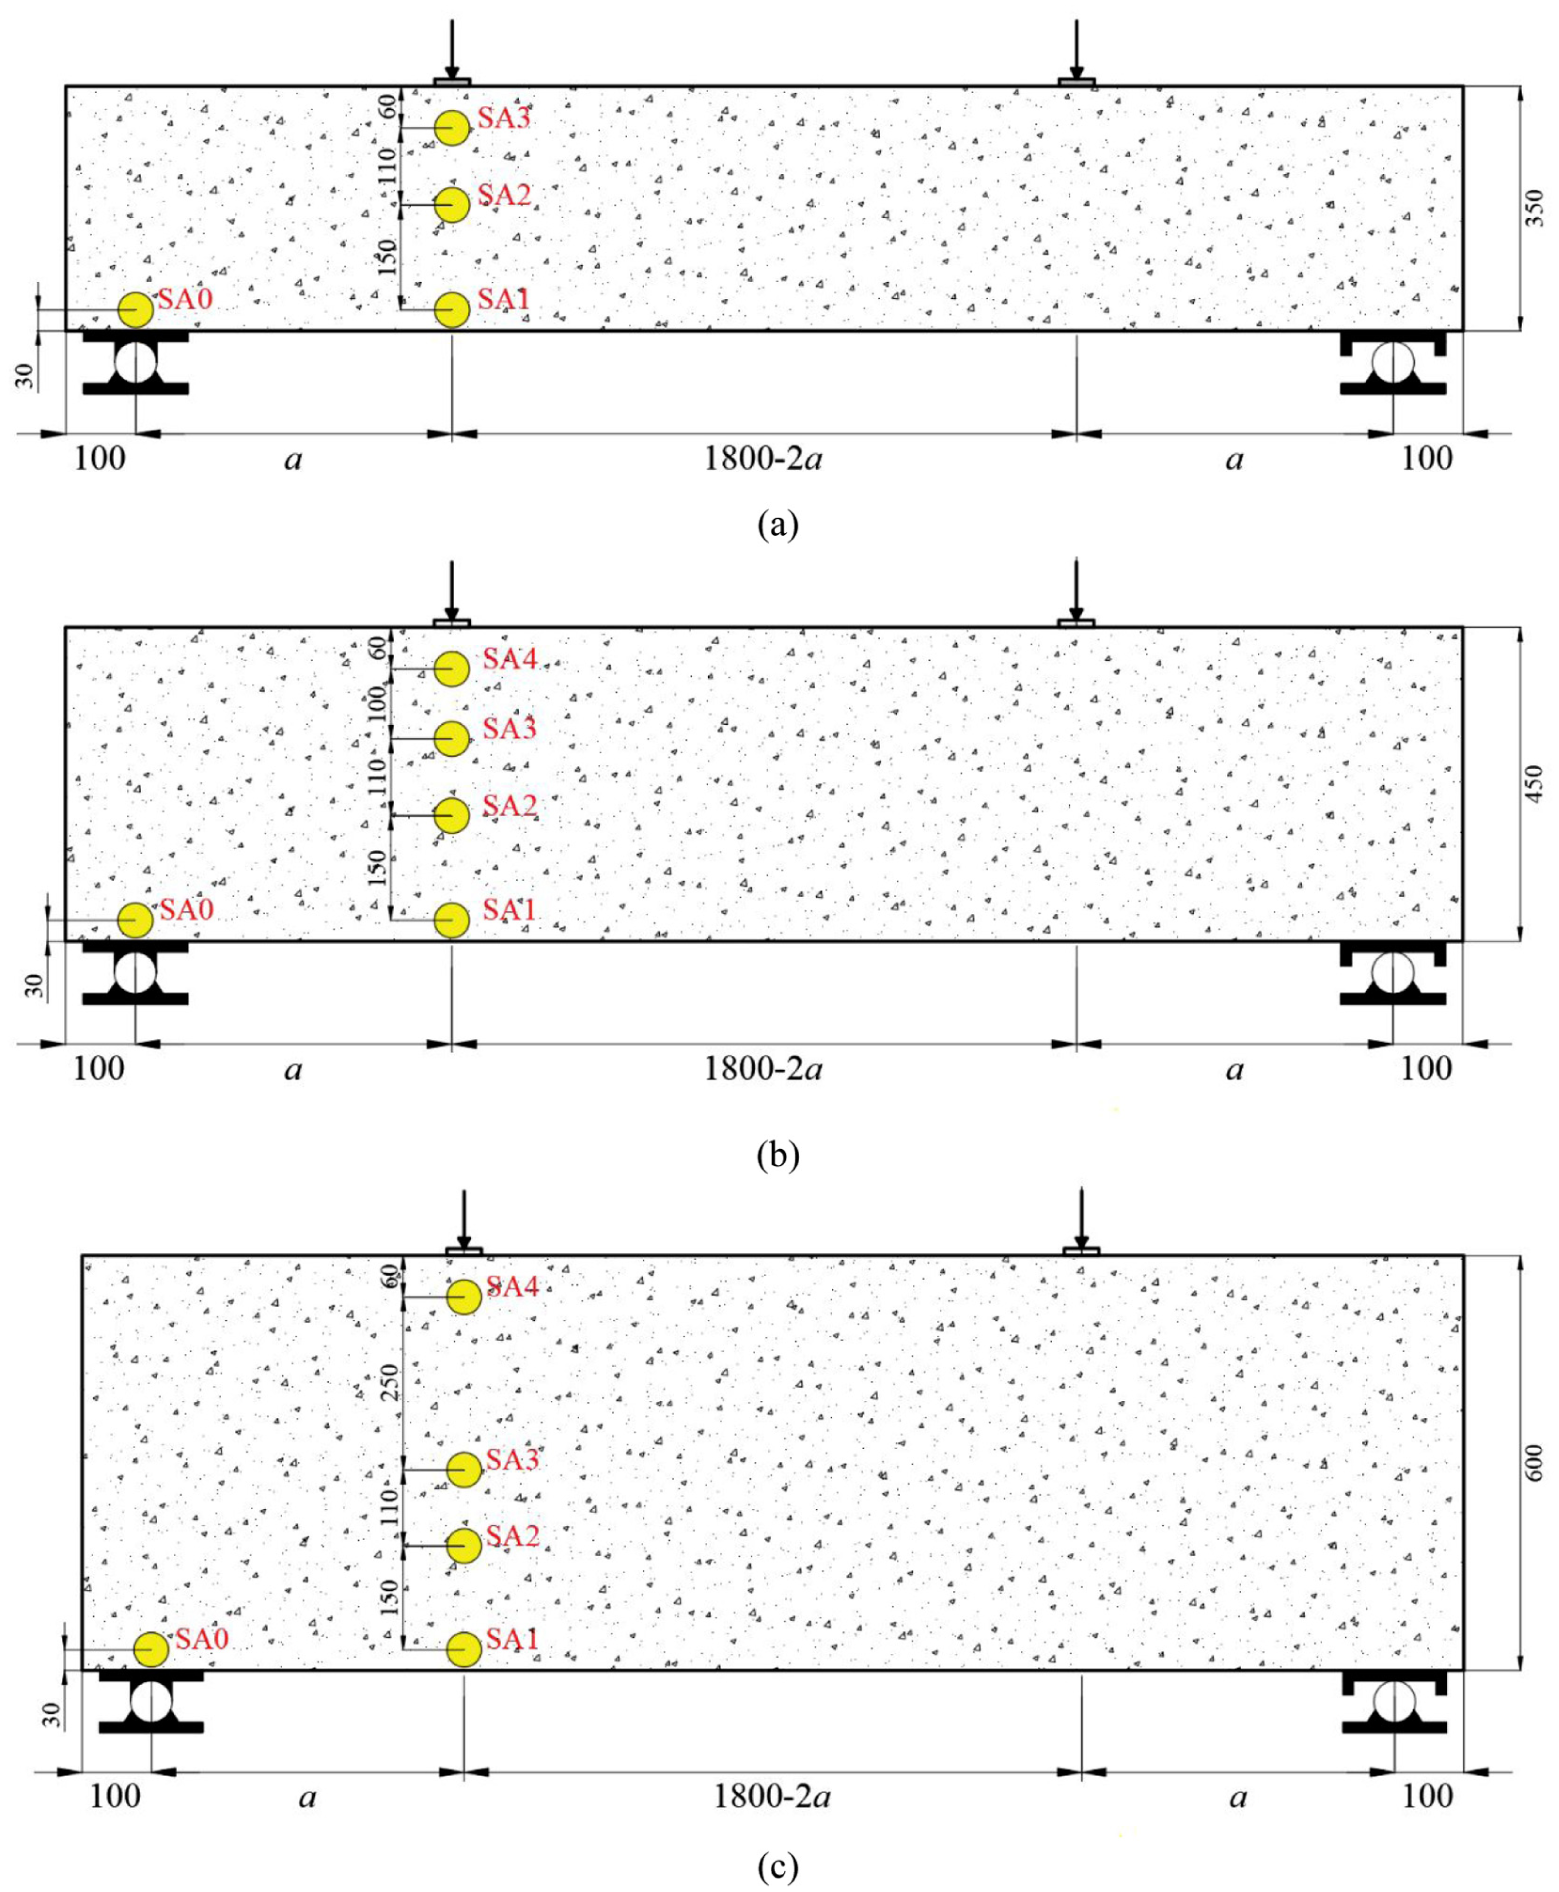
The locations of the piezoelectric sensors of beam: (a) B1, (b) B2, and (c) B3.
To better record the development of inclined cracks in the shear span of the concrete beams, a 3D-DIC system (Brand: Correlated Solutions, Model: VIC-3D) was employed in the experiment to monitor structural performance changes during loading. Due to space limitations, DIC was only applied on one side of the concrete beams for strain observation. Before the experiment, the specimen surface was sprayed with a random speckle pattern to ensure sufficient contrast and grayscale variation, in line with good DIC practice. Camera calibration was performed using the VIC-3D Calibration Targets Kit (including calibration boards with multiple spacing specifications) and the Target Generator Software, which enabled precise calibration of the binocular camera system to ensure measurement accuracy. During the experiment, two cameras were used to acquire stereo images of the specimen surface, and the setup of the DIC system is shown in Figure 3.
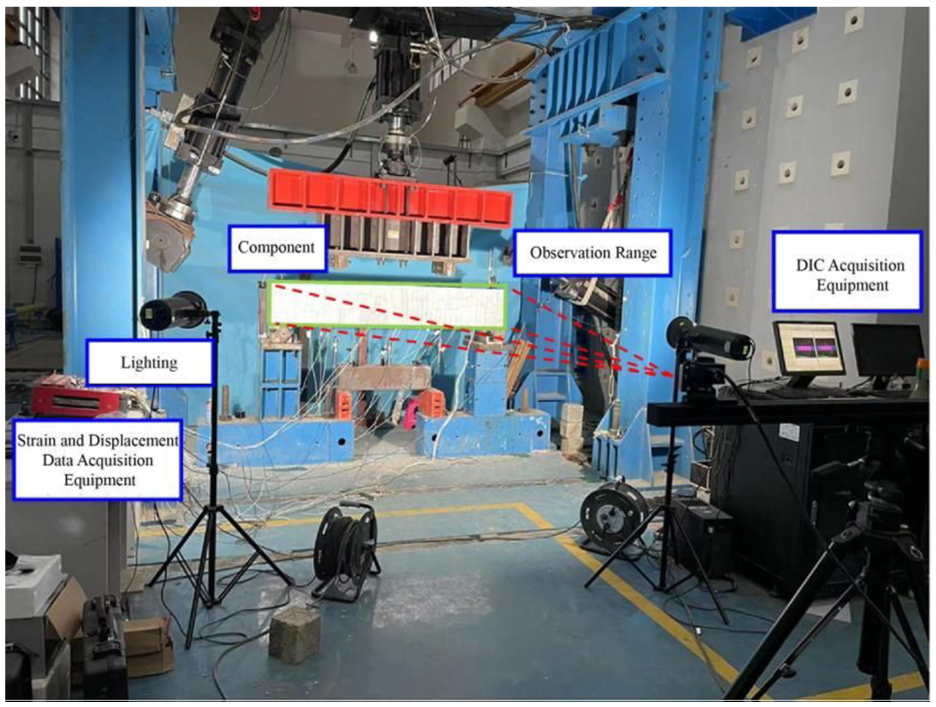
The DIC equipment and layout.
LVDT displacement sensor arrangement
Four linear variable differential transformer (LVDT) displacement sensors were positioned within the shear span region of the concrete beams to monitor deflection and study deformation patterns during loading. These sensors were specifically located below the loading and support points. Prior to loading, the sensors were calibrated to ensure their readings corresponded to actual values. After placing the concrete beams on the testing frame, four LVDT displacement sensors were installed sequentially under the loading and support points to measure vertical deflections during the test, ensuring that they were not disturbed throughout the loading and failure process. The detailed arrangement of the displacement sensors is shown in Figure 4. During the experiment, the LVDT sensors were connected to the TDS 540 data acquisition system for data collection.
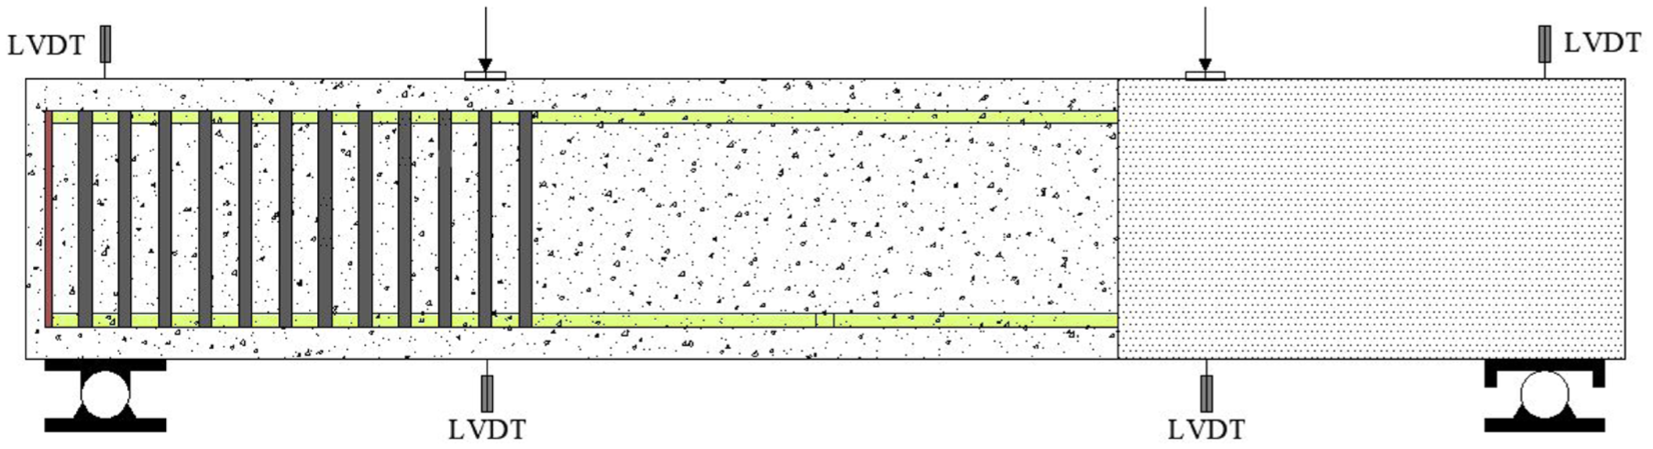
The locations of the LVDT displacement sensors.
Loading program and data collection
The beams were subjected to loading using a large-scale electro-hydraulic servo loading system (Model: JAK-1000/3, manufactured by Hangzhou Bangwei) with a capacity of 1000 kN. The beams were loaded with a four-point bending setup, and the distances between the loading points and supports (distance a in Figure 2) for B1, B2, and B3 were specifically set as 453, 603, and 804 mm to ensure a consistent shear span ratio of 1.5 across all beams.
Before the formal loading, a preloading procedure was performed in three stages, with each stage involving a 2 kN load applied for 1 min to check the equipment and specimen setup. After the preloading, the formal loading procedure commenced with a 2 kN load per stage at a rate of 4 kN/min until cracks appeared. After cracking, the load was increased to 15 kN or 20 kN per stage, with a loading rate of 10 kN/min.
The instrumentation setup of SA transducers, as shown in Figure 5, includes the device of data acquisition (NI USB 6366), the power amplifier and the personal computer (PC). The signals are generated or received by the data acquisition system and are amplified by the power amplifier. The excitation signal employed in this experiment was a continuous sweep sine wave, with specific parameters as follows: an amplitude of 5 V, a frequency ranges from 100 Hz to 100 kHz, and a duration of 1 s. This excitation signal was amplified by 50 times before being applied to the PZT actuators. The PZT actuators emitted signals during loading pause stages, and data collection was performed while the structure was held at constant load. Before cracks developed, the piezoelectric sensors collected data every 20 kN. Once cracking occurred, data was collected according to the loading stages.
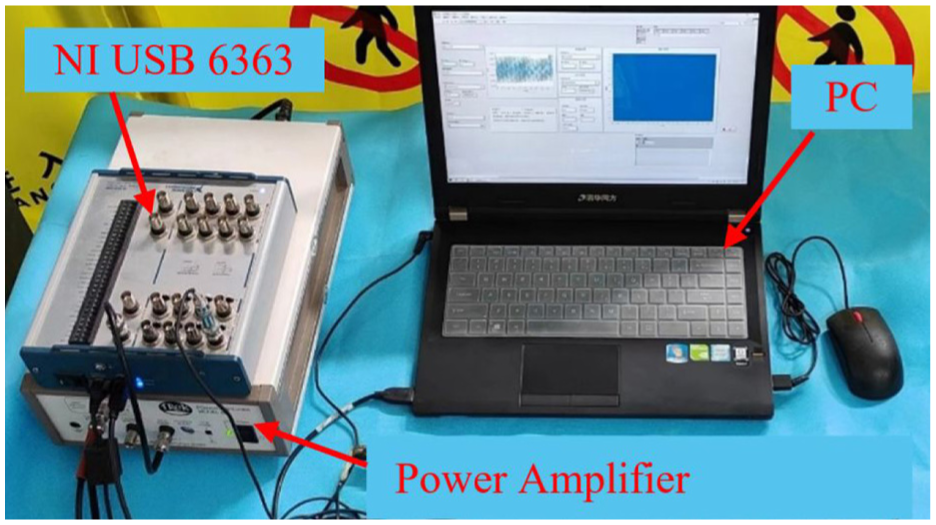
The instrumentation setup of SA transducers.
Experimental results and discussion
Beam failure modes and load-displacement curves
The ultimate bearing capacities of the concrete beams reinforced with GFRP bars, B1, B2, and B3, were 530, 660, and 750 kN, respectively. The failure modes of the concrete beams are shown in Figure 6. All experimental beams ultimately exhibited shear-compression failure modes.
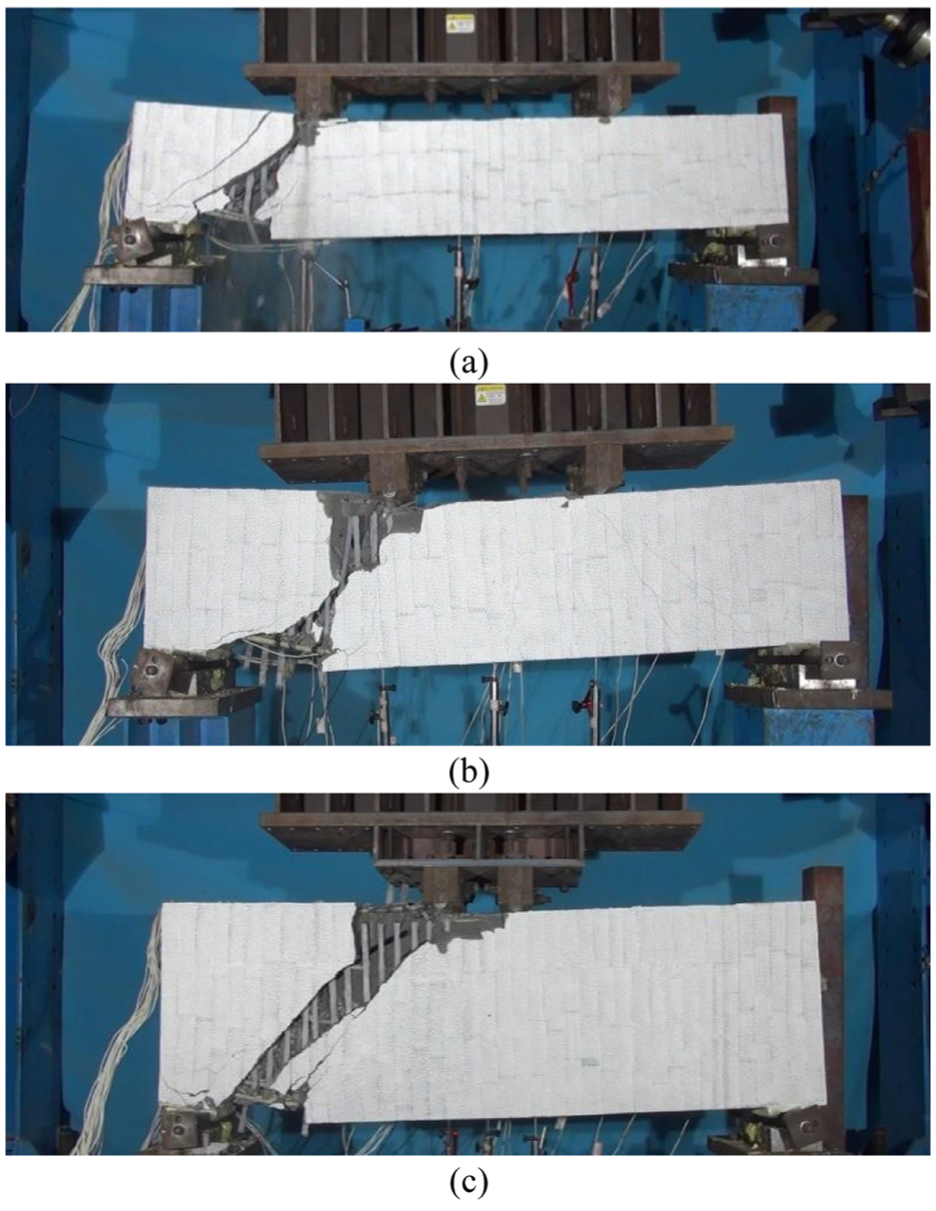
Failure modes of beam: (a) B1, (b) B2, and (c) B3.
The load-displacement curves of the concrete beams are presented in Figure 7. All three beams exhibited bi-linear load-displacement behavior. When the initial cracks appeared in the shear span region of the beams, the load-displacement curves showed distinct inflection points, with both stages following linear trends and no obvious yield plateau. Deflection barely varies with the increase in applied load in the first linear branch, while it rapidly increases with the increase in the applied load in the second linear branch. According to the load-displacement curves of the shear span regions, the initial cracks in the shear span of B1 appeared at a load of 68 kN; for B2, the initial cracks occurred at 86 kN; and for B3, the initial cracks were observed at 114 kN.
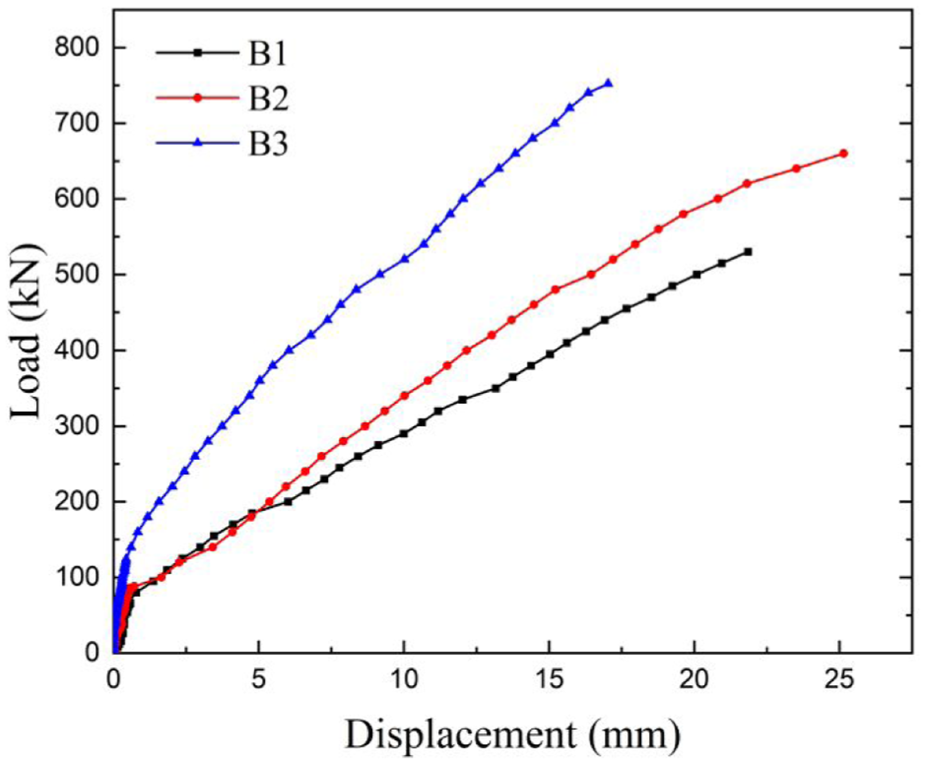
Load-displacement curves of the concrete beams.
Data denoising
The signals of piezoelectric sensors are susceptible to environmental noise interference, including electromagnetic interference and mechanical vibrations from the test site. Such interference can contaminate the original response signals and affect subsequent signal analysis. To ensure the accuracy of structural damage assessment, it is crucial to perform effective denoising processing before signal analysis.
In this study, a wavelet threshold denoising method improved based on Donoho’s denoising framework (Donoho et al., 1996) was employed to eliminate noise from the collected piezoelectric signals. The core principle of this method is to set adaptive thresholds for wavelet decomposition coefficients at different scales, suppressing noise components while retaining effective signal features. The threshold λ is calculated based on the improved Donoho method, as defined in equation (1).

Where T is the base threshold, which is determined by the decomposition level and signal characteristics. Coefficient α is determined by equation (2).
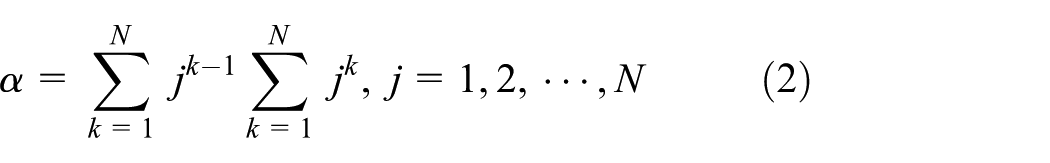
where j is the ordinal number of decomposition levels in multi-resolution analysis, and N is the total number of decomposition levels. For each wavelet coefficient kk,j before processing, the denoised coefficient
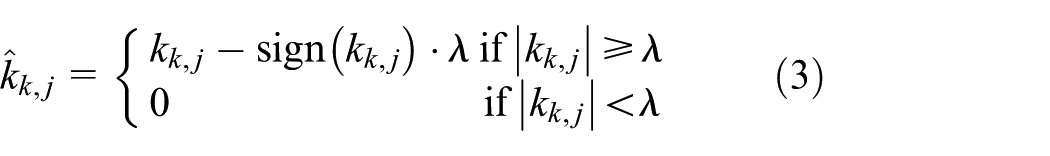
In this experiment, the dB6 wavelet basis was selected for its good time-frequency localization performance, and the decomposition level was set to five layers to balance noise suppression and signal retention. The denoising effect was evaluated by Signal-to-Noise Ratio (SNR), as defined in equation (4).
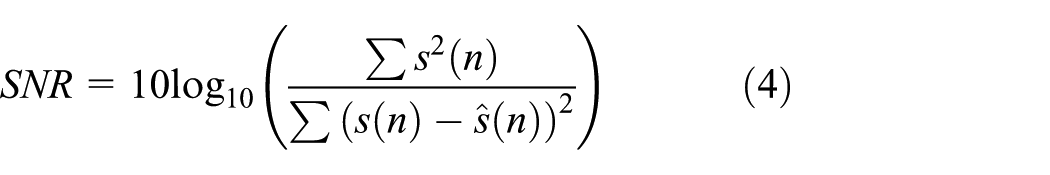
where s(n) is the original signal, and
Taking the signal from the SA0-SA1 sensor pair of B1 in the healthy state as an example, the denoising effect is shown in Figure 8. After denoising, the SNR of the signal increased by 2.44 dB, indicating effective noise reduction. This processing ensures that subsequent time-domain amplitude analysis and energy-based analysis are based on reliable signal data, reducing the impact of noise on damage assessment results.
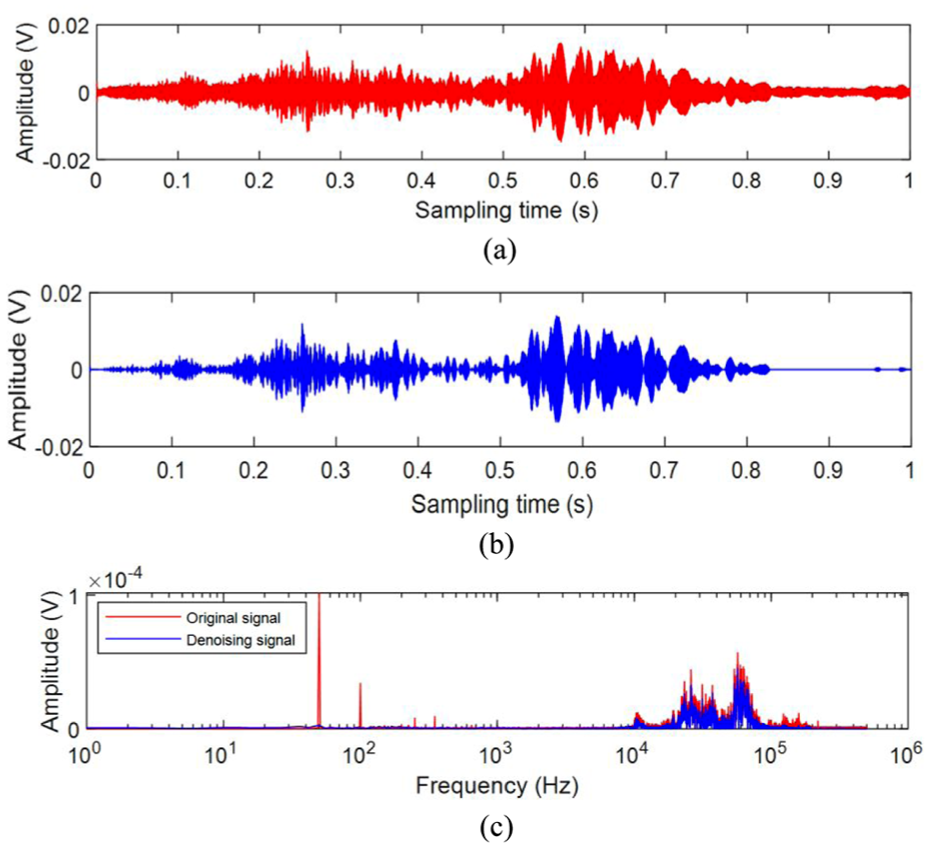
Signal denoising of B1 beam with: (a) the time domain of the original signal, (b) the time domain of the denoised signal, and (c) frequency domain comparison.
Time-domain analysis
When using SA0 as the actuator and the other piezoelectric sensors to receive signals, the corresponding piezoelectric response signals were measured. By comparing the signals received under different loading conditions, it was possible to correlate the load levels with different damage conditions. Changes in the time-domain signal were used to determine whether damage occurred in the shear span region of the concrete beams and to assess the severity of the damage. From Figures 9 to 11, it can be seen that by comparing the time-domain signals under different loads, the amplitude of the received signal, which was the peak value of the absolute time-domain voltage signal recorded by each receiver during each loading stage, was largest when the specimen was healthy. As the load increased and damage occurred in the concrete beam, the corresponding amplitude showed a significant decrease.
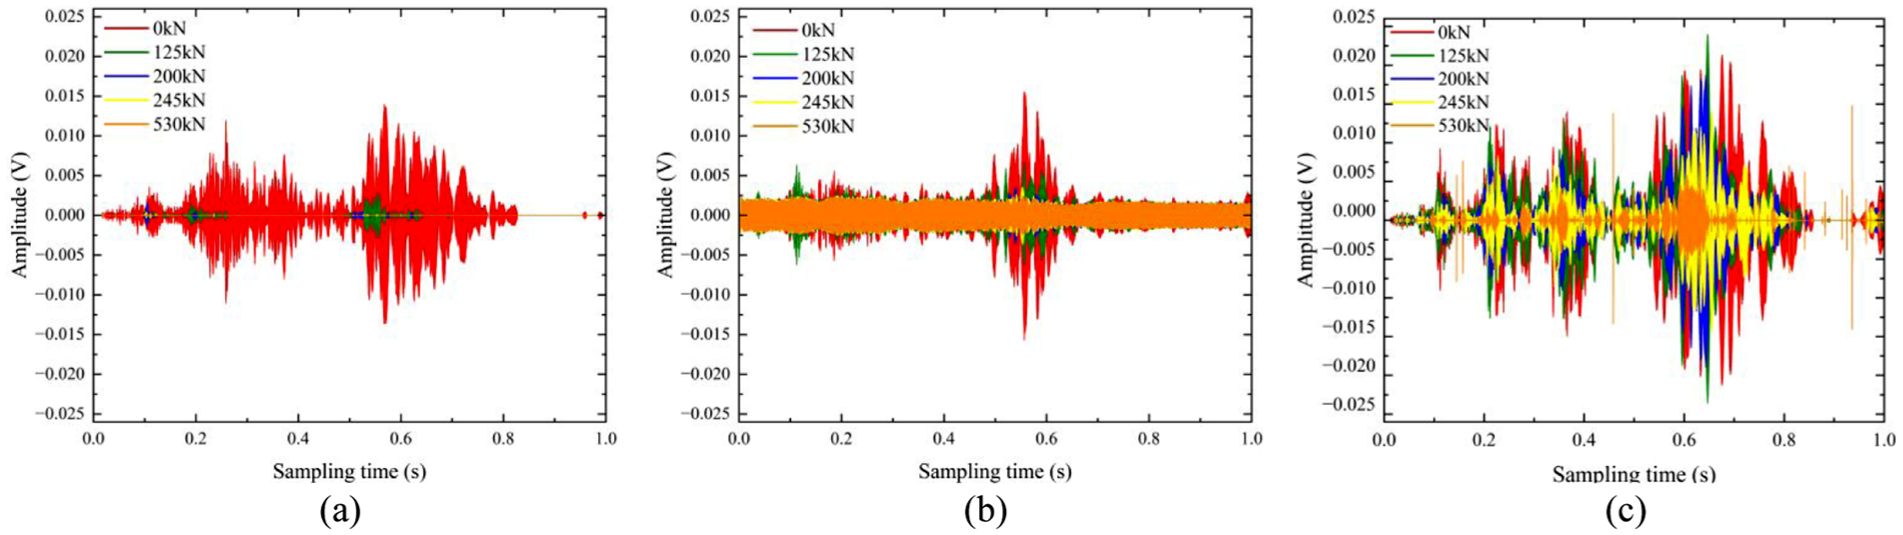
Time-domain signals from sensors: (a) SA0-SA1, (b) SA0-SA2, and (c) SA0-SA3 for beam B1 under different loads.
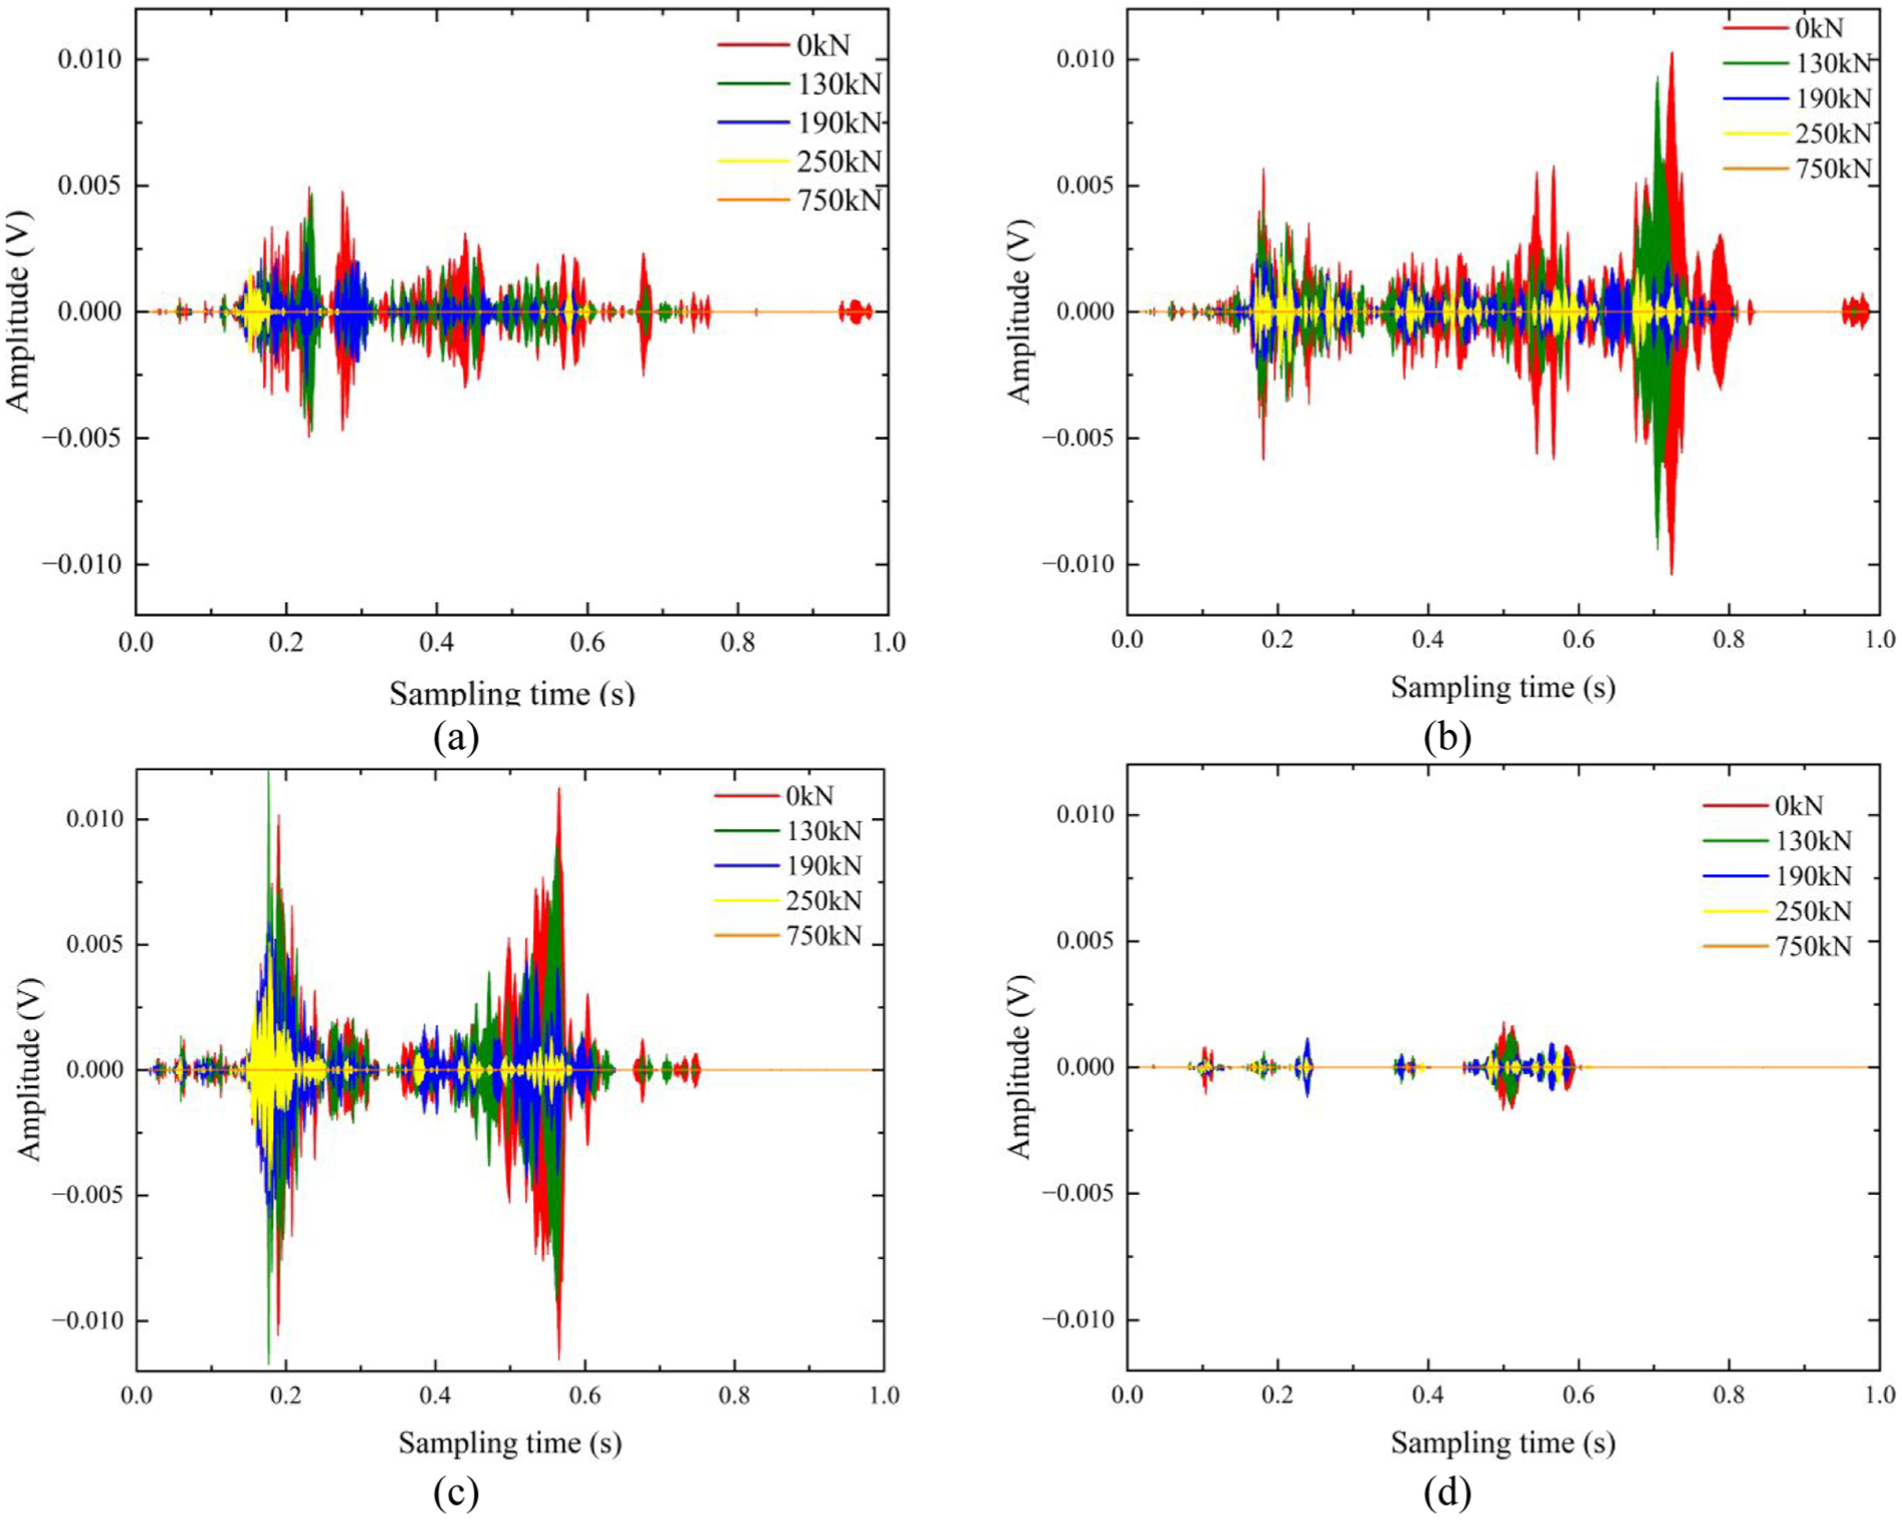
Time-domain signals from sensors: (a) SA0-SA1, (b) SA0-SA2, (c) SA0-SA3, and (d) SA0-SA4 for beam B2 under different loads.
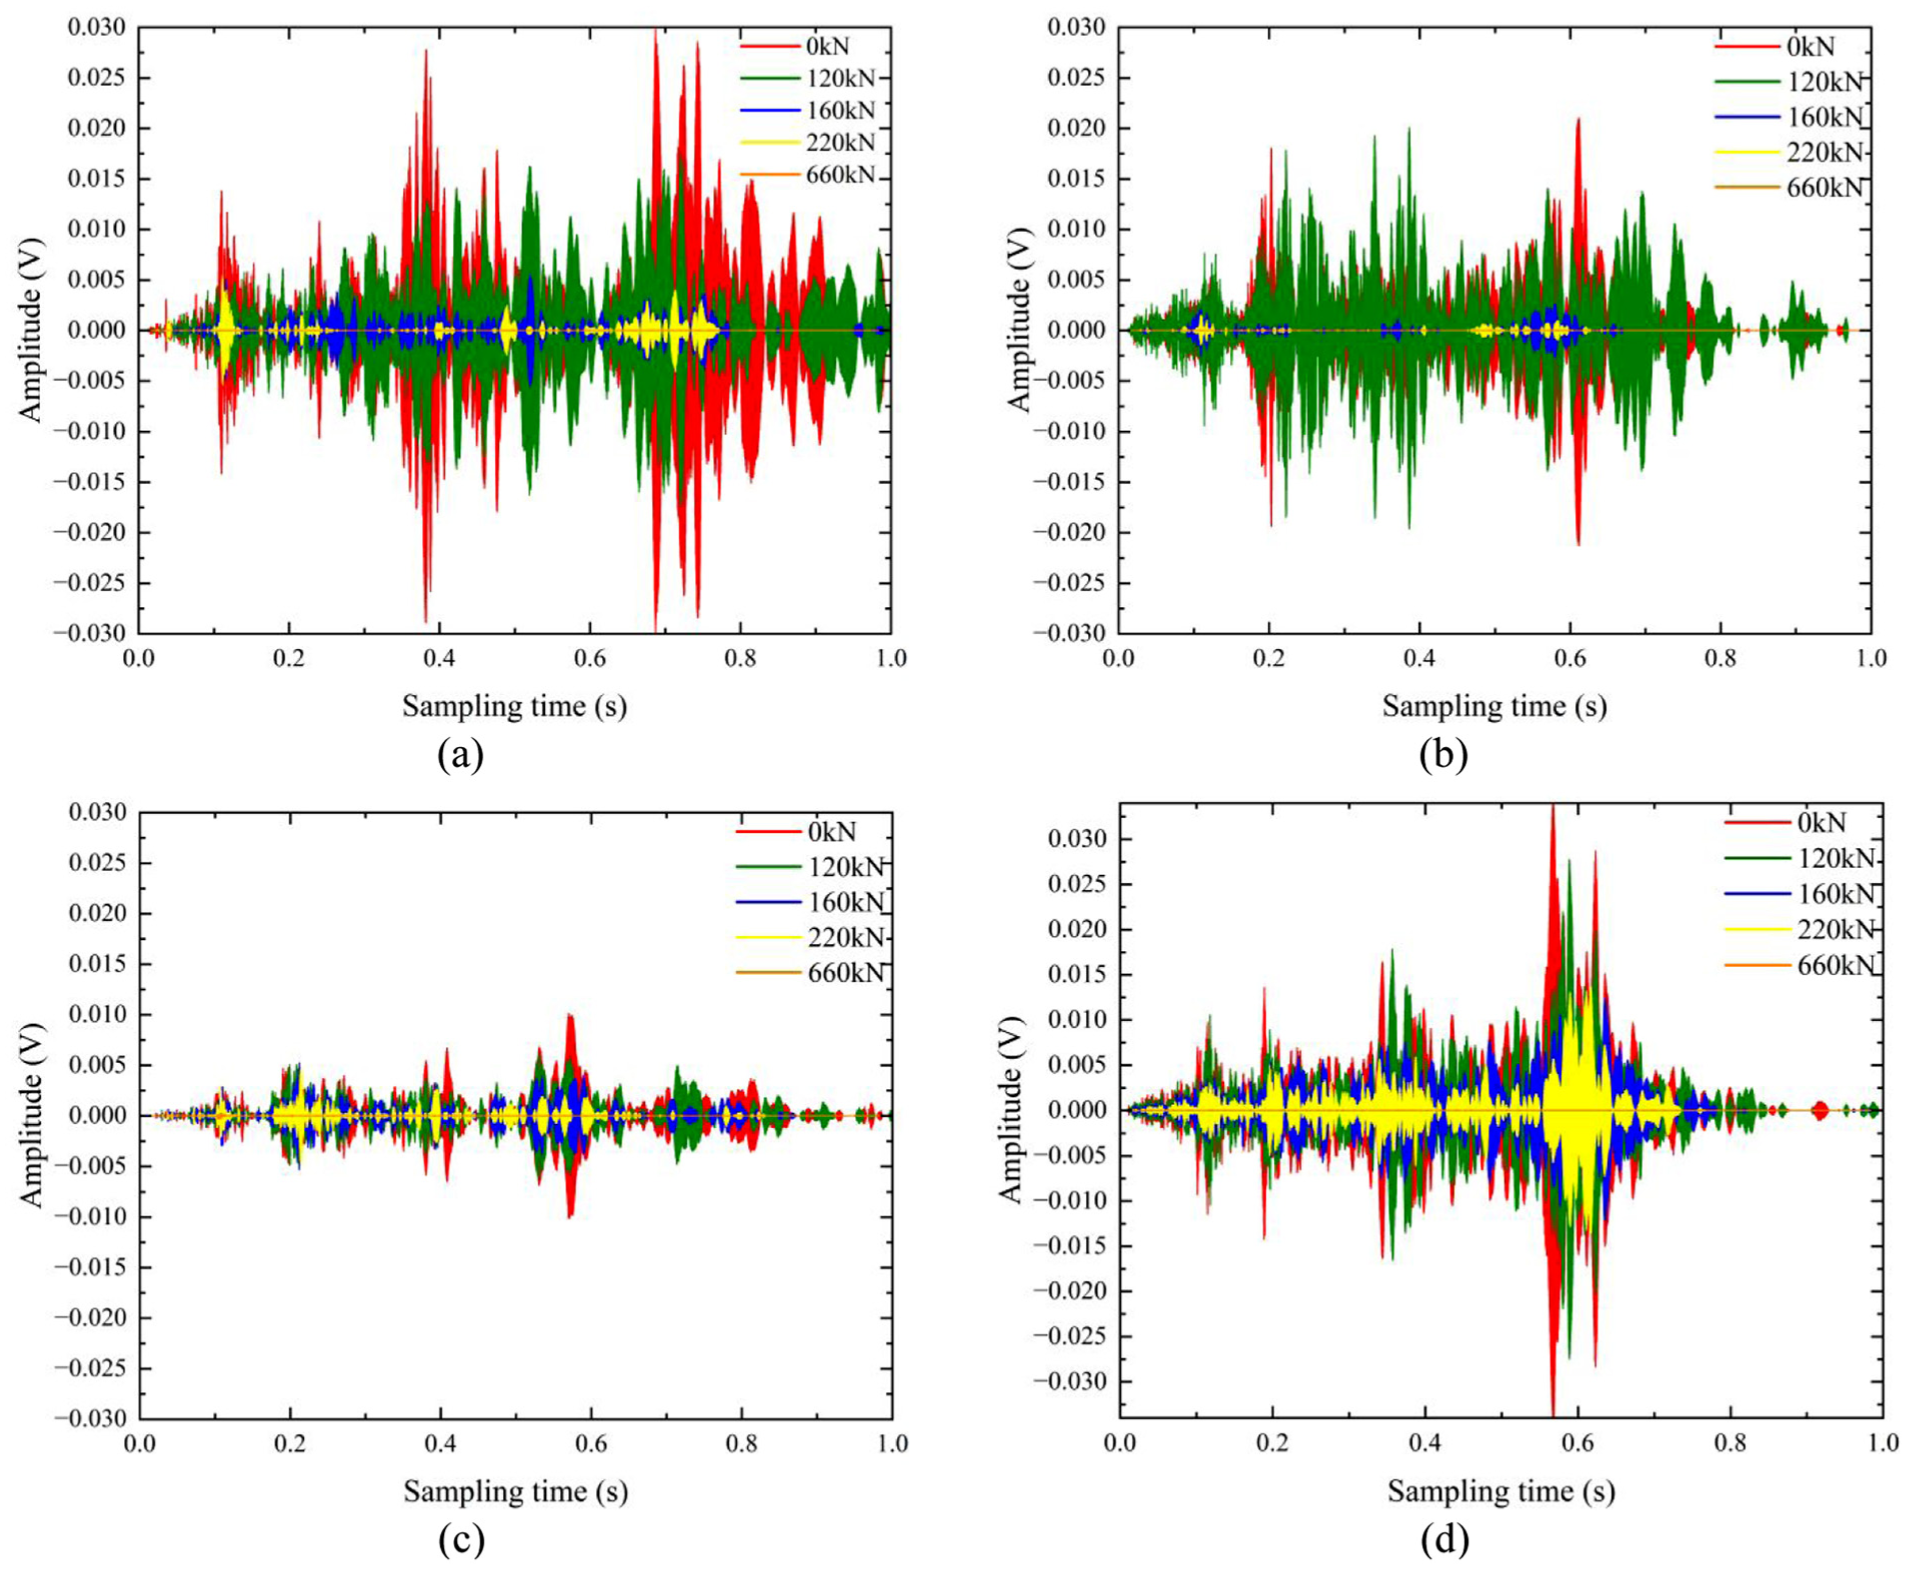
Time-domain signals from sensors: (a) SA0-SA1, (b) SA0-SA2, (c) SA0-SA3, and (d) SA0-SA4 for beam B3 under different loads.
To better study the relationship between amplitude and the identification of shear span cracks in the concrete beams, the peaks in the time-domain signals were analyzed. The peaks of the time-domain signals under different loading conditions were normalized against the peak value observed under the healthy state of the concrete beam, resulting in normalized peak values for different loading scenarios, as shown in Figure 12. The experimental results showed that when no cracks were present in the shear span region, the normalized peak value remained constant. Once cracks started to develop in the shear span region, cracks initiated at the bottom of the beam. The SA1 sensor placed at the bottom of the beam was the first to be affected, showing a reduction in its normalized peak value. As the crack continued to develop, the other sensors sequentially showed a decrease in their normalized peak values. Moreover, as the damage severity increased, the normalized peak values of all sensors further attenuated. When the beam reached severe damage, the amplitude reached its lowest point.
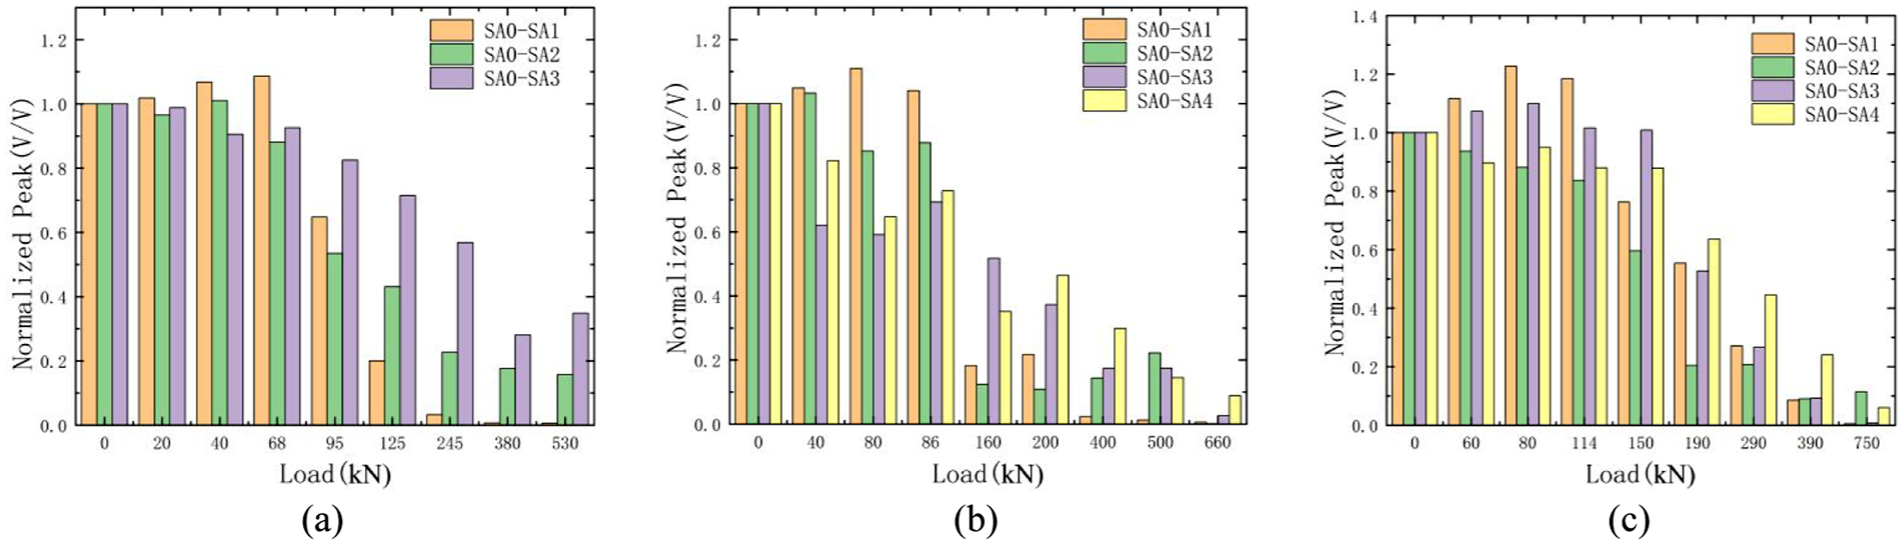
Normalized peak values of monitoring signals for beam: (a) B1, (b) B2, and (c) B3 under different loads.
The experimental results indicate that changes in time-domain amplitude can effectively identify damage in the shear span region of concrete beams. Additionally, by monitoring the changes in the normalized peak values from different sensors, it is possible to monitor the crack height in the shear span region. As the damage in the shear span region progresses, the degree of attenuation of the normalized peak values also increases, demonstrating that changes in the time-domain normalized peak values can identify the damage in the shear span and estimate the severity of the damage.
Frequency-domain analysis
To further explore the sensitivity of signal frequency characteristics to shear damage, Fast Fourier Transform (FFT) was applied to the denoised response signals to convert them from the time domain to the frequency domain. This analysis focused on the SA0-SA1 sensor pair, as SA1 is located near the bottom of the beam and exhibits higher sensitivity to the initiation and propagation of shear diagonal cracks (as confirmed in Section 3.3).
Frequency-domain signals of beams B1, B2, and B3 are presented in Figures 13–15, respectively, comparing the healthy stage (p = 0) and crack development stage (p = 0.5 Pu, where Pu denotes the ultimate bearing capacity). In the healthy stage, all beams exhibit distinct high-frequency characteristics: B1 shows a dominant frequency of 57.0 kHz with energy concentrated in the 40–80 kHz range; B2 has a dominant frequency of 68.6 kHz with energy distributed strongly across 50–80 kHz; and B3 features a dominant frequency of 56.4 kHz with energy focused in 50–80 kHz. As shear cracks develop at p = 0.5 Pu, consistent trends emerge across all beams: their dominant frequencies drop sharply (B1 and B2 to 10.3 kHz, B3 to 18.1 kHz), and energy shifts obviously toward lower frequency ranges (B1 in 5–20 kHz, B2 in 5–25 kHz, and B3 in 10–30 kHz). Such consistent trends of dominant frequency reduction and low-frequency energy redistribution across all three beams confirm the reliability of frequency-domain signals in reflecting the progression of shear cracks.
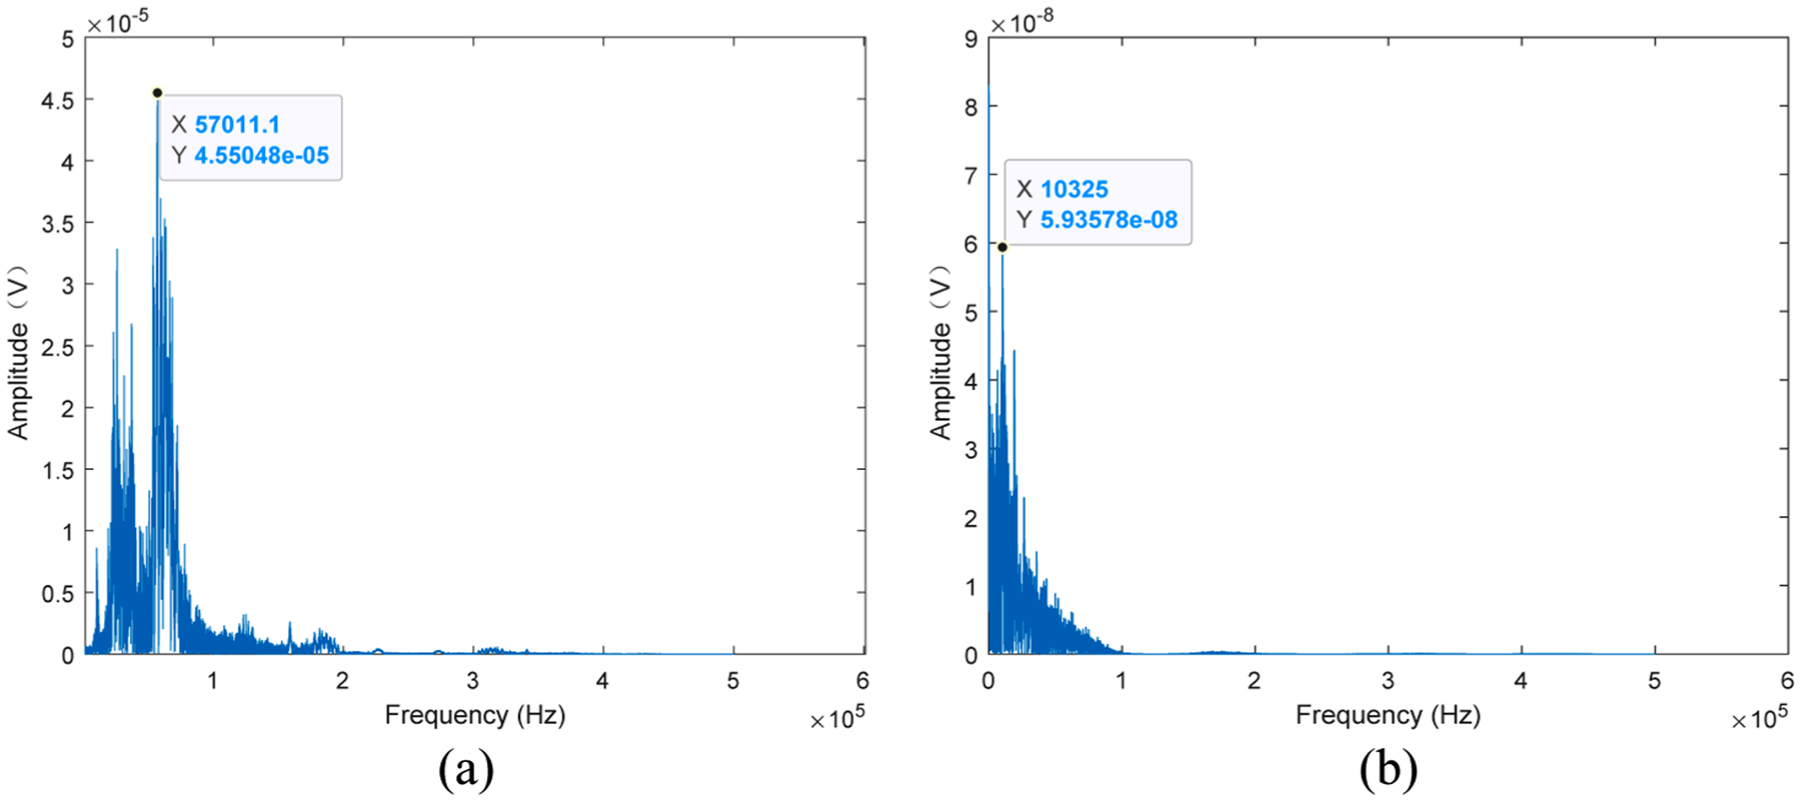
Frequency-domain signals from sensors SA0-SA1 of beam B1: (a) in the healthy stage and (b) in the crack development stage.
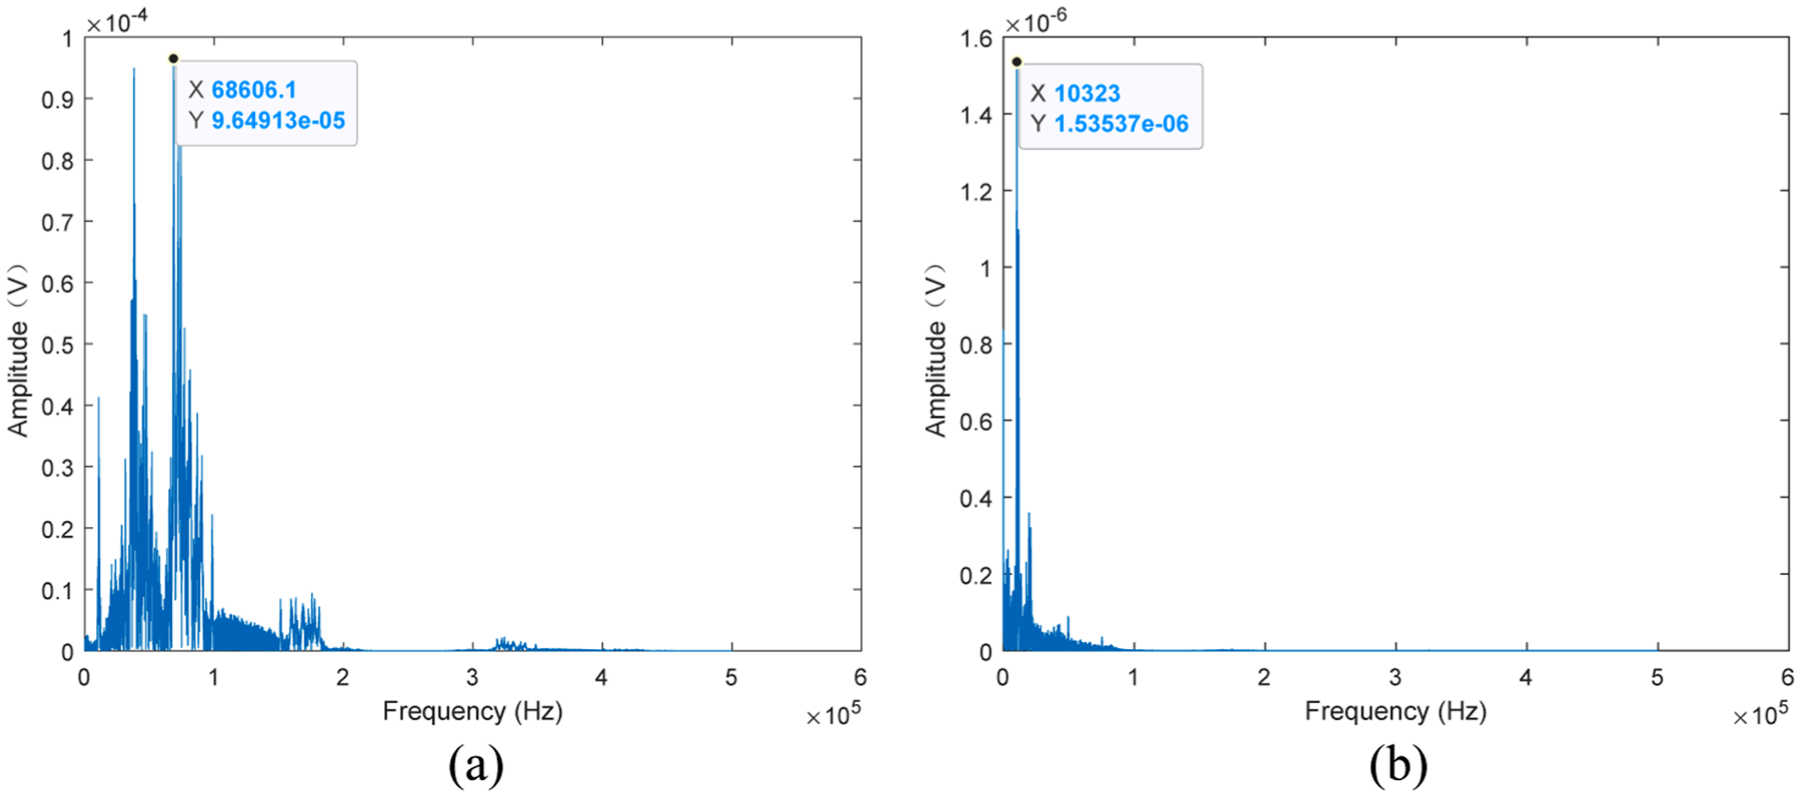
Frequency-domain signals from sensors SA0-SA1 of beam B2: (a) in the healthy stage and (b) in the crack development stage.
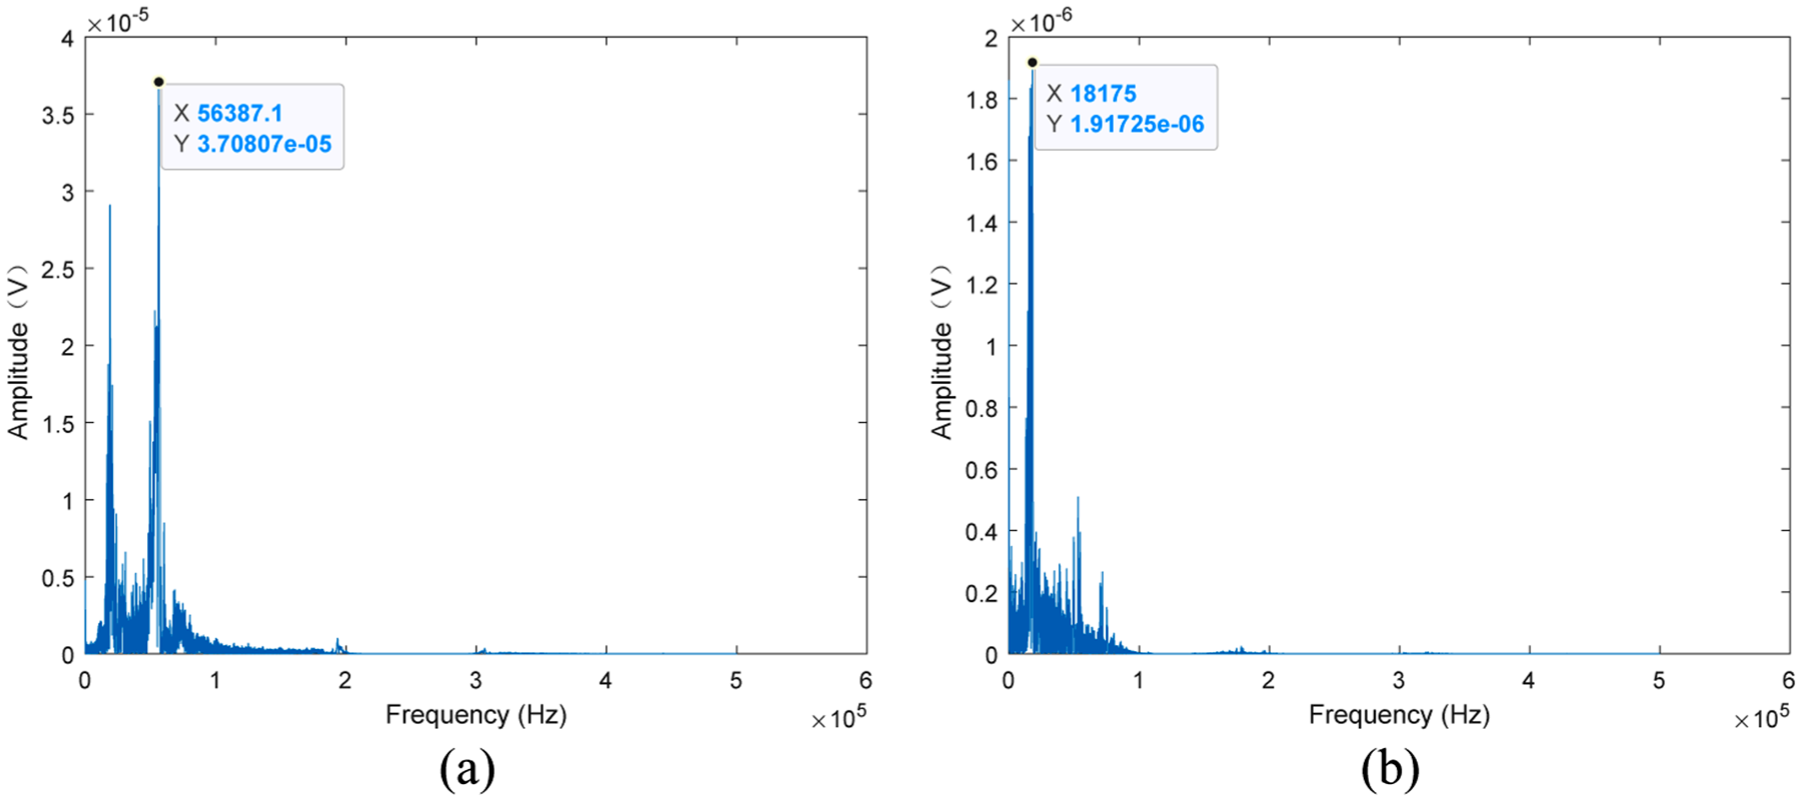
Frequency-domain signals from sensors SA0-SA1 of beam B3: (a) in the healthy stage and (b) in the crack development stage.
These results indicate that shear damage in the shear span region leads to a significant reduction in the dominant frequency of the response signals, accompanied by an energy shift from high frequencies to low frequencies. This phenomenon is attributed to the decrease in structural stiffness caused by crack propagation, which weakens the structure’s ability to transmit high-frequency stress waves. The frequency range of 10–30 kHz in the damage stage and 40–80 kHz in the healthy stage are identified as the most sensitive to shear crack development, further validating the effectiveness of frequency-domain analysis in evaluating shear performance of GFRP-RC beams.
Energy-based analysis
The change in signal amplitude is ultimately related to the change in signal energy. The presence of damage has a significant effect on the attenuation of signal energy, making the use of signal energy as a feature parameter for evaluating damage a feasible approach. In this experiment, the response signals were decomposed using a three-level wavelet packet transform, with the “db3” wavelet function selected, resulting in eight frequency bands at the third decomposition level. The sampling frequency of the experiment was 1 MHz, and according to the Nyquist sampling theorem (Lévesque, 2014), the highest frequency that could be accurately captured was 500 kHz. Therefore, each frequency band in the third level of the wavelet packet decomposition contained signals with frequencies of up to 62.5 kHz. The excitation signal was a sweep sine wave ranging from 100 Hz to 100 kHz. To improve the signal-to-noise ratio, the energy values of the first two frequency bands (0–125 kHz) were selected for analysis. The wavelet packet energy spectra of the response signals in the healthy state are shown in Figure 16. It can be inferred from the figure that the energy proportion of the first two frequency bands exceeds 90%. Because lower frequency components are less affected by scattering and are better suited for long-range propagation in heterogeneous concrete. Using these two frequency bands to reconstruct the response signal meets the requirements.
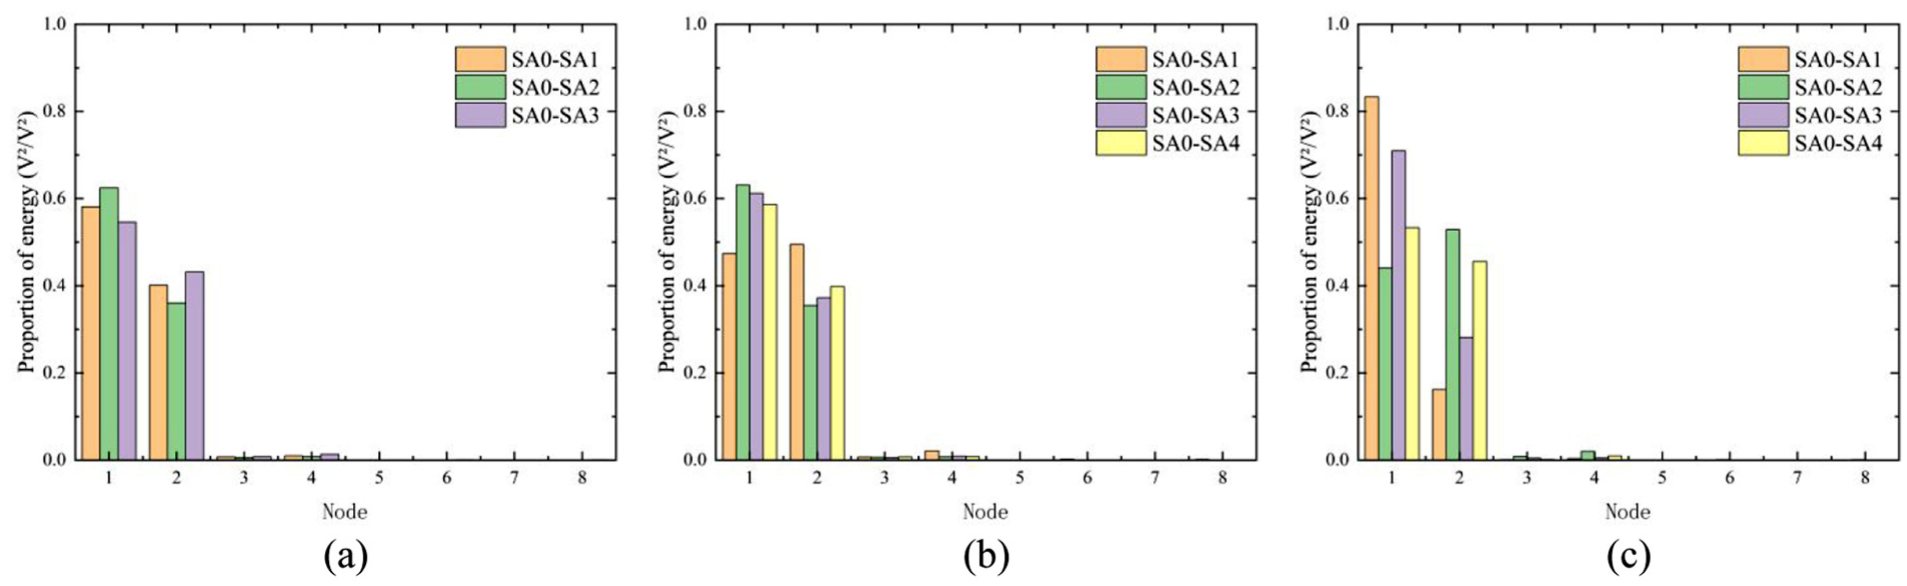
Wavelet packet energy spectra of monitoring signals for beam: (a) B1, (b) B2, and (c) B3.
For more accurate identification of shear failure in beams using signal energy, a Shear Damage Index (SDI) based on wavelet packet energy was established, as shown in equations (5) and (6).
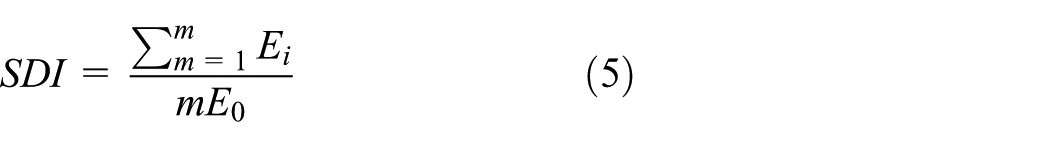
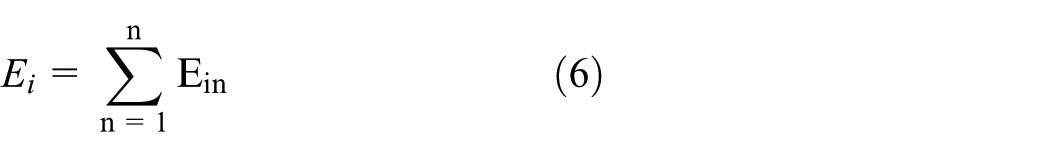
where E i is the sum of energy values for the n most sensitive frequency bands at time i, while E0 is the sum of energy values for the same frequency bands in the healthy state, with m representing the number of receivers.
This study also performed a correlation analysis of the proposed SDI values and the beam’s overall condition. Figure 17, which presents tensile strain contour plots (acquired via DIC) of the shear spans at load levels of 0.1 Pu, 0.5 Pu and Pu, demonstrates that the shear-compression failure process of the beams can be divided into three stages: (1) the healthy state, (2) the crack development stage, and (3) the severe damage stage. Generally, as the load increased, high tensile strains propagated from the support locations toward the nearest loading points, indicating that diagonal cracks initiated in the lower-middle region of the beams near the supports and subsequently extended toward the loading points. In the healthy stage, the SDI values remain overall unchanged (close to 1.0), and no cracks appear in the concrete beam. During the crack development stage, when an inflection point appears in the load-displacement curve, it indicates a change in the shear span stiffness of the beam, marking the initiation of cracks. The corresponding SDI values of the response signals drop sharply. In the severe damage stage, due to the propagation of the main diagonal crack, which dissipates all the signal energy, the energy values received by the SA sensors drop to the lowest point, and the corresponding SDI values are approximately 0. Comparing the overall energy analysis with the load-displacement curve shows a clear correlation, proving that this approach can effectively monitor shear-compression failure in concrete beams.
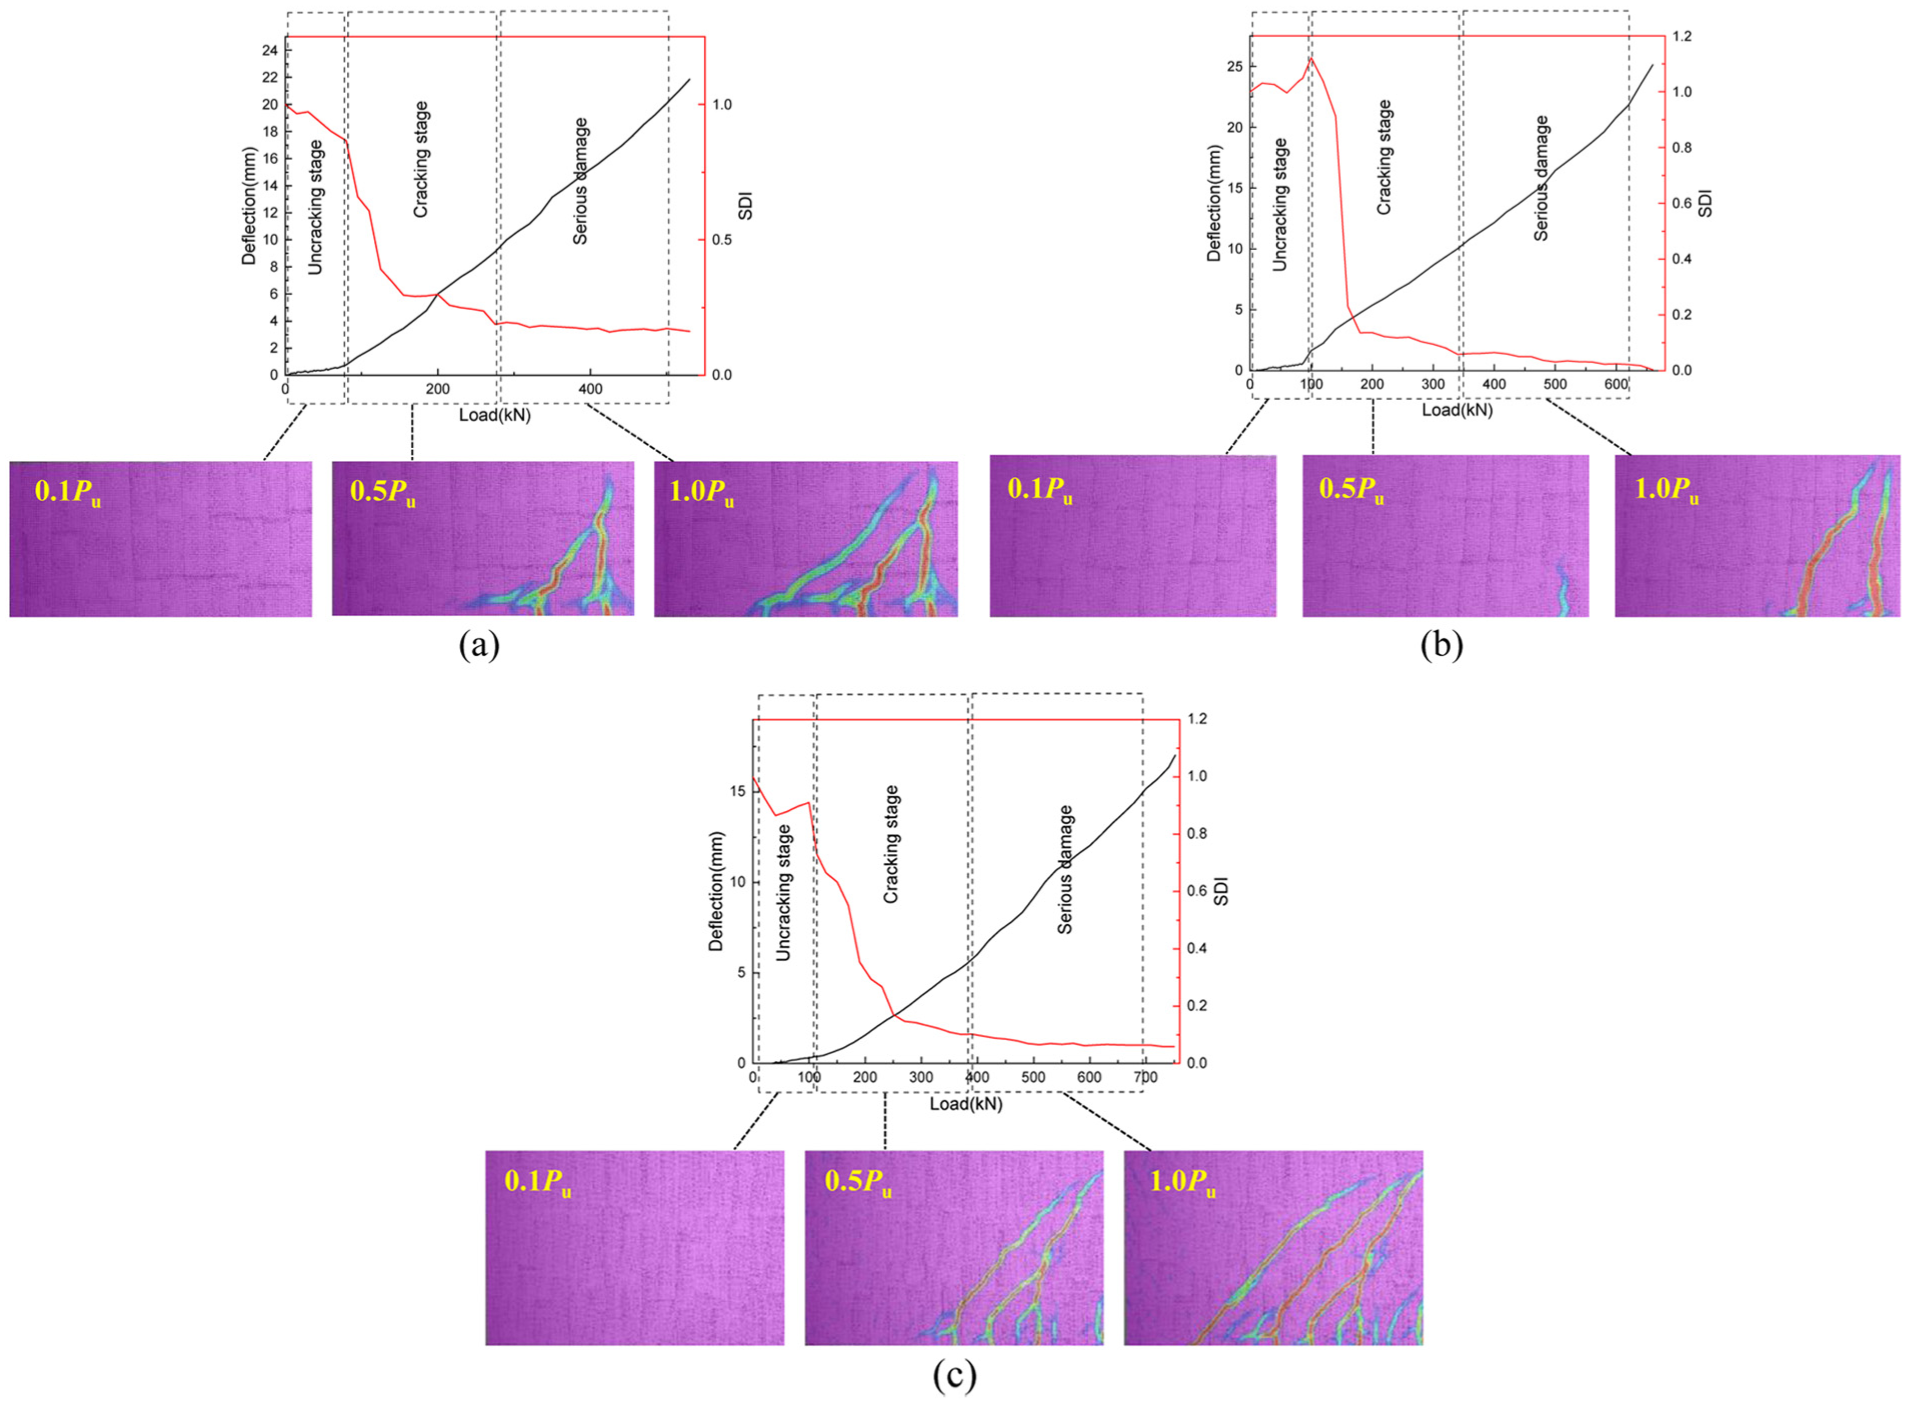
Contour plots of principal tensile strains depicted by DIC and energy-based analysis for beam: (a) B1, (b) B2, and (c) B3.
Numerical simulation of shear span inclined cracks in FRP-RC beams
Modeling
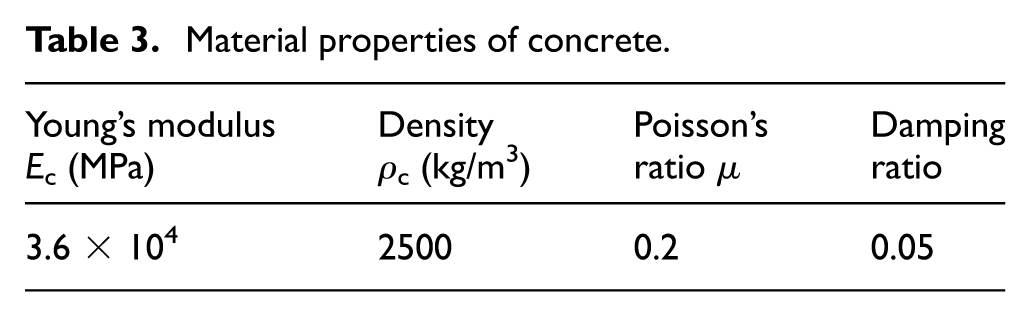
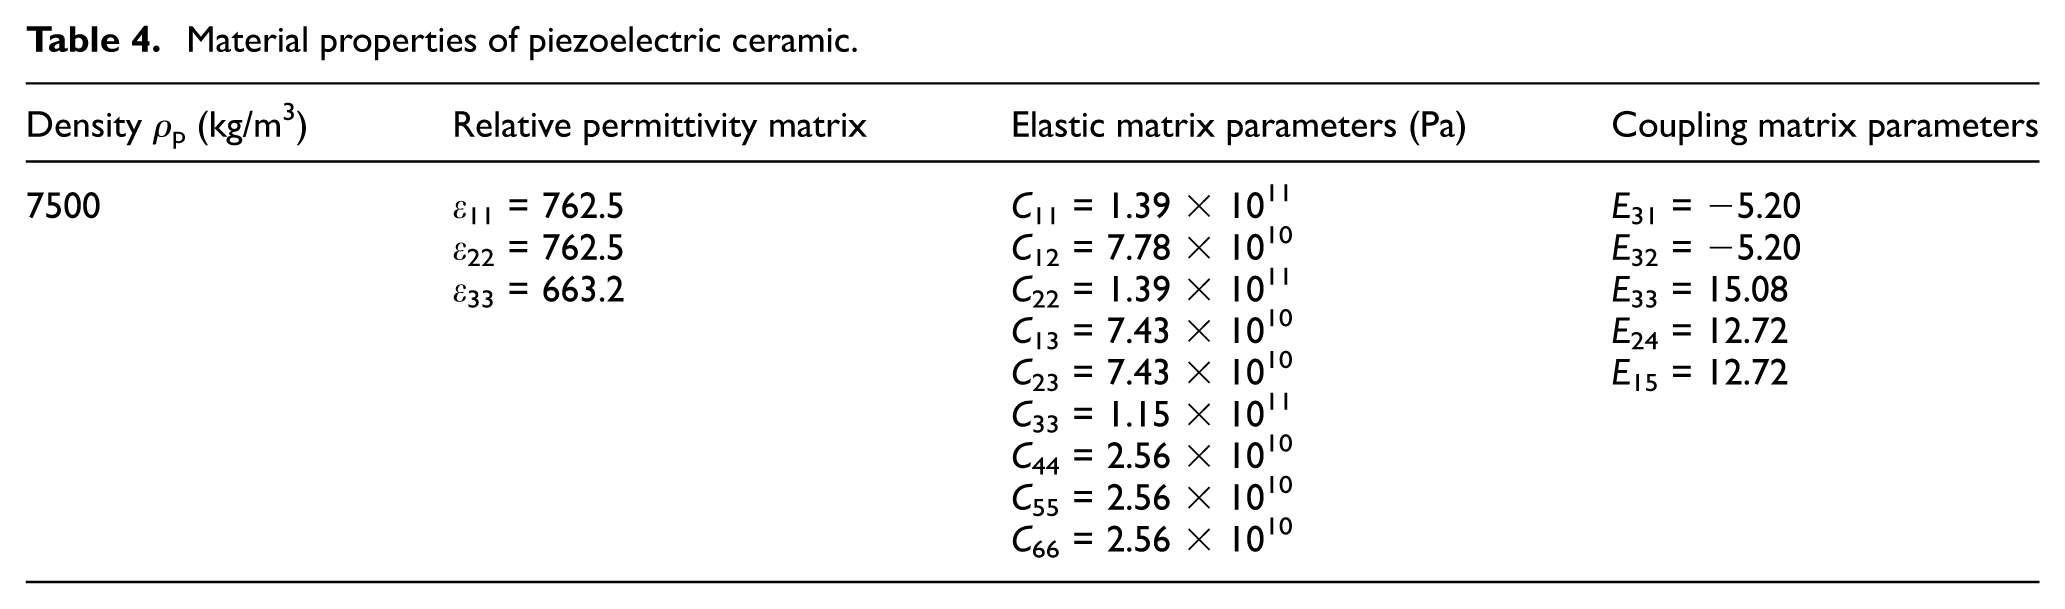
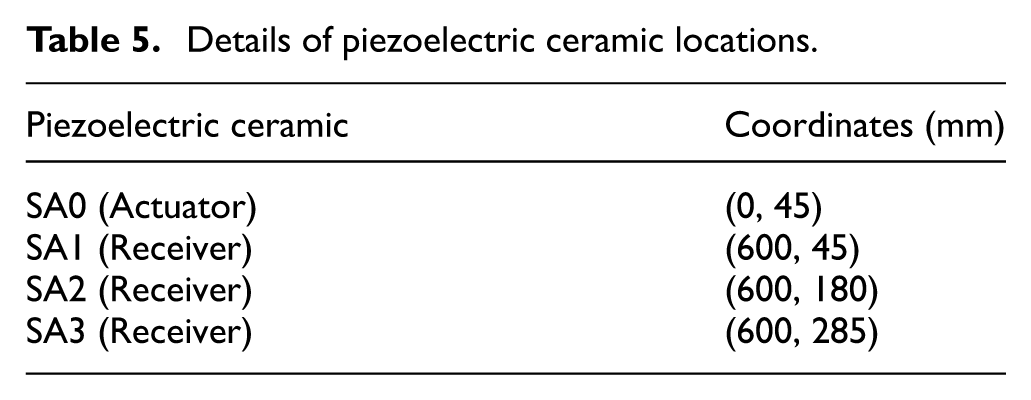
The COMSOL finite element software was used to model the concrete structure and piezoelectric sensors, with the material properties of each component listed in Tables 3 and 4 respectively. The model adopts plane strain elements to simplify calculations. The meshing uses free triangular grids with refined meshing in crack and sensor regions: maximum element size is 3.2 mm; minimum element size is 0.0064 mm to ensure calculation accuracy (Figure 18). Rayleigh damping with a damping ratio of 0.05 is assigned to concrete to simulate energy attenuation during stress wave propagation. The origin of the coordinate system was positioned at the lower-left corner of the concrete structure, and the arrangement of the SA is presented in Table 5. The polarization direction of all piezoelectric sensors is along the three-direction (perpendicular to the long side), as illustrated in the coordinate system and layout schematic diagram in Figure 18(a). The upper and lower boundaries of the beam are set as elastic boundaries to simulate stress wave reflection, while the left and right boundaries are low-reflection boundaries to reduce boundary interference.
Material properties of concrete.
Material properties of piezoelectric ceramic.
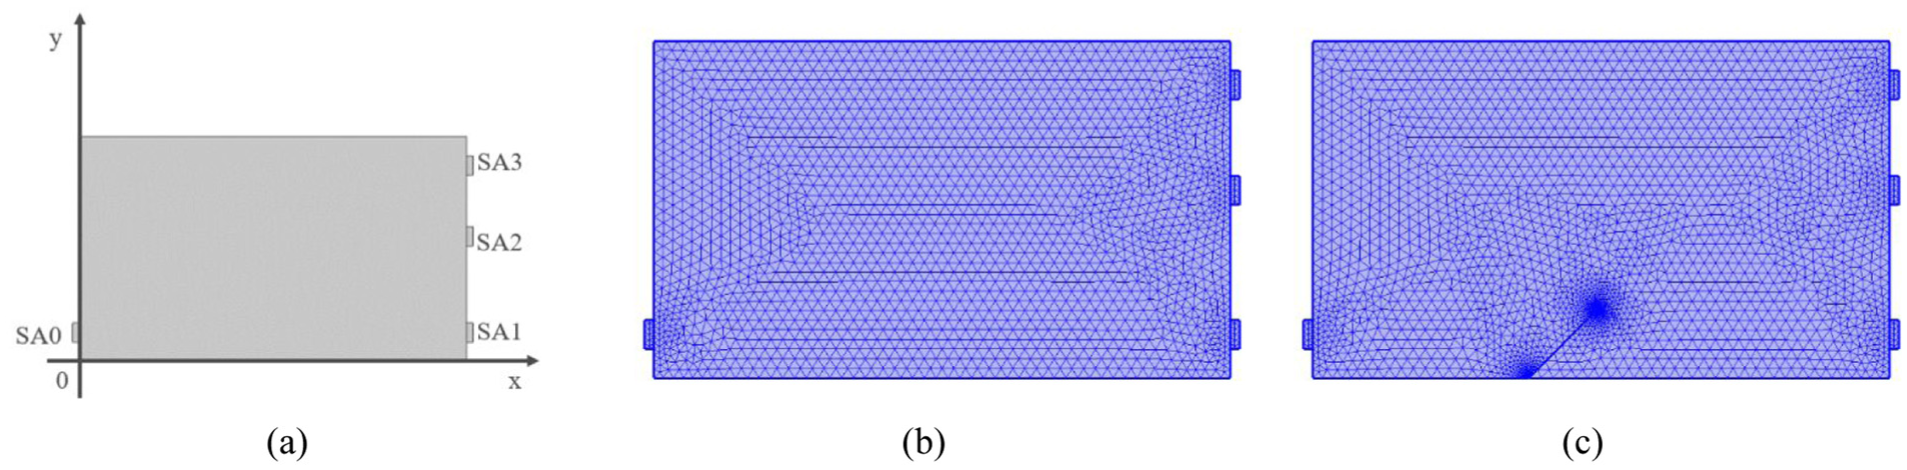
(a) Coordinate system and piezoelectric placement schematic of the model in (b) healthy and (c) damaged state.
Details of piezoelectric ceramic locations.
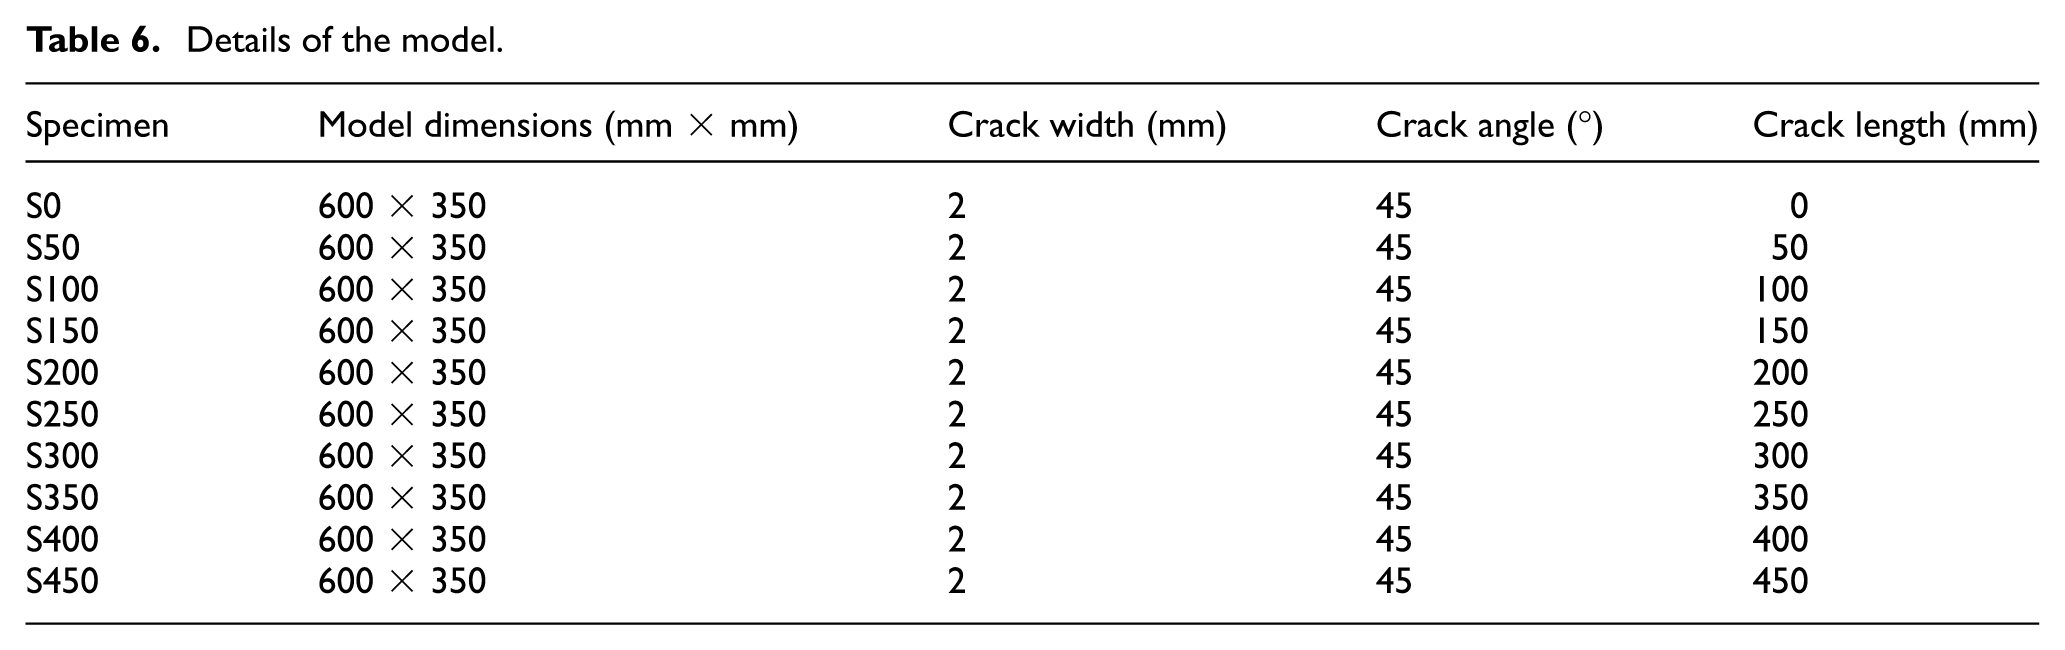
The simulation considered the crack length to represent different damage levels in the concrete beam, where a crack length of 0 mm indicates no damage and the crack width was set at 2 mm. This study focuses on shear-compression failure in concrete beams, so inclined cracks were introduced with a crack angle of 45°. The detailed parameters of the model are shown in Table 6 and the schematic diagram of the model is presented in Figure 18.
Details of the model.
In the simulation, a sweep sine wave signal with a frequency range of 100 Hz to 100 kHz and an amplitude of 1 V was applied as the excitation signal. To save computational time while ensuring accuracy, the simulation duration was set to 500 μs. The excitation signal was applied to the actuator (SA0), and the voltage signals were received by other sensors (SA1, SA2, SA3).
Stress wave propagation analysis
To analyze the stress wave propagation under damaged conditions, specimens S50 (with a crack length of 50 mm) and S150 (with a crack length of 150 mm) were selected as examples in this numerical simulation section. As shown in Figure 19, at the initial stage, the excitation signal was applied to SA0. Under the influence of the inverse piezoelectric effect, SA0 deformed, inducing stress waves in the concrete structure.
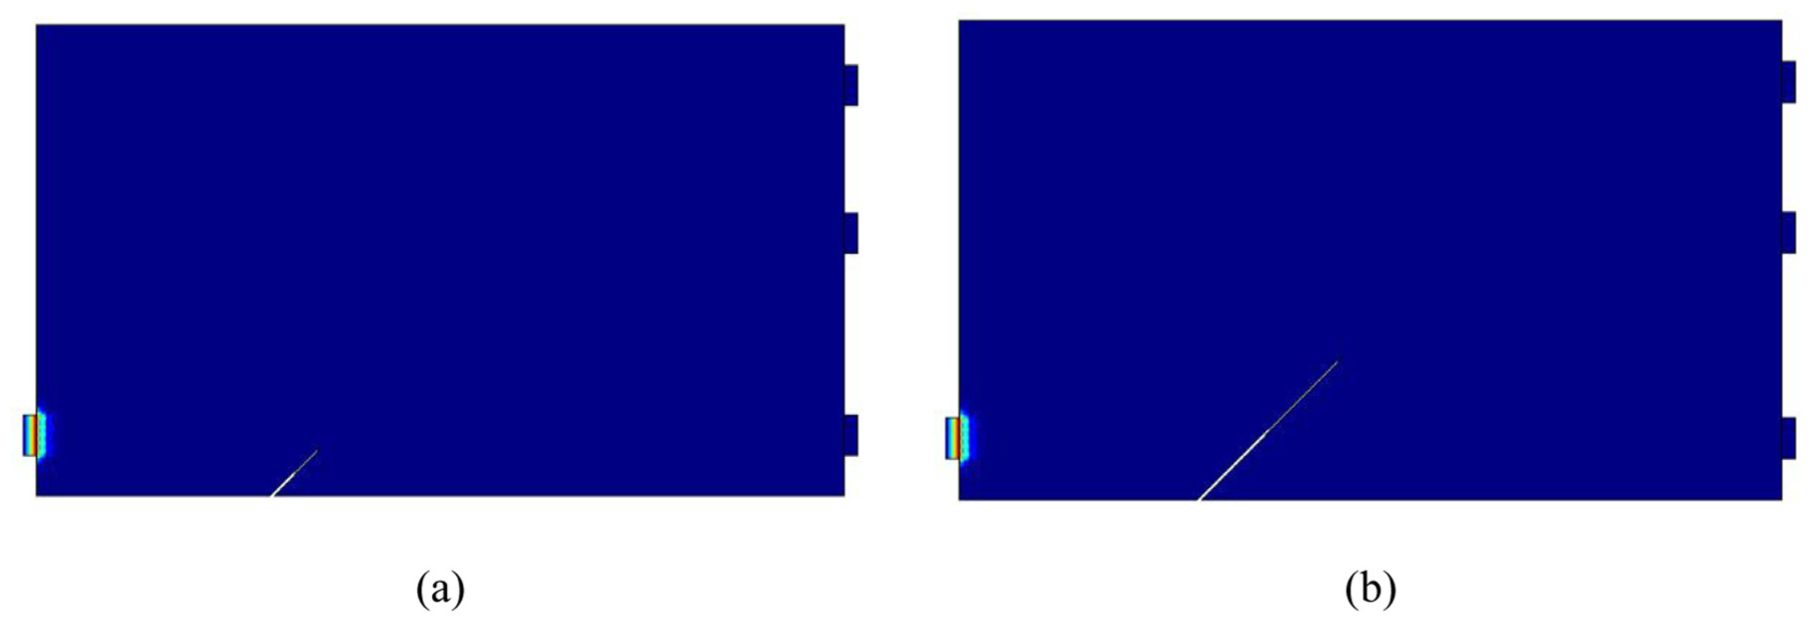
Stress wave of specimen: (a) S50 and (b) S150 at initial time, t = 0 μs.
At t = 62 μs, as shown in Figure 20, the stress wave exhibited a clear spherical propagation pattern. Upon reaching the crack, the wave encountered a discontinuity in the medium due to the crack, leading to reflection, diffraction, and attenuation of the stress wave energy.
Stress wave of specimen: (a) S50 and (b) S150 at t = 62 μs.
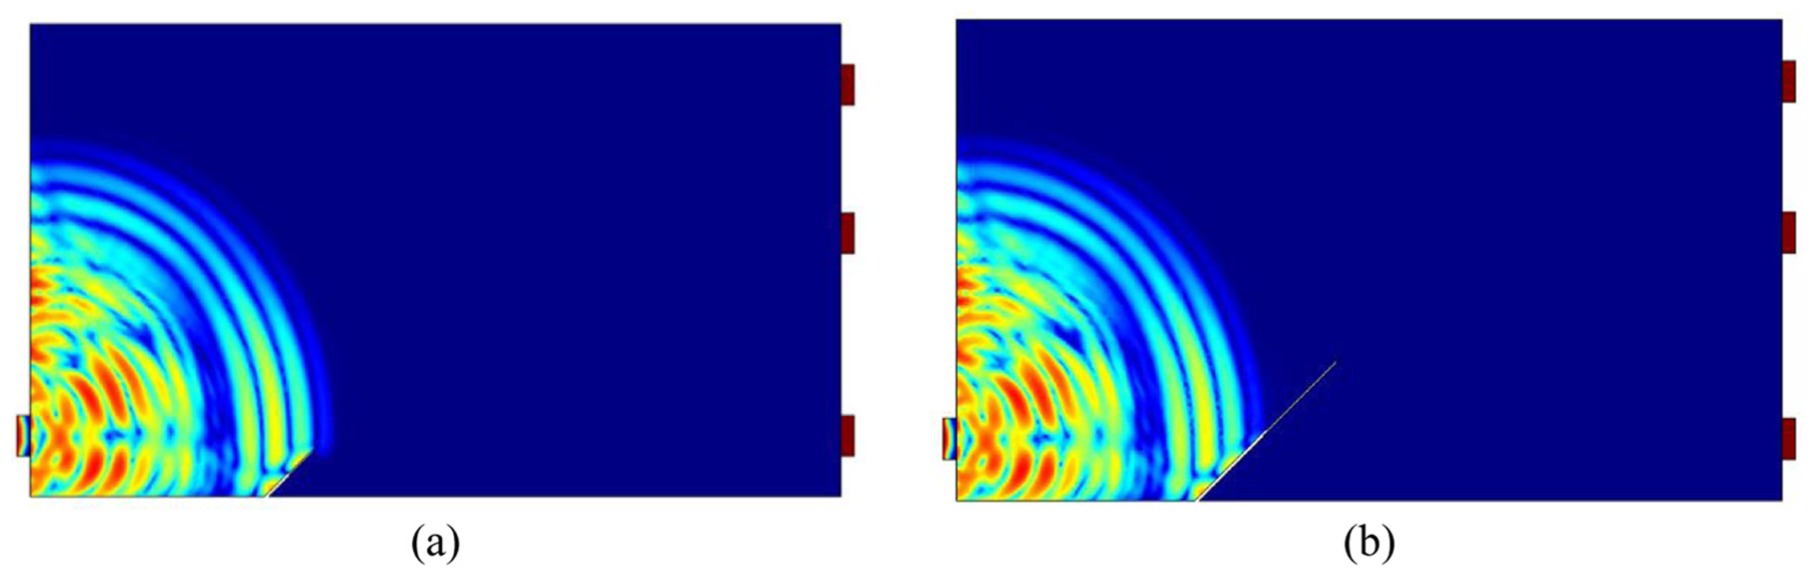
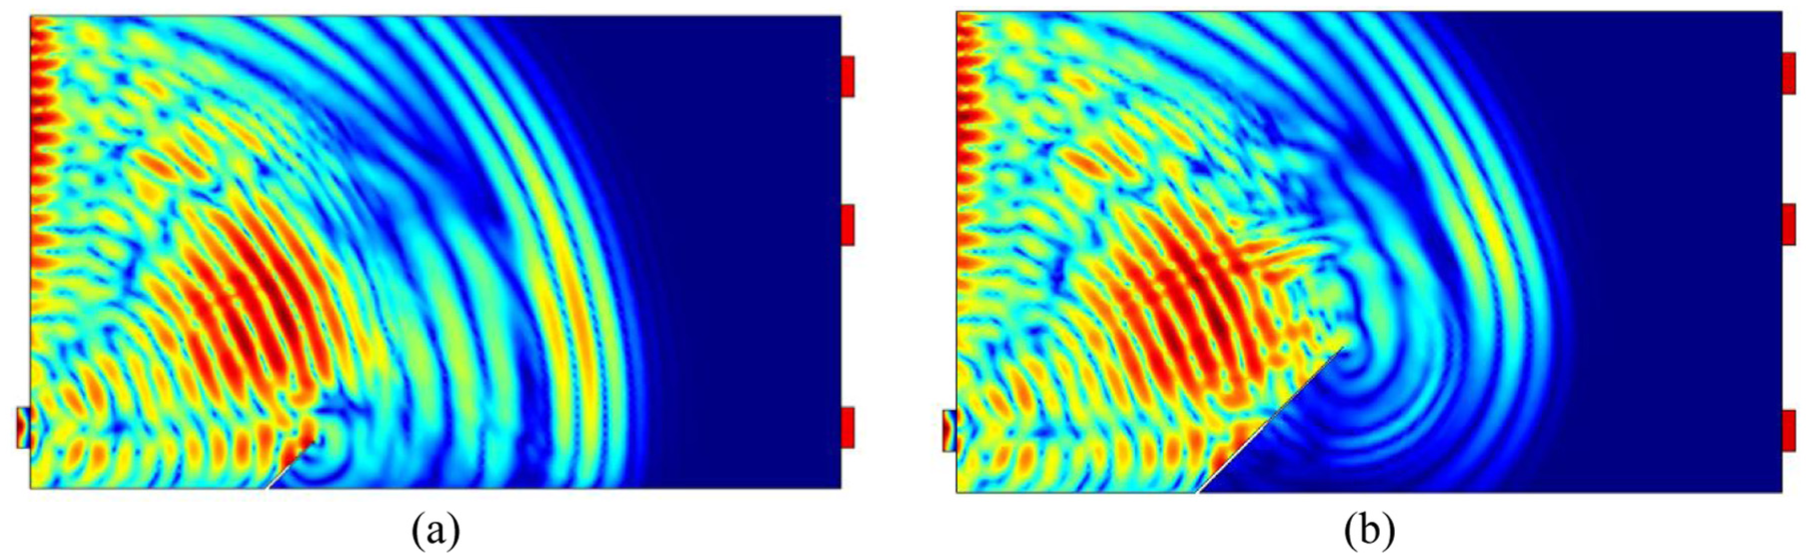
As illustrated in Figure 21, at t = 83 μs, an evident diffraction phenomenon occurred at the crack tip in the S50 specimen. The stress wave bypassed the discontinuity in the medium and propagated to the other side. For the S150 specimen, due to the larger crack height and greater damage severity, the crack had a more significant impact on the stress wave at the bottom, causing the stress wave energy on the right side of the crack to be much smaller than in the S50 specimen.
Stress wave of specimen: (a) S50 and (b) S150 at t = 83 μs.
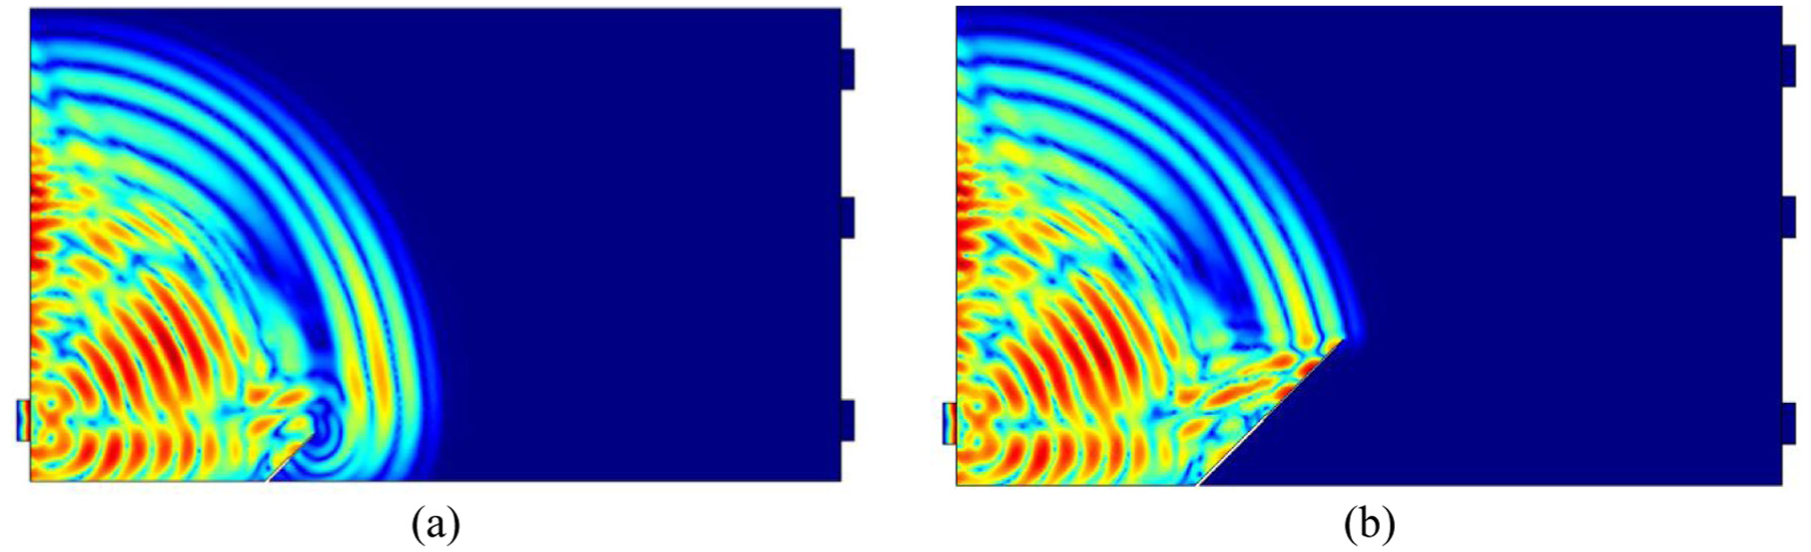
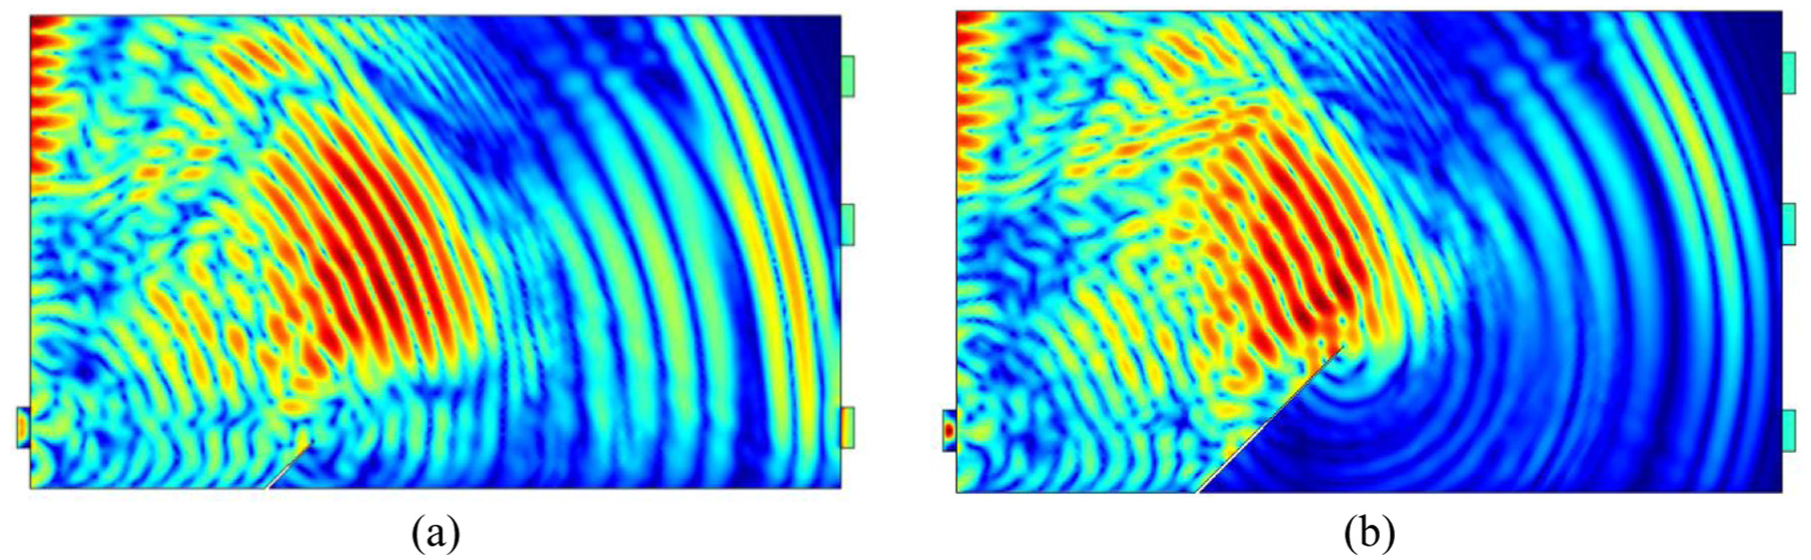
At t = 123 μs, as shown in Figure 22, the stress wave energy in the bottom region of the S50 specimen was much greater than that in the S150 specimen. As the waves propagated upward, the difference in stress wave energy between the two specimens gradually diminished.
Stress wave of specimen: (a) S50 and (b) S150 at t = 123 μs.
Finally, at t = 165 μs, as shown in Figure 23, the stress waves reached the receiver. The positive piezoelectric effect at the receiver generated a voltage signal, which was recorded as the response signal of the sensor pair. The energy of the stress wave received by the sensors in the S50 specimen was greater than that in the S150 specimen, with the energy difference at SA1 being larger than at SA2. This indicates that as the crack height increases (i.e. as the beam damage becomes more severe), the energy received by the piezoelectric sensors decreases. This phenomenon is more pronounced when the crack is located along the propagation path.
Stress wave of specimen: (a) S50 and (b) S150 at t = 165 μs.
Time-domain analysis
From the stress wave propagation analysis, it is evident that as the crack length increases, the energy received by the sensors decreases, leading to a corresponding reduction in the amplitude of the time-domain signals. Therefore, in practical engineering applications, the time-domain amplitude measured by SA can serve as an effective indicator for assessing the health condition of concrete structures.
As shown in Figure 24, increasing crack lengths cause a clear and progressive decrease in signal amplitude. Among the sensors, SA1—located at the bottom of the beam—experienced the most rapid amplitude reduction, followed by SA2 and SA3. These results indicate that damage in the shear span region can be identified by monitoring changes in amplitude, and the vertical position of the sensors enables estimation of crack height and propagation.
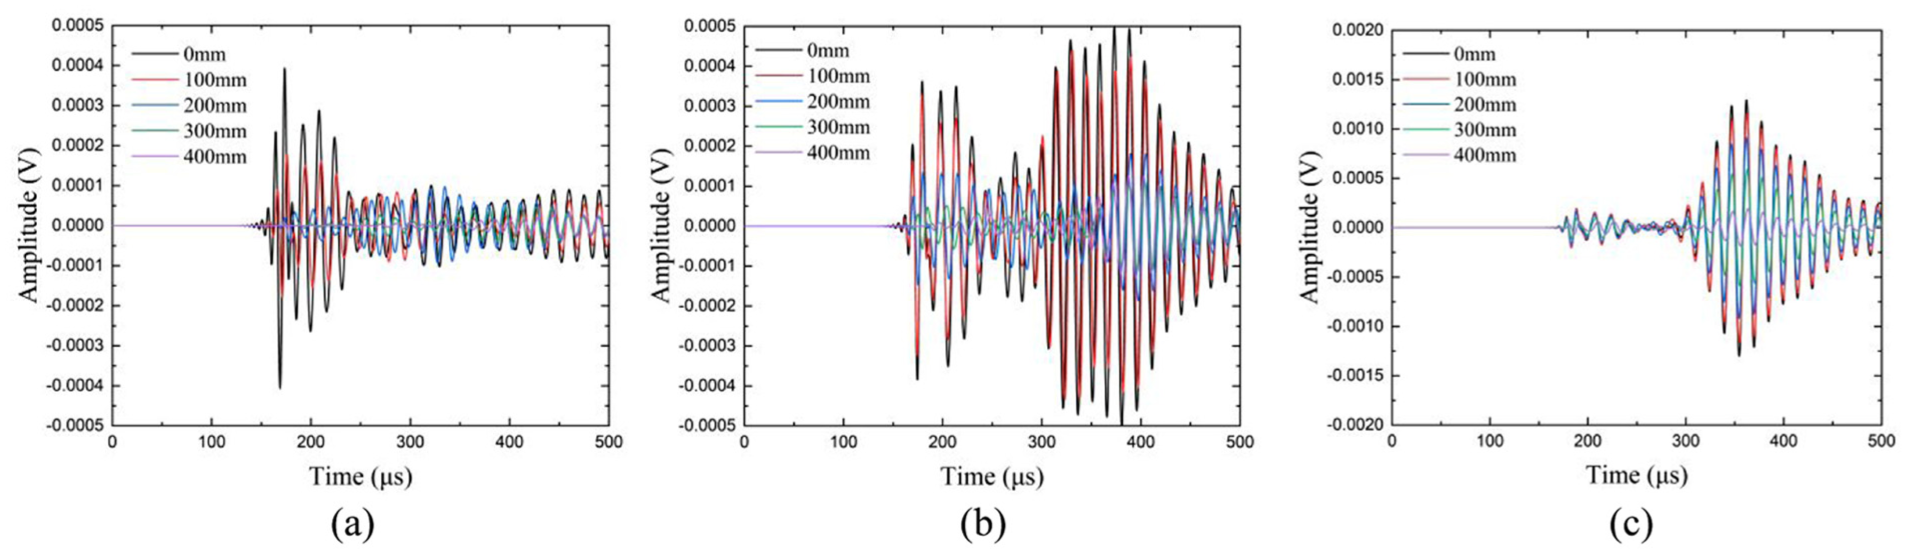
Time-domain signals from sensors: (a) SA0-SA1, (b) SA0-SA2, and (c) SA0-SA3 for specimens with different crack length.
To further quantify this observation, the peak amplitudes of time-domain signals under various damage conditions were normalized relative to the healthy-state signal. The resulting normalized peak values are presented in Figure 25, where a clear downward trend is observed with increasing crack length. Again, SA1 exhibited the earliest and fastest reduction, while SA3—located near the beam top—showed the slowest change.
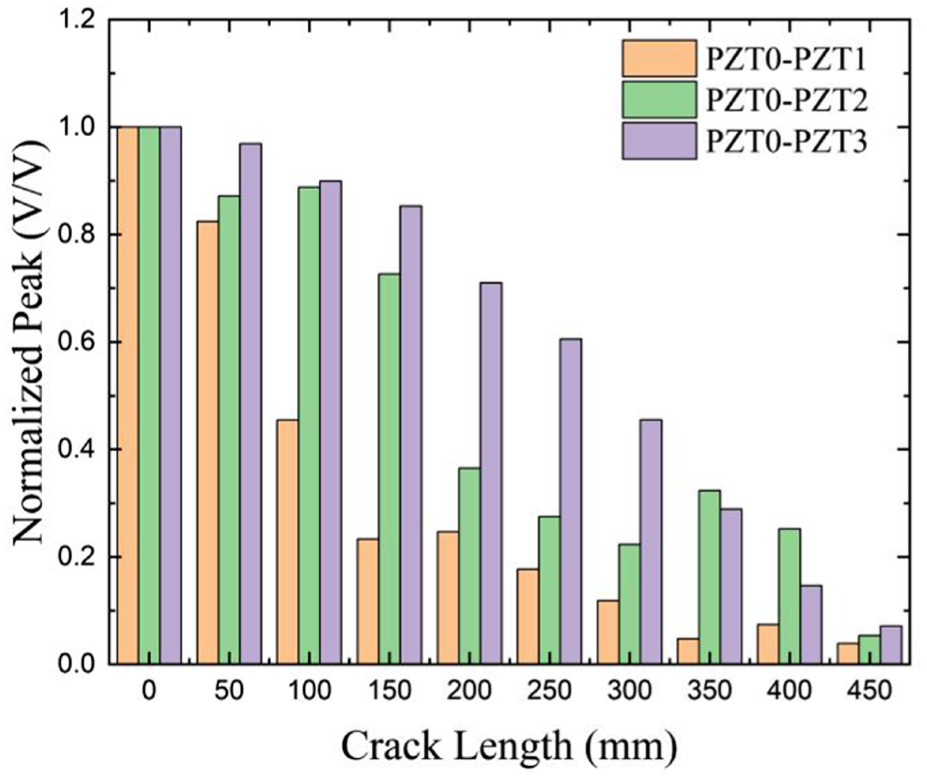
Normalized peak values of sensors for specimens with different crack length.
These findings confirm that normalized peak values of time-domain signals can not only identify the presence of damage in the shear span but also help estimate the vertical extent of crack development in GFRP-reinforced concrete beams.
SDI evaluation
The Shear Damage Index (SDI) proposed in this study was used to analyze the simulation data, and the results are shown in Figure 26. In the healthy state, the SDI value is 1. As damage occurs in the structure, the SDI value decreases, indicating that 0 < SDI < 1. The SDI value continues to decrease with the increasing severity of damage. When the beam approaches complete failure, the SDI approaches 0. This damage metric is highly sensitive to structural damage, demonstrating that the SDI based on wavelet packet energy can effectively identify damage in the shear span region of concrete beams and can quantitatively assess the extent of the damage.
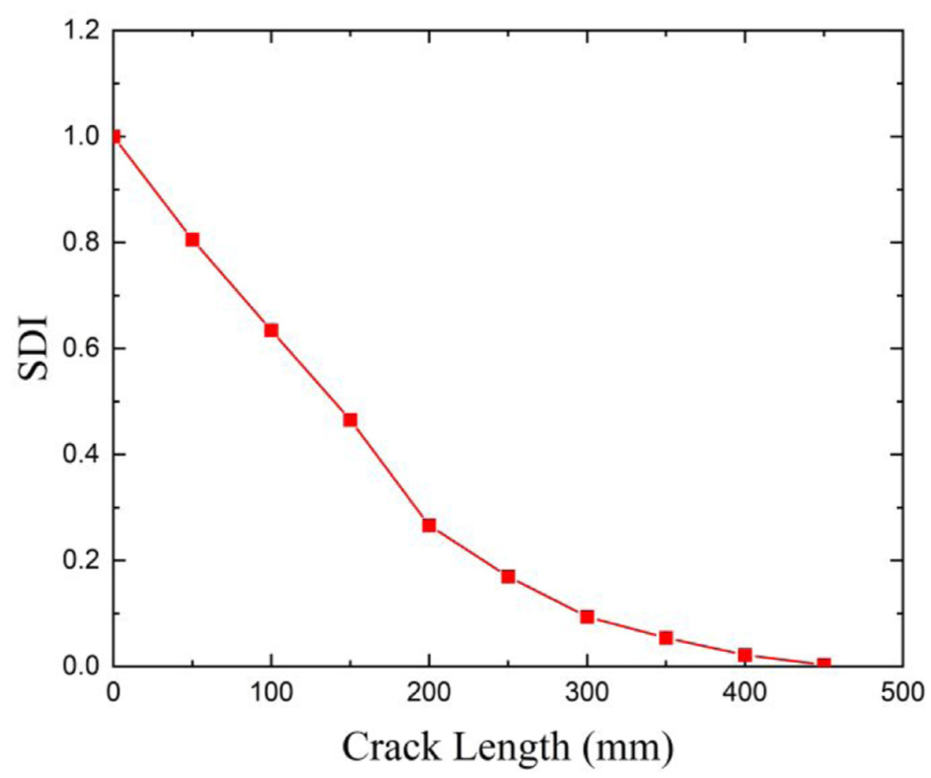
SDI analysis for specimens with different crack length.
Model validation
To verify the reliability of the finite element model, experimental and simulation results are compared in terms of three key features: (1) Time-domain signal amplitude attenuation: simulation shows that signal amplitude decreases with crack length (Figure 24), consistent with experimental observations (Figures 9–11 in Section 3.3). (2) Normalized peak values: the downward trend of normalized peaks for SA1-SA3 in simulation (Figure 25) matches the experimental normalized peak changes (Figure 12). (3) SDI variation: simulation SDI decreases from 1.0 to 0.0 with crack length increasing from 0 to 450 mm (Figure 26), which is consistent with the experimental SDI trend (Figure 17). These consistencies validate the model’s ability to replicate stress wave attenuation under shear damage.
Conclusions and discussion
This study investigates the shear performance monitoring of concrete beams reinforced with Glass Fiber Reinforced Polymer (GFRP) bars using piezoelectric sensors. By attaching piezoelectric ceramic sensors as actuators and receivers on the concrete beams and applying loads until shear failure occurs, this study explores how shear damage in the shear span of the concrete beam affects the signal, using wave propagation analysis.
The experimental results demonstrate that the piezoelectric sensors effectively detect the development of shear-related cracks in concrete beams reinforced with GFRP bars. When cracks formed in the shear region, stress waves propagated through the material and interacted with the cracks, causing phenomena such as reflection and refraction, which led to the attenuation of the stress wave energy. As damage increased, the time-domain signal amplitude dropped significantly—by up to 63% for the bottom sensor—indicating strong sensitivity to shear crack propagation. By analyzing the time-domain amplitude and signal energy of the response signals under different loading conditions, this study successfully evaluated the shear performance of the concrete beams. Additionally, frequency-domain analysis confirms that high-frequency components (40–80 kHz) in the healthy state and low-frequency components (10–30 kHz) in the damaged stage are most sensitive to shear crack propagation, validating the effectiveness of frequency-domain analysis in shear damage assessment. The Shear Damage Index (SDI), based on energy changes in response signals, was proposed as a quantitative measure of damage severity in the shear region. As shear cracks propagate, the SDI decreases from 1.0 to approximately 0.0, which provides a sensitive and effective method for identifying and quantifying shear damage in GFRP-RC beams.
Additionally, finite element simulation results aligned well with experimental data: the attenuation trends of the signal’s time-domain, frequency-domain, and energy characteristics as shear diagonal cracks developed in simulations showed good consistency with experimental results, validating the theoretical model’s capability to replicate stress wave attenuation behavior under shear damage. Both the experimental and finite element simulation results confirm that the piezoelectric sensor-based wave propagation analysis method can effectively monitor the progression of shear damage in concrete beams reinforced with GFRP bars. The SDI proved to be a reliable indicator for assessing the extent of damage, demonstrating its potential for real-time health monitoring and damage assessment in GFRP-reinforced structures.
However, while the current study focuses on detecting a single damage state, the capability to locate and assess multiple concurrent damage modes in structures remains an area requiring future refinement. Additionally, the study did not address the impact of environmental noise on the measurement process, which may affect the reliability of the monitoring system. Further investigations into sensor placement optimization and noise reduction strategies are necessary to improve the robustness of the system for practical applications. Notably, this study was conducted under constant laboratory temperature conditions; yet, temperature fluctuations are well-documented to affect both the electromechanical coupling of piezoelectric ceramics and the propagation velocity of stress waves in concrete, so future work will incorporate temperature compensation techniques and environmental calibration to improve field applicability. For simplicity, the finite element model in this study assumes a fixed crack width (2 mm) and inclination angle; in real-world structures, however, cracks evolve dynamically with varying geometries, meaning future research will include a parametric study on crack width and angle to better understand their influence on stress wave propagation and strengthen the robustness of the proposed SDI-based monitoring method.
Footnotes
Acknowledgements
The authors would like to sincerely thank Mr. Lizhao Yang for his assistance with re-analysis of experimental data, including noise reduction and improvement of signal processing methods, and for his support in updating the quality of figures. The authors also acknowledge Mr. Rui Huang for his valuable contributions to the finite element modeling, including mesh refinement, damping calibration, and the comparison of simulation with experimental results. Their efforts have greatly improved the clarity and technical quality of the revised manuscript.
Funding
The authors disclosed receipt of the following financial support for the research, authorship, and/or publication of this article: The authors gratefully acknowledge the support of the National Key Research and Development Program of China (No. 2024FE0201900), National Natural Science Foundation of China (No. 52178192), Science and Technology Innovation Joint Fund Program of the Guangdong and Macau (No. 2022A0505020030, No. 0057/2021/AGJ), Scientific Research Capacity Enhancement Program for Key Construction Disciplines in Guangdong (No. 2022ZDJS032), Dongguan Key Laboratory of Service Performance Monitoring and Assurance for Coastal Concrete Structures (No. 197), and Guangdong Provincial Department of Housing and Urban-Rural Development Science and Technology Innovation Program Directed Project.
Declaration of conflicting interests
The authors declared no potential conflicts of interest with respect to the research, authorship, and/or publication of this article.
Data availability statement
The data are available from the corresponding author on reasonable request.