
Abstract
Shape memory alloys (SMAs) are ideal for passive vibration control systems due to their energy dissipation capability under cyclic loading and exceptional superelasticity. Existing studies show that the mechanical properties of SMAs can vary significantly depending on the cyclic loading conditions. There is a complex interaction between the combined effect of cyclic loading parameters and internal variables that primarily governs the mechanical behavior of SMAs. While the effects of individual cyclic loading parameters on the mechanical behavior of SMAs have been widely studied, the interaction of these factors remains largely underexplored in the existing literature. The current study systematically explores the interaction of loading frequency, pre-strain, and strain amplitude on the mechanical response of superelastic NiTi, particularly in terms of energy dissipation, residual strain, and effective stiffness through an experimental approach that considers two of the parameters simultaneously. Moreover, theoretical rationalization for the observed SMA wire mechanical behavior resulted from complex interactions of different loading parameters have been offered, a dimension largely omitted in existing studies. This not only explains the inconsistent observations reported in literature, but also provides a predictive perception for SMA behavior beyond the tested parameter ranges.
Keywords
1. Introduction
Shape memory alloys (SMAs) are highly effective at dissipating energy under cyclic loading and exhibit excellent superelasticity making them an ideal choice for passive vibration energy dissipation systems (Alam et al., 2011; Billah et al., 2022; Ozbulut et al., 2011). The unique behavior of SMAs result from reversible phase change, also called martensitic transformation (MT), between the austenite and martensite crystal phases, which can be induced by changes in either stress or temperature (Tadaki et al., 1988). Figure 1 depicts the different phases of SMA under varied conditions of applied stress and temperature. Figure 2 shows the typical stress-strain curve of superelastic SMA which highlights the different deformation phases during a loading cycle and the corresponding temperature variations. Forward phase transformation is exothermic. While a portion of the released heat transfers to the surrounding environment, the remaining increases the wire’s temperature. So, the temperature of a wire generally increases during the loading stage. Conversely, reverse phase transformation is endothermic; the wire absorbs the heat released during the loading stage and may even draw heat from the environment once the transformation is complete. This leads to a decrease in wire temperature during the unloading stage. Although described as superelastic, in practice, a small amount of residual strain typically develops during each stress-strain cycle, shown by point 7 in Figure 2 (Brinson et al., 2004; Norfleet et al., 2009).
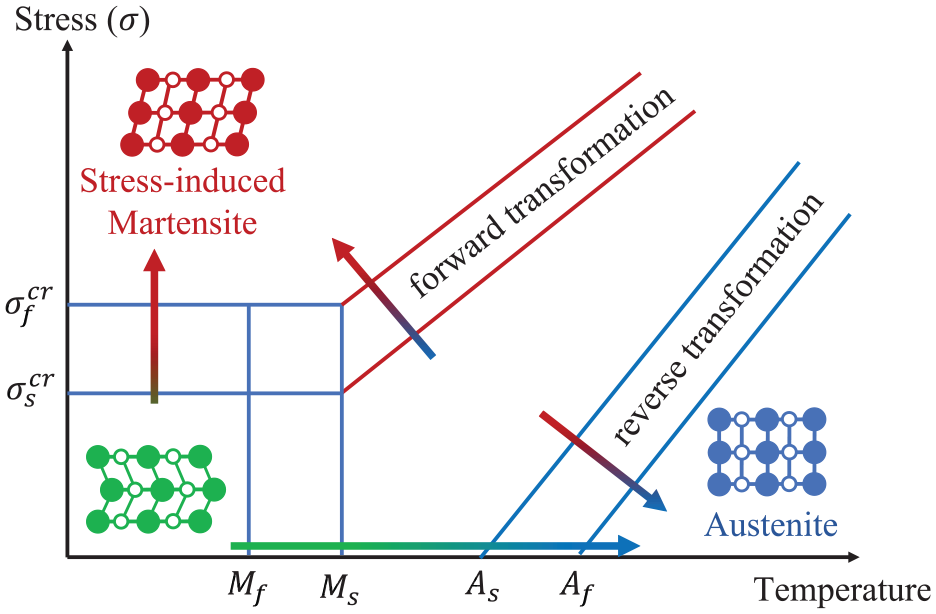
Phase transformation in a SMA under the joint effect of stress and temperature.
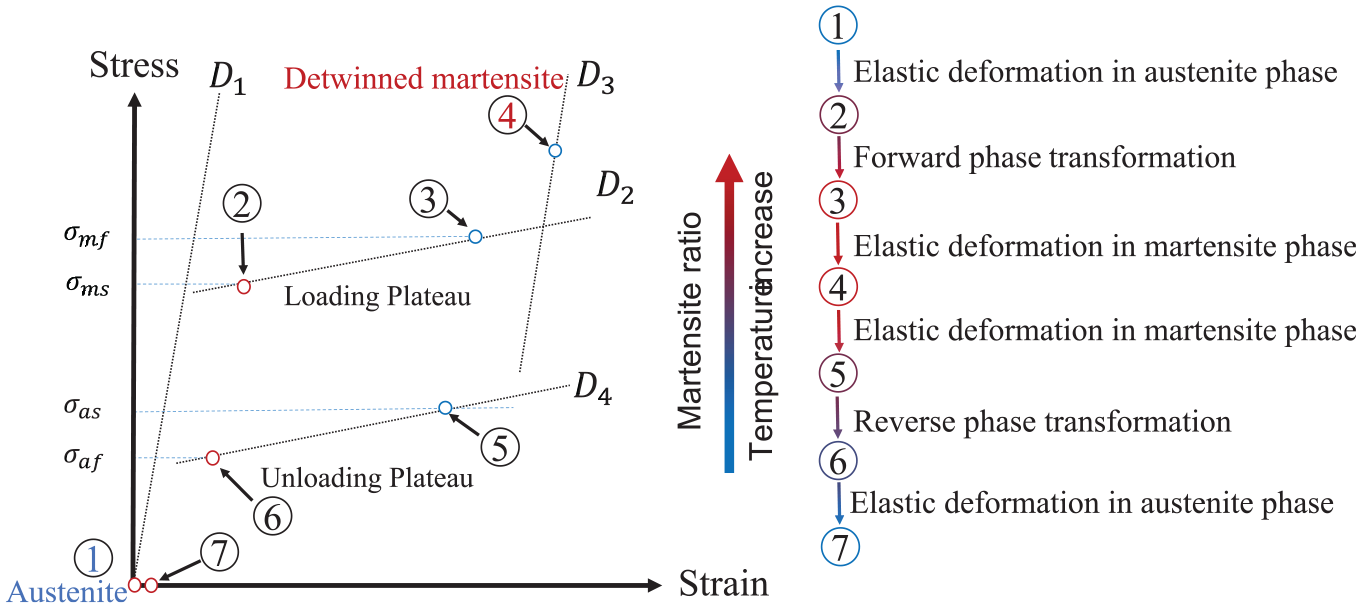
Typical stress-strain curve of superelastic SMA under cyclic loading.
Figure 3 displays various factors impacting the mechanical behavior of SMA during cyclic loading and their interconnections. The temperature and stress condition govern the mechanical behavior of SMA because they determine the stability and proportion of different crystal phases within the SMA. During loading, the SMA wire temperature depends on the heat exchange rate between the wire and its ambient environment, and the rate at which heat is released (or absorbed) during phase transformation (He and Sun, 2010). The heat exchange rate depends on the wire’s temperature, the ambient temperature, and the wire’s dimensions. The heat release (or absorption) rate is controlled by the phase transformation rate, which depends on the strain rate, wire temperature, and stress condition. In displacement-controlled cyclic loading, the combined effect of loading frequency, pre-strain, and strain amplitude determines the strain rate. The interrelated loading parameters mentioned above jointly shape the mechanical behavior of SMA. Therefore, for a complete understanding of the mechanical behavior of SMA under cyclic loading, it is crucial to carefully examine not only the effect of each individual loading parameter, but their interaction as well. Nevertheless, the prevailing approach in existing literature typically isolates the impact of a single loading parameter on the mechanical behavior of SMA, for example, DesRoches et al. (2004) and Soul et al. (2010).
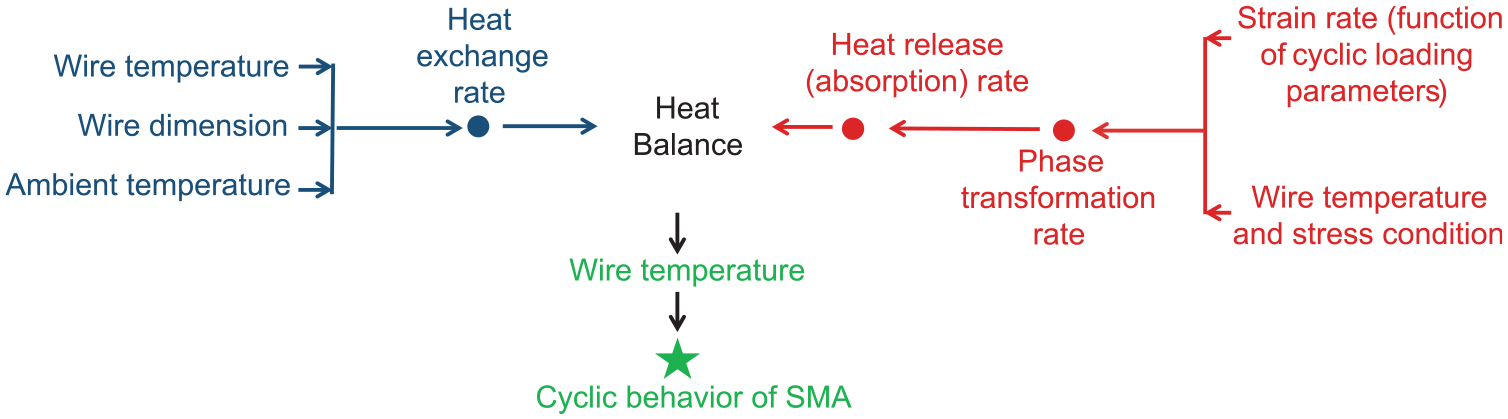
The relationship of selected parameters impacting the mechanical behavior of SMA.
The cyclic behavior of SMAs is sensitive to cyclic loading conditions, which has been studied extensively in existing literature, for example, in DesRoches et al. (2004), Kan et al. (2023), Kong et al. (2024), Lin et al. (1994), Ning et al. (2022), Shi et al. (2022), Yang et al. (2021), Zhao et al. (2024), and Zhou et al. (2024). The experimental findings indicate that with an increase in the number of loading cycles, the loading stress plateau of SMA wire shifts down. This is particularly evident during the initial few cycles (DesRoches et al., 2004; Dolce and Cardone, 2001; Lian et al., 2024; Sherif and Ozbulut, 2018; Yang et al., 2021; Zhou et al., 2024). The stress levels associated with the unloading plateau exhibit a slight decrease compared to the loading plateau. Thus, as the wire experiences a greater number of loading cycles, the dissipated energy and equivalent viscous damping decrease (Ammar et al., 2017; Kan et al., 2023; Tobushi et al., 1998; Yang et al., 2020). Another significant effect of repeated cyclic loading is the accumulation of residual strain (Ammar et al., 2017; Dolce and Cardone, 2001; Zhou et al., 2024). A majority of accumulated residual strain takes place in the early loading cycles, after which the mechanical behavior reaches a steady state with negligible further residual strain accumulation (Kan et al., 2023; Ning et al., 2022; Tobushi et al., 1998; Wolons et al., 2016; Yang et al., 2021). This phenomenon, often referred to as functional fatigue, leads to a gradual decline at a decreasing rate in the recentering capability and energy dissipation capacity of SMAs, both of which stabilize eventually. The functional degradation of superelastic NiTi SMAs can significantly expedite by the combined effect of strain rate and ambient temperature (Song et al., 2025). Such behavior stems from the slipping of dislocations at austenite-martensite interfaces (DesRoches et al., 2004; Sidharth et al., 2022). To achieve stable mechanical behavior and reduce functional fatigue effects, preloading SMAs, which also known as training, has been proposed (Davarnia et al., 2023; Miyazaki et al., 1986; Ran et al., 2023; Shi et al., 2024).
Numerous researchers have investigated the influence of the strain amplitude of cyclic loading on the mechanical properties of SMAs (Dolce and Cardone, 2001; Fang et al., 2019; Liu et al., 2020; Ozbulut and Hurlebaus, 2010; Ren et al., 2007; Shi et al., 2024; You et al., 2020). As strain amplitude becomes larger, the energy dissipation increases (Liu et al., 2020; Ozbulut and Hurlebaus, 2010; Ren et al., 2007; Shi et al., 2024; Zhou et al., 2024) while its superelastic behavior diminishes (Lian et al., 2024; Ning et al., 2022; Shi et al., 2022). Both a linear and greater than linear dissipated energy trend with increasing strain amplitude has been observed. As the strain amplitude rises, the stress required for the forward martensitic transformation in an SMA bar gradually declines, while the residual strain and energy dissipated per cycle steadily increase (Ning et al., 2022). It is also reported that under incremental strain loading, the reverse phase transformation plateau decreases significantly, with a reduction that exceeds that of the forward phase transformation plateau (Lian et al., 2024). The strain rate is another crucial parameter influencing the mechanical behavior of SMAs and has been thoroughly examined by numerous researchers (DesRoches et al., 2004; Dolce and Cardone, 2001; Kan et al., 2016; Liu et al., 2020; Nemat-Nasser and Guo, 2006; Ozbulut and Hurlebaus, 2010; Ren et al., 2007; Soul et al., 2010; Tobushi et al., 1998; Toker et al., 2020; Wolons et al., 2016; Zhang et al., 2010, 2024; Zhou et al., 2018). The strain rate primarily influences the degradation of superelasticity and the evolution of temperature, both of which exhibit strong rate dependence (Kan et al., 2016). Table 1 shows a summary of the effects of strain rate on different parameters of the stress-strain curve. In contrast to the impact of the number of cycles and strain amplitude, the influence of strain rate on the mechanical behavior of SMA lacks a specific pattern (Ozbulut et al., 2011) and was found to be non-monotonic across different rates. This strain rate dependency of hysteresis pattern is driven by heat release and convection dynamics, and is thus sensitive to the change of strain rate and ambient conditions (Song et al., 2025; Zhang et al., 2010). For example, with increasing strain rate, both a decrease (DesRoches et al., 2004; Dolce and Cardone, 2001; Ozbulut and Hurlebaus, 2010; Ren et al., 2007; Wolons et al., 2016) and an increase (Tobushi et al., 1998) in energy dissipation have been reported.
Effect of strain rate on the characteristics of the SMA stress-strain curve.
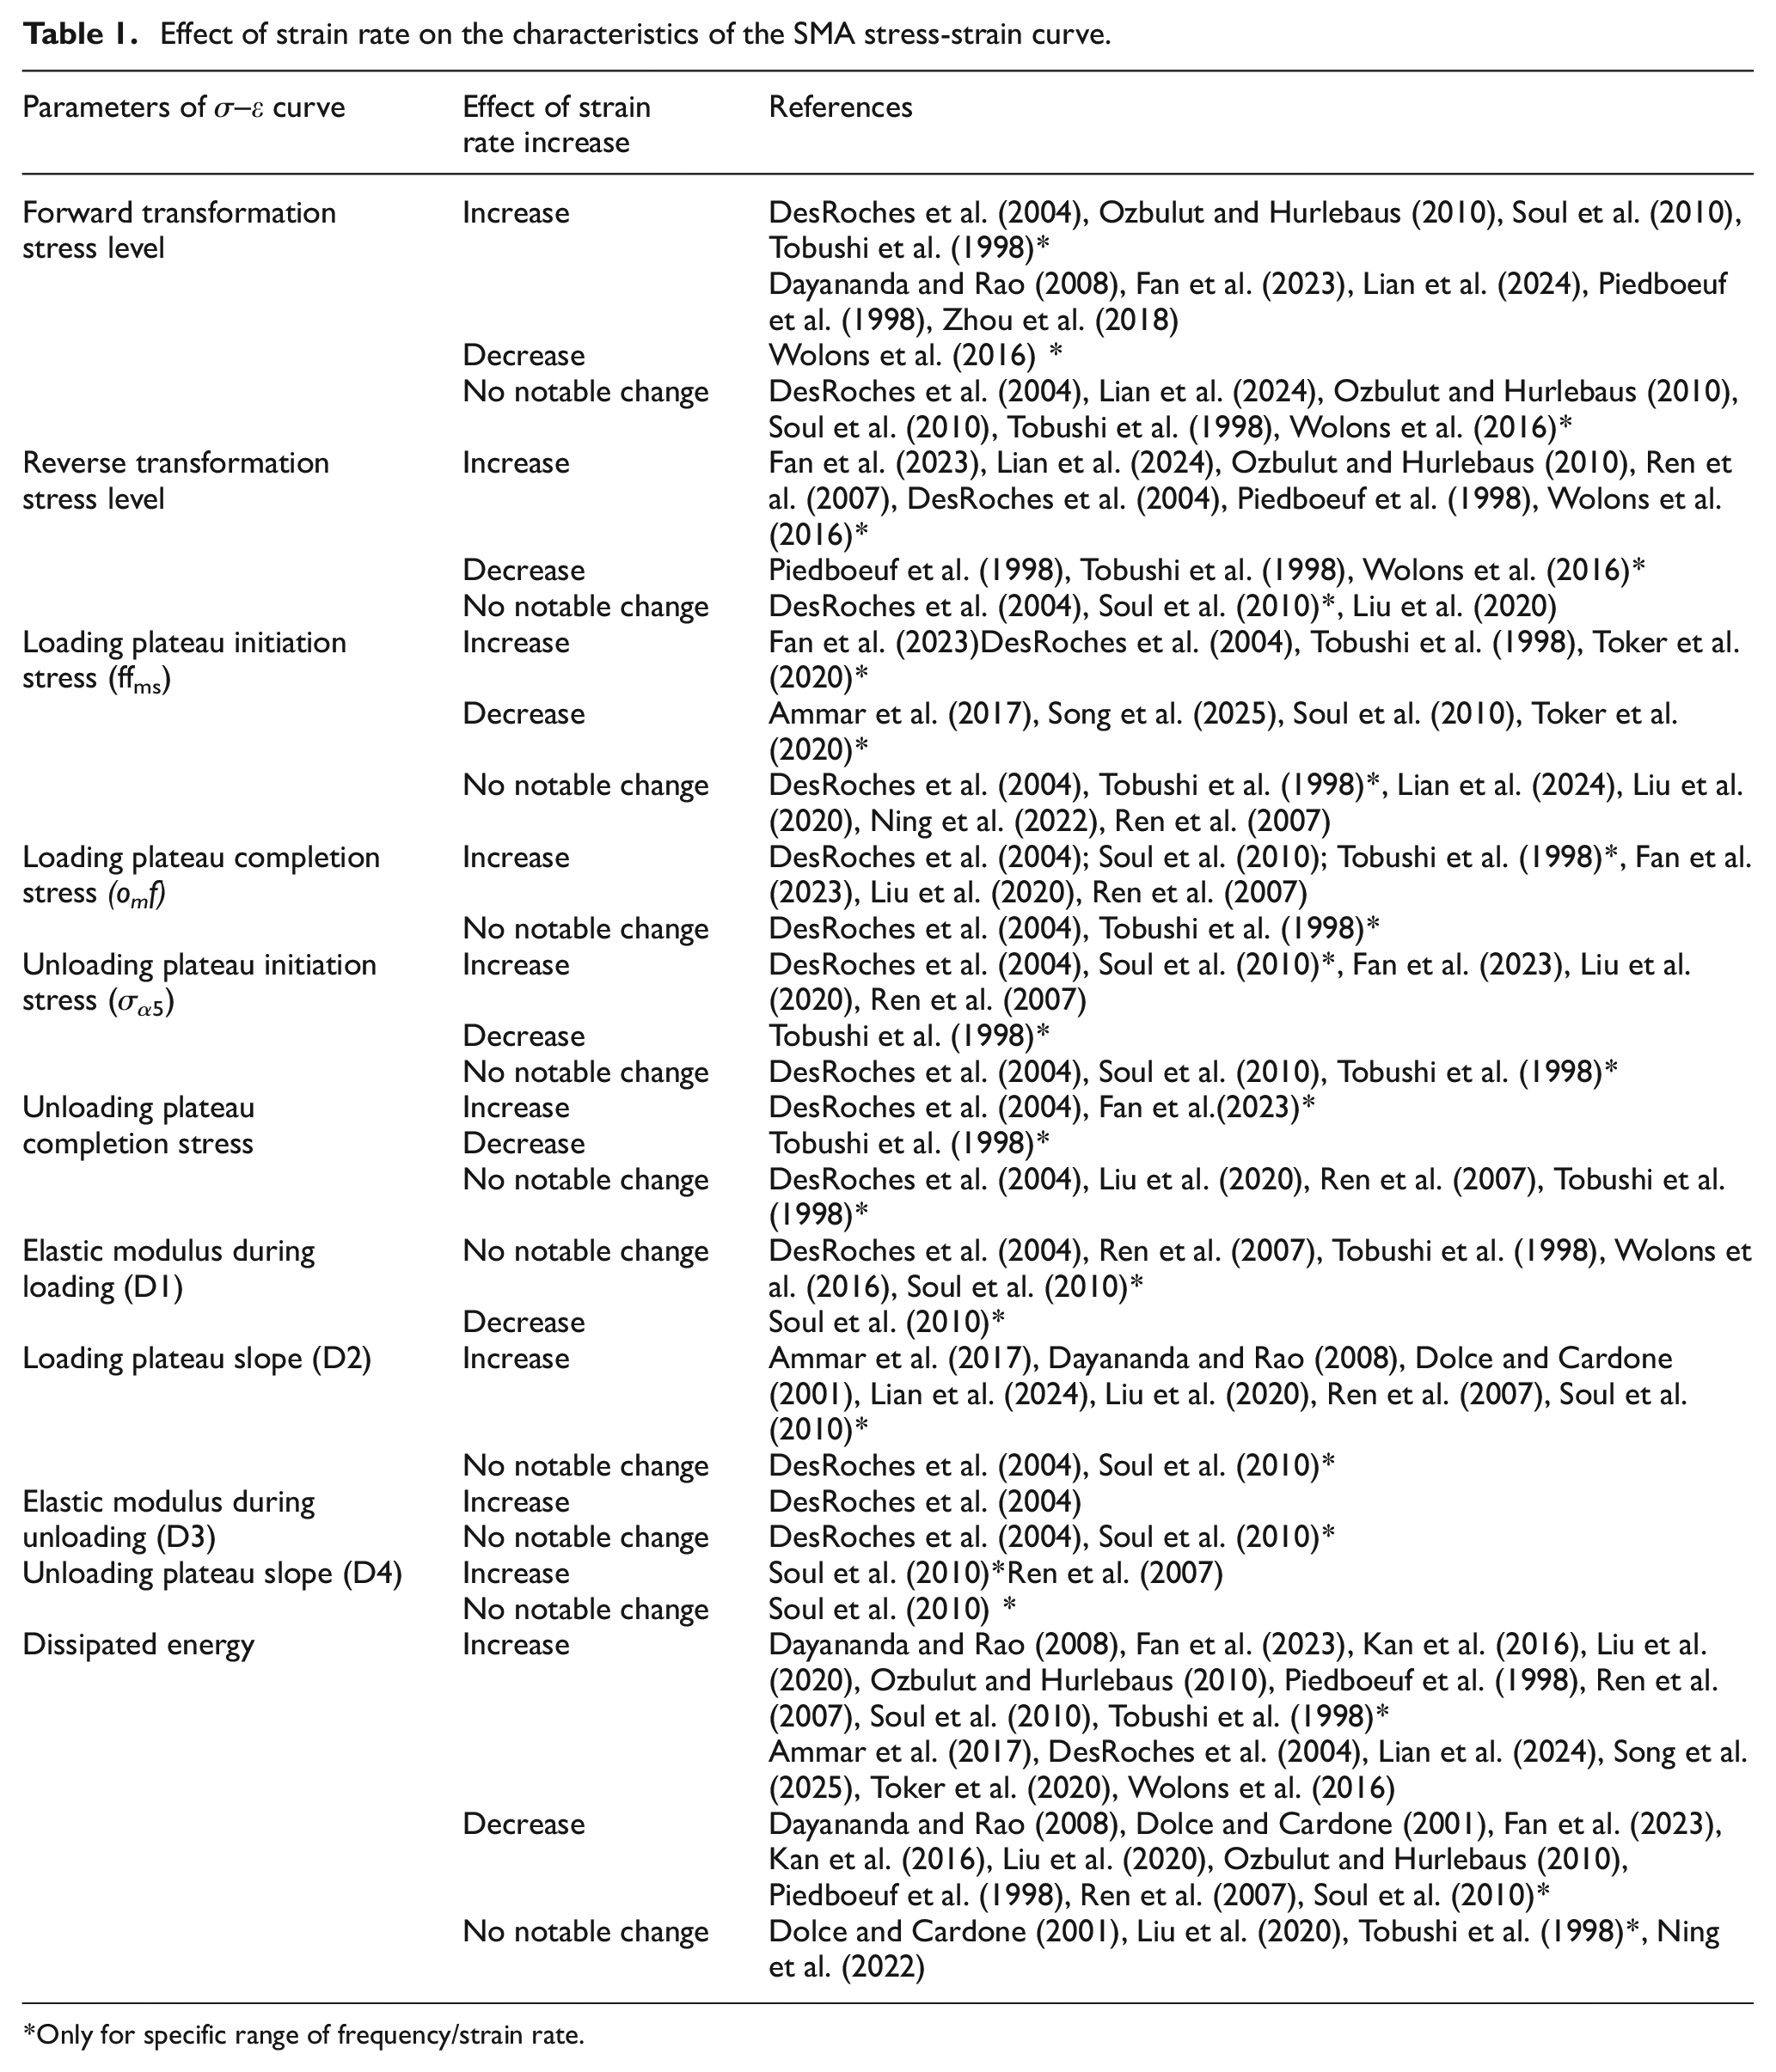
Only for specific range of frequency/strain rate.
Applying pre-strain is a necessary component in the practical use of SMA wires and strands in order to prevent slackening. As shown in Figure 2, pre-strain is one of the loading parameters which can affect the mechanical behavior of SMAs, both independently and in combination with other loading factors. Some studies have investigated the effect of pre-strain on the mechanical behavior of NiTi wires and bars under cyclic loading, for example, Dolce and Cardone (2001), McCormick and DesRoches (2006), Wolons et al. (2016), Zareie and Zabihollah (2021), and Zhou et al. (2018). For instance, Dolce and Cardone (2001) indicated that to achieve efficient energy dissipation, SMA wires needed to be pre-tensioned at approximately half of the maximum strain required for phase transformation completion and be cyclically loaded around the pre-strained level. It has been reported that applying pre-strain to the SMA can enhance its initial stiffness and prevent any residual deformation in the bars when subjected to sub-cycle loading (Ning et al., 2022; Zareie and Zabihollah, 2021). Meanwhile, increasing pre-strain can potentially decrease energy dissipation Zhou et al. (2018). However, Lian et al. (2024) reported that pre-straining SMA cables increases peak stress and energy dissipation, while reducing forward and reverse yield plateau heights. Zhou et al. (2018) observed that the secant stiffness of the tested SMA wire decreased as the pre-strain increased. An initial sharp drop in secant stiffness occurred with small pre-strains. However, as the pre-strain continued to increase, the rate of reduction in the secant stiffness became less pronounced. McCormick and DesRoches (2006) reported that pre-straining significantly affected the decrease in forward transformation stress during cyclic loading. At lower pre-strains, stress reduction occurred gradually with increasing cycles. However, at higher pre-strain levels, a sharp decline in forward transformation stress was observed within just a few cycles, indicating that even minor sub-cycles could lead to substantial localized slip accumulation. They suggested that pre-strained superelastic NiTi could be used in structural control systems to provide energy dissipation during small strain cycles, as residual strain accumulation was minimally affected by pre-straining. Nevertheless, the interaction impact of pre-straining with other cyclic loading parameters has rarely been examined.
As shown in Figure 2, the combined effect of different loading parameters impacts the underlying thermal and stress-related factors, including heat generation rate, heat exchange condition, stress condition, and wire temperature, which predominantly govern the mechanical behavior of SMAs. In practical vibration control applications, due to the random nature of applied forces and the necessity of applying pre-strain, various combinations of loading parameters are expected. Although the effects of cyclic loading conditions on mechanical behavior of SMAs have been widely explored by researchers, this study introduces novel aspects that set it apart from previous studies. Most existing studies focus on individual effects of cyclic loading parameters rather than their interaction. The latter offers a more robust framework for interpreting results and enhancing our understanding of SMA behavior across various loading conditions. This study fills this gap by employing a systematic approach to experimentally explore the interaction of different cyclic loading parameters on the mechanical behavior of NiTi SMA wires across a comprehensive range of parameter combinations relevant to structural vibration control applications. In lieu of more complex statistical approaches, the interactions of two loading parameters are considered simultaneously for clarity of discussion. The experimental observations are substantiated with macro-scale theoretical rationalizations, offering novel insights into the complex interactions governing SMA performance under various loading conditions, a dimension largely overlooked in existing research. This approach not only clarifies the inconsistencies reported in the existing references (Davarnia et al., 2023) but also provides predictive insights into SMA behavior beyond the tested parameter ranges.
2. Experimental program
2.1. Experimental setup and specimens
The 0.5 mm diameter NiTi (Ni 57.0% and Ti 42.77%) SMA wire specimens were supplied by Lumenous Peiertech. The
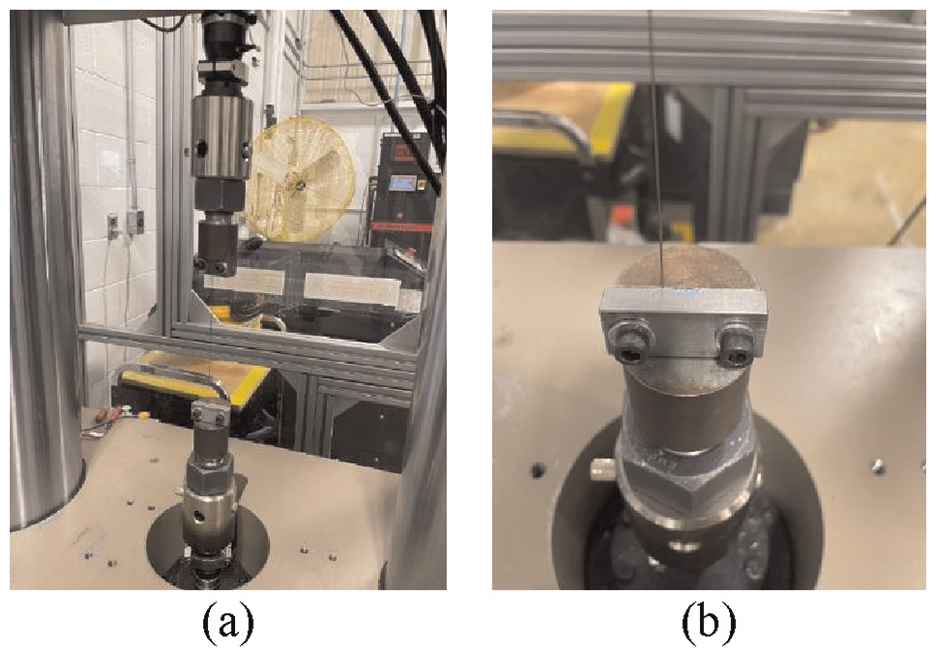
Experimental setup: (a) testing rig and (b) securing grips.
2.2. Testing cases
To examine the effect of cyclic loading conditions on SMA wires, 7 sets of tests, including 28 independent testing cases, were conducted. Each set was designed to study the impact of either one specific loading parameter, or its interaction with another parameter. Table 2 lists the details of the seven testing sets. The number of loading cycles (N) for all the testing cases is 150. All stress-strain plots presented in the following sections show the final cycle data unless a specific cycle number is indicated.
Details of testing sets.
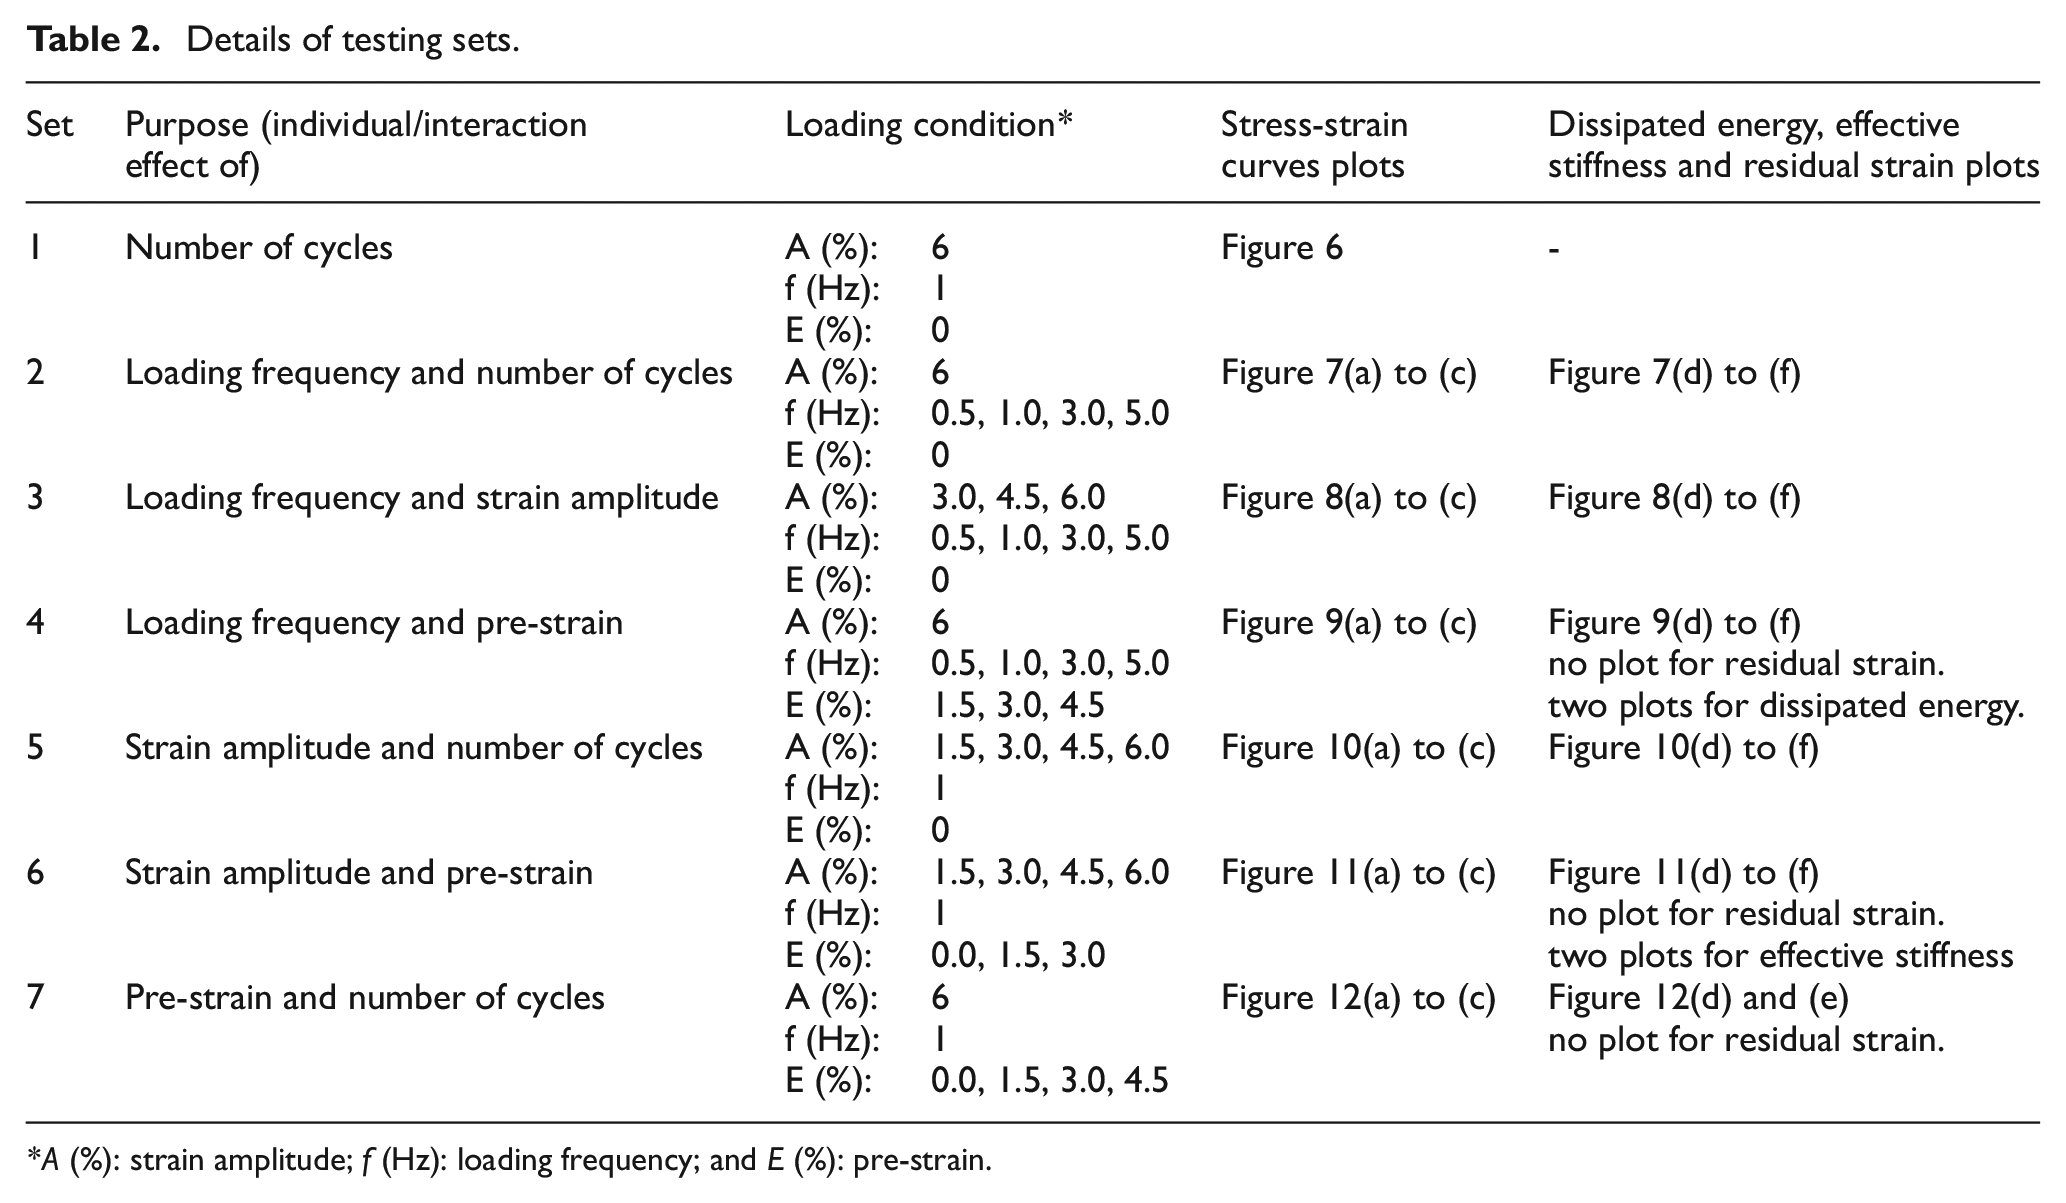
A (%): strain amplitude; f (Hz): loading frequency; and E (%): pre-strain.
All specimens were mechanically trained under cyclic loading for 100 cycles at a frequency of 5.0 Hz and a strain amplitude of 6.0% without pre-strain. Figure 5 illustrates the definition of strain amplitude and pre-strain used herein. Strain amplitude (A) and pre-strain (E) represent the maximum and minimum strain values the wire experiences. The training conditions were selected such that the frequency and strain amplitude during training were not lower than those used in testing. This approach effectively controls residual strain and prevents sudden stress drops in the hysteresis loop (Davarnia et al., 2023). The considered mechanical properties for this study include dissipated energy, effective stiffness, and residual strain which are defined in Figure 5. Effective stiffness is as important as energy dissipation capacity in the response of dynamic systems and vibration control applications. However, existing studies often overlook it to typically focus more on residual strain, hysteresis loop characteristics (e.g. stress plateaus), and damping. In Figure 5, loop 1 and loop 2 illustrate the hysteresis loops for loading cases without pre-strain and with pre-strain, respectively. Dissipated energy, proportional to the enclosed area by the stress-strain loop, shown by W1 and W2, measures energy loss. Effective stiffness, shown by K1 and K2, is represented by the slope between the extremes of force and displacement of the hysteresis loops. Residual strain, shown by R1 for loop 1, is defined as the instantaneous strain at complete unloading. The difference between A and E, that is, S = A−E, is denoted as the effective strain amplitude. All values in subsequent sections for dissipated energy, effective stiffness, and residual strain are averaged over 5 cycles centered around the specified cycle. Under harmonic cyclic loading, the instantaneous strain rate varies. In the following sections of this paper, strain rate refers to the average strain rate during either loading or unloading stage, which is proportional to the product of the strain amplitude and the loading frequency.
Definition of dissipated energy (W), effective stiffness (K), residual strain (R), strain amplitude (A), pre-strain (E), peak stress (P), and effective strain amplitude (S).
3. Results
3.1. Individual effect of loading parameters
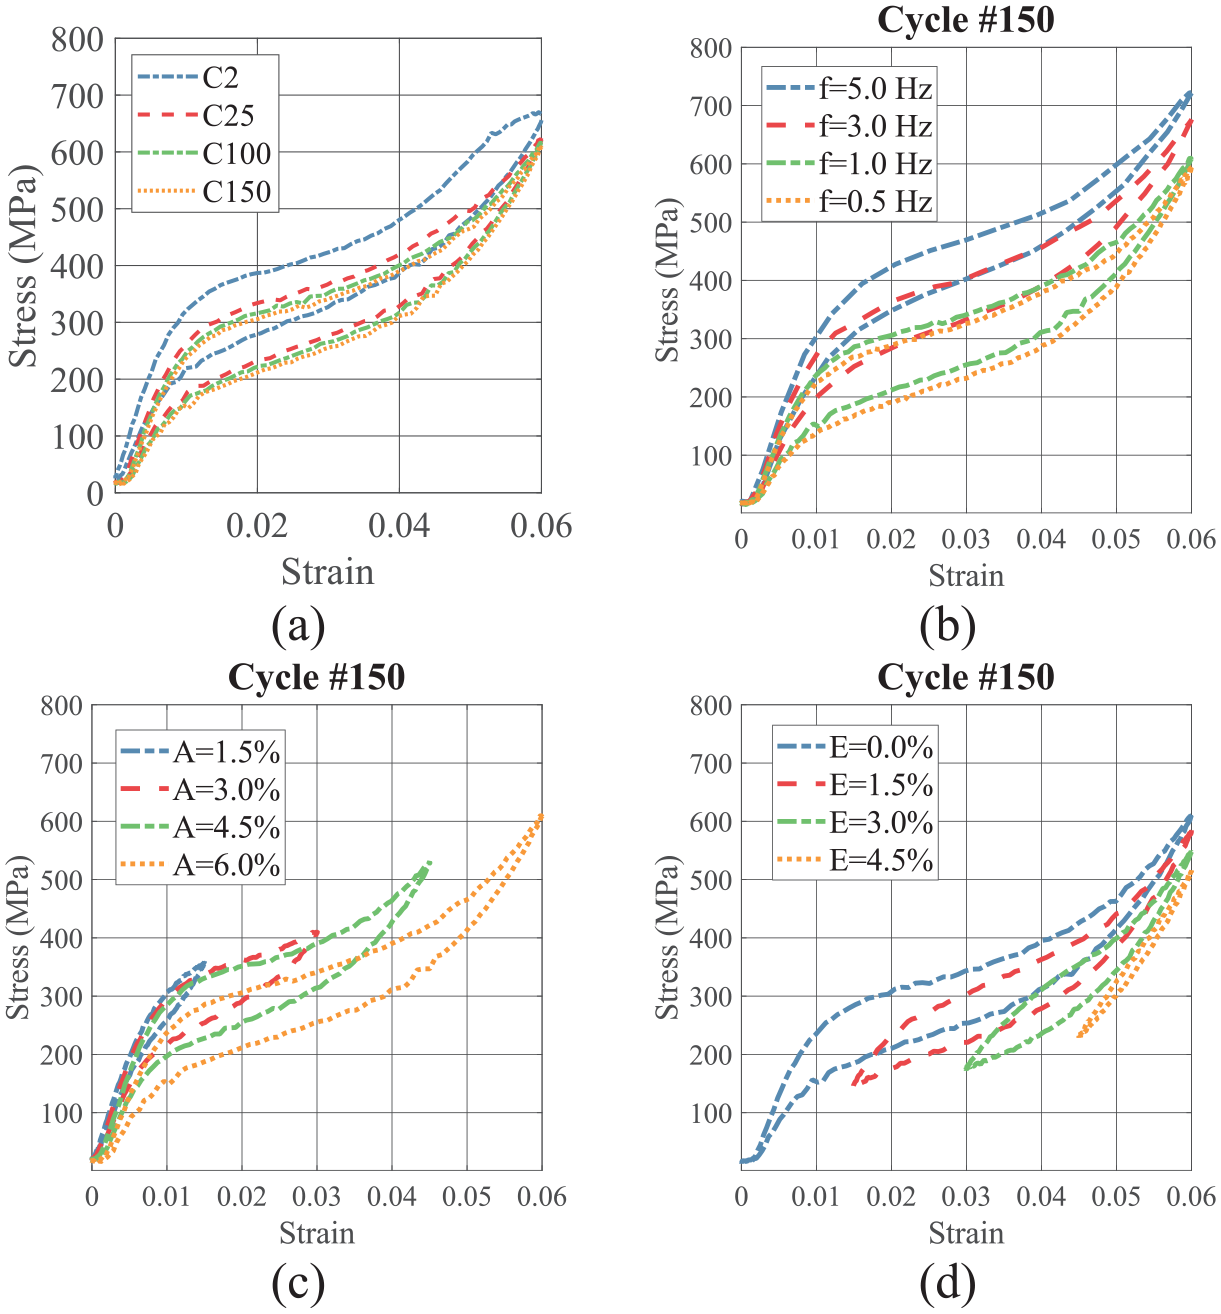
Figure 6, displaying the hysteresis curves corresponding to sets 1, 2, 5, and 7, is presented to discuss the generally observed individual impact of the number of cycles, loading frequency, strain amplitude and pre-strain. As shown in Figure 6(a), with an increasing number of cycles, both the loading and unloading plateaus shift downward, the dissipated energy and effective stiffness decrease, while residual strain increases. This is consistent with the observations reported in the literature, for example, DesRoches et al. (2004) and Yang et al. (2021). Existing studies often attribute the downward shift of the stress plateaus and residual strain accumulation to functional fatigue. However, there are observations pointing to another cause as well, that is, thermomechanical stabilization (Zhang et al., 2010). For example, experimental findings indicate that SMA wires can recover part of their residual strain shortly after complete unloading due to thermal equilibration (Davarnia et al., 2023; Kan et al., 2016). This is in contrast with the underlying mechanisms of functional fatigue, that is, dislocation slipping, which are generally considered to be irreversible (Carmine et al., 2017). In addition, if the notable changes in residual strain and stress plateaus in the first few cycles were only due to functional fatigue, wires that have been appropriately trained wouldn’t show such changes. However, SMA wires always display some residual strain accumulation and decline in the stress plateaus in the first few cycles, regardless of training conditions. Thermomechanical stabilization has been less emphasized in most studies, despite its predominant effect over functional fatigue, specifically during the initial cycles, notably for trained wires.
Stress-strain curves showing the individual impact of (a) number of cycles, (b) loading frequency, (c) strain amplitude, and (d) pre-strain.
The influence of thermomechanical stabilization can be postulated as follows: as the applied stress reaches
Figure 6(b) indicates that both the loading and unloading plateaus shift upward with an increase in loading frequency. Consequently, the peak stress at the end of the loading plateau increases (along with the effective stiffness) as the loading frequency increases. Both dissipated energy and residual strain generally decrease as loading frequency increases. An increase in loading frequency ultimately translates into higher wire temperature at the end of the loading stage, that is, increased heat exchange rate. However, increasing the frequency also proportionally reduces the time available for heat transfer, which negatively impacts the amount of dissipated heat. As shown in Figure 1, with the increase of SMA temperature, the gap between
Figure 6(c) shows that, generally, the loading and unloading plateaus of tests conducted at higher strain amplitudes are positioned lower than those conducted at lower strain amplitudes. A wire dissipates more energy, experiences more residual strain and exhibits lower effective stiffness as the loading strain amplitude increases. As the strain amplitude increases, the temperature rise at the end of the loading stage increases due to a higher phase transformation rate, leading to greater heat generation and thus increased heat (i.e. energy) dissipation to the ambient environment. This leads to a larger temperature drop upon complete unloading, ultimately translating to a larger residual strain and lower stress plateaus. In other words, the thermomechanical stabilization effect is more pronounced in wires subjected to higher strain amplitudes.
Figure 6(d) shows that the hysteresis loop associated with a higher pre-strain exhibits lower loading and unloading stress plateaus compared to one with lower pre-strain. At a specific strain level, the testing case with a higher pre-strain has a lower temperature than the one with lower pre-strain because the latter has undergone more phase transformation to reach that strain level. Since the wire with higher pre-strain also generates less overall heat, leading to a lower average temperature, it follows a lower stress trajectory compared to the wire with lower pre-strain. The dissipated energy for a case with a lower pre-strain is higher compared to the one with a higher pre-strain. This is intuitive since a hysteresis loop corresponding to a smaller pre-strain exhibits a wider profile. The effective stiffness generally increases with the pre-strain level. This is similar to the effect of decreasing the strain amplitude. With increasing pre-strain, a smaller portion of the hysteresis loop overlaps with the phase transformation plateaus, where the SMA stiffness is the lowest. The only exception is when the pre-strain increases from 0.0% to 1.5% where the effective stiffness slightly decreases. This happens because the initial austenite elastic region, which has notably higher stiffness, is excluded from the hysteresis loop at a pre-strain of 1.5%.
The observed effects of individual parameters mostly align with existing literature findings. In summary, strain rate, determined by the loading parameters, directly influences the phase transformation rate and controls the thermomechanical condition of a SMA wire during cyclic loading. This directly impacts the mechanical response in terms of the stress-strain curve, energy dissipation and residual strain.
3.2. Interaction of loading parameters
3.2.1. Loading frequency and number of cycles
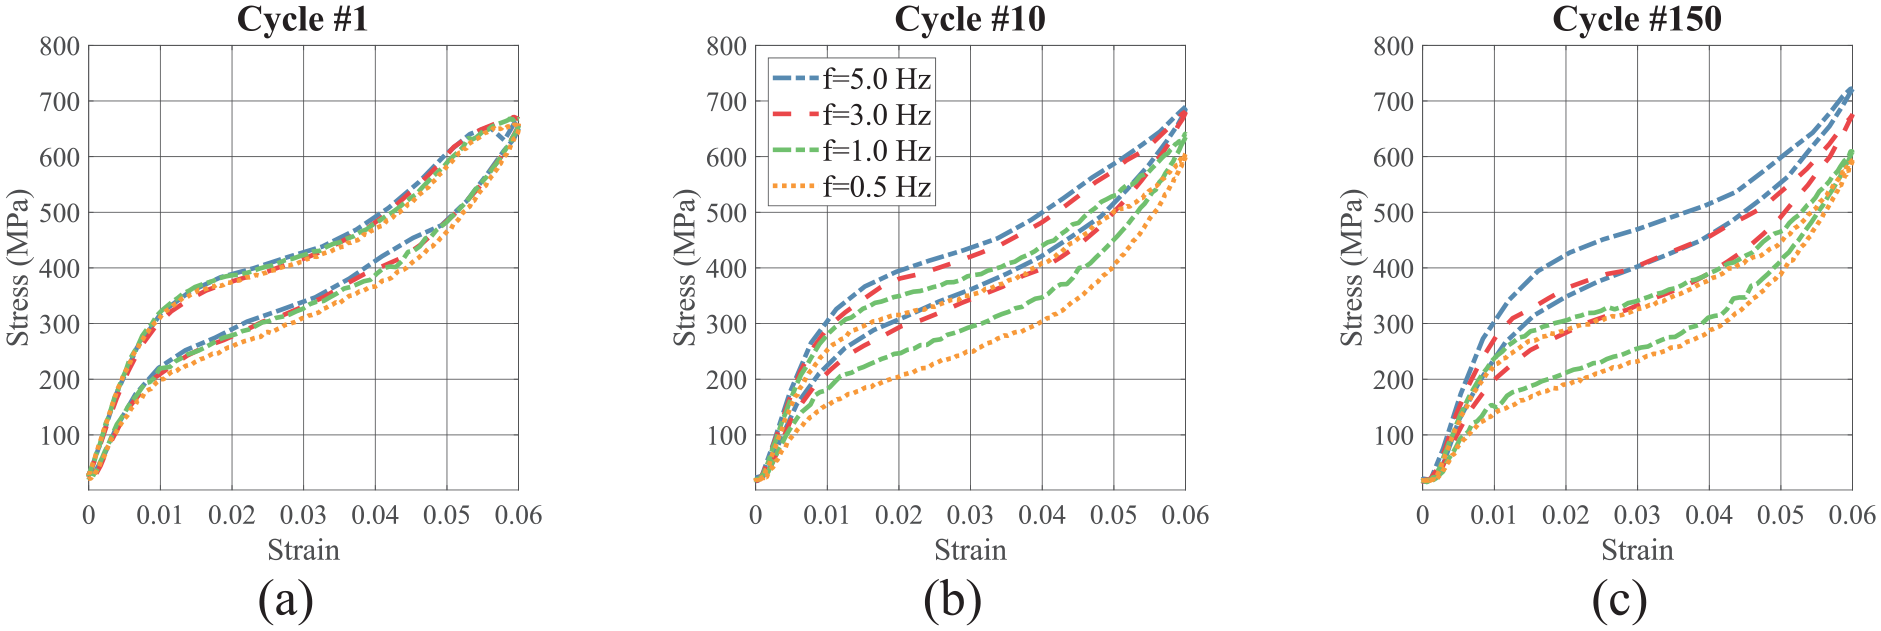
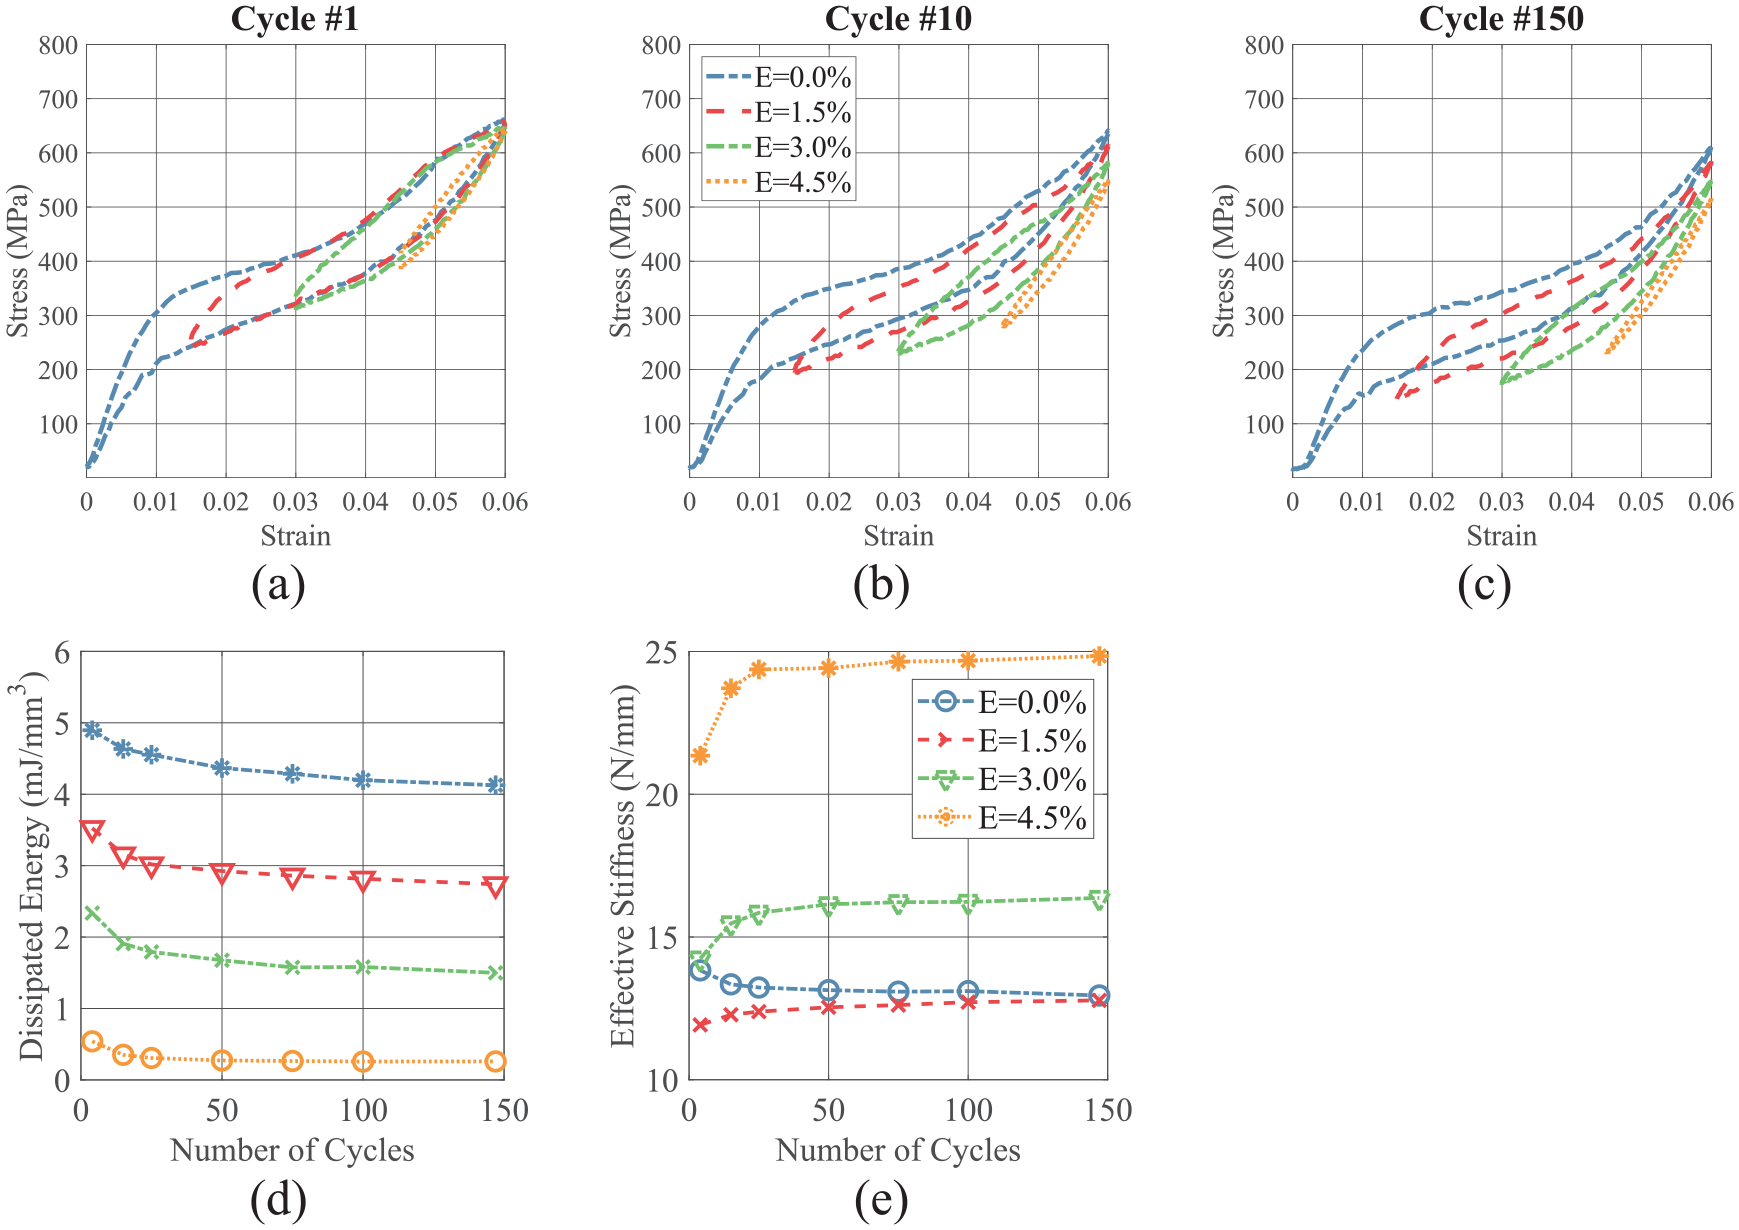
Set 2 studies the interaction of the loading frequency and the number of cycles on the cyclic behavior of SMAs. It includes 4 testing cases of which the strain amplitude and pre-strain are identical, that is, A = 6.0% and E = 0.0%, while the loading frequency is set to 0.5, 1.0, 3.0, and 5.0 Hz, respectively. The results in Figure 7(a) to (c) show that in the initial cycles, the hysteresis loops corresponding to different loading frequencies are closely aligned, despite the general downward shift with decreasing frequency. As the number of cycles increases, hysteresis loops corresponding to different frequencies shift differently: those for lower frequencies (f = 0.5 Hz and 1.0 Hz) shift downward, while the one for f = 5.0 Hz slightly shifts up. The shift for f = 3.0 Hz is less notable compared to the lower frequencies (f = 0.5 Hz and 1.0 Hz). This behavior is reflected in the curves associated with higher frequencies being visibly higher than those with lower frequencies.
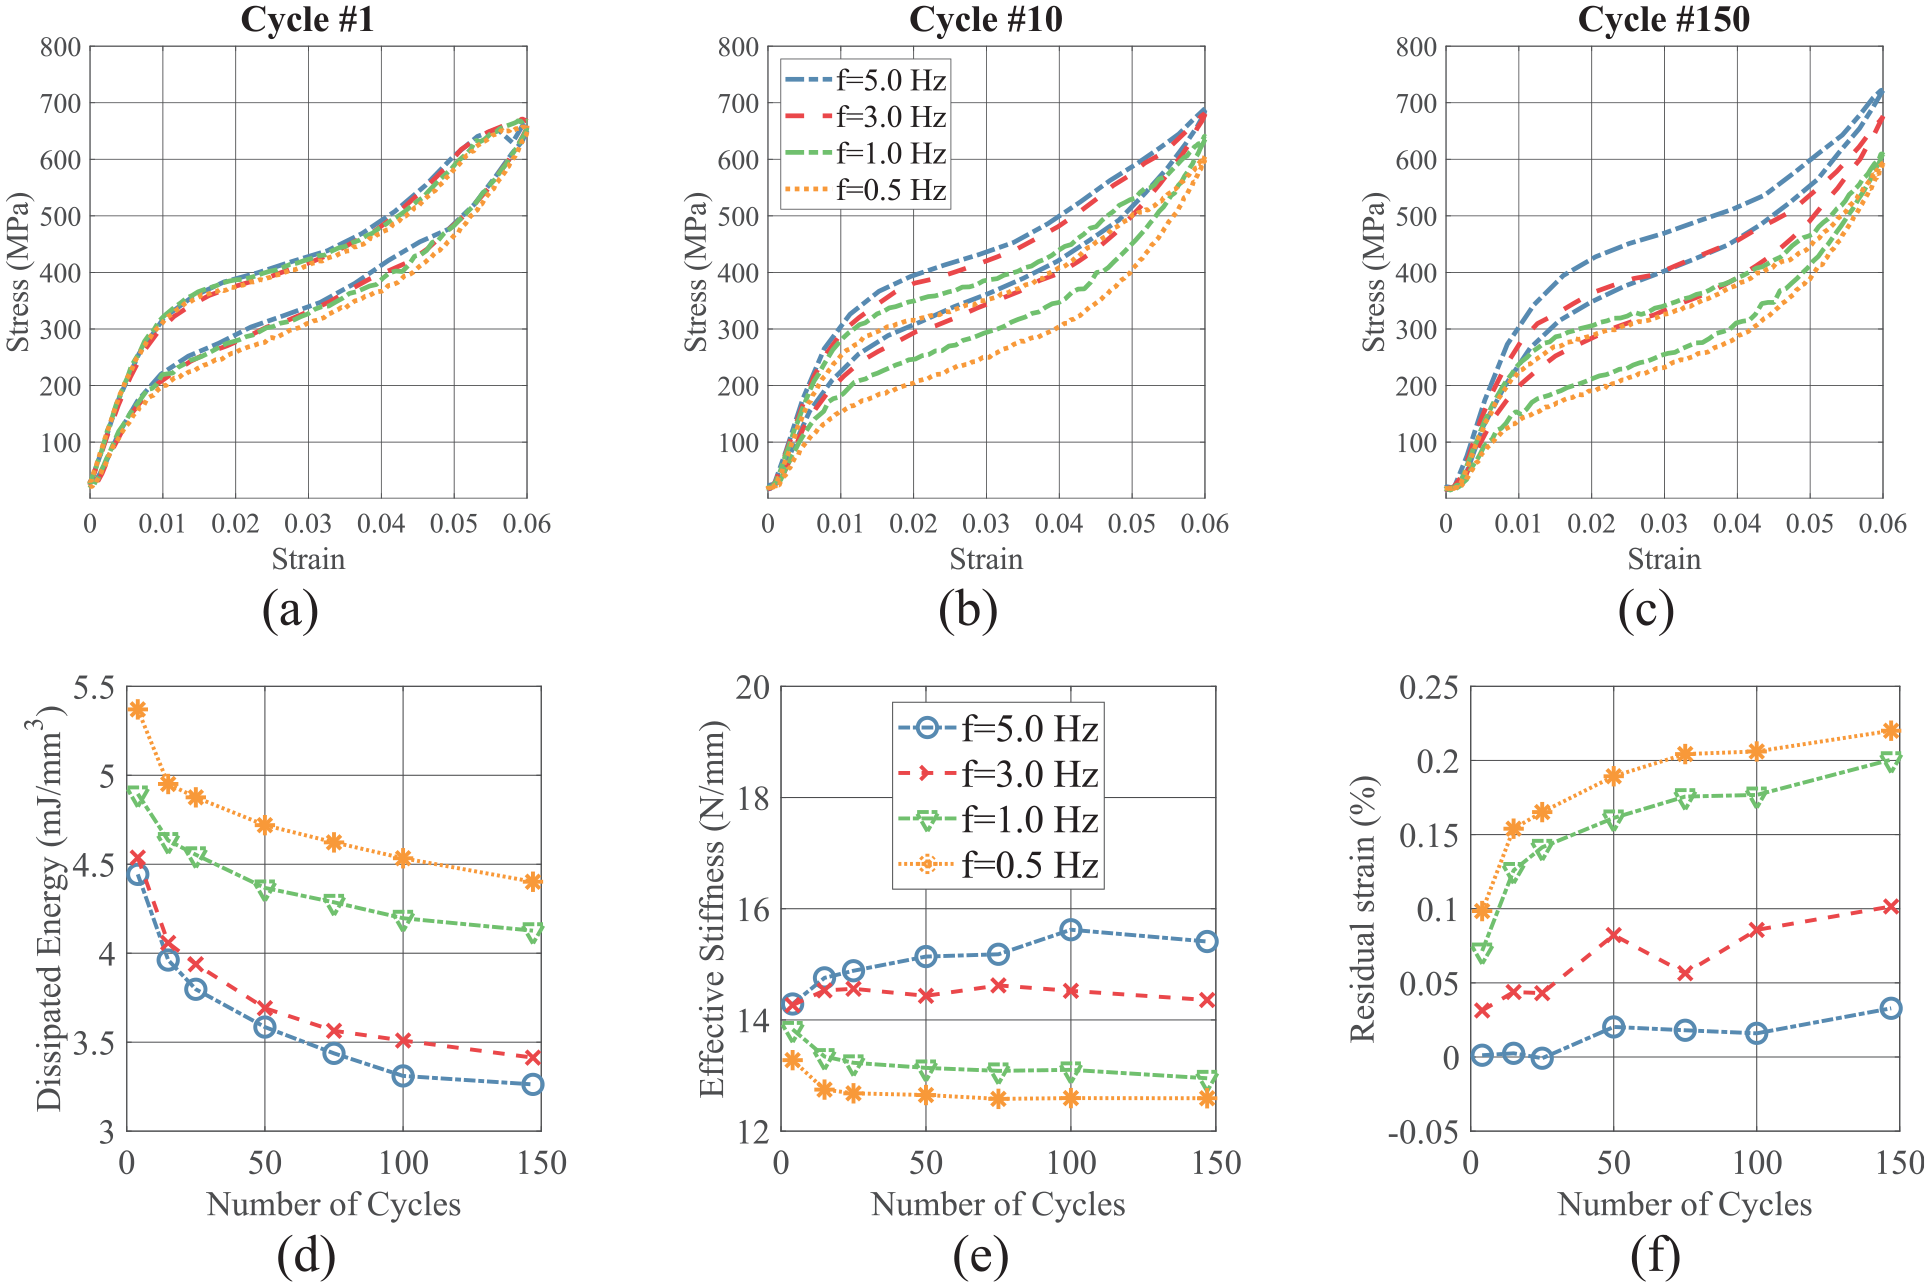
Interaction of f and N: (a–c) hysteresis loops at cycles 1, 10, and 150, (d) dissipated energy, (e) effective stiffness, and (f) residual strain.
Figure 7(d) confirms that the energy dissipation capacity diminishes progressively with an increasing number of cycles, regardless of the loading frequency. The rate of this reduction decreases as the number of cycles increases. Additionally, the curves corresponding to a loading frequency of 3.0 and 5.0 Hz are in closer proximity compared to those for 0.5 and 1.0 Hz. This observation suggests that the decline in energy dissipation capacity with increasing frequency is more pronounced at lower frequencies compared to higher frequencies. The relative reduction for dissipated energy over 150 cycles are 15%, 14%, 22%, and 23% for frequencies of 0.5, 1.0, 3.0, and 5.0 Hz, respectively.
Figure 7(e) shows that as the number of cycles increases, the trend in effective stiffness for the cases corresponding to a loading frequency of 5.0 and 3.0 Hz differs from that observed for the 0.5 and 1.0 Hz cases. While the curves for 5.0 and 3.0 Hz exhibit a slight increase in effective stiffness (particularly the curve corresponding to 5.0 Hz), the curves of 0.5 and 1.0 Hz demonstrate a decreasing trend, especially during the first 20 cycles. Then they reach a stable level, particularly the curve corresponding to f = 0.5 Hz. This can be explained by the variation of peak stress and residual strain. The magnitude of changes in effective stiffness are not substantial in all studied frequencies, amounting to approximately −4% for 0.5 Hz, −5% for 1.0 Hz, 2% for 3.0 Hz, and 7% for 5.0 Hz.
Figure 7(f) shows that the residual strain increases as the number of cycles grows, with the most significant increase occurring during the initial cycles, particularly for the lower frequencies of 0.5 and 1.0 Hz. Similar to the trend observed for dissipated energy, Figure 7(f) shows that the increase in residual strain with an increasing number of cycles is less pronounced at higher frequencies, that is, 3.0 and 5.0 Hz, due to less final residual strain as discussed earlier.
3.2.2. Loading frequency and strain amplitude
Since the underlying causes of the observed results in this section are closely related to those discussed in the next section, that is, interaction of pre-strain and loading frequency, only the results are presented here. Figure 8 displays the results of set 3. This set consists of 12 testing cases where the pre-strain value is held constant at E = 0.0%. The loading frequencies are 0.5, 1.0, 3.0, and 5.0 Hz, while the strain amplitude ranges from 1.5% to 6.0% in increments of 1.5%. Figure 8(c) indicates that when the strain amplitude is low, A = 3.0%, the stress-strain curves for all loading frequencies are visibly comparable. However, when the strain amplitude increases, the curves separate, with those corresponding to higher frequencies positioned above those associated with lower frequencies. The results in Figure 8(d) show that, in general, the energy dissipation capacity of a SMA wire diminishes at a decreasing rate as the loading frequency increases, more notably for higher strain amplitudes, with few exceptions. The exceptions occur at A = 3.0% and A = 4.5%, where the dissipated energy slightly increases as the frequency increases from 0.5 to 1.0 Hz. The increases in energy dissipation are 3.8% and 7.1% of the initial values, respectively. The results also reveal that the dissipated energy increases approximately linearly with loading amplitude for the range of A = 3.0%–A = 6.0% at all studied loading frequencies except for f = 0.5 Hz where the increase in energy dissipation is more than linear. Figure 8(e) shows that the effective stiffness increases by 25% of the initial value when the loading frequency increases from 0.5 to 5.0 Hz for A = 6.0%. The increases when A = 4.5% and A = 3.0% are 23% and 15%, respectively. This suggests that as the frequency increases, wires subjected to higher strain amplitudes show a larger increase in effective stiffness compared to those with lower strain amplitudes.
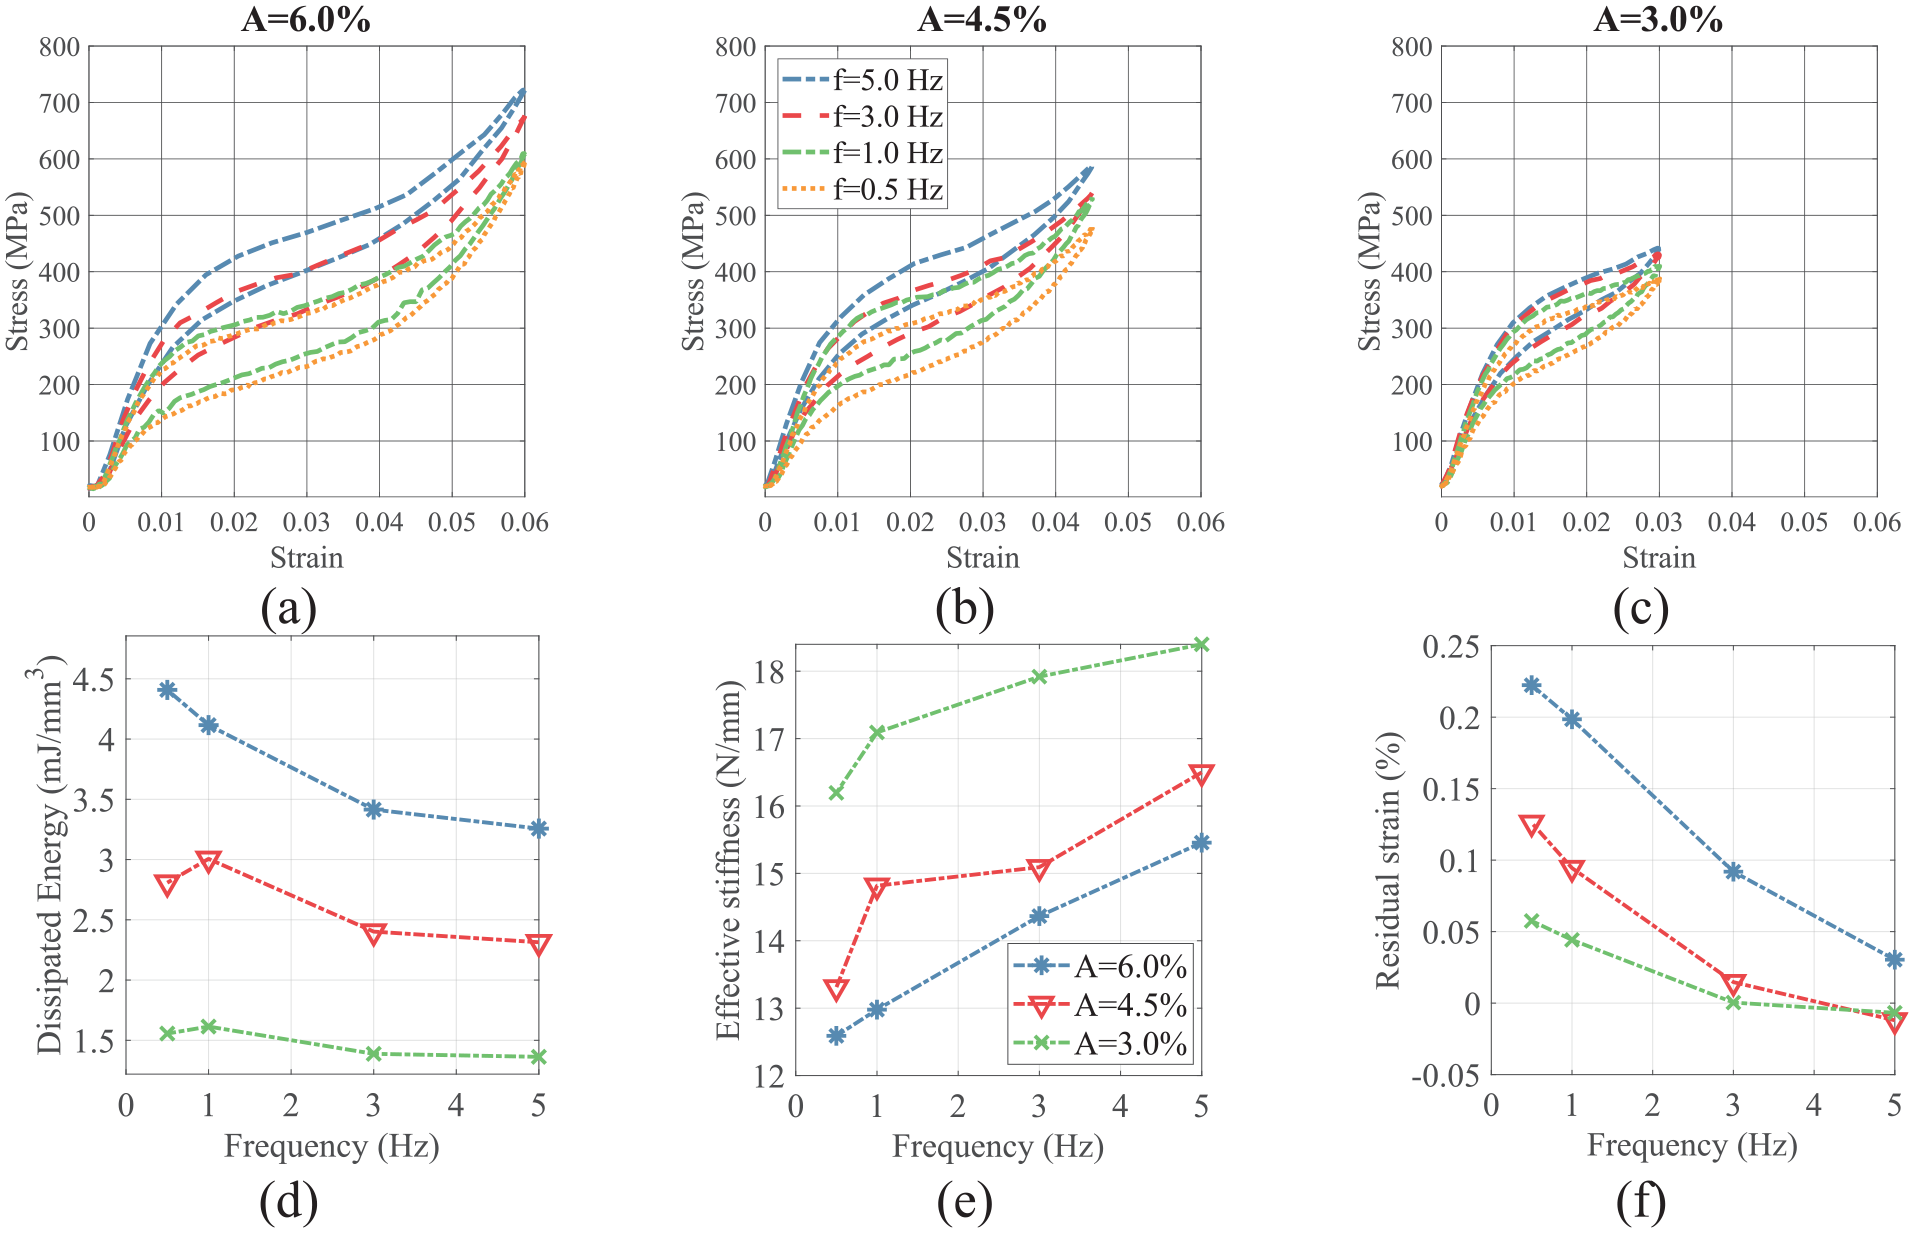
Interaction of f and A: (a–c) stress-strain curves at A = 6.0%, A = 4.5% and A = 3.0%, (d) dissipated energy, (e) effective stiffness, and (f) residual strain.
3.2.3. Loading frequency and pre-strain
To study the interaction of loading frequency and pre-strain, 12 testing cases in set 4 are conducted. The strain amplitude is A = 6.0% in all cases. The loading frequency takes values of 0.5, 1.0, 3.0, and 5.0 Hz and the pre-strain varies between E = 1.5% and E = 4.5% in 1.5% increments. The results in Figure 9(a) to (c) demonstrate that for a constant strain amplitude of 6%, when the pre-strain value increases, the hysteresis loops become narrower, and less differentiated by loading frequency. At a pre-strain of 4.5%, they almost visibly coincide, that is, the difference in stress value is less than 4.5%. This finding is true even for smaller pre-strain values in the low frequency region, that is, f = 0.5 Hz and f = 1.0 Hz, of which the difference in stress value is less than 5.5%. This is comparable to what is observed for the interaction of the strain amplitude and loading frequency.
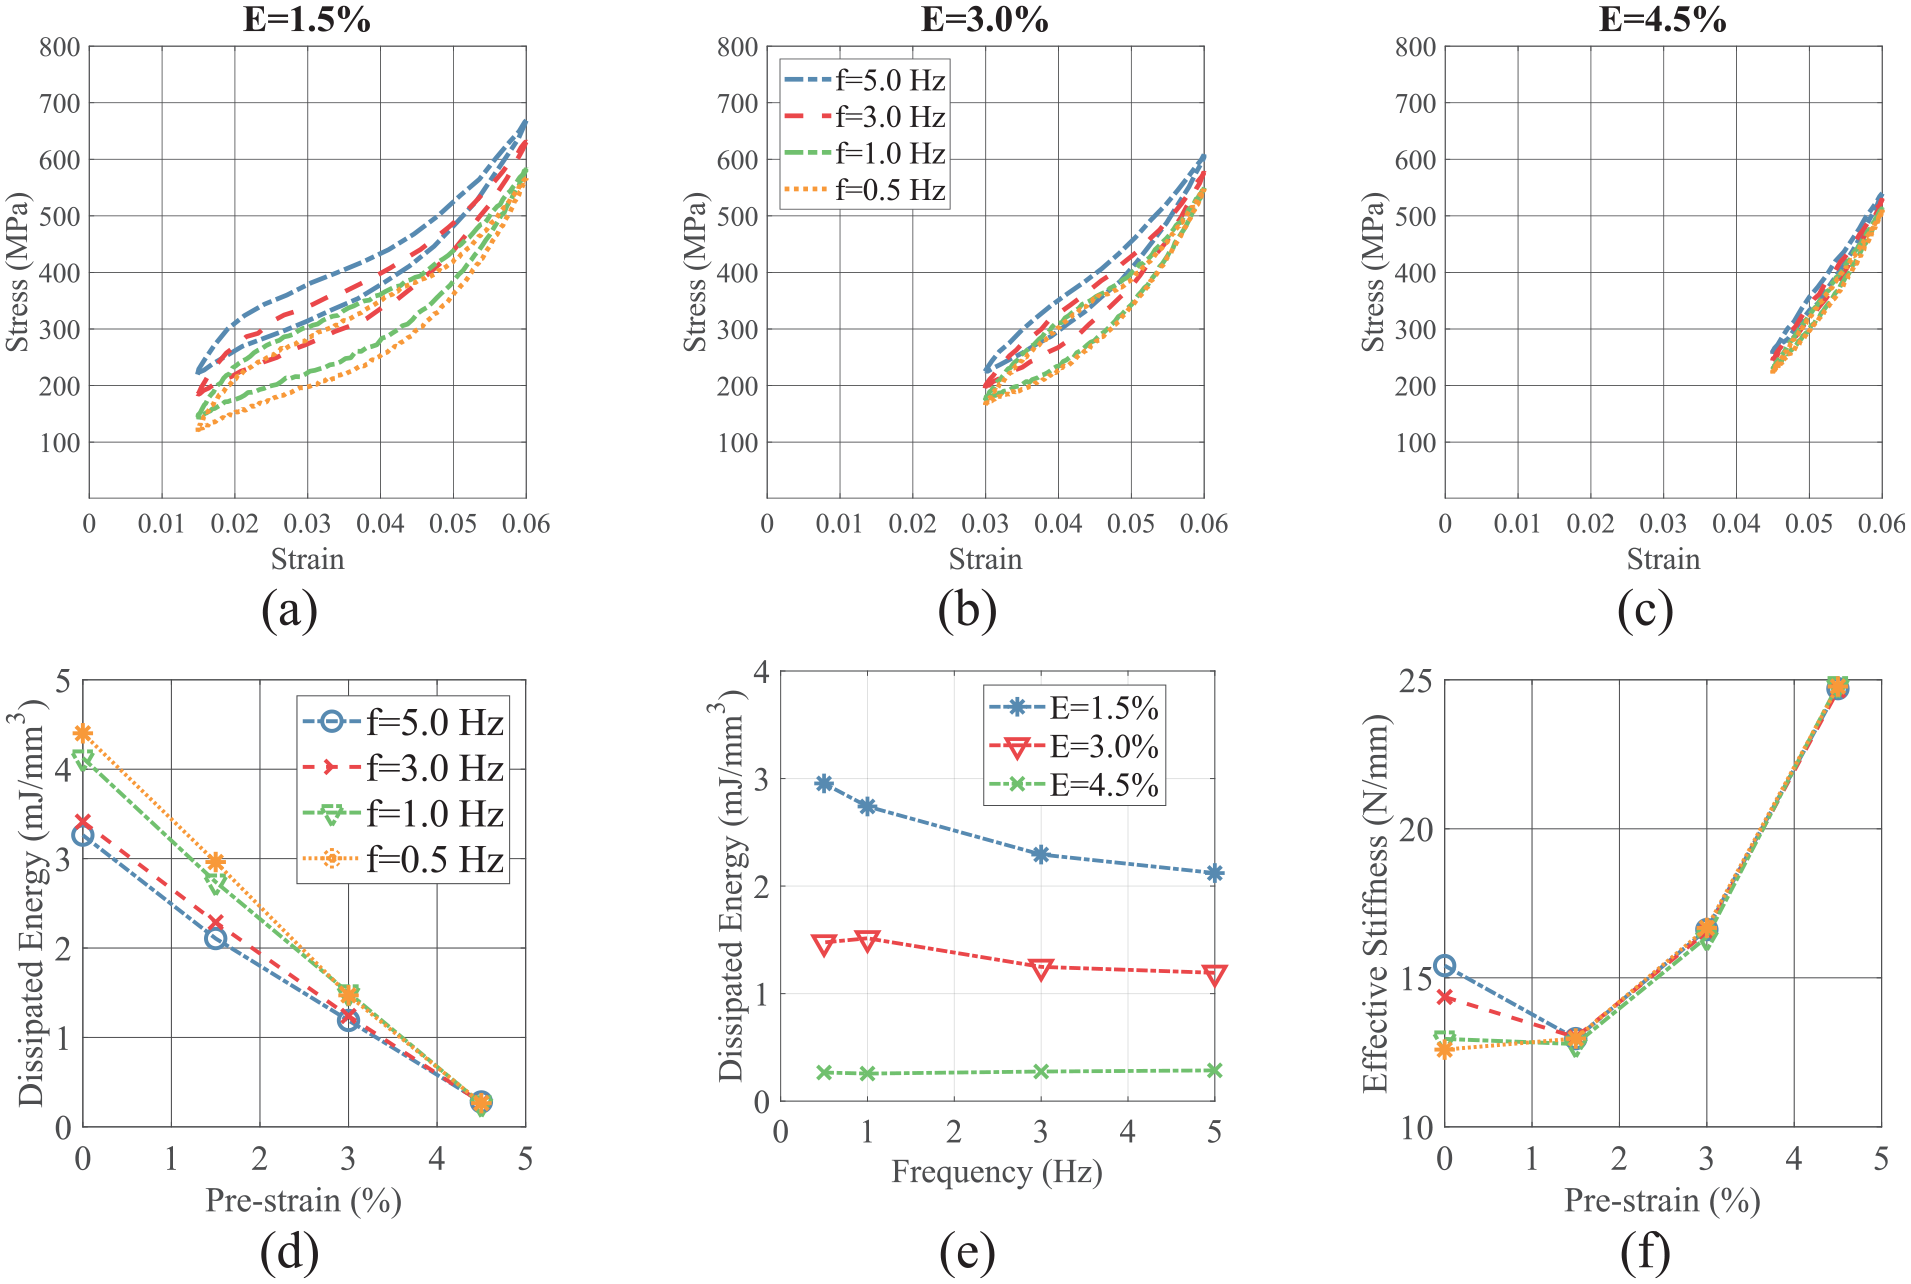
Interaction of f and E: (a–c) stress-strain curves at E = 1.5%, E = 3.0% and E = 4.5%, (d and e) dissipated energy, and (f) effective stiffness.
It is postulated that as the effective strain amplitude S decreases, there is less phase transformation during the loading and unloading stage. This is particularly relevant when the hysteresis loops are positioned close to the beginning of the stress-strain curve, where the elastic deformation of the austenite phase happens, or close to the phase transformation completion region, where a majority of the martensitic transformation has occurred. Less heat generation (absorption) during the loading (unloading) phase reduces wire temperature variations during the loading (unloading) stage. When the loading frequency is also low, the wire has sufficient time for an effective heat exchange which mitigates the temperature change. This leads to a similar wire temperature condition for different testing cases, resulting in closely spaced hysteresis loops. The observation remains valid for higher S values when the loading frequency is low, as the lower phase transformation rate results in a lower heat release (absorption) rate and sufficient time for heat exchange, as shown in Figures 8(a) and 9(a). When the value of S increases, wires experiencing higher frequencies tend to retain a higher average temperature during cyclic loading due to the limited time of heat transfer between the wire and the surrounding. Thus, the hysteresis loops of the higher frequency tests show significantly higher stress levels compared to those of the lower frequency tests.
It can be seen from Figure 9(a) to (c) that when A = 6%, the maximum stress reduces and the stress plateaus shift down as the value of E increases, regardless of loading frequency. For example, when f = 5.0 Hz the maximum stress decreases monotonically from 732 to 539 MPa as the pre-strain increases from 0.0% to 4.5%. The dissipated energy generally decreases with increasing loading frequency. However, exceptions occur when the dissipated energy is nearly insensitive to loading frequency for E = 4.5% and in the case of E = 3.0%, when the dissipated energy slightly increases as loading frequency rises to 1.0 Hz from 0.5 Hz, as shown in Figure 9(e). Thus, from Figures 8(d) and 9(e), the predominant trend of the impact of loading frequency on dissipated energy is not valid for small values of strain amplitude or large pre-strains, that is, small values of S. When the strain rate is low, that is, low loading frequencies (f = 0.5 Hz) and small values of S (S = 1.5%), the wire’s temperature variation is less, which allows the wire to efficiently dissipate released (absorbed) heat. Thus, increasing the loading frequency only slightly impacts the thermal condition of a wire. This allows the wire to be less sensitive to the frequency increase, and even dissipate slightly more energy. However, by further increasing loading frequency, the heat release rate exceeds the heat exchange capacity, causing the wire’s temperature to increase which negatively impacts energy dissipation. Figure 9(d) shows that the decrease in dissipated energy with increasing pre-strain nearly follows a linear trend.
Figure 9(f) reveals that the effective stiffness generally increases with higher pre-strain levels. For each specific pre-strain level, the change in effective stiffness with increasing frequency is negligible, less than 1% except for E = 0.0% where the effective stiffness increases with increasing loading frequency.
The results from sections 3.2.2 and 3.2.3 show that the strain rate, which resulted from the interaction of effective strain amplitude and loading frequency, is the governing factor dictating the mechanical behavior of a SMA wire. When the wire is subjected to a low loading frequency or a small effective strain amplitude or both, the generated heat is low. This allows the wire to dissipate the heat sufficiently, so the change of wire temperature is insignificant. Therefore, the mechanical behavior of the SMA wire, particularly energy dissipation, shows less sensitivity to cyclic loading frequency. On the other hand, when the interaction of loading frequency and effective strain amplitude leads to a large strain rate (usually for f > 0.5 Hz and S > 1.5%), the mechanical properties of the SMA wire become more sensitive to loading frequency, as reflected by a monotonic decreasing pattern with the increase of loading frequency.
3.2.4. Strain amplitude and number of cycles
To investigate the impact of loading strain amplitude on the cyclic behavior of SMA, the 4 cases in set 5 are tested, of which the loading frequency and pre-strain values are kept constant at f = 1.0 Hz and E = 0.0%, while the loading strain amplitude is increased from A = 1.5% to A = 6.0% in uniform increments of 1.5%. Figure 10(a) to (c) show that the loading and unloading plateaus of all tested specimens, differing in strain amplitude, exhibit close proximity during the early cycles. The maximum difference of the stress on the loading plateau between all curves is around 6%. However, with increasing cycle count, distinct trends emerge: the loading plateau for specimens subjected to 1.5%, 3.0%, and 4.5% strain amplitudes show a less than 4% decline in peak stress yet they continue to closely track one another. In contrast, the loading plateau of the testing case under 6.0% strain amplitude shows a more pronounced approximately 9% downward shift, resulting in a distinctly lower stress-strain trajectory over subsequent cycles. A similar observation is evident in the unloading plateaus.
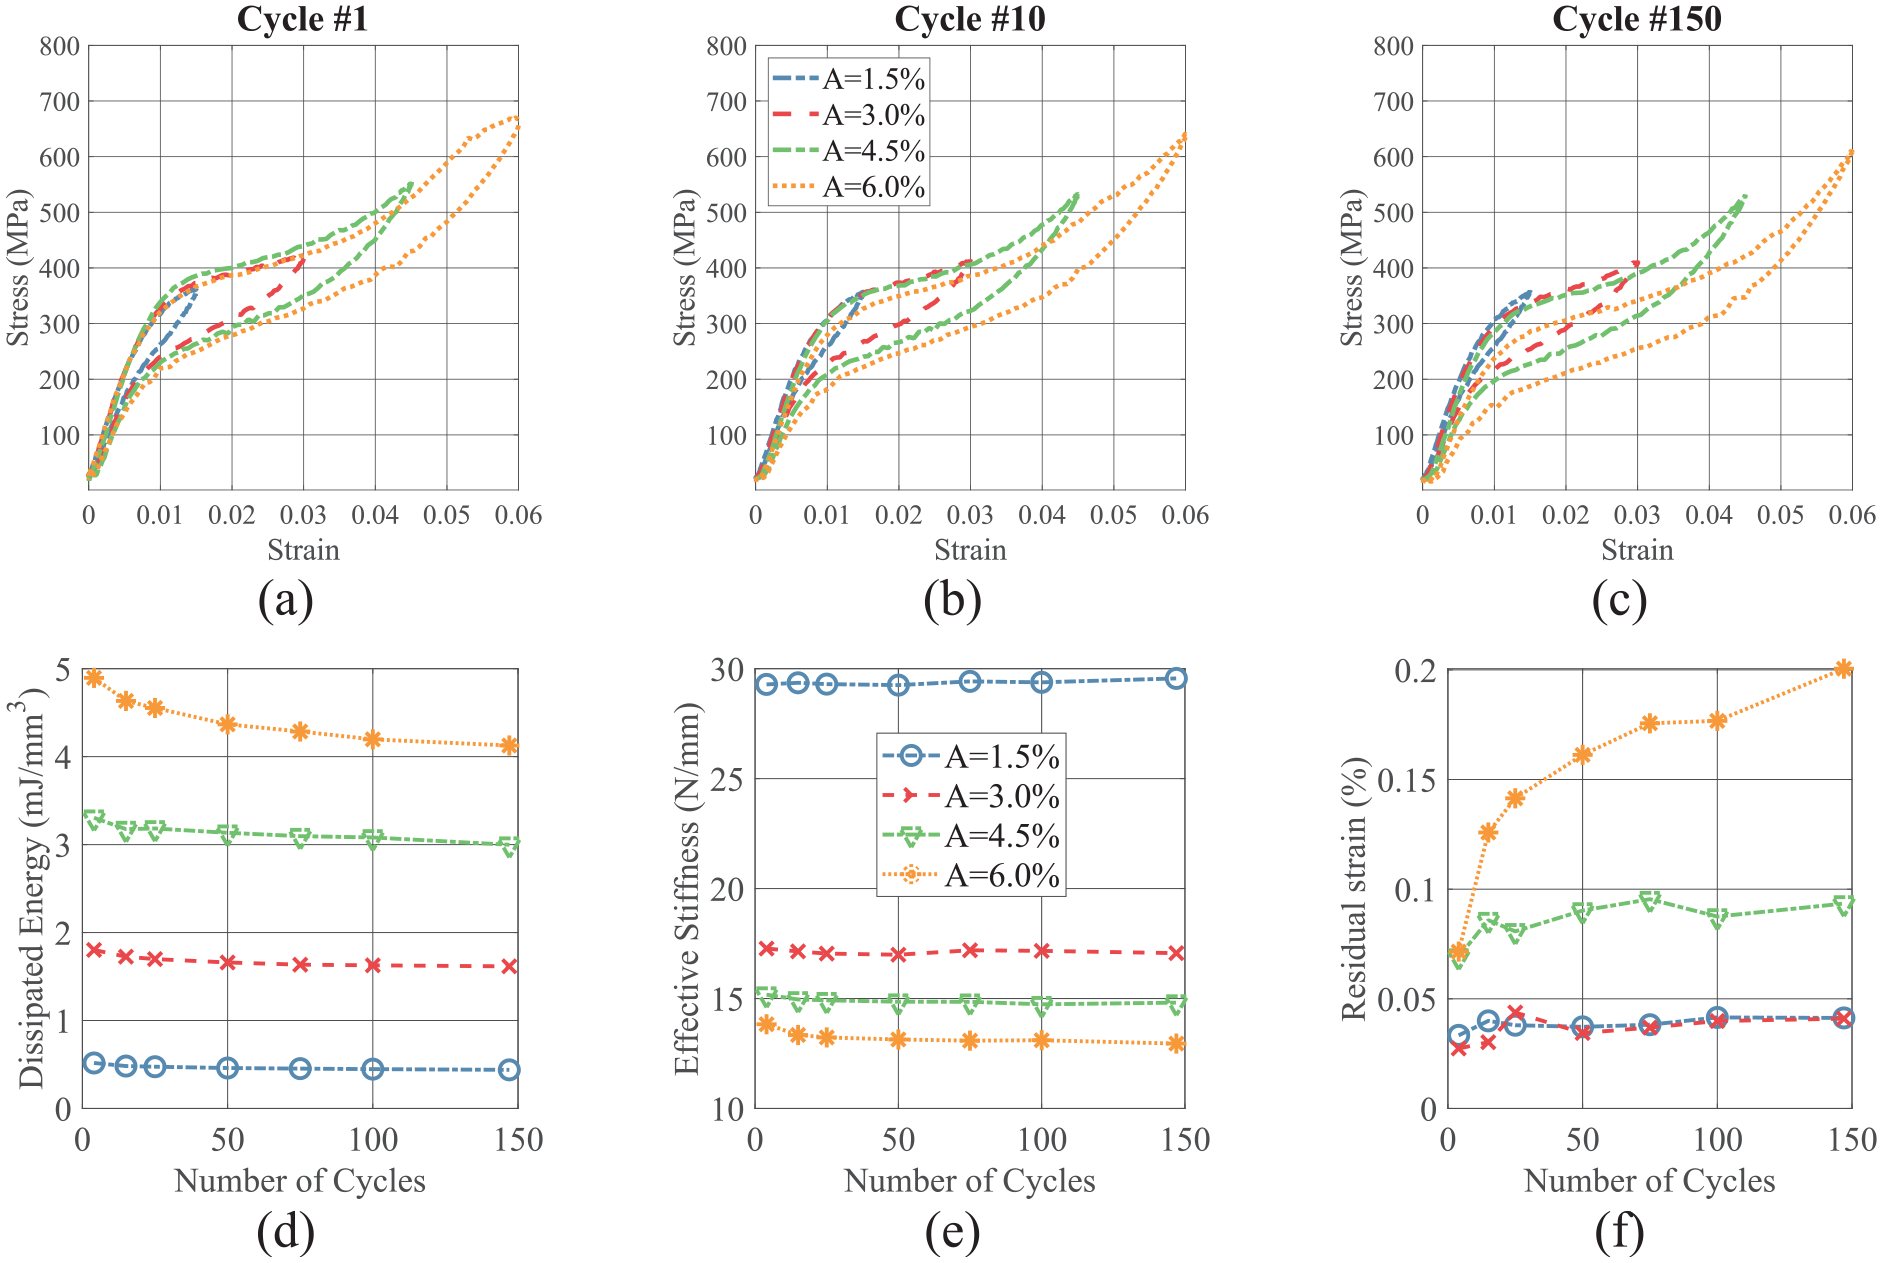
Interaction of A and N: (a–c) stress-strain curves at cycles 1, 10, 150, (d) dissipated energy, (e) effective stiffness, and (f) residual strain.
Figure 10(d) shows that the dissipated energy decreases with an increasing number of loading cycles. The decreases are 15.1%, 10.3%, 9.3% and 15.7% of initial values for A = 1.5%, A = 3.0%, A = 4.5%, and A = 6.0%, respectively, primarily occurring within the first 15 cycles. Figure 10(e) shows that the effective stiffness experiences a significant decrease when the strain amplitude increases from 1.5% to 3.0%, after which the rate of decline becomes smaller. The primary reason is that when the strain amplitude exceeds 1.5%, the hysteresis loop includes part of the loading plateau region, where the tangent stiffness is significantly smaller. This predominantly reduces the effective stiffness. The effective stiffness change is not significant as the number of cycles increases. For A = 6.0%, the majority of the stiffness decline occurs in the early cycles. Figure 10(f) shows that residual strain values are nearly identical for A = 1.5% and A = 3.0%. As mentioned above, when the phase transformation rate decreases as a result of small values of strain amplitude and loading frequency (or both), the effect of thermomechanical stabilization becomes less pronounced. However, the wire experiences greater residual strain as the loading strain amplitude increases. The residual strain generally increases as the number of cycles increases and the majority of the ultimate residual strain accumulates within the early cycles. Tests conducted under larger strain amplitudes generally exhibit a higher rate of residual strain accumulation and loading plateau stress change with an increasing number of cycles. For example, while for the testing case of A = 1.5% the residual strain increased by 22% of its initial value in the first cycle, the corresponding increase in the case of A = 6.0% is 180%.
3.2.5. Strain amplitude and pre-strain
Figure 11 displays the hysteresis loops, dissipated energy, and effective stiffness for the testing cases in set 6, which are conducted under the same loading frequency of f = 1.0 Hz to study the interaction of strain amplitude and pre-strain. The strain amplitude in these cases ranges from A = 1.5% to A = 6.0%, and the pre-strain values varies from E = 0.0% to E = 4.5%, with both parameters increasing in an increment of 1.5%. Figure 11(a) to (c) indicate that the overall trends observed in the case of increasing strain amplitude or pre-strain individually also hold true when considering their interaction. Here and in the next section, the general impact and trends discussed in previous sections are omitted, and the focus is only on the specific effects related to the interaction of parameters. Figure 11(d) shows that the energy dissipation capacity follows a nearly linear reduction with increasing pre-strain when the strain amplitude is held constant. The energy dissipation capacity slightly decreases for testing cases with equal S values, as the pre-strain increases. The reduction is less than 10% across all S values except for S = 1.5% where A = 6.0% and 4.5% show a reduction of approximately 30%.
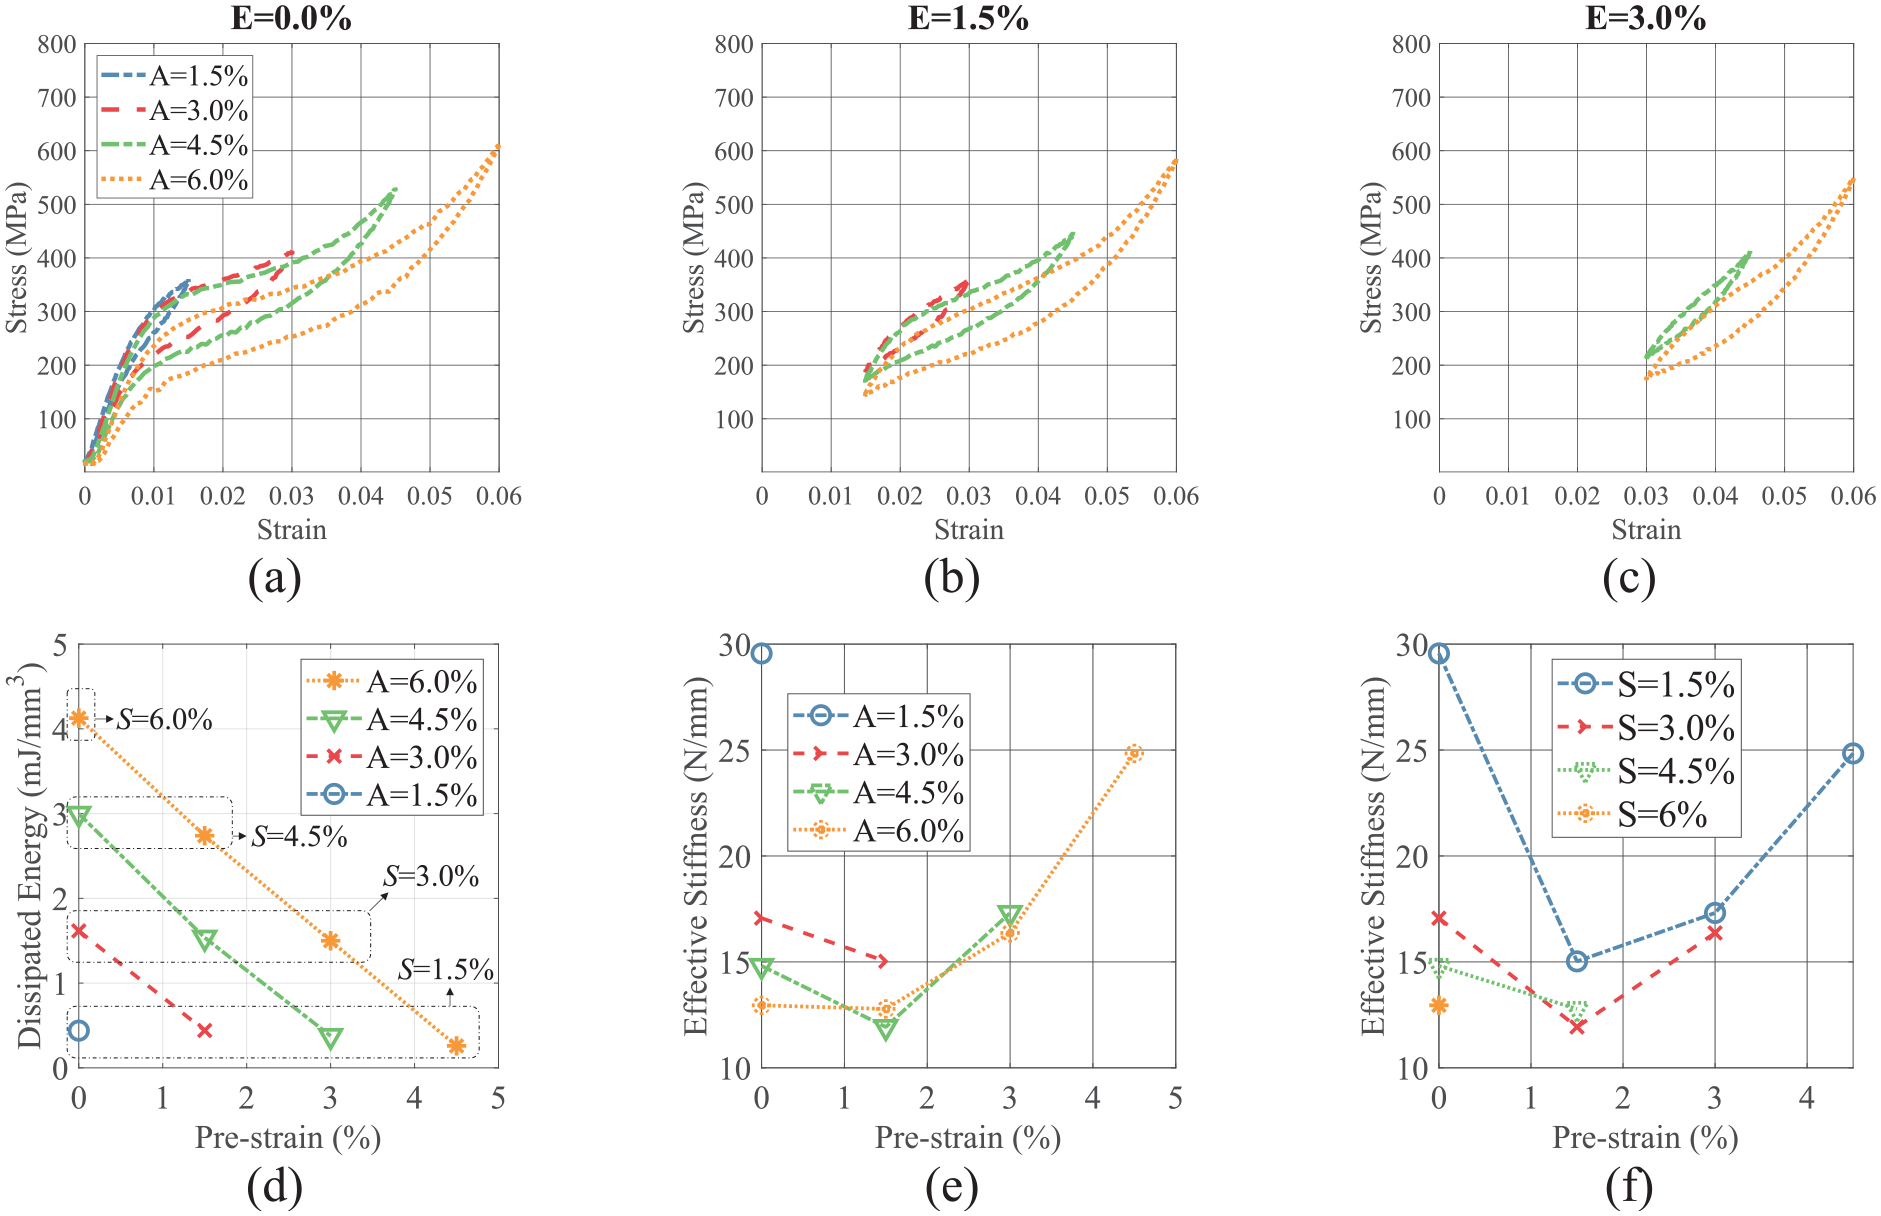
Interaction effect of A and E: (a–c) stress-strain curves for E = 0.0%, E = 1.5% and E = 3.0%, (d) dissipated energy, and (e and f) effective stiffness.
Figure 11(f) shows that for a specific S value, the effective stiffness initially decreases as pre-strain increases (up to E = 1.5%), then begins to rise with further increases in pre-strain. This is because the hysteresis loops of the cases with E = 1.5% overlap significantly with the loading plateaus. As the pre-strain either decreases or increases, the effective stiffness is influenced by the extension of the hysteresis loop to the initial elastic or ending hardening region. Additionally, comparing the cases of E = 1.5% and E = 3.0% for S = 1.5%, where neither hysteresis loop includes the initial and ending hardening region, hysteresis loops with higher pre-strain exhibit elevated initial stress levels, which trigger phase transformation with a smaller stress increment due to the reduced stability of the austenite phase. Consequently, the phase transformation rate is expected to be slightly higher, resulting in a greater temperature rise and ultimately leading to a larger stress increment during the loading stage. For curves with equal S values, the one with larger pre-strain experiences a higher peak stress.
3.2.6. Pre-strain and number of cycles
Set 7 studies the impact of pre-strain on the cyclic behavior of SMA and the interaction with the number of loading cycles. It includes 4 testing cases of which the strain amplitudes and loading frequency, that is, A = 6.0% and f = 1.0 Hz, are identical, while the pre-strain varies from E = 0.0% to E = 4.5% in an increment of 1.5%. As observed in other sets, the stress plateaus of the hysteresis loops are nearly identical in early cycles but become increasingly distinct as the number of cycles increases. As the number of loading cycles increases, the loading plateau of a higher pre-strain level case shifts further down compared to that of the lower pre-strain level case, consistently falling below it. Additionally, Figure 12(d) shows that as the number of loading cycles increases, the energy dissipation capacity decreases. The cases with pre-strain levels of 4.5%, 3.0%, 1.5%, and 0.0% experience reductions in their initial energy dissipation capacity by 44%, 27%, 17%, and 13%, respectively, over 150 cycles. This occurs because the influence of thermomechanical stabilization is less pronounced at lower S values, as discussed earlier. Figure 12(e) also shows that, except for the testing case with no pre-strain which slightly decreases, in all other cases the effective stiffness increases as the number of loading cycles increases. The increases for 1.5%, 3.0%, and 4.5% pre-strain levels are 5.8%, 10.9%, and 11.5% of the initial value, respectively.
Interaction effect of E and N (a–c) stress-strain curves at cycles 2, 10, and 150, (d) dissipated energy, and (e) effective stiffness.
4. Discussion
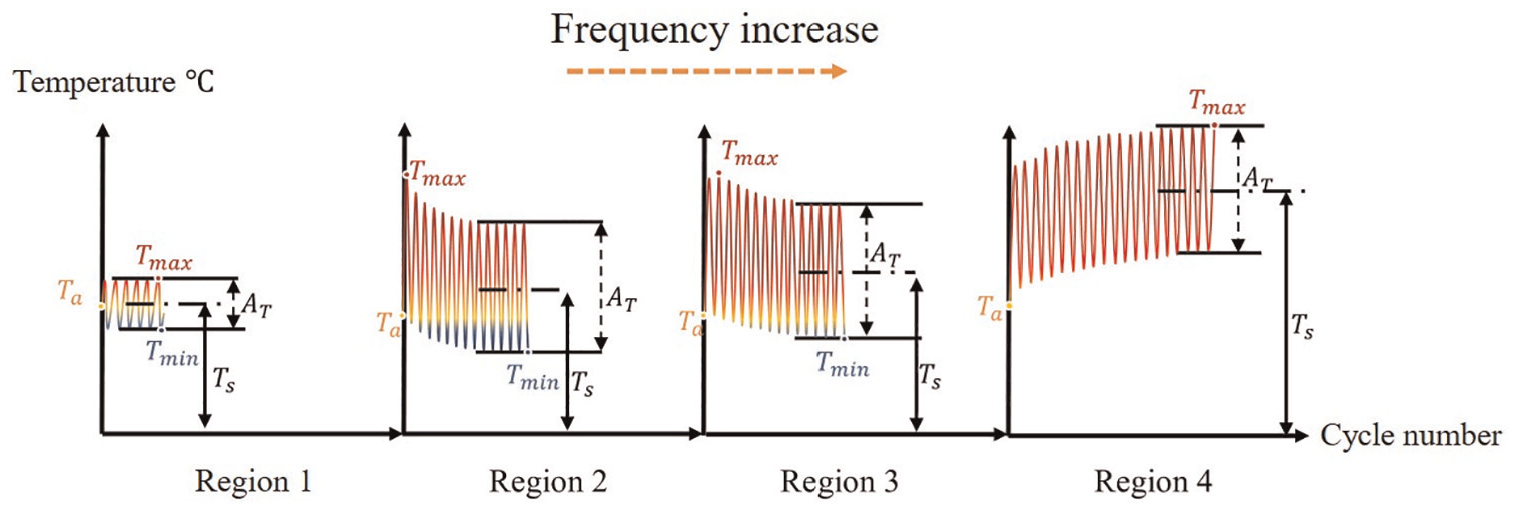
The rationale presented in section 3 can be employed to clarify the inconsistencies in previous studies on dissipated energy trends in SMA wires under different cyclic loading conditions. Under cyclic loading, temperature variations and extremes of a SMA wire are primarily influenced by the interplay of factors such as wire dimension, ambient temperature, and cyclic loading parameters. Figure 13 illustrates four distinct regions for temperature variation of a SMA wire under cyclic loading depending on the loading frequency (He and Sun, 2010; Malécot et al., 2006; Yin and Sun, 2012). In this figure, Ts and AT represent the average temperature and the amplitude of temperature variation of the wire under steady-state conditions, respectively. Ta stands for the testing (ambient) temperature, while Tmax and Tmin denote respectively the maximum and minimum temperatures experienced by the wire during cyclic loading.
Temperature variation trends of a SMA wire with increasing loading frequency.
Some studies reported both increasing and decreasing trends in energy dissipation with increasing loading frequency (Dayananda and Rao, 2008; Fan et al., 2023; Liu et al., 2020; Ozbulut and Hurlebaus, 2010; Piedboeuf et al., 1998; Ren et al., 2007; Soul et al., 2010; Wolons et al., 2016), while others observed only a decreasing trend (DesRoches et al., 2004). At very low frequencies (Region 1 in Figure 13), as loading frequency increases, the average temperature of wire remains near ambient (
An increased loading frequency causes maximum temperatures to rise, minimum temperatures to drop, and average temperatures to increase (albeit less noticeably; Region 2 in Figure 13). This causes the loading plateau to move up and unloading plateau to move down, leading to greater energy dissipation which explains the increase observed in (Piedboeuf et al., 1998; Soul et al., 2010; Tobushi et al., 1998; Wolons et al., 2016). The upper frequency range for this region has been reported to be around 0.1 Hz for a 0.5 mm wire at an ambient temperature of 20°C (Soul et al., 2010; Wolons et al., 2016). Although studies such as DesRoches et al. (2004), Dolce and Cardone (2001), and Ozbulut and Hurlebaus (2010) explored this frequency range, they did not observe greater energy dissipation with increasing frequency due to the use of larger specimens (e.g. 1.84 mm wires in Dolce and Cardone, 2001 and 1.8–25.4 mm wires in DesRoches et al. (2004) or a combination of a larger specimen and higher ambient temperature effects (e.g. 1.5 mm diameter at 20°C, 30°C, and 40°C in Ozbulut and Hurlebaus (2010). Furthermore, the proposed rationalization can explain the slight increase in energy dissipation with increasing frequency for a 1.5 mm wire at 0°C observed by (Ozbulut and Hurlebaus (2010) as it is expected that the lower testing temperature increases the transition frequency, that is, the frequency at which the trend of energy dissipation changes with increasing loading frequency.
The next region (Region 3 in Figure 13) is where the energy dissipation decreases with an increase in the loading frequency. In this frequency range, both maximum and minimum temperatures of each cycle increase, however the shift is higher for the minimum temperature. This means that the unloading plateau shifts up faster than the loading plateau and thus energy dissipation continues to decrease, which has been reported in nearly all the previous research focusing on large bar specimens and high loading frequencies, for example, Dayananda and Rao (2008), DesRoches et al. (2004), Dolce and Cardone (2001), Fan et al. (2023), Liu et al. (2020), Ozbulut and Hurlebaus (2010), Piedboeuf et al. (1998), Ren et al. (2007), Soul et al. (2010), and Wolons et al. (2016). The transition frequency between regions varies based on the testing condition such as wire size and type, loading strain amplitude, ambient temperature and material properties. For example, a transition frequency around 0.1 Hz was observed in Soul et al. (2010) for 0.5 mm wire under 8% strain amplitude whereas for 4.45 mm wire the transition frequency observed was around 0.01 Hz (Soul et al., 2010). For A = 2% and 4%, the observed transition frequencies were 1.0 and 0.1 Hz respectively, for a wire with a diameter of
In Region 4, the average temperature and its extremes stabilize at higher values as the loading frequency increases. This leads to a negligible reduction in cyclic energy dissipation due to negligible shifts in the loading and unloading plateaus. This explains the stabilization of dissipated energy observed in Dolce and Cardone (2001), Liu et al. (2020), Soul et al. (2010), and Wolons et al. (2016) for high loading frequencies.
5. Conclusions
This study investigated the interaction effects of cyclic loading parameters on the mechanical properties of SMA wire through a comprehensive experimental program and provided rationalizations for the observed results. Two key novelties have been demonstrated: it examined the interaction effects of cyclic loading parameters, that is, loading frequency, pre-strain, and strain amplitude, on SMA behavior; and it provided macro-scale theoretical rationalizations to explain the observed SMA behavior resulting from interactions between different loading parameters. The proposed rationale was also used to justify contradictions reported in the literature. The key findings are as follows:
The impact of individual loading parameters on the mechanical behavior of SMAs aligns consistently with findings reported in literature. The stress plateaus shift upwards and residual strain accumulation reduces as loading frequency increases. With the decrease of loading strain amplitude or increase of pre-strain, both residual strain accumulation and dissipated energy become less.
The hysteresis loops in the initial cycles are closely aligned with consistent stress plateaus, regardless of the other loading parameters. As the number of cycles increases, the hysteresis loops corresponding to different loading conditions show more visible differences.
The strain rate of a SMA wire during cyclic loading depends on the interaction of loading frequency and effective strain amplitude. A change in the strain rate influences the temperature of the wire and thus its mechanical response.
The energy dissipation trend is primarily governed by the strain rate, which depends on effective strain amplitude and loading frequency. When these two loading parameters jointly lead to a high strain rate (S > 1.5% and f > 0.5 Hz), the energy dissipation capacity of a SMA wire decreases monotonically with increasing loading frequency. However, this predominant trend is not valid for small effective strain amplitudes (S = 1.5% and f = 0.5 to 5.0 Hz), where the dissipated energy increases with increasing loading frequency.
The residual strain decreases independently of strain rate as the loading frequency increases, with the effect becoming more pronounced at higher strain amplitudes.
The increase of effective stiffness with loading frequency is independent of the strain rate; although at a variable rate depending on strain amplitude.
The effective loading strain amplitude accounts for the interaction of loading strain amplitude and pre-strain.
The energy dissipation capacity decreases approximately linearly as pre-strain increases and loading strain remains constant (i.e. the effective strain amplitude decreases). On the other hand, if the effective strain amplitude remains constant, the reduction in the energy dissipation capacity is less notable, typically less than 10% of the initial value.
For a specific effective strain amplitude, the effective stiffness decreases initially as the pre-strain increases up to E = 1.5%. But with further increases in pre-strain, the stiffness begins to increase.
It is suggested to track the wire temperature simultaneously with the mechanical response of SMAs during cyclic testing in future studies to better analyze the influence of temperature variations on SMA cyclic behavior. Additionally, while the current study aims at investigating the interaction of different loading parameters on the SMA cyclic behavior, a more systematic design of the testing matrix using a statistical sensitivity analysis approach, such as Design of Experiments, is recommended to evaluate the combined effects of various loading parameters more comprehensively.
Footnotes
Declaration of conflicting interests
The authors declared no potential conflicts of interest with respect to the research, authorship, and/or publication of this article.
Funding
The authors disclosed receipt of the following financial support for the research, authorship, and/or publication of this article: The authors acknowledge the support of the Natural Sciences and Engineering Research Council of Canada (NSERC) [funding reference number RGPIN-2019-03924 and RGPIN-2022-02973].
Data availability statement
Research data associated with this article is available upon request.