
Abstract
The attenuation of the structure-borne sound caused by elevator systems in residential buildings is a priority for manufacturers. This work develops a model of an active control isolation system for the vibrations produced by the elevator drive machine. This solution proposes the substitution of conventional passive isolators by new ones made of a magnetorheological elastomer (MRE), a smart material whose modulus can be modified by applying a magnetic field. To guide the design process, MRE isolators are fabricated and experimentally tested statically and dynamically in compression mode. Subsequently, the parameters of the MRE are fitted to build a nonlinear material sub-model that accounts for the frequency, amplitude, and magnetic field dependency. Afterward, a global model of the elevator drive machine vibration isolation system is developed, which incorporates the drive machine, structure, and MRE-based isolator. To enhance vibration isolation, two active control strategies are designed and assessed. Simulation results predict that active control systems based on MRE isolators improve vibration isolation as compared to traditional passive systems. The excitation amplitude and frequency, along with the control strategy and magnetization of the MRE isolators are shown to be critical parameters when designing an active control solution.
1. Introduction
Comfort is becoming increasingly important in the elevator industry, as it is a critical factor in improving perception and providing a positive customer experience. An increasing concern for accessibility together with the aging of the population profile in many countries (Eurostat, 2021) has made these machines essential in many houses and public constructions. With increasing building construction, and therefore, increasing demand for elevator installations, offering good ride quality, and guaranteeing acceptable sound and vibration conditions has become a priority. Conventional elevator installations are composed of an electromechanical part, including the electric motor (Li et al., 2020) and the controlling system (Nazarova et al., 2019), and a mechanical part, which involves the traction sheave (Göksenli and Eryürek, 2009), pulleys, cabin, counterweight, and the ropes (Yang et al., 2017) and belts (Sujith Kumar et al., 2020). The electric motor drives the traction sheave where the suspension system is coupled. This suspension system holds and pulls the cabin that travels vertically through the guide rails. The counterweight is added to balance the weight of the cabin so that the torque required from the machine is reduced.
Configuration shown in Figure 1 is a machine room less type, in which a space reduction is achieved by installing the machine upon a frame that is fixed to the guide rails that are attached to the building. The motor in an elevator is the primary source of noise and vibrations that are transmitted to the building through the structure (Romeu et al., 2000; Yu et al., 2005). These vibrations are caused by imbalances, electromagnetic torque ripple, and even by possible eccentricity between the motor and the traction sheave. Therefore, vertical vibrations are transmitted to the cabin through the cables and directly to the building structure. The effects of mechanical vibrations in elevator installations include the reduction in the ride quality conditions (Romeu et al., 2000), the increase of sound and vibration noticed in residences adjacent to the equipment (Qiu et al., 2020), and even the increase of component wear phenomena (Yaman et al., 2016). Thus, the analysis of the vibration transmission and implementation of vibration isolation solutions is a necessary task.
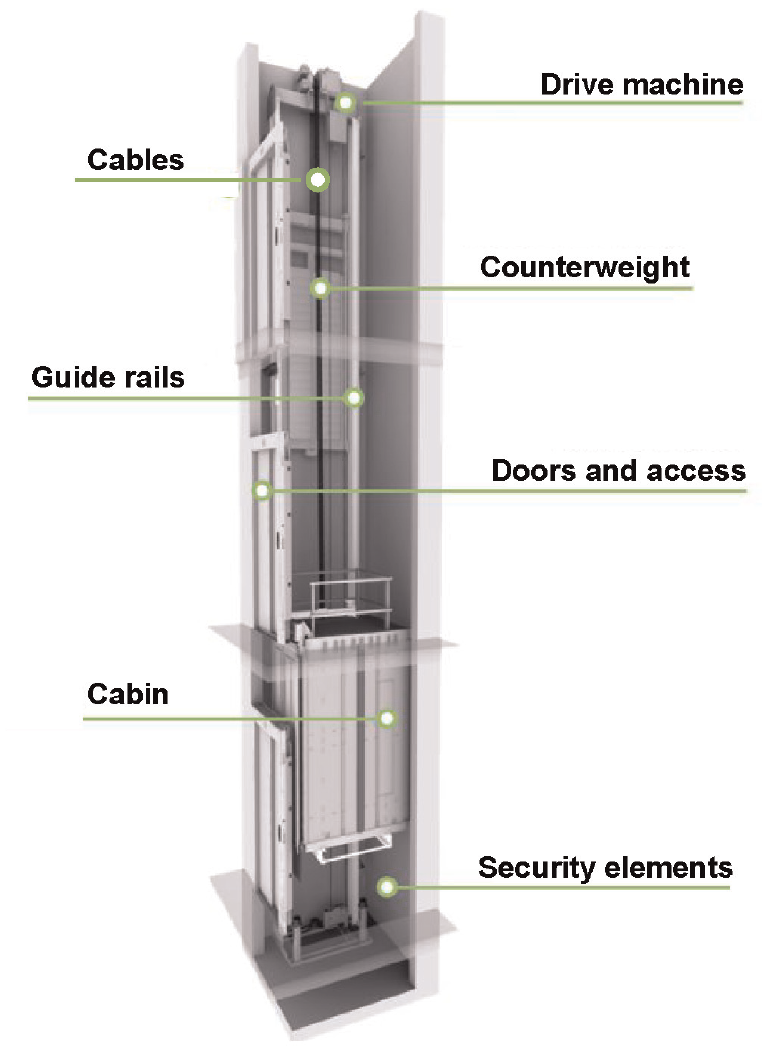
Machine room less elevator system.
Physical models of the elevator have been developed to analyze their dynamic behavior. Some studies have developed dynamic models of the complete elevator system, like Nalbant and Sezer (2019) where they make use of the linear graph method and Cho and Rajamani (2001) where they used a multi-body approach to create a model accounting for the vertical movement of the elevator car. Furthermore, Arrasate et al. (2013, 2014) studied the vertical vibrations caused by the torque ripple generated at the drive system, made measurements of the acceleration response in experimental tests, and compared the results with a 5 degree-of-freedom lumped-parameter model of the elevator system. Moreover, mathematical models to represent high rise elevators (Crespo et al., 2018; Fortgang et al., 2006), and specific parts of the elevator system such as the ropes (Kaczmarczyk et al., 2003) and the compensating sheave (Watanabe and Okawa, 2018) are found. The cabin has also been extensively studied because it is vulnerable to the vertical and the lateral vibrations that affect the passenger comfort (Coffen et al., 1997; Feng et al., 2009; Herrera et al., 2010, 2014a; Qiu et al., 2020; Zhang and Yang, 2017).
The influence of both internal and external variables on the dynamics of the elevator system has also been assessed. Regarding the internal variables, the influence of the design parameters of the elevator (Qiu et al., 2020; Vladić et al., 2011) and the influence of random parameters caused by manufacturing and installation errors (Zhang and Yang, 2017) are studied optimizing the elevator system. In addition, external variables may also influence the behavior of the system. Modeling and experimental testing of the influence of passengers were carried out by Herrera et al. (2010, 2014a, 2014b) and Kaczmarczyk et al. (2003) studied the influence of the wind-induced building movement on the vibration of the ropes.
Apart from the modeling and dynamic analysis of the elevator system, some authors have investigated the possibility of implementing active vibration control algorithms. Nalbant and Sezer (2019) implemented a fuzzy logic algorithm to improve the system response and Fortgang et al. (2006) used the input shaping method in a scheduling algorithm based on the elevator position. Moreover, Kang and Sul (2000) used the elevator car acceleration feedback compensation to control the vertical vibration. To control the lateral vibrations in the cabin, Feng et al. (2009) designed a controller using the Lyapunov’s method.
Although these methods can significantly reduce the vibration in the elevator systems, they are limited to the specific operation conditions and the design of elevators, and the use of vibration isolators is always necessary. Elevator system typically use vibration isolators made of elastomeric materials, which are mounted under the drive machine and between the elevator car frame and cabin. This design offers good isolation properties along with reliability and durability (De Silva, 2005). Elastomeric supports are normally selected to meet requirements regarding deformation at some specific static loading conditions to prevent their degradation over time. However, these criteria may lead to non-optimal configurations from the point of view of the vibration isolation.
The use of magnetorheological elastomers (MREs) is a potential solution to achieve optimal vibration isolation properties while meeting static deformation requirements. MREs are composite materials, based on a non-magnetic elastomer matrix, where magnetic-sensitive particles are added (Deng et al., 2006). They are active materials, also known as smart materials, that are able to change their mechanical properties while reacting to a magnetic field, for example, increase in stiffness and controllable damping (Dargahi et al., 2019). These changes in dynamic modulus, known as magnetorheological effect (MR effect), are almost instantaneous and completely reversible, and depend on the strength of the applied magnetic field (Nam et al., 2020). This unique property has made the MREs an interesting candidate for engineering applications where an active control of stiffness is desired, such as vibration isolators, adaptive tuned vibration absorbers, sensing devices, and base isolators (Li et al., 2014).
A significant effort has been made to identify the behavior of these materials to create devices for engineering applications. Numerous investigations have studied the properties of MREs in shear, compression, and torsion modes. Lejon and Kari (2009) studied the preload, frequency, strain amplitude, and magnetic field dependence of MREs in shear mode. Furthermore, the temperature dependency of MREs has also been analyzed (Lejon et al., 2021). Moreover, Blom and Kari (2012) analyzed the stiffness dependencies of MREs in the torsion mode. Erenchun et al. (2022a) experimentally characterized MREs in the compression mode with and without lubrication and revealed substantial differences that must be considered when developing devices. These materials can be divided into isotropic and anisotropic depending on the particle arrangement, the later being obtained with the application of a magnetic field during the fabrication process (Samal et al., 2018). Investigations on particle distributions have shown that greater MR effect is obtained with the anisotropic configuration (Nam et al., 2020). Furthermore, the influence of particle chain-magnetic field spatial location on the mechanical performance of MREs has also been studied (Wang et al., 2021). In addition, the influence of the particle concentration on the MR effect was analyzed by Schubert and Harrison (2015) concluding that a higher iron content leads to a larger increase in the stiffness. Finally, investigations on material improvement with carbon black (Alberdi-Muniain et al., 2012b; Burgaz and Goksuzoglu, 2020), plasticizers (Lokander and Stenberg, 2003), and other additives (Dong et al., 2020; Lee et al., 2018) have been carried out.
Apart from the characterization of MREs, mathematical modeling is also in extensively progress. The elastomeric materials exhibit elastic, viscoelastic, and strain dependent dynamic behavior that can be represented in several ways. Some authors make use of a four-parameter constitutive model composed of a spring and dashpots to represent the MREs (Agirre-Olabide et al., 2018; Li et al., 2010; Nam et al., 2020). Blom and Kari (2011) described the magnetic field dependency by introducing stiffness and friction parameters as a function of the magnetization. Furthermore, Wang and Kari (2019a) substituted the friction model by a bounding surface model to represent the amplitude dependency of MR rubbers. Other constitutive models have also been developed, like the combined Ramberg–Osgood with Maxwell by Eem et al. (2012), the Kelvin–Voigt viscoelastic model by Norouzi et al. (2016), the fractional Poynting–Thomson model by Nadzharyan et al. (2016), the Bouc–Wen model with springs and dashpots by Yang et al. (2013), and the Prandtl–Ishilinkii model by Dargahi et al. (2019).
Regarding applications that employ MREs, devices such as vibration absorbers with frequency shifting property working in the shear mode (Deng and Gong, 2007, 2008; Deng et al., 2006), compression mode (Komatsuzaki and Iwata, 2015; Sun et al., 2014, 2015a), and in the mixed mode (Komatsuzaki et al., 2016; Ni et al., 2009; Yang et al., 2015), along with vibration isolators (Du et al., 2011; Jalali et al., 2020; Liao et al., 2012; Opie and Yim, 2011; Xu et al., 2018) are found in the literature. These devices need the integration of control systems to obtain the desired vibration attenuation. Several studies have measured the energy flow throughout the system to control the vibration transmission (Alberdi-Muniain et al., 2012a, 2013a; Blom and Kari, 2008). Others, like Wang and Kari (2019b) and Fu et al. (2016), implemented fuzzy logic algorithms to control the vibration isolation.
In this work, a vibration isolation system based on the MREs for the application of an active control solution in elevator is developed. In section 2, MR isolators are fabricated and tested in static and dynamic compression tests with magnetic field. Experimental results are then employed to fit a constitutive model that accounts for the viscoelasticity of MREs along with the magnetic field dependency. In section 3, the elevator system is modeled including the drive machine, the frame and guide rails, and the isolators in between. Acceleration measurements taken in operating conditions are employed to account for the dynamic excitation of the rope and the cabin of the elevator system. This model is employed to calculate the frequency and time domain response of the system under different magnetic fields applied to the MR isolators. Furthermore, in section 4, the implementation of different control strategies for the vibration attenuation is evaluated. Employing the coincidence frequency control strategy, the energy transmitted to the structure is reduced around 70% in the first resonance peaks. However, this strategy is limited to harmonic excitations. In order to reduce the vibration of the target structure, the fuzzy logic control algorithm is implemented to reduce the vibration transmission in real conditions and different control configurations are compared. The application of the active control in just one isolator is showed to offer best results while reducing the cost of the implementation. Moreover, splitting the elevator trip in the start, constant velocity and the brake zones enables to optimize the needed magnetic field strength, thus reducing the energy cost. The results reveal a reduction in the vertical displacement and rotation of the motor by around 25% and 40%, respectively.
2. Characterization and modeling of MR isolators
In order to develop an active control solution with magnetorheological elastomers, the behavior of these material must be assessed. In this section, the MR isolators are fabricated and characterized in static and dynamic compression tests. An electromagnet (Du et al., 2011; Jalali et al., 2020; Opie and Yim, 2011; Rustighi et al., 2022; Sun et al., 2015b) is going to be used to apply the magnetic field during measurements to characterize the magnetosensitive property following the procedure presented by Erenchun et al. (2022a) to provide sufficient information to model an active control system.
2.1. Fabrication and testing of MR isolator
The MR isolators are fabricated with silicone rubber as the matrix material supplied by SLM Solutions. The carbonyl iron particles (CIP) with a spherical shape of 5–10 µm in diameter (>99%) are supplied by Umicore. The fabrication procedure and characterization of isotropic and anisotropic MREs with 10%, 20%, 30%, and 40% iron in compression mode can be found in Erenchun et al. (2022a). For the design of the active control solution, the MRE with 40% CIP volume fraction is selected.
For the experimental tests performed in this work, 40% isotropic MRE samples with dimensions 50 × 50 × 6 mm3 with a hole of diameter 36 mm are fabricated (Figure 2(a)). The dimensions of these MR isolators are selected to meet the desired mechanical properties (Erenchun et al., 2022a) and the load criteria of isolators employed in the elevator system. Moreover, the hole of the sample aids to assemble the isolator under the drive machine.
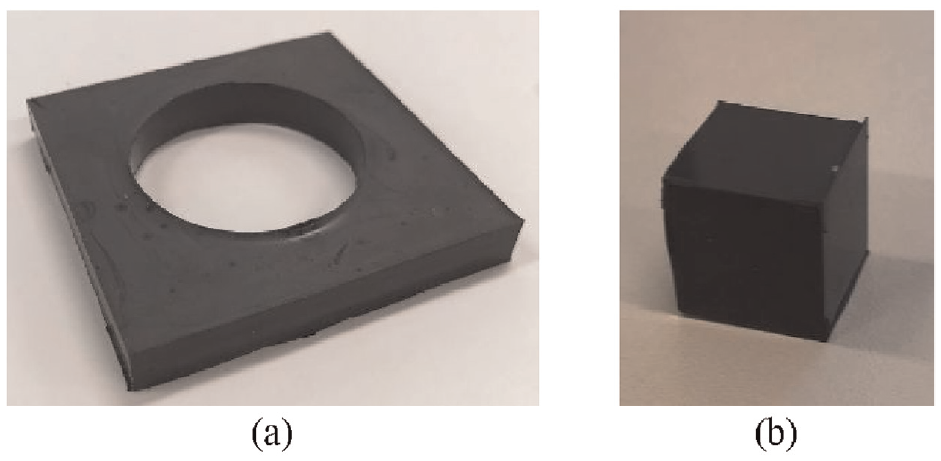
Fabricated MREs: (a) MR isolator and (b) sample for magnetic permeability analysis.
The compression characterization of the MR isolators is carried out in an INSTRON MHF 25 uniaxial testing machine (Figure 3(a)). This machine has a compression rod that is controlled in displacement mode and the resultant force is measured by a load cell. An electromagnet capable of applying 1 T was designed (Figure 3(b)) to characterize the mechanical behavior of MREs while inducing magnetic field. More information about the design and specifications of the electromagnet is in Erenchun et al. (2022b).
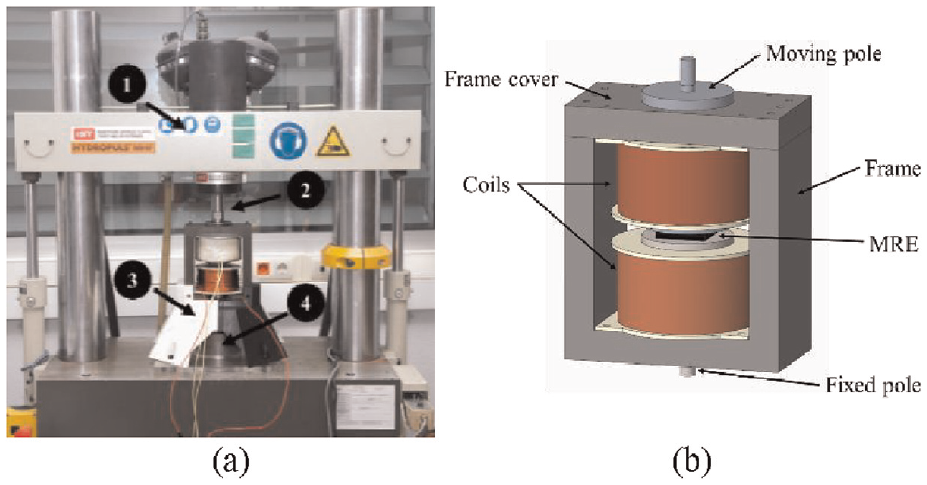
(a) Test setup for compression tests: 1 – bride, 2 – actuator, 3 – supports, 4 – force sensor and (b) electromagnet design.
The behavior of the MR isolators is measured both in static and dynamic tests. Preconditioning is performed prior to each test to avoid Mullins effect (Schubert and Harrison, 2015). To conduct the static tests, the samples are compressed up to 20% strain at a speed of 10 mm/min. Three preconditioning cycles are completed, followed by a fourth cycle for data collection. The stress–strain curves are determined using the force and displacement signals. The linear region of the stress–strain curves is used to determine the static modulus of MREs (up to 10% strain according to the ISO 7743 (ISO, 2011)).
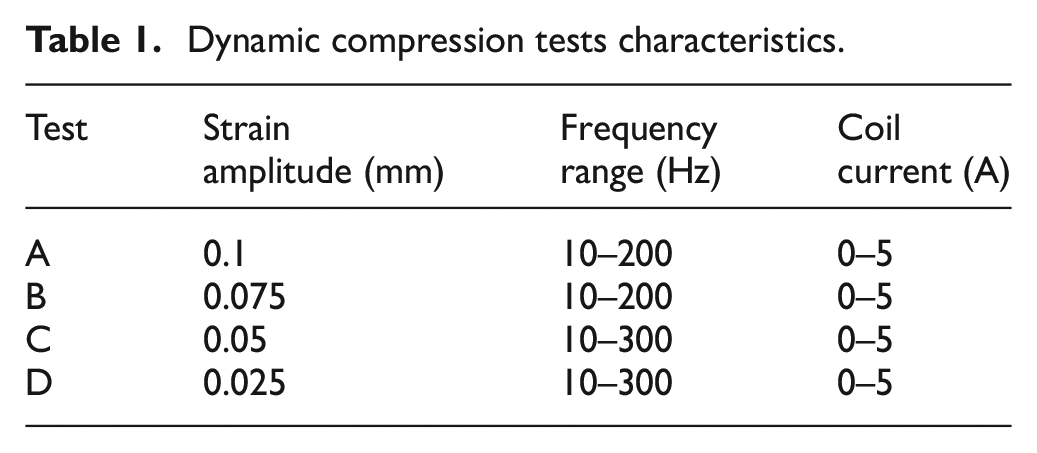
The current applied to the electromagnet is increased in 1 A increments from 0 to 5 A. For the dynamic experiments, the samples are subjected to harmonic loading with strain amplitude and frequency ranges listed in Table 1. Tests are conducted in no-lubrication conditions with 10% and 20% prestrain, which are the common range of operation of bonded isolators working in compression (Davim, 2011). In dynamic measurements the force and displacement signals are recorded. Then, the Fast Fourier Transform (Blom and Kari, 2011) is applied to these signals to obtain a dynamic complex stiffness (k*), which is calculated as the ratio between the force and displacement. The dynamic complex stiffness can be expressed as

where k′ is the storage modulus and k is the loss modulus. They represent the ability of MREs to store and dissipate deformation energy, respectively (Wang et al., 2021). The modulus (|k*|) and loss factor (δ), which is obtained from the ratio of the loss and storage modulus, are used to represent the stiffness and damping properties of MREs, respectively.
Dynamic compression tests characteristics.
The stress–strain curves for the MR isolator at different values of input current is shown in Figure 4(a). The stiffening effect of the MRE is clearly visible as the measured force increases and the magnetic field gets stronger. The MR isolator has a zero-field static modulus of 8.6 MPa and an increase of almost 1 MPa (12%) is observed at the maximum input current (Figure 4(b)). The measured increase in stiffness is in agreement with previous studies using silicone based MRE (Erenchun et al., 2022a; Nam et al., 2020). Moreover, a saturation point is observed at 4 A of the electric current. Consequently, the saturation magnetic field of the MR isolator is found at 600 mT (Erenchun et al., 2022b).
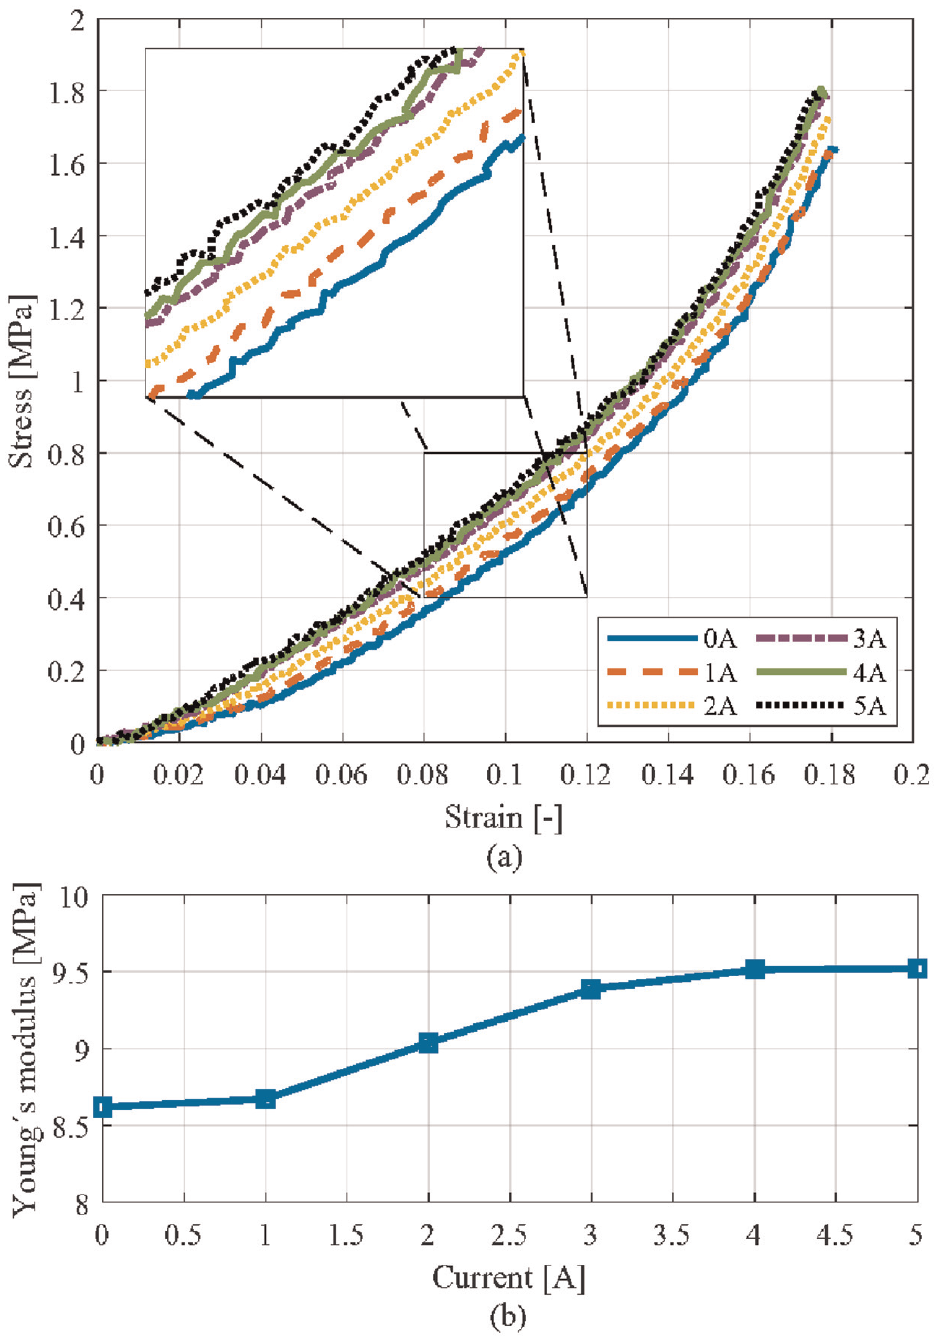
Static characterization of MR isolator: (a) stress-strain curves for different input currents and (b) Young’s modulus versus input current.
In Figure 5 the results of the dynamic experiments are shown for 10% and 20% of prestrain. For a better visualization of the results, the selected values for input currents of 0, 3, and 5 A are plotted. If tests are compared, a progressive difference in dynamic modulus is observed, which is more noticeable between Figure 5(c) and (d).
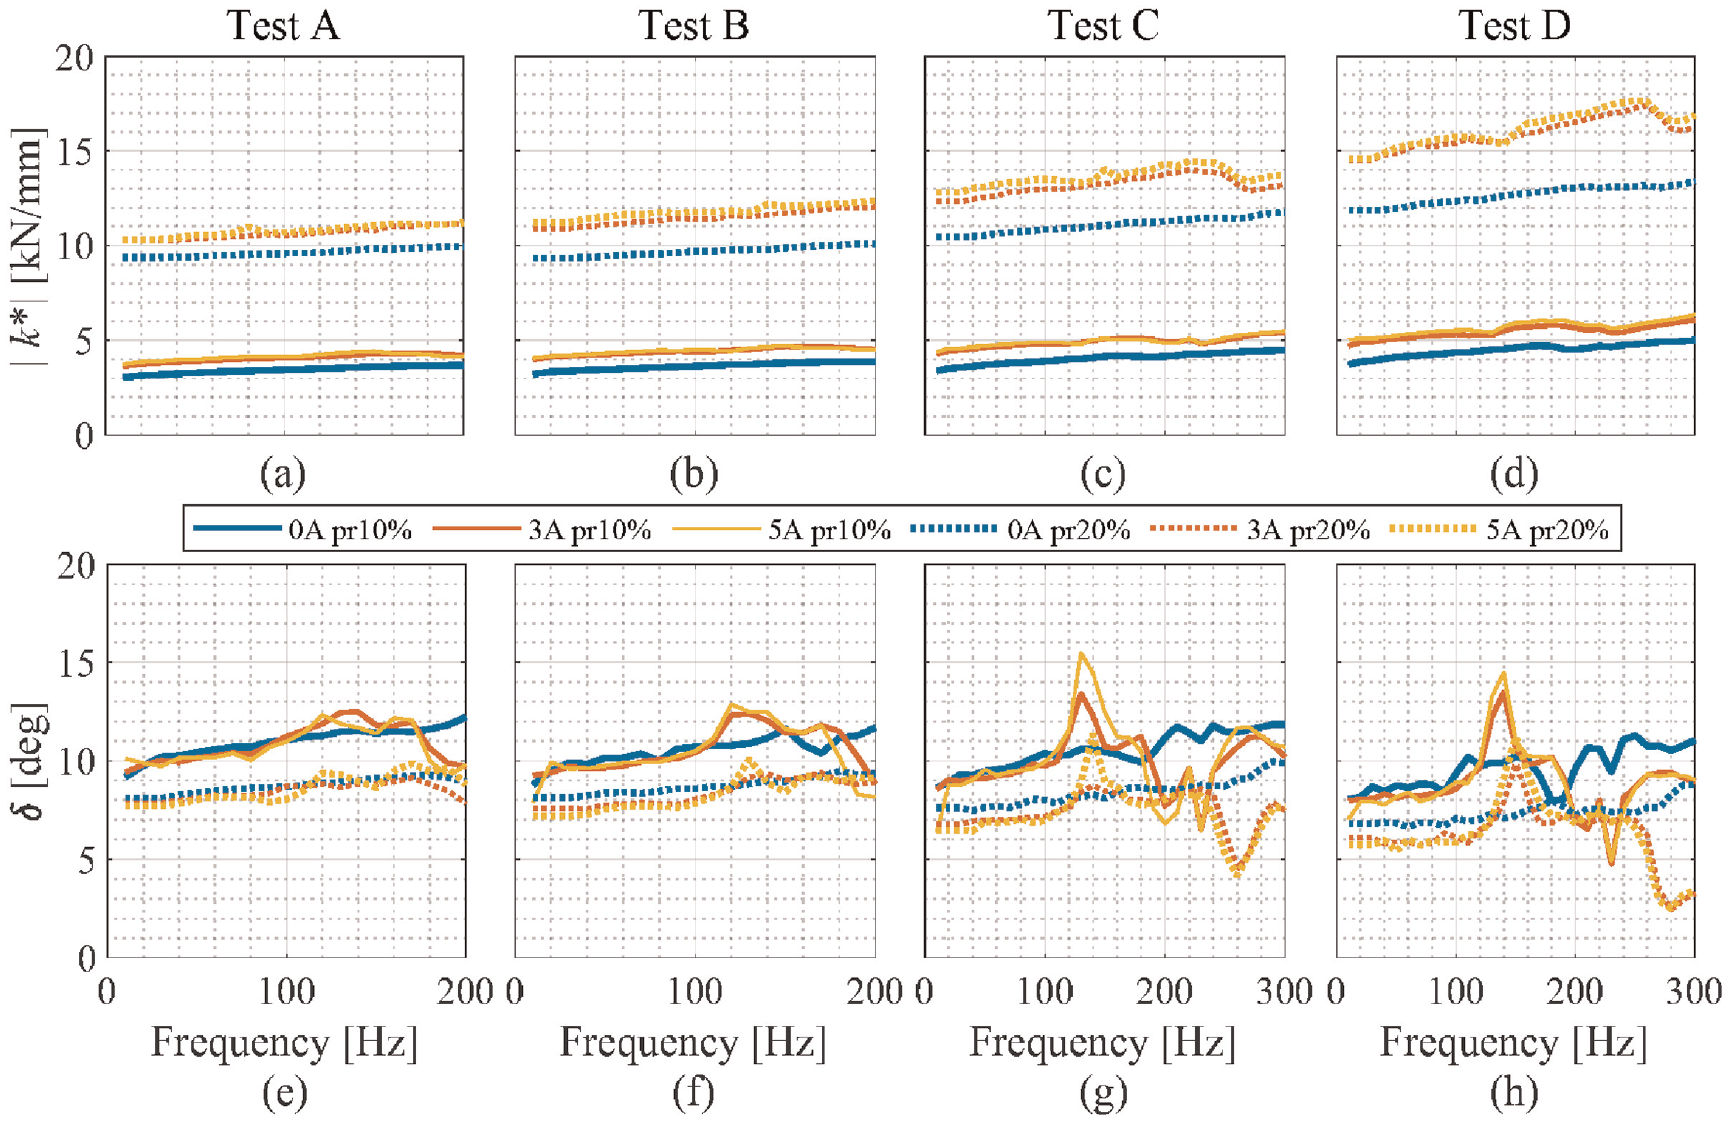
Clearly, the dynamic stiffness increases with frequency. Moreover, the dynamic modulus shows an increasing trend as the strain amplitude gets smaller, which is a phenomenon known as the Fletcher–Gent effect. Consequently, the dynamic tests revealed the frequency dependency and the amplitude dependency of the dynamic modulus of the MR isolator. In addition, the MR effect is clearly visible, as the dynamic stiffness increases with the increased applied electric current. It is observed that this increase in the dynamic modulus is larger at 20% prestrain than at 10% prestrain (Erenchun et al., 2022a). Furthermore, saturation is observed at high values of input current as the modulus shows almost no additional MR effect above 3 A.
Regarding the phase angle, differences between the measured values at 10% and 20% prestrain are noticed. However, magnetic field does not seem to effect the phase angle as the values stay almost constant. The phase angle shows a weak linear relation with frequency, common of structural damping (Erenchun et al., 2022a). Moreover, it is observed that the values of the phase angle do not vary significantly with the strain amplitude.
In order to simulate the mechanical behavior of MRE and to predict the vibration control effect, in the next section, a model of the MRE isolator that accounts for the observed frequency, strain amplitude, and magnetic field dependencies is presented.
2.2. Non-linear MR isolator model
Experimental results shows that a frequency, magnetic, and amplitude dependence of MRE is exhibited. In order to replicate the dynamic behavior of MREs accurately, the constitutive model shown in Figure 7(c) is utilized. This model accounts for the dependency of viscoelastic materials on frequency and strain amplitude (Wang and Kari, 2019a). Model parameters vary with the applied magnetic field

where

where
where
where
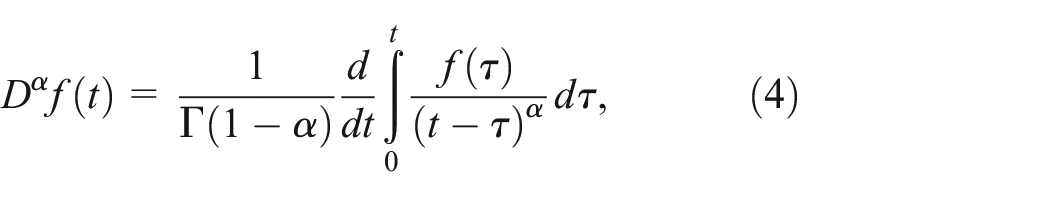
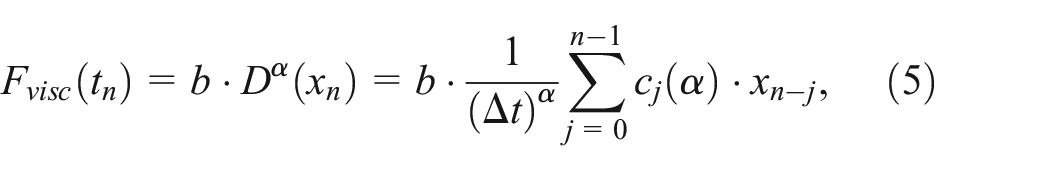
The amplitude dependence of the rubber materials is taken into account with a friction model. In this work, Berg’s friction model (Blom and Kari, 2011) is employed, as it enables a very good fitting to measurements with few parameters, which defines the friction force as
where
In order to account for the MR effect of MREs, the sub-models are modified based on the experimental observations of Lejon and Kari (2013). The amplitude dependency seems to be correlated with the magnetic field, which suggests that the parameters of the friction model should account for magnetic sensitivity. However, the frequency dependency is seen to be constant between zero and saturation magnetic field, meaning that the parameters of the viscoelastic model should not include magnetic sensitivity. Lastly, as it has been observed, the loss factor (or phase angle) does not change with the magnetic field, thus the elastic modulus should include magnetic sensitivity in order to balance the changing of the parameters of the friction model (Wang and Kari, 2019a). Consequently, the magnetic sensitivity is included in the parameters
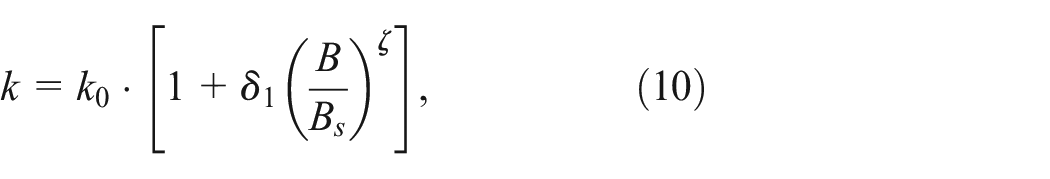
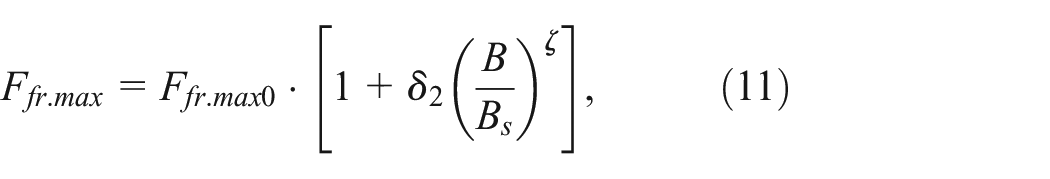
and
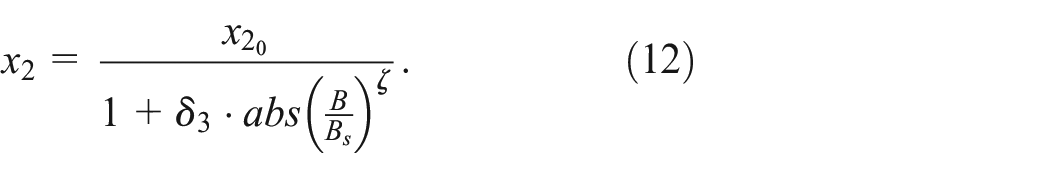
The parameters
2.3. Model parameter fitting
The experimental results obtained from the static and dynamic tests are employed to obtain the parameters of the constitutive model. A nonlinear least-squares fit method is implemented, using the function “lsqnonlin” from MATLAB (The MathWorks Inc, 2022). The objective function is defined according to Wang and Kari (2019a),
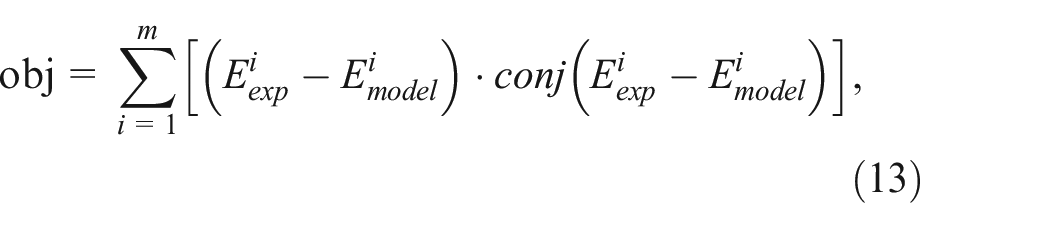
where
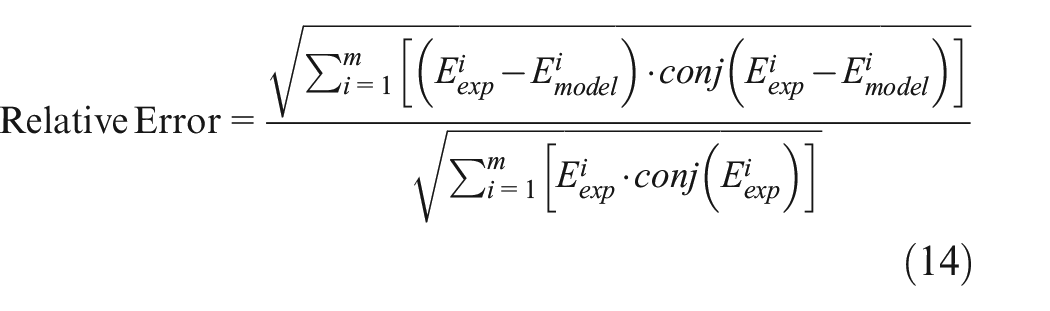
is measured. The elastic modulus is obtained from the static tests while parameters of the viscoelastic and friction sub-models are fitted from the dynamic experiments.
Lastly, the corresponding constants from the magnetosensitivity model are determined from the dynamic measurements with magnetic field. The adjusted model parameters are:
In Figure 6 measured and simulated dynamic stiffness and phase angle are plotted at 10% prestrain conditions. Table 2 includes the Pearson correlation coefficients,
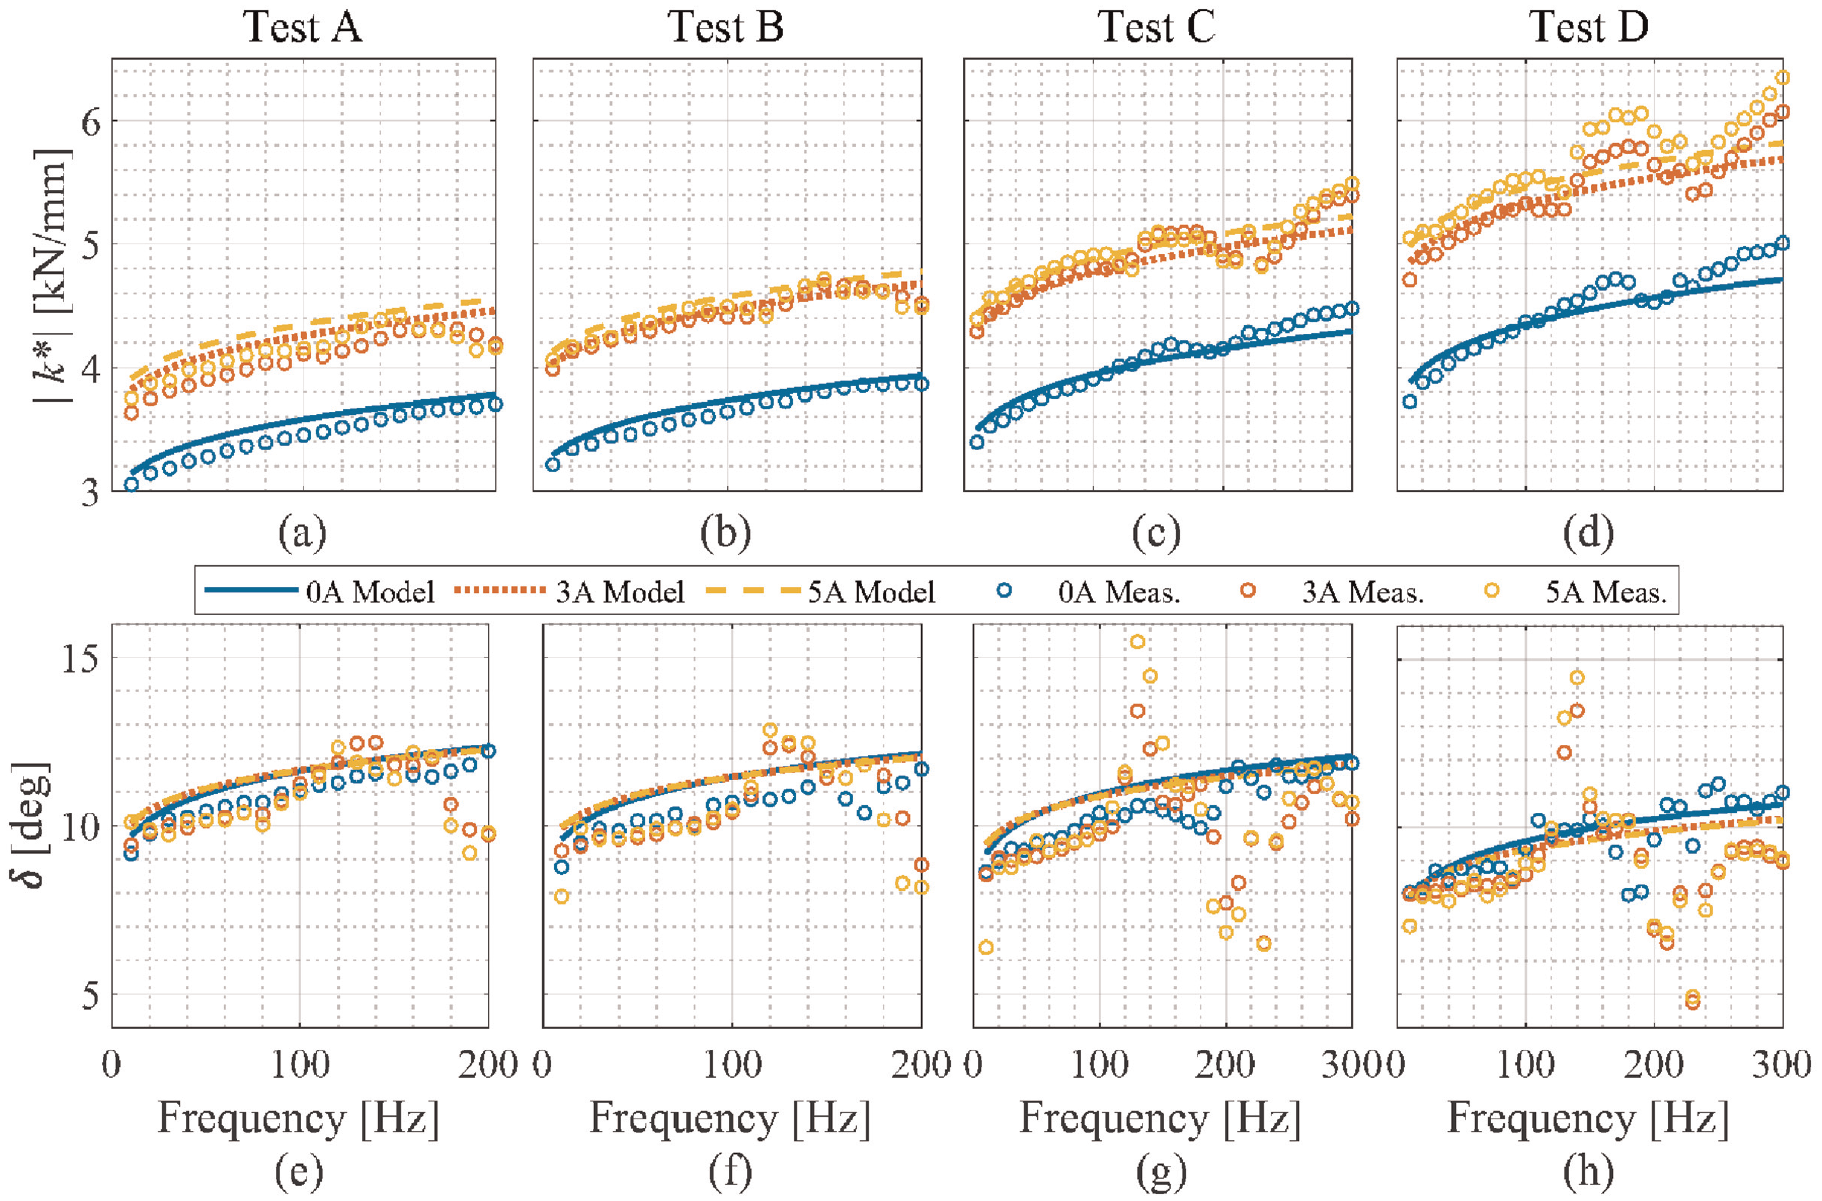
Squared correlation coefficient (
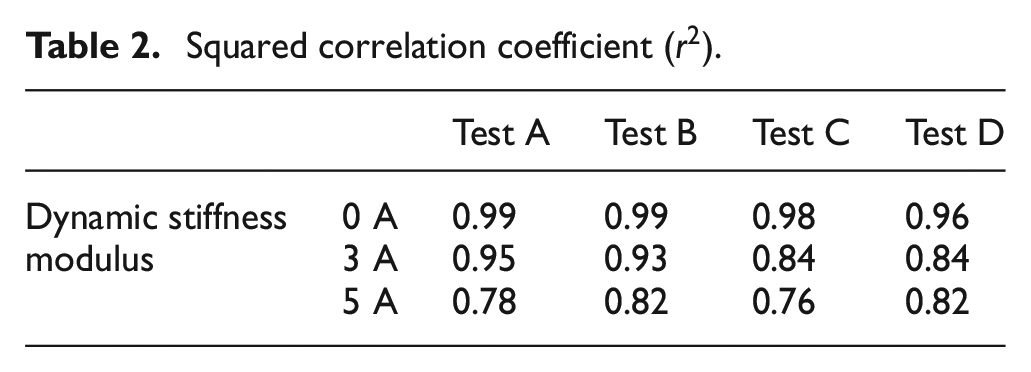
Therefore, the magnetosensitivity model is able to predict the increase in stiffness shown by the MR isolator. Consequently, the presented nonlinear MR isolator model is valid to simulate the behavior of these materials and is used in the global elevator system model.
3. Modeling of the elevator system
In this work the vibration transmission coming from the machine to the structure is assessed through a 2D model of the elevator system. This vibration transmission phenomenon is illustrated in Figure 7(a), together with the modeled parts of the elevator system. A nonlinear isolator model is employed to represent the MR isolators, which was described in previous section. Consequently, the elevator model is divided into three sub-models that are defined separately: the drive machine is modeled as a rigid solid, the MR isolators are described with the nonlinear model, and the frame-guide rails are modeled with finite element method (Przemieniecki, 1968). Once the three parts are defined, they are coupled to obtain a global model that can predict the vibration transmission from the drive machine to the frame.
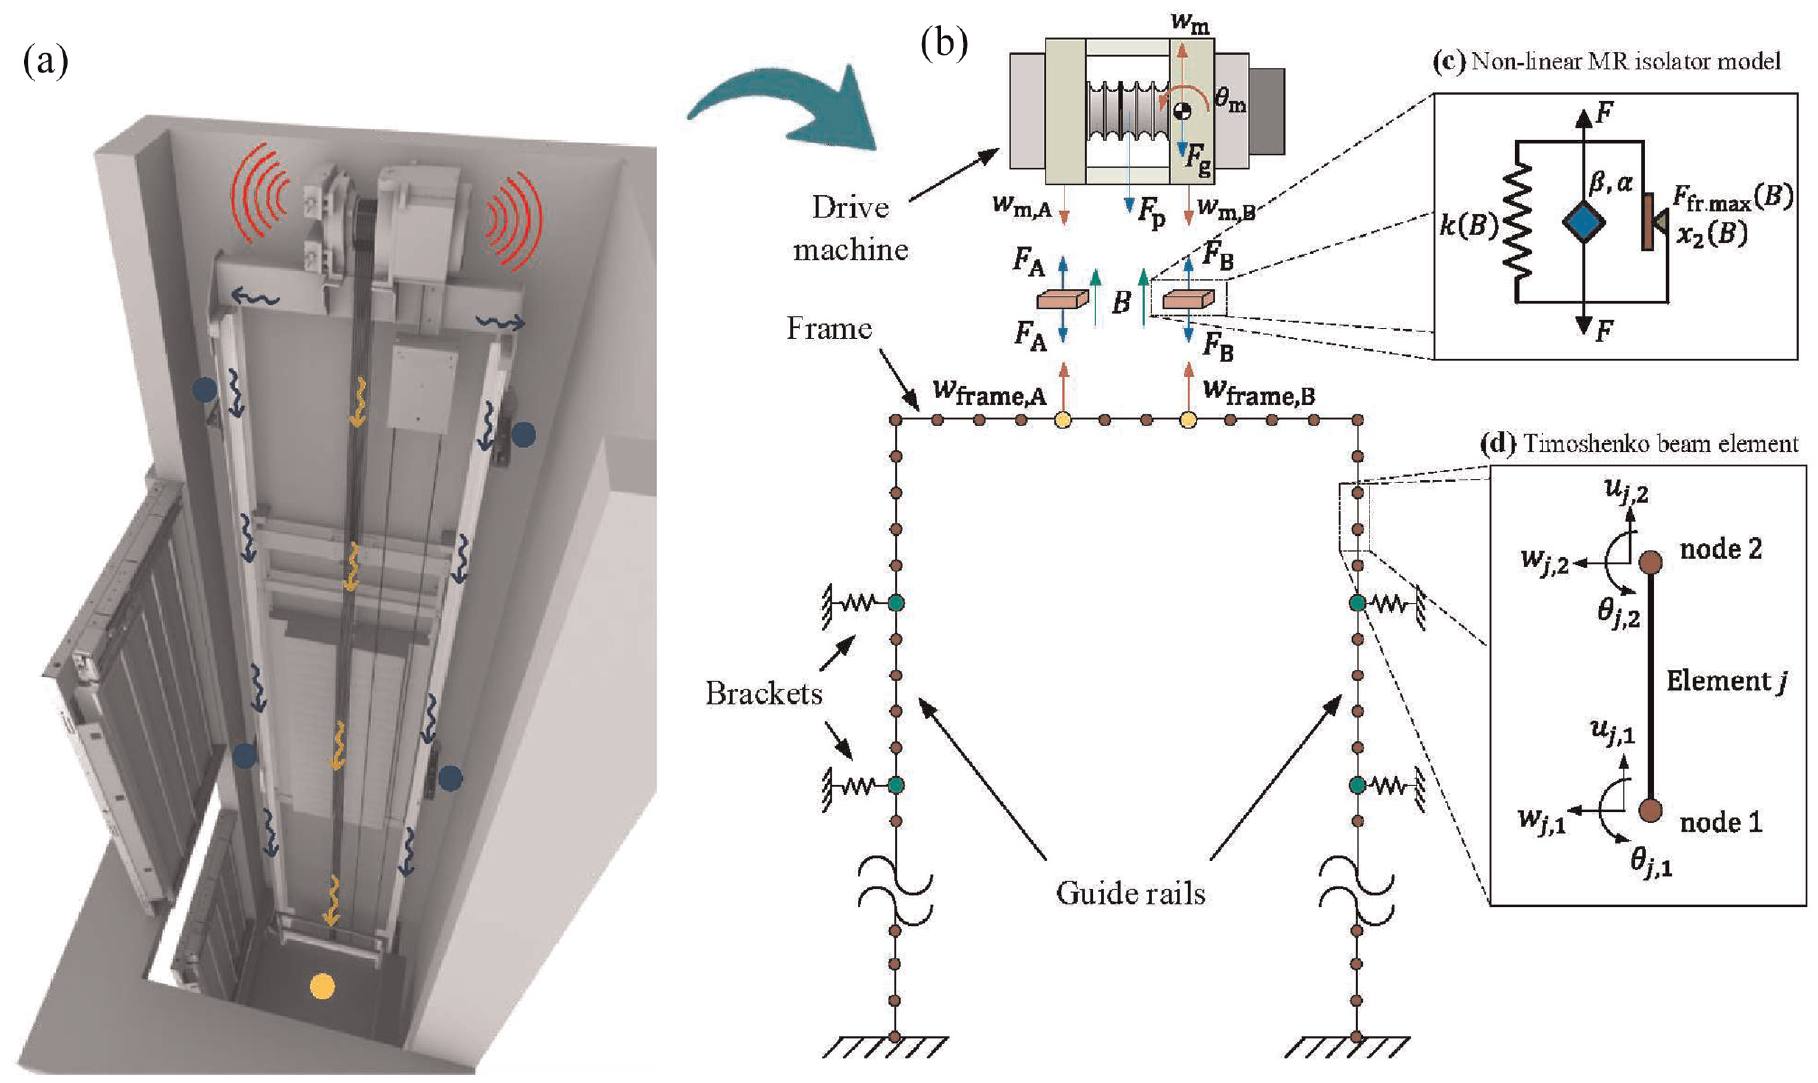
(a) Vibration transmission in elevator systems, (b) schematic representation of the model, (c) constitutive model of MR isolators, and (d) finite element of the frame.
3.1. Structural model
The drive machine is composed of the main body (electromechanical motor, brakes, etc.) with a pulley, where the load from the cabin
The equations for the rigid solid can be obtained applying the equations of force and momentum as

and

where

where
The frame is connected to the MR isolators at the points A and B. The vertical displacement of the frame at those points is

where
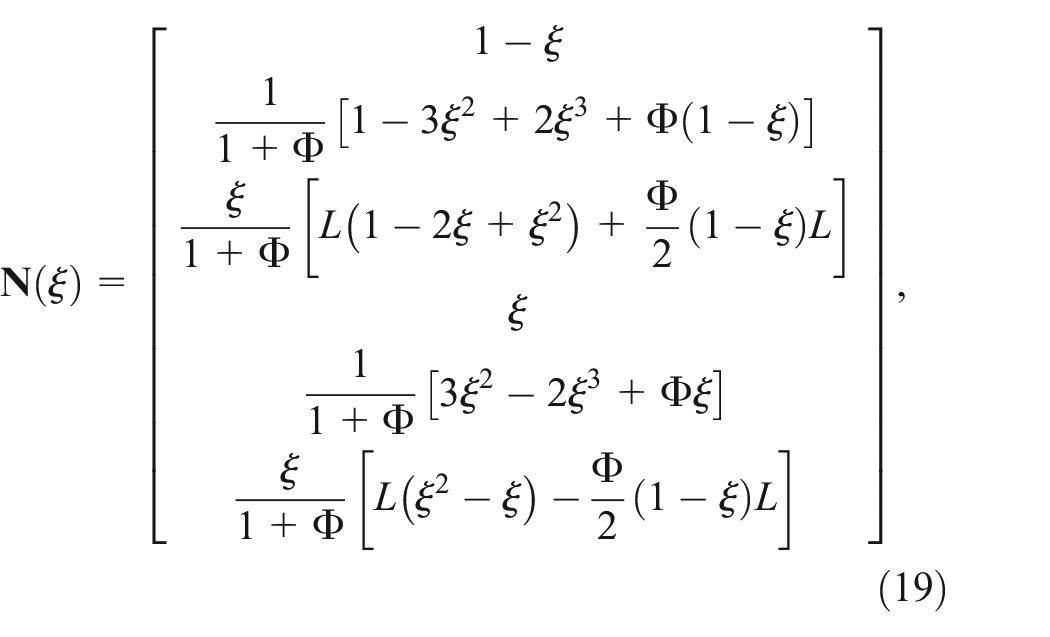
contains the interpolation functions (Friedman and Kosmatka, 1993) while
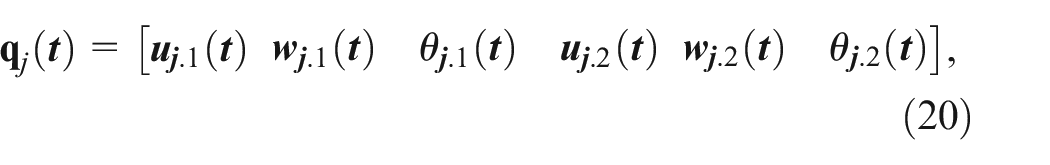
includes the nodal degrees of freedom, axial displacement
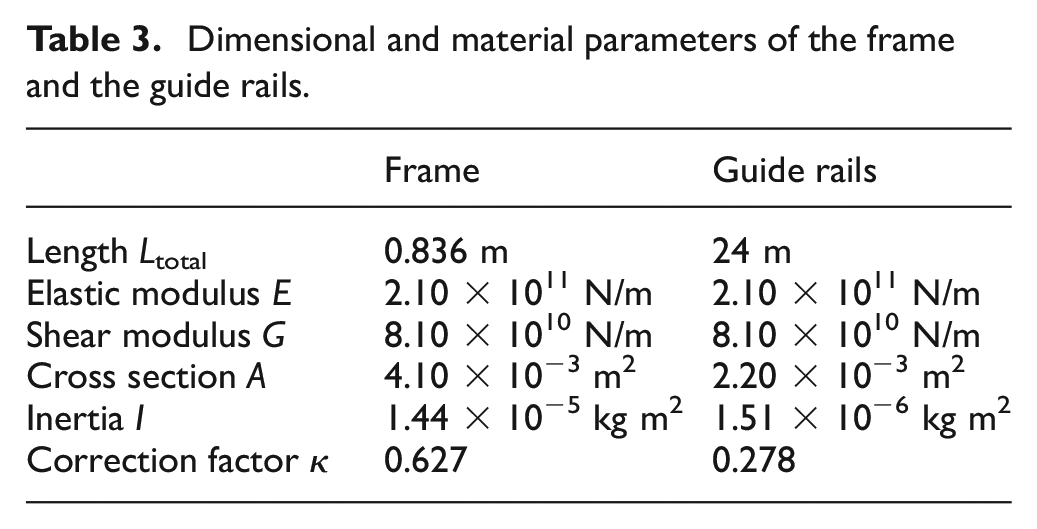
Dimensional and material parameters of the frame and the guide rails.
From the energy equilibrium equations, the elementary stiffness and mass matrices are obtained. For more details on the determination of these matrices, the reader is referred to Friedman and Kosmatka (1993). The guide rails are coupled to the frame at both ends of the frame. To model the energy dissipation through the frame and guide rails, proportional damping is introduced as
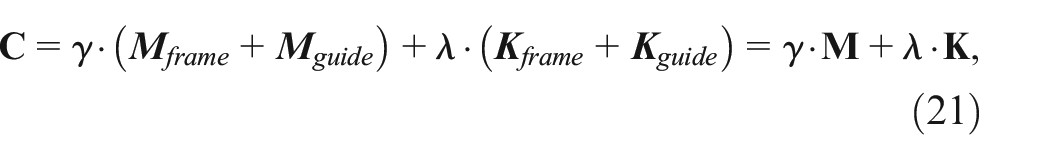
where the corresponding values are
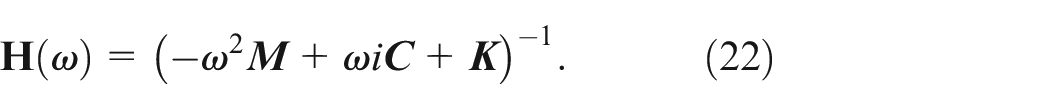
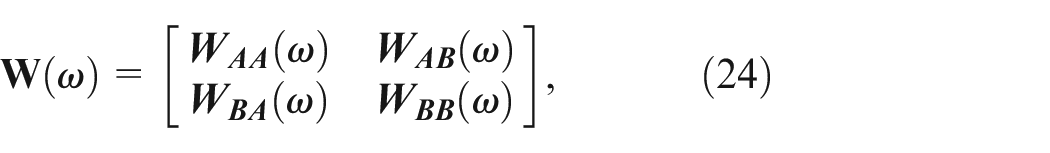
The cross-receptance between two arbitrary points i and j is given by
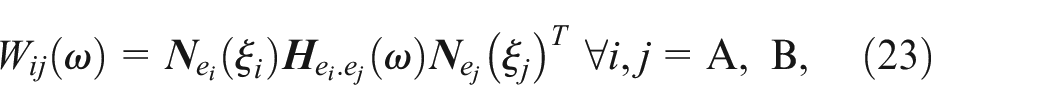
where
and inverse Fourier transform (Geradin and Rixen, 1994) is applied to obtain the impulse response functions

Finally, the vertical displacement at the points A and B of the frame is obtained from the convolution integral
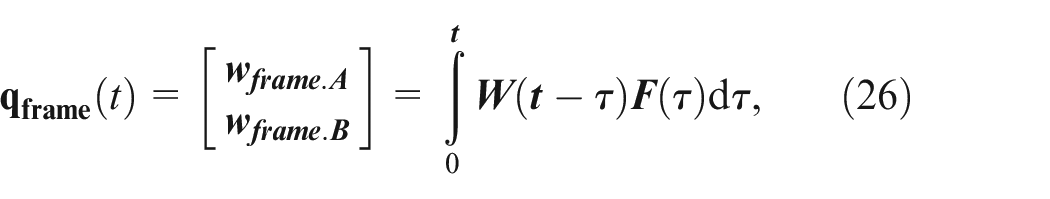
where
3.2. Coupled system of equations
The non-linear ordinary differential equation of the system to be solved is

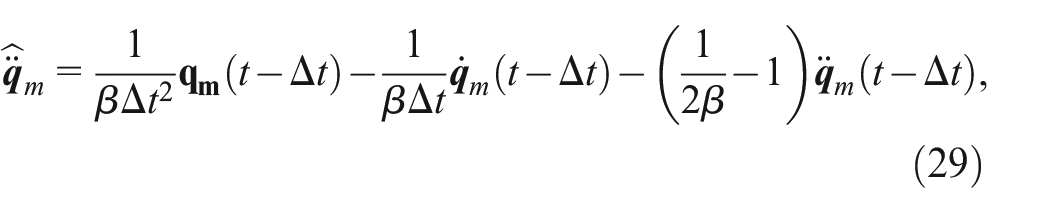
The Newmark-beta numerical integrator (Geradin and Rixen, 1994) is used to determine
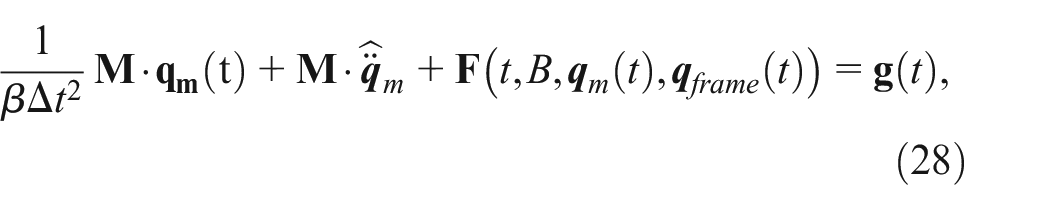
where
and
The non-linear differential equation becomes a non-linear algebraic equation with the general structure given by
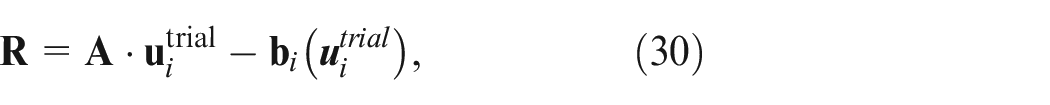
is calculated to verify the trial solution. If the residual is larger than the specified tolerance of 1 × 10⁻³, a correction to the trial solution is implemented as
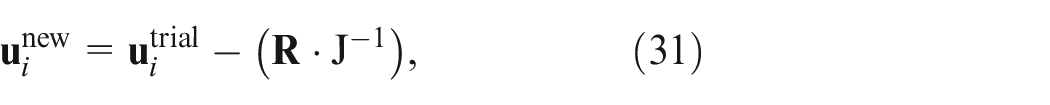
where
4. Numerical simulation
Next, numerical simulations are performed. The experimentally fitted material model parameters are employed in the general elevator model to estimate the behavior of the system with MR isolators. In addition, active vibration isolation requires the implementation of a control algorithm that modifies the characteristics of the MR isolator to reduce the displacement of the system. In this section, different control strategies for vibration attenuation are evaluated.
The behavior of the modeled elevator system with MR isolators is simulated under different conditions. Three levels of magnetic field are evaluated, corresponding to 0%, 50%, and 100% of magnetic field saturation. Unitary harmonic force is applied to the system in the drive machine with the frequency ranges from 10 to 500 Hz. The resulting magnitude of the displacement and rotation of the drive machine and the vertical displacements of points A and B of the frame in the frequency domain are shown in Figure 8. The first and second resonances correspond to the motor-isolator rigid modes while the third resonance to the structure. These resonance frequencies increase as the magnetization of the MR isolators is higher. Furthermore, the amplitude of the displacement and rotation of the motor decreases as the MR isolators get stiffer. However, this increase in the stiffness of the MR isolator leads to a higher displacement at the points A and B in the frame.
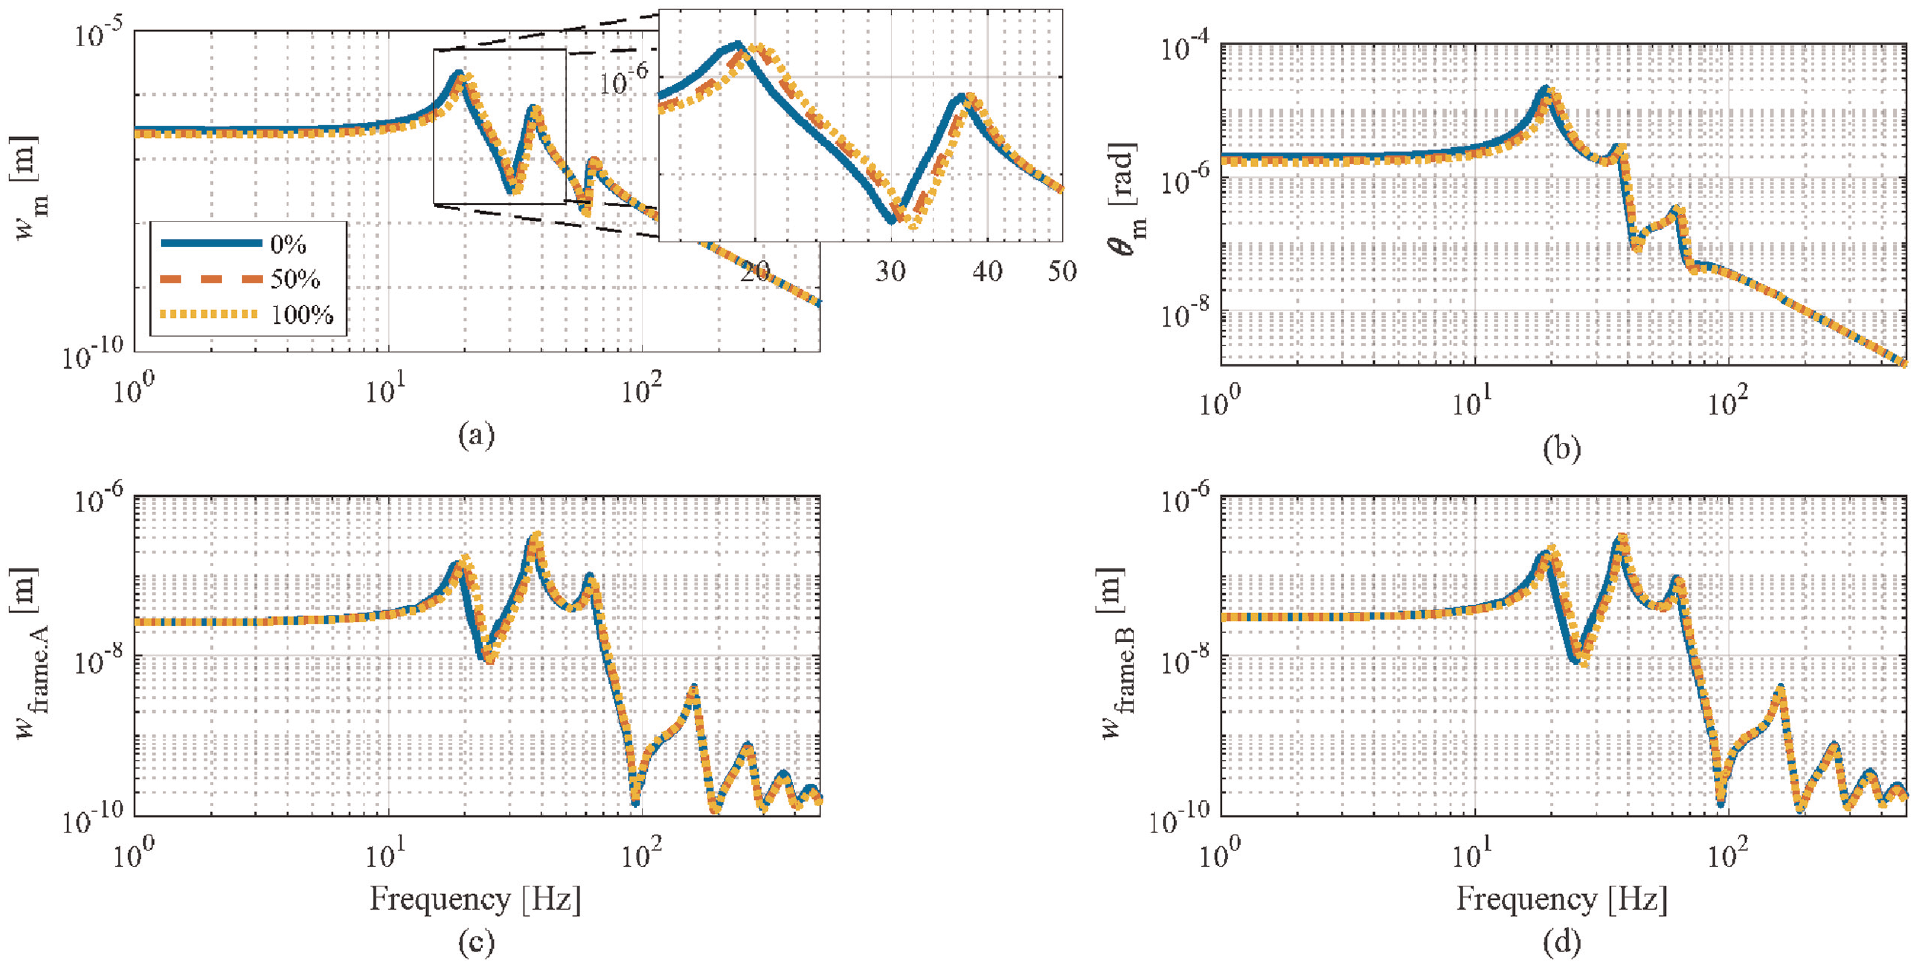
The magnitude of vertical displacement (a) and rotation (b) of the drive machine, and vertical displacement of point A (c) and point B (d) of the frame. Percentages refer to the applied magnetic field in relation to the saturation value,
The energy flow, which is the time-averaged product of force and velocity, is a good indicator of how effectively an isolator is performing in a system under vibration conditions (Kim et al., 2010). It evaluates the vibration isolation effect more accurately as compared to other indicators like force and displacement transmissibility (Wang and Kari, 2019b). Moreover, it provides a veridical measurement of the energy transmitted to a structure. Accordingly, the vibration transmission is reduced at an energy flow minimization (Alberdi-Muniain et al., 2013b). The procedure of calculation of the energy flow is described in Wang and Kari (2019b). The energy flow spectral density introduced and transmitted to the structure are represented in Figure 9(a) and (b), respectively. The peak values correspond to the resonance frequencies of the system. The difference between the input and output gives an indication of the energy that is being dissipated through the MR isolators.
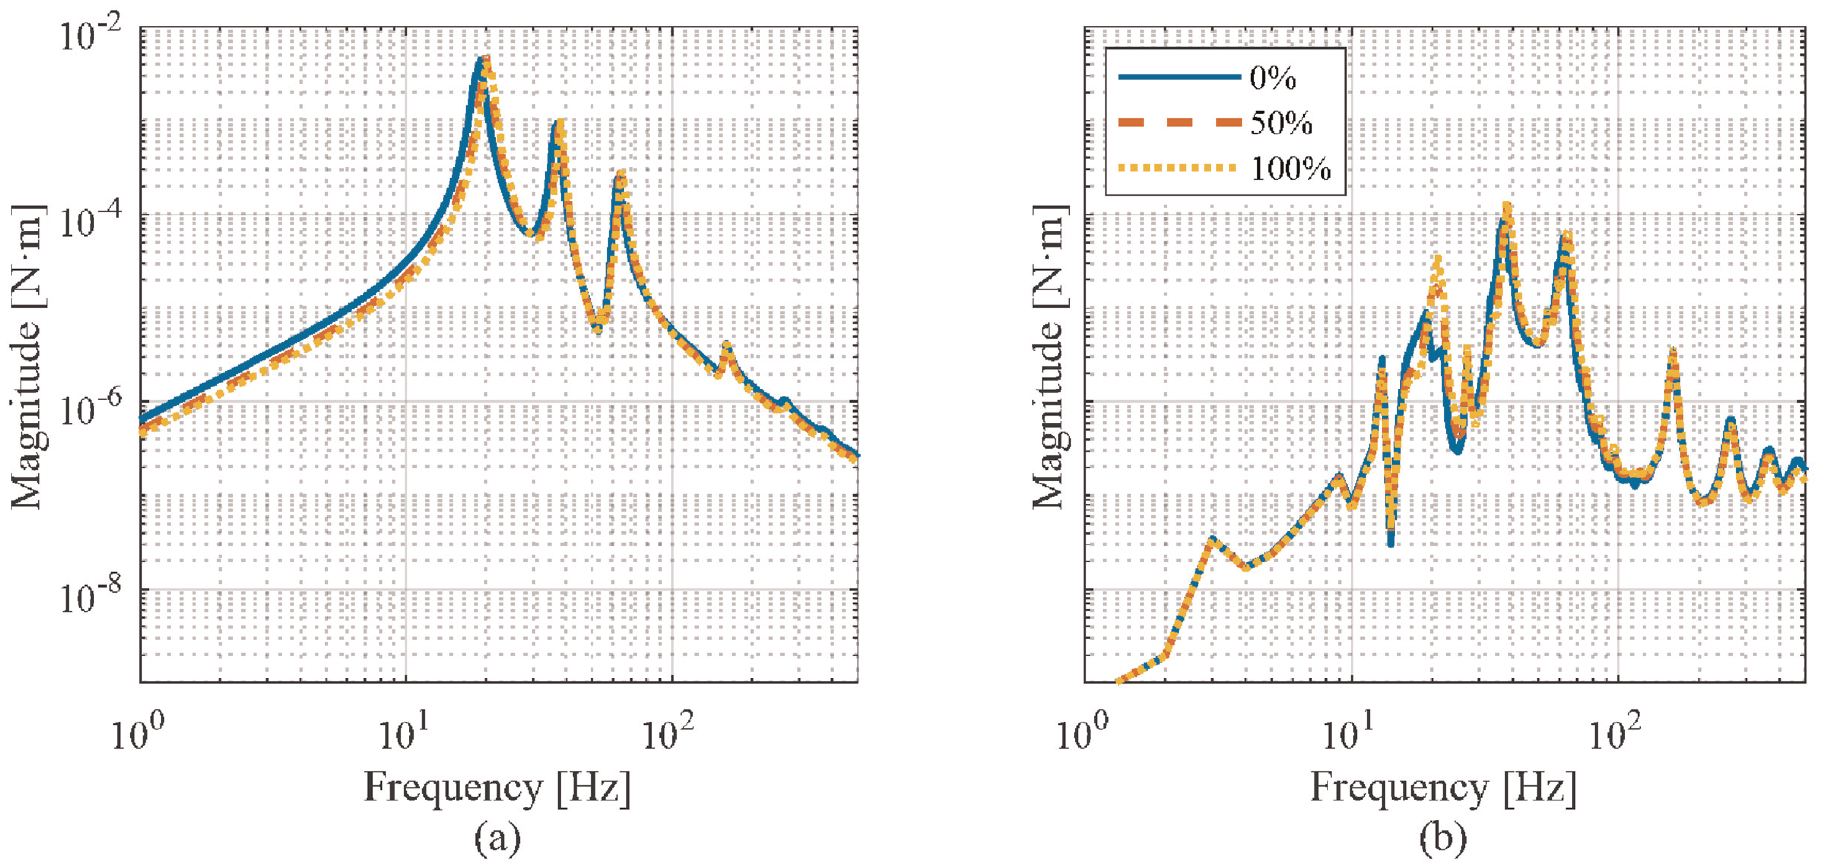
Energy flow spectral density input (a) and output (b) for different magnetic fields applied to the MR isolators. Percentages refer to the applied magnetic field in relation to the saturation value,
4.1. Coincidence frequency control strategy
Conducting the energy flow density analysis of the described model, the vibration isolation against harmonic force can be assessed. Evaluating the energy flow density to the frame, improved vibration dissipation can be achieved by applying a frequency-dependent magnetic field. This control strategy, named coincidence frequency, consists of applying the saturation magnetic field and zero magnetic field, depending on the measured excitation frequency.
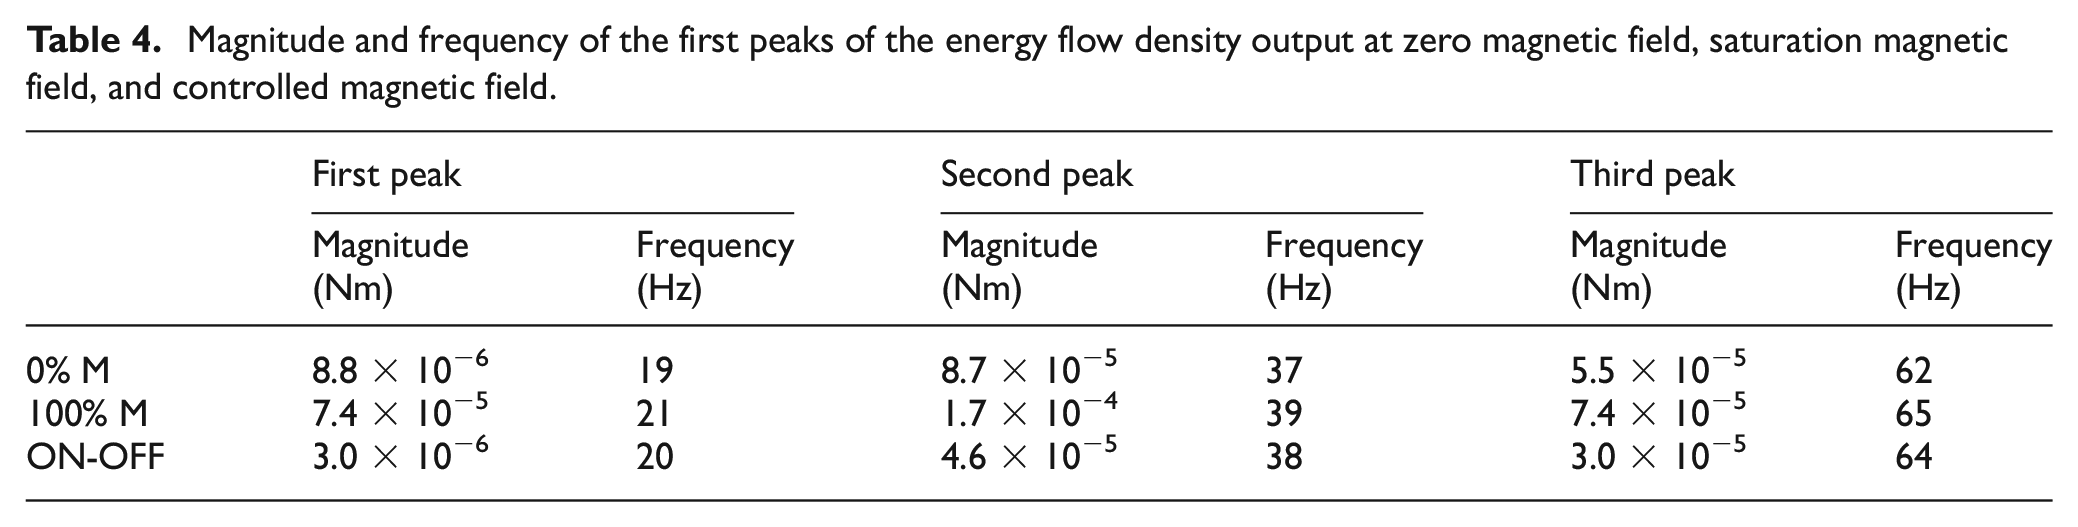
Based on the works carried out by Alberdi-Muniain et al. (2013b) and Wang and Kari (2019b), the coincidence frequency control strategy is implemented in the elevator model. By comparing the energy flow density output (Figure 9(b)) in zero-field and saturation field cases, different curves are observed with several coincidence frequencies. These coincidence frequencies are set as the threshold of the control strategy. By changing the applied magnetic field from zero to saturation, a minimum energy flow density output can be achieved. This controlled energy flow density and the corresponding control command are plotted in Figure 10(a) and (b), respectively. It can be observed that with the coincidence frequency control strategy a significant reduction of the energy flow density transmitted to the frame is obtained. In Table 4 the magnitude and frequency of the first peaks of the energy flow output at zero magnetic field, saturation magnetic field, and controlled magnetic field are listed. The increase of the stiffness in the saturation magnetic field leads to an increase in the transmission of energy to the frame compared to the zero-field case. However, if the magnetic field is controlled, the energy flow density is reduced at 65%, 48%, and 46% in the first three peaks respectively.
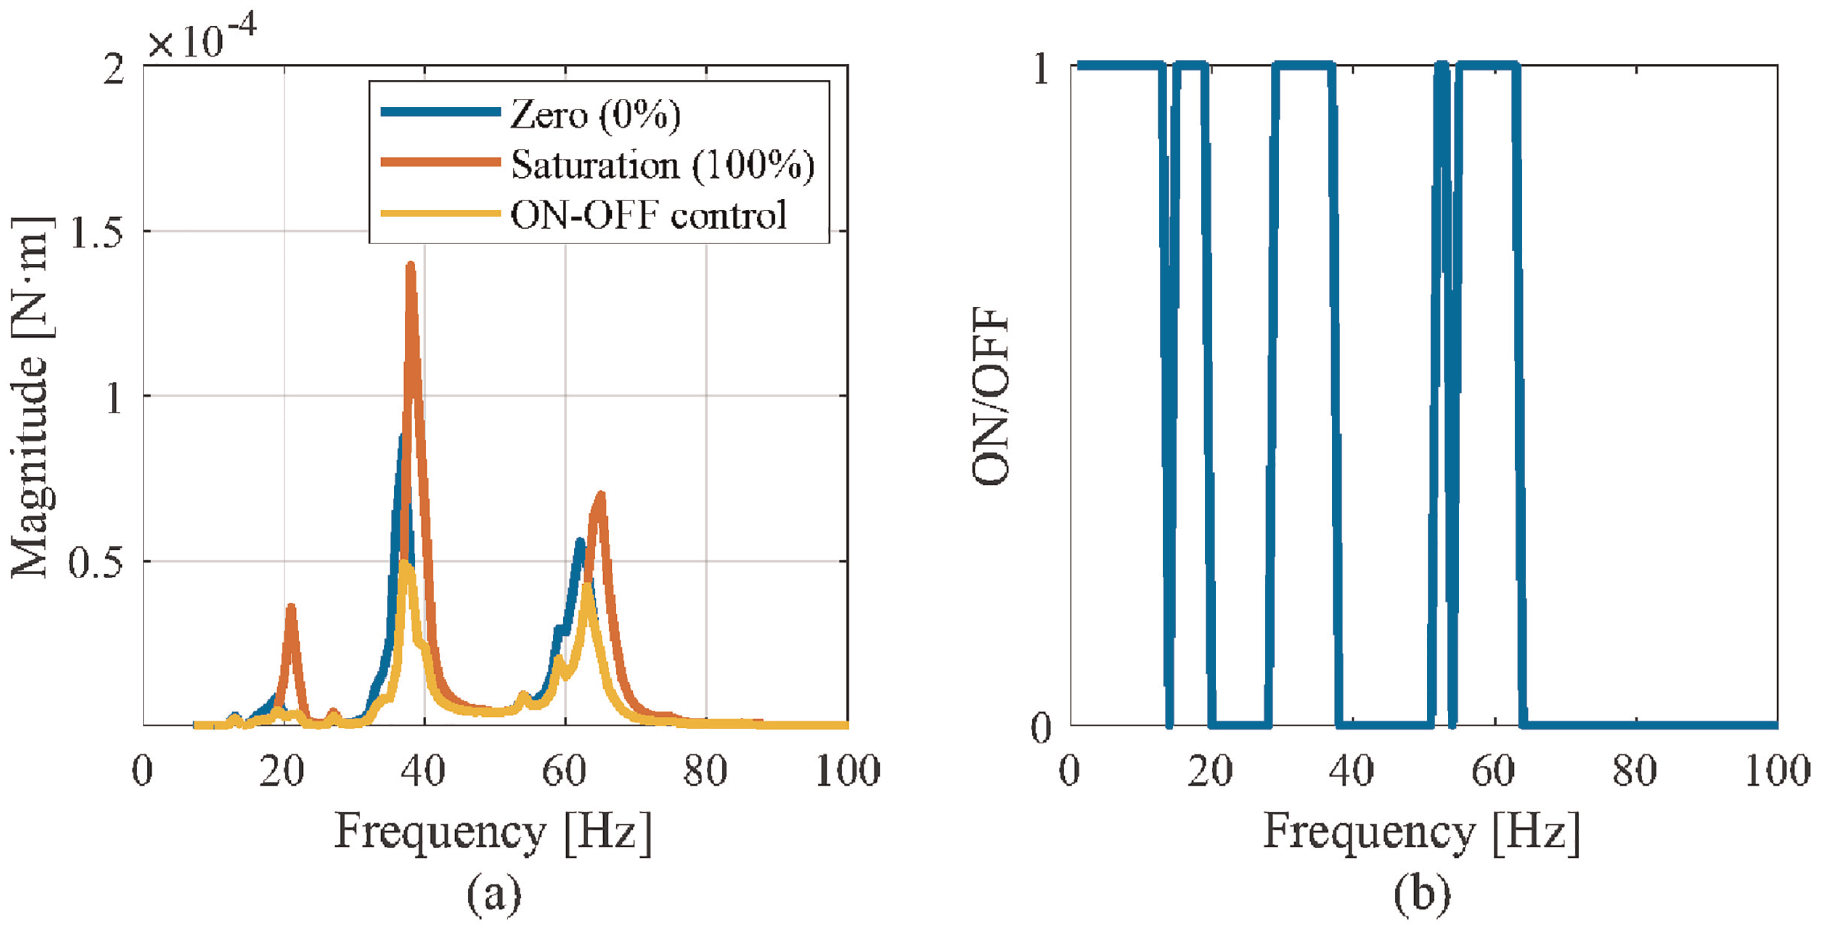
(a) Energy flow density output at zero magnetic field, saturation magnetic field, and controlled magnetic field and (b) control command.
Magnitude and frequency of the first peaks of the energy flow density output at zero magnetic field, saturation magnetic field, and controlled magnetic field.
Therefore, using the energy flow density analysis and the coincidence frequency technique, the vibration transmission is attenuated. However, this active control is only valid in harmonic excitation cases. For dynamic excitation of different nature, other control strategies should be implemented.
4.2. Fuzzy logic control algorithm definition
In this section, the implementation of a control strategy to reduce the vibration transmission of the elevator system under random excitation is studied. A fuzzy logical control algorithm is employed, as it enables addressing the nonlinear phenomena and uncertainties of the system (Wang and Kari, 2019b). The key feature of this control algorithm is that the output signal is discrete even if the input values are continuous, which reduces the time delay due to calculation. Therefore, the output signal of the algorithm controls the magnetic field application device in an ON–OFF way depending on the state of the system. As the isolators are working in compression mode, the control command should be dependent on the strain state of the MREs. The isolators, selected with an initial thickness of
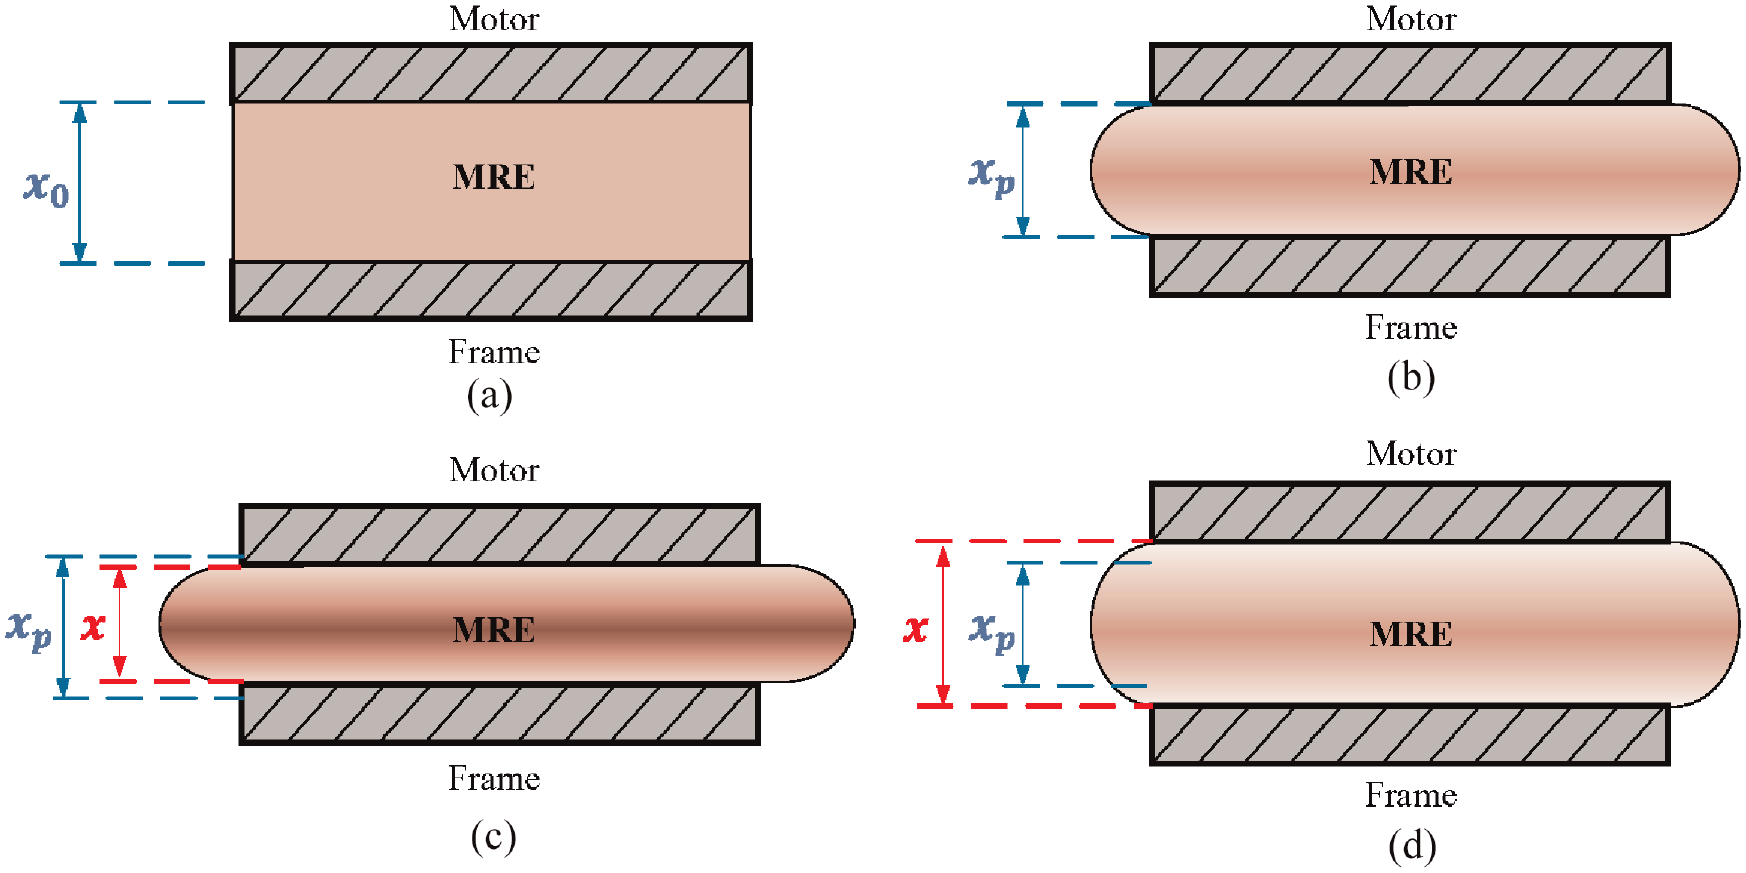
Strain state of the MR isolator: (a) initial state without compression, (b) precompressed state due to static loading, (c) dynamic compression state, and (d) dynamic tension state.
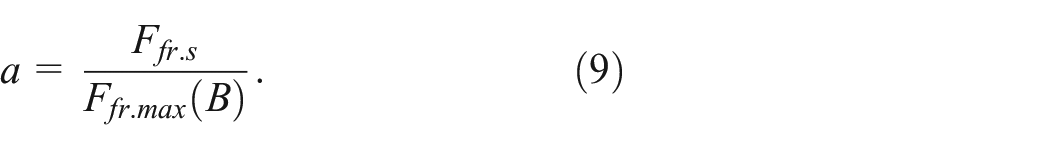
The MR isolators are deformed due to the static load of the motor and the cabin (Figure 11(b)), thus a static precompressed state

where

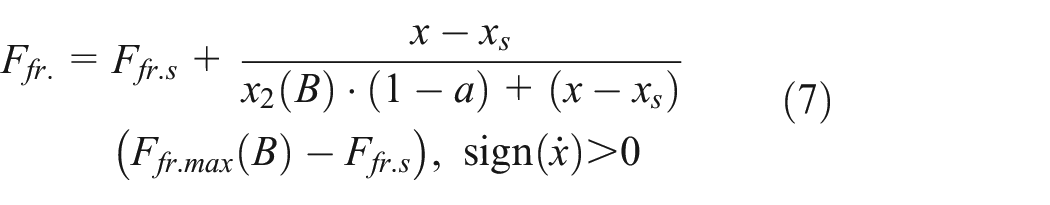
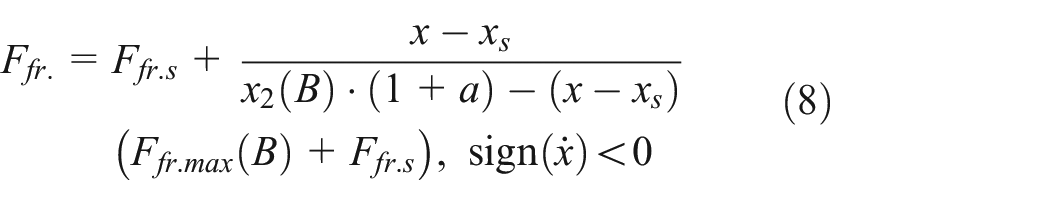
Depending on the strain state of the MR isolator four zones can be differentiated, as shown in Figure 12. The tension zones (
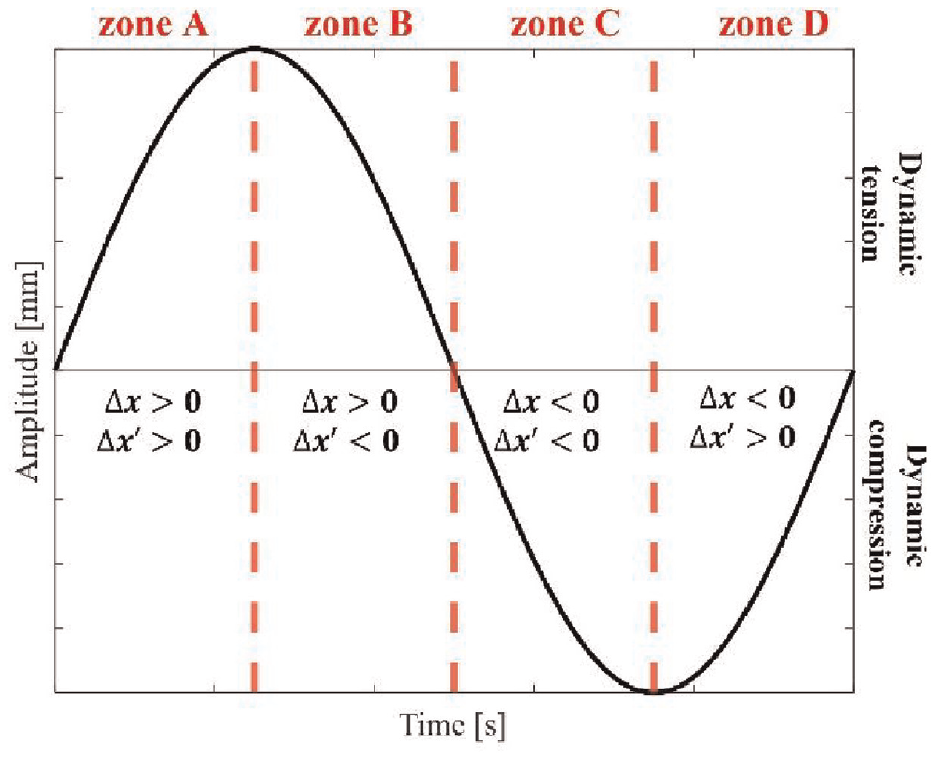
Deflection curve of MR isolator in dynamic loading.
To measure the effectiveness of the active control strategy, the Mean Square Displacement (MSD) is employed. This parameter reflects the deviation of the position of a particle with respect to a reference position over time, that is
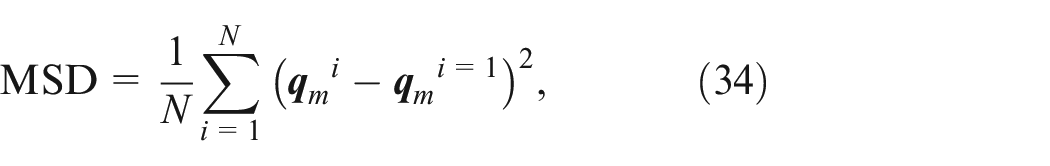
where N is the number of points in time. The MSD of the vertical displacement and the rotation of the drive machine are measured with and without the active control.
The effectiveness of the active control depends on various factors, such as the control strategy and type of MR isolator. In addition, the response time of the material and the applied magnetic field are important variables. Assuming no delay due to computation, the response time of the active control is determined by the material. Zhu et al. (2018) analyzed experimentally the transient responses of MREs under compression mode and concluded that it depends on the particle alignment, compressive strain, and applied magnetic field. The experimental work revealed a response time around 10 ms. In this work, a response time of 10 ms is set for the MR isolators. To evaluate the influence of the magnetization, simulations with a varying range of magnetic fields, from zero to saturation, are performed. Furthermore, the application of the active control in isolator A, B and in A and B simultaneously, are compared.
4.3. Definition of the system time domain excitation
The excitation coming from the motor must be considered if an active vibration control is wanted to the implemented. In this work, a real acceleration signal measured in the drive machine of the elevator system is employed. The measurements are conducted in a complete trip of the elevator in the vertical (z-axis) and horizontal (x-axis) direction. (Figure 13). Clearly, there is an acceleration zone followed by a constant amplitude zone and finally a deceleration zone until the elevator stops.
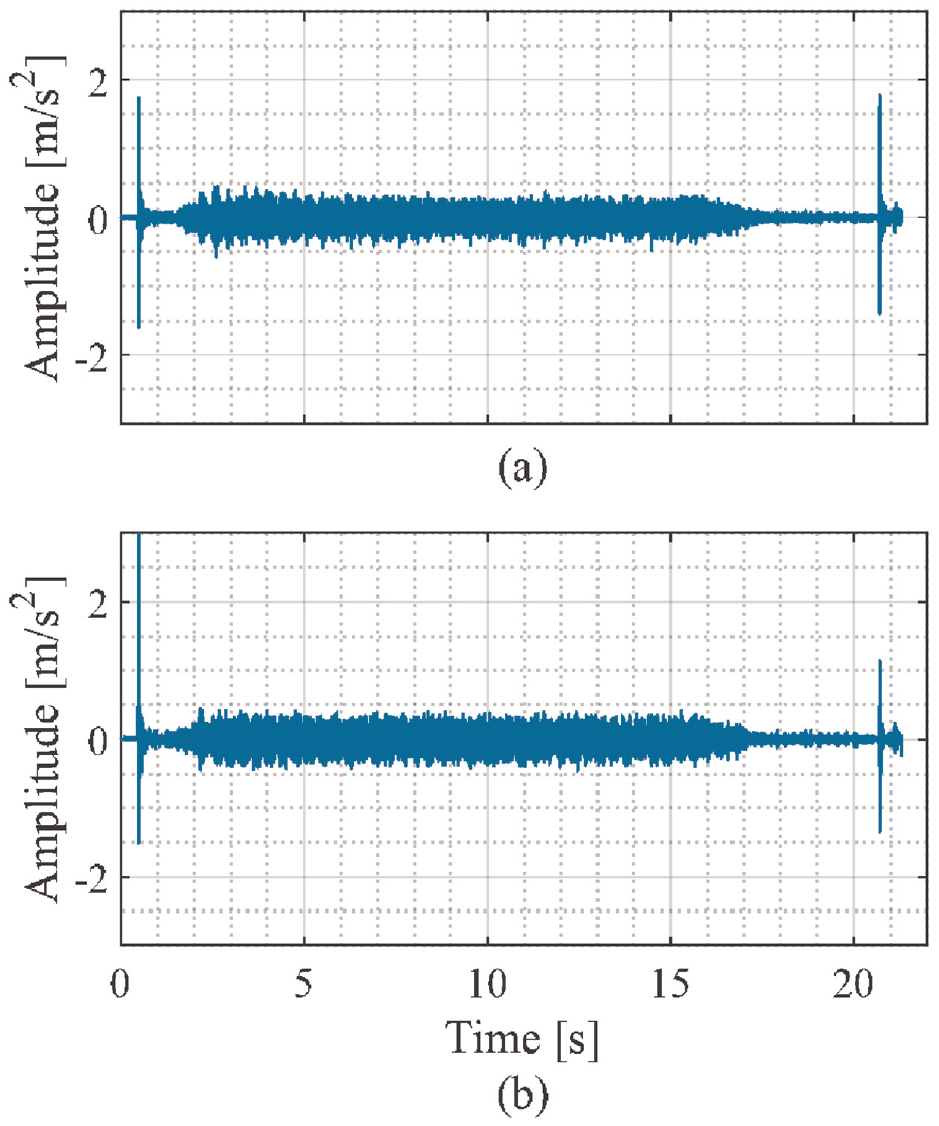
Measured acceleration signals in complete trip of elevator: x axis (a) and z axis (b).
Spectrograms of the recorded acceleration signals are shown in Figure 14. The function “spectrogram” is employed from MATLAB (The MathWorks Inc, 2022). For posterior analysis, the signals are divided into three zones: start (from 0 to 3 s), constant velocity (from 3 to 16 s), and brake (from 16 to 21 s). These zones have different amplitude and frequency components, thus the active control can be treated separately to optimize the results.
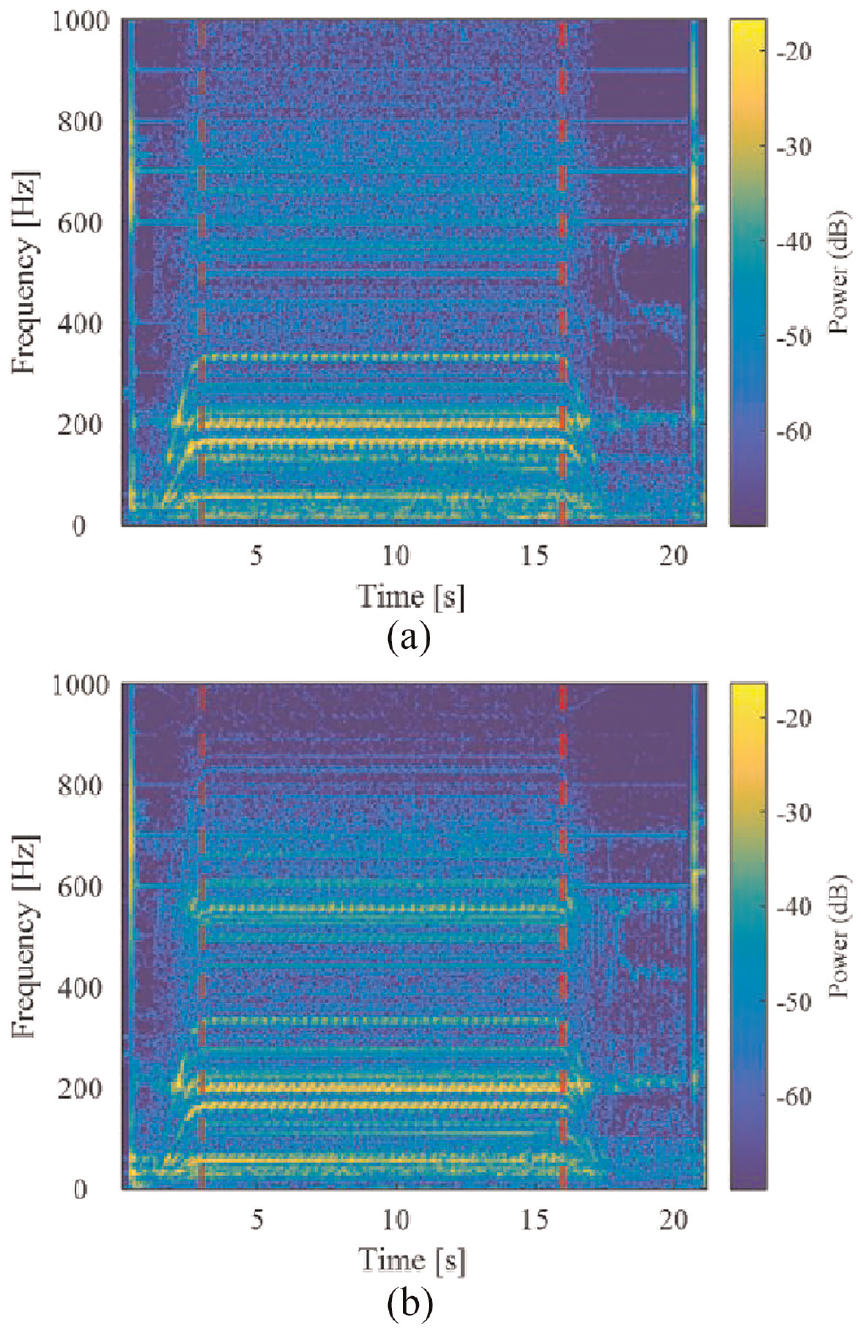
Spectrogram of the measured acceleration in x axis (a) and z axis (b). Vertical lines indicate where the signal is cut.
The acceleration measurements are converted into dynamic excitations with the following procedure. The FFT is applied to the acceleration signals to obtain the frequency domain accelerations. From these signals the frequency domain displacement can be extrapolated as
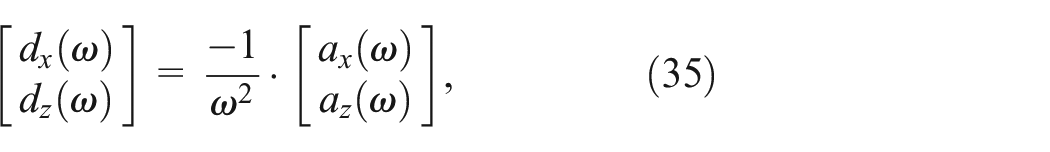
where
The acceleration was measured at the top of the machine, thus a transformation matrix
The transfer function defined in equation (22) is employed to obtain the relation between the displacements and excitation forces as
where
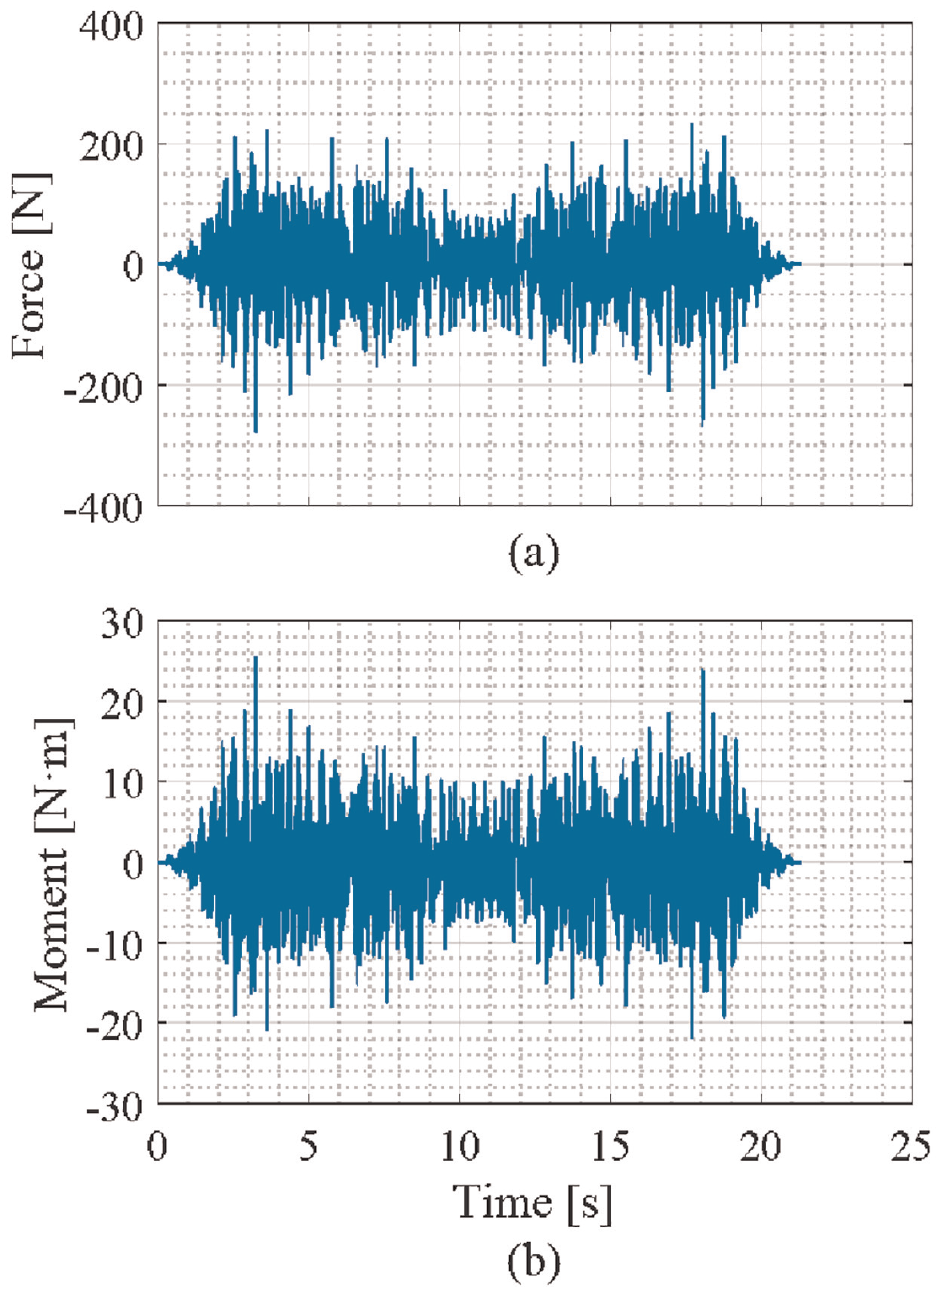
Excitation force (a) and moment (b) in the drive machine obtained from acceleration signals.
4.4. Performance of fuzzy control strategy
The performance of the fuzzy control algorithm with different configurations is evaluated. The active control simulations are performed over the whole range of magnetization, from zero (0%) to saturation (100%) of the MR isolators. From the numerical simulation results, the MSD of the vertical displacement (
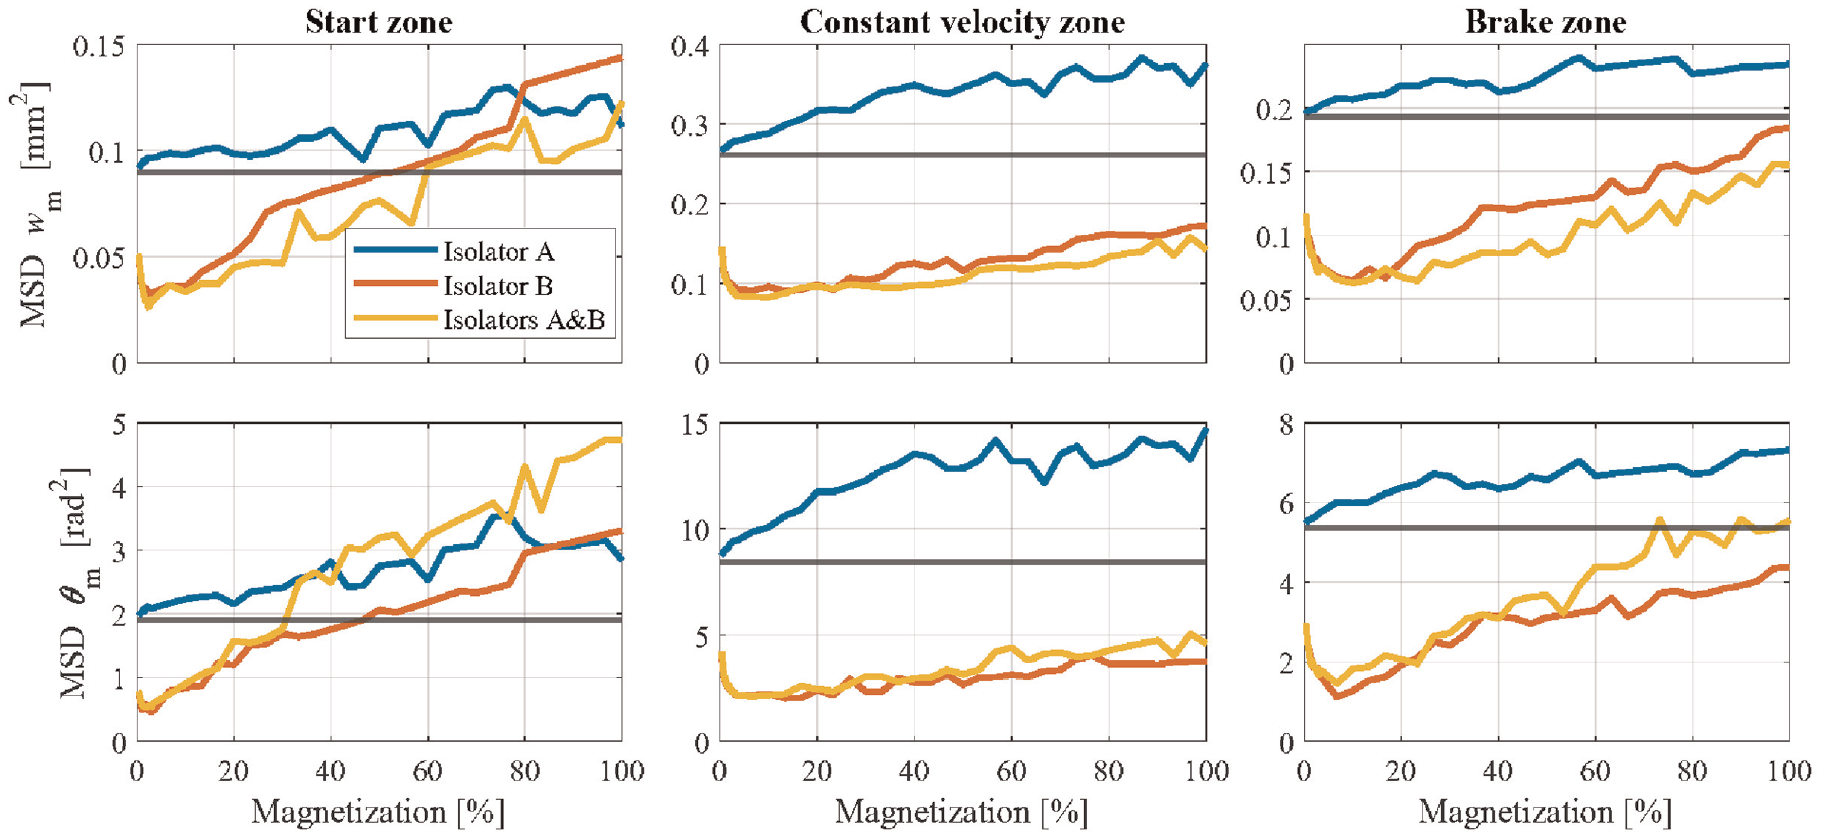
MSD of vertical displacement and rotation of the drive machine in start, constant velocity, and brake zones for different control configurations and magnetization the MR isolator.
Regarding the acceleration zone of the elevator, implementing the active control in MR isolator B leads to the best results for both the vertical displacement and rotation of the drive machine. The MR isolator A configuration shows no improvement with respect to the case without active control. Moreover, the implementation of active control in MR isolators A and B simultaneously results in vibration reduction. However, the rotation values are above with respect to the isolator B case. In addition, the curves for all the studied scenarios show an increasing trend with the applied magnetic field. Moreover, above 50% and 30% of magnetization no improvement is found for the isolator B and isolator A and B configurations.
In the constant velocity zone, a similar trend is found for the isolator A configurations with no vibration isolation improvement. Alternatively, with the isolator B and isolator A and B cases the simulated values are below the no-control line for all the range of magnetization. Furthermore, for both configurations a minimum in the MSD of the vertical displacement and rotation is found. In the isolator B case, the minimum is at 15% magnetization whereas for the isolator A and B case the minimum is obtained at 10% magnetization.
For the brake zone, similar results to the start zone are obtained. No improvement is seen with isolator A configuration while an increasing trend with magnetization is found for all the curves. If the isolator B and isolator A and B configurations are compared, almost the same values are obtained from the simulations. Both curves show a minimum at 10% magnetization for the vertical displacement and rotation of the drive machine.
In Figure 17 the obtained maximum MSD reduction values of the vertical displacement and rotation for the different control configurations are compared. Clearly, the largest vibration isolation is obtained if the active control is applied in the isolator B. With this configuration, the vibration isolation is larger compared to the case where active control is applied simultaneously in isolators A and B. Consequently, the simultaneous control in isolators A and B may not be the best solution, as greater isolation is obtained if just one support of the machine is actively controlled. Indeed, when designing an active control for the elevators, the potential cost of it is an important factor. Thus, the need to apply the active control in both isolators is discarded. In addition, the application of the magnetic field it implies an additional energy cost. The active control in the isolator B is shown to be the optimum configuration, as it offers maximum vibration isolation with less magnetization than the isolator A and B configuration case. For the acceleration and deceleration zones of the elevator, maximum isolation is reached at 10% magnetization. In the constant velocity section, a magnetization of 20% results in the maximum reduction of the MSD. Considering the experimental measurements, these magnetization percentages correspond to magnetic inductions of 50 and 100 mT.
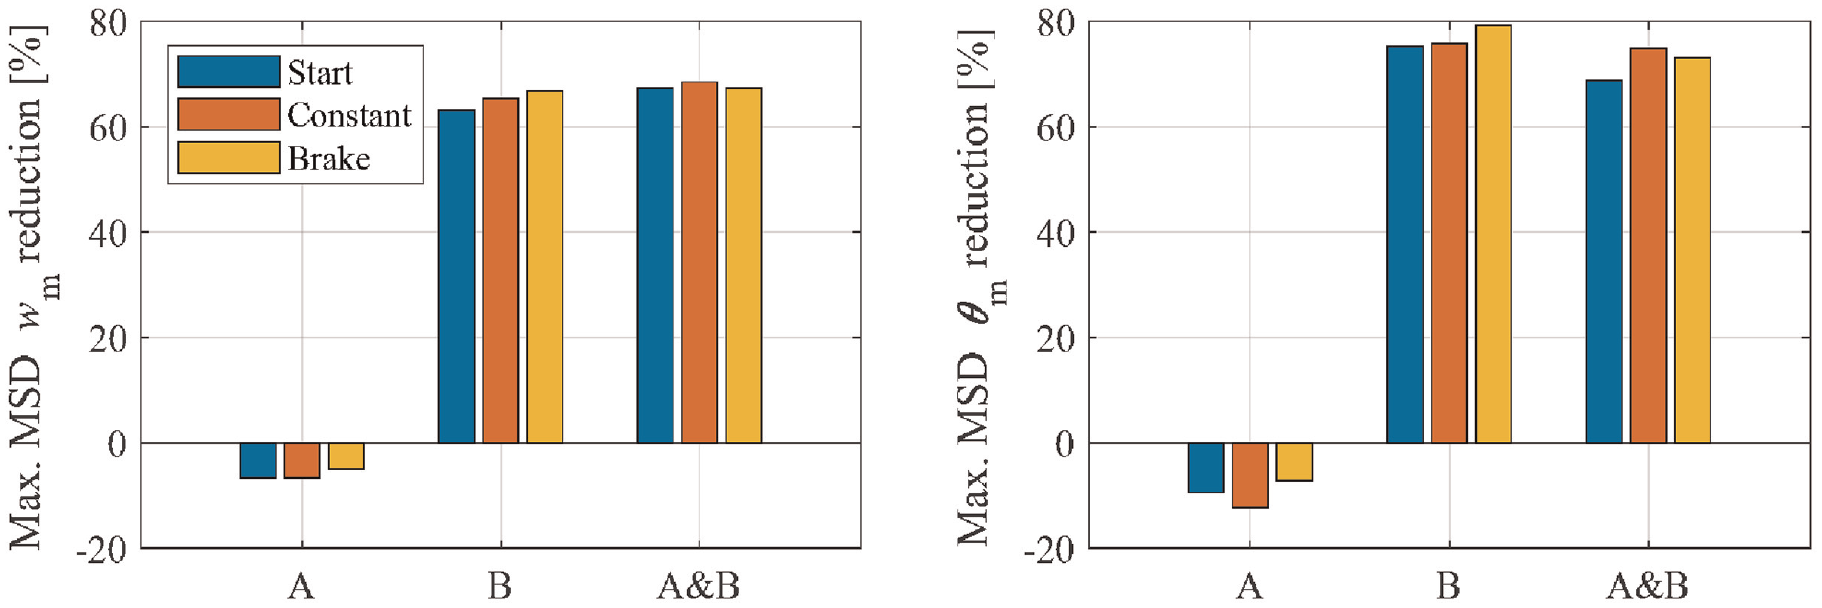
Maximum reduction in the MSD of the vertical displacement and rotation of the drive machine for the different elevator trip zones with the analyzed control configurations.
Finally, in Figure 18 the vertical displacement and rotation of the drive machine in the no control case compared to the active control case is shown. The active control in isolator B with 15% magnetization is plotted in constant velocity zone. Clearly, the active control greatly reduces the amplitude of the vibration, resulting in a vibration isolation improvement.
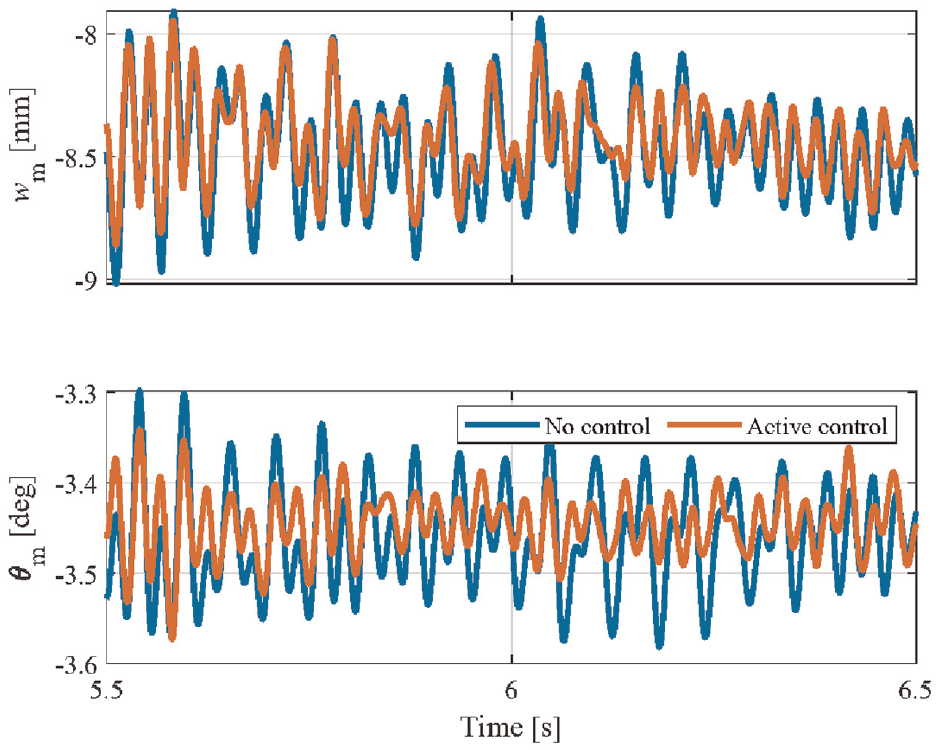
Vertical displacement and rotation of the drive machine with and without controlled magnetic field of isolator B with 40% magnetization.
5. Conclusions
A model of the elevator system is developed for the study of an active control application for the reduction of the vibration transmission. This model includes the drive machine and the frame where it is supported, along with MR isolators between them to isolate the vibration. To represent the behavior of these isolator materials, a constitutive model that accounts for the frequency, amplitude, and magnetic field dependency is employed.
This material model is validated using experimental measurements of MR samples conducted in compression mode. MR isolators based on silicone and carbonyl iron are fabricated. For the testing of the material, a universal testing machine equipped with an electromagnet is used. The nonlinear least-squares method is employed for the parameter fitting and good agreement between the model and experimental results is found. In order to achieve an improved vibration isolator in the elevator system, two different control strategies are simulated and evaluated.
For a harmonic excitation of the machine, a coincidence frequency control strategy is used. Energy flow density is calculated to measure the vibration reduction throughout the MR isolators. Simulations showed that with this strategy, the energy transmitted to the structure can be reduced by 50% in the resonance peaks. However, this strategy is only valid for harmonic excitations and the frequency thresholds are amplitude dependent.
Fuzzy logic control algorithm is shown to be suitable for isolating the vibration in real operating conditions of the elevator. Simulations have demonstrated that the best performance is obtained if active control is applied just in isolator B, which reduces the cost of implementation compared to the configuration where both isolators A and B are controlled. Moreover, the values of minimum vertical displacement and rotation of the drive machine in the isolator B case are obtained at lower magnetic field strengths compared to the isolator A and B configuration, which reduces the energy cost of the active control system. Furthermore, improved vibration reduction is achieved if the elevator trip is divided into acceleration, constant velocity, and deceleration zones. Specifically, simulation results reveal an overall reduction in the vertical displacement of 60% and rotation of the motor around 80%, with magnetic field strengths of 50 and 100 mT in start/brake and constant velocity zones, respectively.
Several research lines are open to continue with this work, such as the modeling of long term effects, the definition of the magnetic field application device that fits in the elevator system, and the development of a laboratory prototype to validate the work with experimental results.
Footnotes
Acknowledgements
The authors are also grateful to Borja Prieto for design and simulation of the electromagnet used in the paper.
Declaration of conflicting interests
The author(s) declared no potential conflicts of interest with respect to the research, authorship, and/or publication of this article.
Funding
The author(s) disclosed receipt of the following financial support for the research, authorship, and/or publication of this article: The authors would like to thank Orona S. Coop for their financial support in the development of the project and the Basque Government for the awarding of a grant for an industrial doctorate (Bikaintek 20-AF-W2-2018-00007).