
Abstract
The rheological properties of magnetorheological elastomers are influenced by magnetically sensitive fillers and the elastomer matrix. The ability to respond to an external magnetic field is imparted by the fillers, while the load-bearing capability is determined by the matrix type. In this paper, the effect of matrix material on the properties of magnetorhological elastomer is explored experimentally. Carbonyl iron particle content is varied by 0%, 15% and 25% by volume to produce magnetorheological elastomer samples using natural rubber, silicone rubber and nitrile butadiene rubber matrices. Forced transmissibility test approach was employed to evaluate the field induced variations in the dynamic stiffness and loss factor of magnetorheological elastomers. The dynamic stiffness of nitrile butadiene rubber is the highest, while that of silicone rubber is the lowest. Addition of carbonyl iron particles significantly improves stiffness, although these gains depend on the properties of unfilled matrix. The addition of 25% by volume of carbonyl iron particle increased the dynamic stiffness of a silicone rubber matrix based magnetorheological elastomer by 67.78%, while the similar change in magnetorheological elastomer with nitrile butadiene rubber matrix was 38.58%. The field dependent response of magnetorheological elastomers is governed by the matrix and ferromagnetic filler concentration. These qualities are higher in magnetorheological elastomer with a low initial dynamic stiffness matrix and lower in magnetorheological elastomers with a stiffer matrix.
Keywords
1. Introduction
Magnetorheological elastomers (MRE) are a type of functional material that changes its rheological properties when exposed to a magnetic field (Davis, 1999; Jolly et al., 1996). MRE is a superior derivative of MRF in terms of quick response, no sedimentation, ease of storage and strong sealing performance (Caterino et al., 2014; Kallio, 2005). It also reacts to the applied magnetic field by changing the resistance, size and dynamic properties (Boczkowska and Awietjan, 2009; Chen et al., 2007a; Poojary et al., 2016). These distinguishing characteristics enable MRE to be implemented in a wide range of applications, including sensors, actuators and semi-active vibration attenuation devices (Bica et al., 2014; Gu et al., 2020; Jalali et al., 2020; Leng et al., 2020; Shabdin et al., 2019; Taghizadeh and Karamodin, 2019).
MRE consists of an elastomer matrix and ferromagnetic fillers (Davis, 1999; Jolly et al., 1996; Lokander and Stenberg, 2003). Some optional additives are added in order to impart superior properties to MRE (Cao et al., 2020; Chen et al., 2008a, 2016; Poojary et al., 2018; Zhou et al., 2020; Aziz et al., 2016). The elastomer matrix is non-magnetic in nature, and its properties does not change when exposed to magnetic field. As the filler particles locked in the matrix, which ensures in a distinct magnetized and non-magnetized response of MRE (Boczkowska and Awietjan, 2009; Chen et al., 2007a; Lokander and Stenberg, 2003). MRE is termed as isotropic and anisotropic based on the arrangement of filler materials (Böse and Röder, 2009; Chen et al., 2007b; Li S et al., 2020). If the curing is done in non-magnetized state, the fillers are uniformly dispersed across the matrix resulting in isotropic structure (Han et al., 2013; Kramarenko et al., 2015; Melenev et al., 2011; Poojary et al., 2016; Zając et al., 2010). Due to the application of a magnetic field during curing, the ferromagnetic fillers attempt to reach the lowest energy state, making MRE anisotropic. Because of the organized structure, the spacing between the fillers is less, resulting in a greater interaction. As a result, anisotropic MRE has a stronger sensitivity to the magnetic field, allowing for greater field-induced response (Kallio, 2005; Li et al., 2012).
The type and the content of the fillers influence the characteristics of MRE substantially in comparison to the arrangement of fillers within the matrix. The fillers are usually in powdered form and can be magnetically soft or hard (Lockette et al., 2011). Magnetically hard fillers are magnetized in a particular direction and have anisotropic characteristics (Lockette et al., 2011; Song et al., 2009). MREs comprising of magnetically hard filler ingredients show properties like a permanent magnet. On the contrary, in the absence of magnetic field, MRE with magnetically soft particles displays characteristic of a viscoelastic material. (Lokander and Stenberg, 2003; Zając et al., 2010). Some of the most widely employed magnetically soft fillers in the synthesis of MRE are carbonyl iron particle (CIP), nickel and cobalt (Lokander and Stenberg, 2003; Padalka et al., 2010; Song et al., 2009). CIP, known for its high magnetization saturation of approximately 2.1 T and lack of hysteretic behavior, is often chosen as the preferred magnetically soft filler in the synthesis of MRE. (Jolly et al., 1996).
The characteristics of magnetically soft fillers have a noteworthy impact on the rheological behaviour of MRE. The behaviour of MRE is a function of mechanical properties of the fillers under non-magnetized state. When compared to CIP reinforcement, MRE loaded with nickel (Ni) particles demonstrates better characteristics for the same degree of filler reinforcement (Padalka et al., 2010). However, the stiffness augmentation and damping properties of MRE in the magnetized state is reliant on the magnetic properties of the soft filler. CIP-based MREs have a greater MR effect when compared to MREs reinforced with Ni particles. This difference is due to higher permeability of the CIP filler and its magnetic saturation, which results in better alignment along the direction of magnetic flux line. The fillers which possess a higher permeability results in more particle to particle interface under a magnetic field. On the contrary, ferromagnetic fillers with lesser permeability do not line up consistently when magnetic field is applied, resulting in less field-influenced improvement. As a result, the MR effect for CIP based MRE is larger than MRE’s with Ni, and is more appropriate for vibration mitigation applications (Padalka et al., 2010).
The smart features of MRE are sensitive to filler to filler interactions. Under a magnetic field, filler particles act like magnetic dipoles, which is proportional to the volume percentage of the filler in the matrix (Stepanov et al., 2008). Content of filler is usually expressed as a percentage of the total weight or volume (Chen et al., 2007a; Lokander and Stenberg, 2003; Sun et al., 2008; Zając et al., 2010). The weight fraction denotes the total mass of the fillers in the sample, while the volume fraction denotes the total volume of the fillers in the elastomer medium. As the conversion of weight to volume is influenced by the density of the rubber matrix, each variety of MRE has unique weight or volume percentage.
The filler content significantly influence the field dependant characteristics of MRE in addition to modifying the zero field properties. At lower filler concentration, the spacing between the fillers is large, and there is more elastomer present between the fillers (Fan et al., 2011; Wang et al., 2015). But, the distance between the fillers decreases when the filler content increases, which subsequently enhances the magnetic force of attraction and thus increases the MR effect (Fan et al., 2011; Ge et al., 2013; Stepanov et al., 2008; Zając et al., 2010). At higher content of fillers (above 80% by weight) the elastomer quantity is reduced (Chen et al., 2007a; Sun et al., 2008). As a result, the hardness of MRE is increased, and it turns out to be brittle (Gong et al., 2005). Additionally, the relative MR effect is also influenced by the zero-field modulus of MRE, which is a function of filler content (Chen et al., 2007a; Gong et al., 2007; Zając et al., 2010). These characteristics of MRE substantiate the presence of an optimal filler content that maximizes the relative MR effect. Past literatures have reported the existence of optimum level of reinforcement when the content of filler is maintained between 25% and 35% by volume (Böse and Röder, 2009; Hegde et al., 2015; Lokander and Stenberg, 2003; Stepanov et al., 2008; Wang et al., 2015; Yang et al., 2013; Zając et al., 2010), which Davis (1999) has proved theoretically. In terms of weight percentage, the equivalent values are in the range 60–80 (Ge et al., 2013; Gong et al., 2005; Ju BX et al., 2012; Sun et al., 2008; Yang et al., 2012).
MRE is unquestionably a material that comes to mind as a candidate for usage as a semi-active vibration isolator (Gu et al., 2020; Jalali et al., 2020; Leng et al., 2020; Li et al., 2012; Taghizadeh and Karamodin, 2019). The viscoelastic matrix of MRE governs its ability to absorb and dissipate energy. The loss factor and dynamic stiffness are two metrics that are frequently used to express the dynamic viscoelastic properties of MRE (Lokander and Stenberg, 2003; Poojary et al., 2016; Zhu et al., 2013). Dynamic stiffness is also known as complex stiffness since it includes both real and imaginary terms. The real part represents the ability to absorb the energy, and imaginary part depicts its ability to dissipate the energy. It is obvious that the stiffness and damping are chosen to meet the requirements of specific application. Lower the heat generation, larger would be the product life due to minimal thermal decomposition over time. However, it is the desired attribute when the dynamic system operating under the resonance condition. The ability of MRE to absorb the energy is influenced by the matrix type, and the field-induced interaction between the fillers (Zhu et al., 2013). Past works have attempted to investigate the performances of MRE with variety of matrix materials. Natural rubber, silicone rubber, polyurethane, butyl rubber and Styrene–ethylene–butylene–styrene (SEBS) are some of the popular matrix materials (Agirre-Olabide et al., 2014; Boczkowska and Awietjan, 2009; Chen et al., 2007a; Gong et al., 2012; Khairi et al., 2016; Perales-Martínez et al., 2017; Zhu et al., 2013). These matrix materials are distinguished as high temperature vulcanized (HTV) rubber and room temperature vulcanized (RTV) rubber. The temperature of curing differentiates the two types of elastomers (Chen et al., 2007a). Synthesis of RTV MRE involves mixing the ferromagnetic fillers with the elastomer and the crosslinking commences at room temperature (Perales-Martínez et al., 2017). The HTV-based MRE, on the other hand, is cured at a temperature much higher than room temperature.
The impact of matrix material on the rheological properties of MRE has previously been investigated. Literatures suggest that field dependant improvements are higher for the matrix of MRE with lower stiffness and it reduces as the stiffness of the elastomer matrix is increased (Li et al., 2010a, 2010b; Lokander and Stenberg, 2003; Rabindranath and Böse, 2013; Wang et al., 2006; Yang et al., 2015; Zhu et al., 2013). However, the phenomenon associated with the matrix dependant rheological properties of MRE is not clearly stated. Furthermore, it is critical to understand how the viscoelastic properties of the matrix can contribute to overall response when using MRE as a resilient element for vibration mitigation applications. Also it is very important to understand what factors need to be considered while selecting the matrix of MRE. Since the matrix plays a significant role as the application demands a proper combination of stiffness and the damping characteristics. In order to address these aspects the current work investigates the effect of the matrix on the variations in rheological properties of MRE as a function of filler reinforcement and magnetic field. MRE samples are synthesized with natural rubber, silicone rubber and nitrile butadiene rubber; each with CIP filler content of 15% and 25% by volume. MRE test specimens were subjected to force transmissibility tests at magnetic field strengths of 0–0.3 T in steps of 0.1 T at frequencies below 200 Hz. The variation in the rheological properties of MRE is investigated using the dynamic stiffness and loss factor obtained from force transmissibility tests.
2. Experimental
2.1. Theoretical background
Rheological characteristics of MRE is expressed with respect to its complex stiffness or the modulus. It comprises of a storage component representing the elastic response and a loss component depicting the dissipation behaviour. A parallel arrangement of a spring and a dashpot is usually used to portray as the MRE resilient element (Poojary et al., 2018).
The Hook’s law type relationship between force P and displacement x of viscoelastic material under dynamic loading conditions is described as follows (Basdogan and Dikmen, 2011; Lakes, 2009),
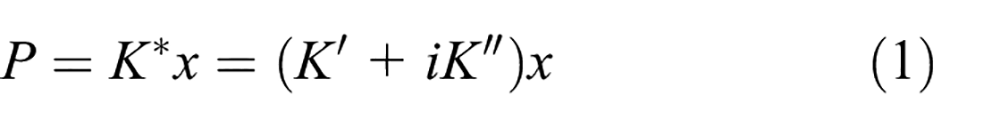
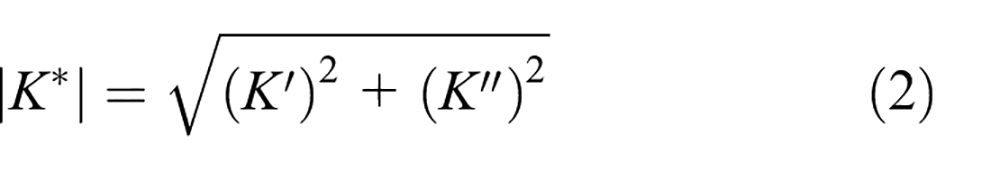
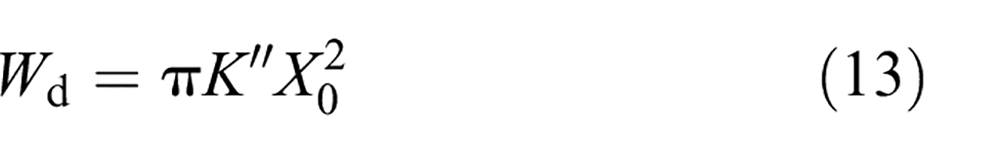
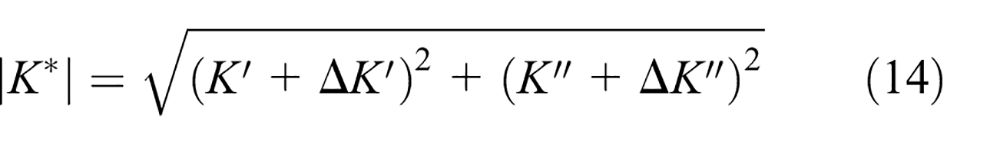
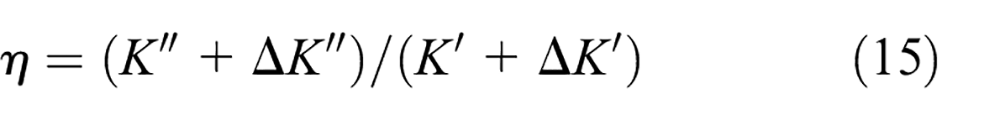
where K* is the material’s complex stiffness. The K′ denotes energy storage capacity, while K″ denotes energy dissipation. The magnitude of the complex stiffness and the loss factor of a viscoelastic material is expressed as, by (Bagley, 1989),
The dynamic viscoelastic properties of MRE can be characterized experimentally through rheometer and DMA (Agirre-Olabide et al., 2014; Qiao et al., 2012). In rheometer-based measurement, test samples are subjected to the rotational shear loading. These measurements are often susceptible to the inertia at higher driving frequency. In addition, relative slippage occurs at the interface between the sample and the disc, that limits the viscoelastic property characterization at larger strain amplitudes (Gong et al., 2012; Tian et al., 2013). In DMA, the samples are tested under single lap or double lap shear configuration. The DMA based measurements are expensive but it is versatile in characterizing the properties of viscoelastic materials over different operating conditions. Contrarily, DMA and rheometer based measurements often have a limitation on the geometry of the sample being tested, which could be a constrain to assess the properties of the resilient elements employed in vibration isolators. The performance of a vibration isolator (specifically operating in shear mode) depends on the stiffness of the resilient element, which intern a function of its thickness. Alternatively, the forced vibration test using electrodynamic shakers can allow realistic assessment of the resilient elements even of considerable dimensions (Gordaninejad et al., 2012; Hegde et al., 2015). From these tests, the properties can be assessed from the measurement of input excitation and correspondingly measuring the forces at the driving point end and at the blocked end. Additionally, an approach to measure the displacement/acceleration at the input side and the displacement/acceleration at the inertial mass can be implemented. From these measurements, the viscoelastic properties can be assessed from the hysteris loops or from the FRF plots expressed in terms of receptance, accelerance or transmissibility.
In this study, the dynamic stiffness and loss factor of MRE are calculated using the force transmissibility measurement, which is the ratio of the output force to the input force is known as force transmissibility (Poojary et al., 2017). Figure 1(a) depicts the proposed experimental setup as a single degree of freedom (SDOF) force transmissibility model, which consists of mass m and a resilient element (Stelzer et al., 2003). In the analogous form (Figure 1(b)), the resilient element is embodied by a Kelvin-Voigt type of spring stiffness with parameters K′ and K″.
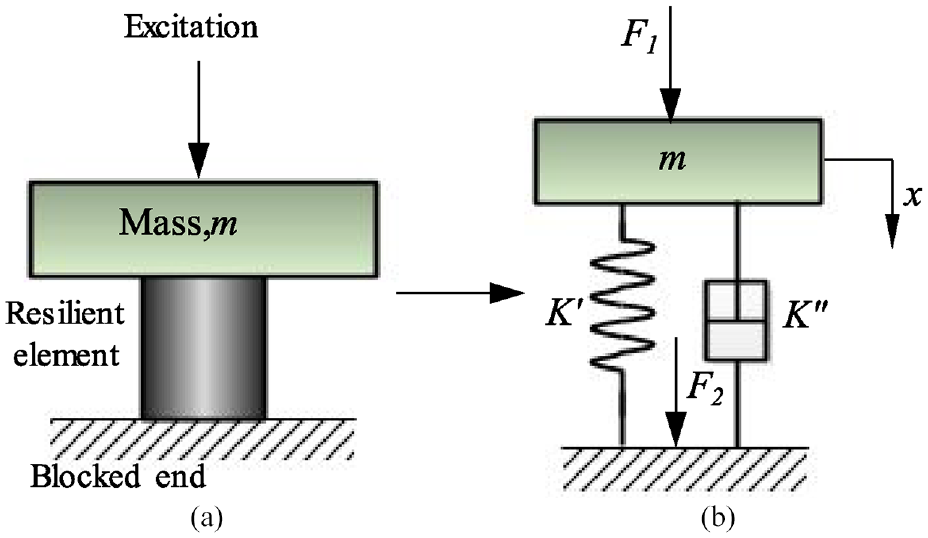
(a) Schematic representation of MRE test set up and (b) Single degree of freedom force transmissibility model of the test set up.
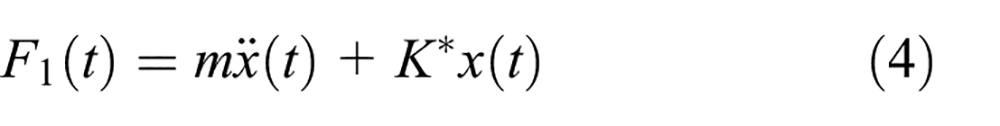
As shown in Figure 1(b), the harmonic excitation x(t) at the driving point (input end) produces an input force F1 and a blocked force F2 (output end) at the blocked end.
The force F1 experienced by the isolator at the drive point due to the input excitation is depicted by,
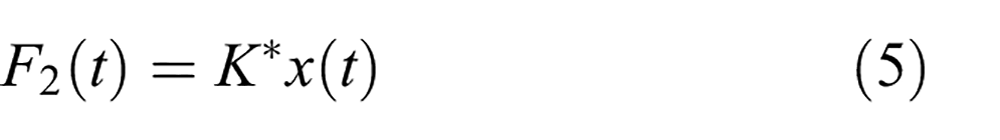
The blocked end force F2 is,
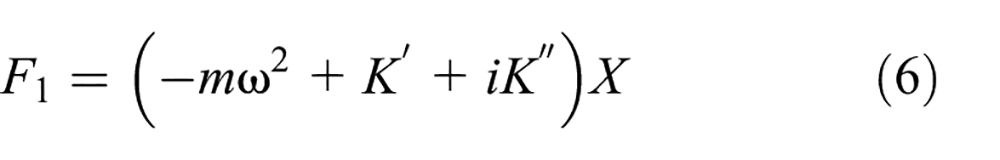
For the system exposed to harmonic input, x = Xeiwt
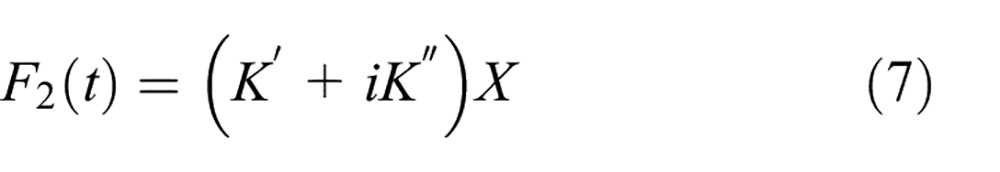
The frequency domain representation of force F1 and F2 are written as,
The complex transmissibility response of the system, H*(ω), that denote the amplification/attenuation of vibrations is (Mundo et al., 2006; Ramorino et al., 2003),
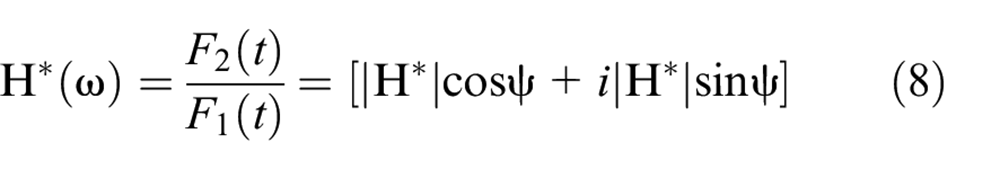
The magnitude of the transmissibility ratio is
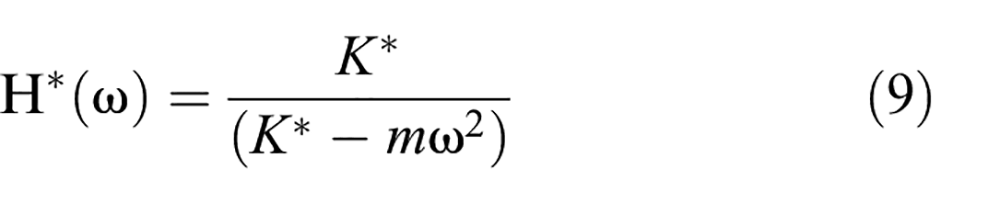
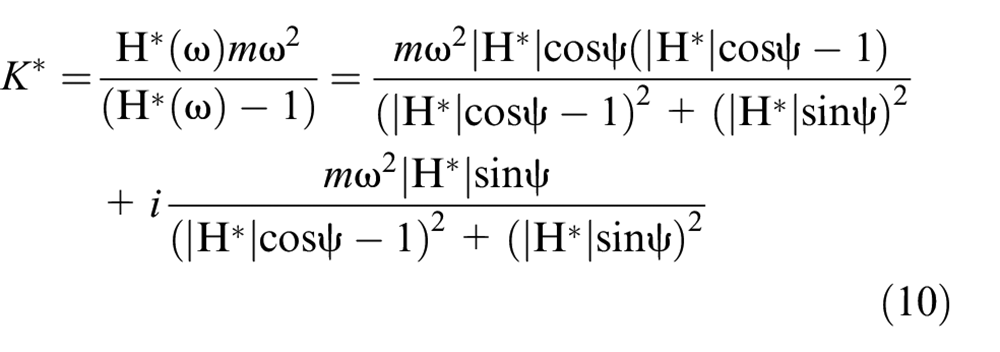
By rearranging the terms, the complex stiffness is
A typical input and output force response graphs obtained from the forced vibration testing under steady-state excitation is shown in Figure 2. The peak amplitude of input force is F1, and the corresponding values for output force is F2. The magnitude of H* is obtained by taking the ratio of F2/F1. The product Δt and ω yields the phase difference ψ between the input and output force signals. By substituting H* and ψ in equation (10), the complex stiffness of MRE at the excitation frequency ω is estimated.
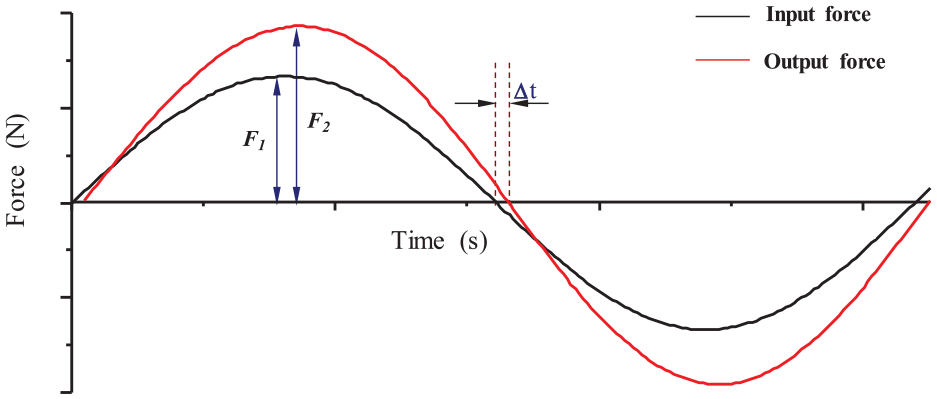
Steady state input and output force response.
3. MRE synthesis
3.1. Material processing
For using MRE for vibration mitigation applications, it must be able to withstand structural deformation due to external excitation loadings. Also, it should significantly reduce the structural vibrations. These properties depend on the matrix and the reinforcing fillers. Accordingly, the matrix selection was made with respect to the stiffness and the damping of the elastomer under unfilled state. In this study, MRE samples were prepared using three types of elastomers: natural rubber (NR), silicone rubber (Si) and nitrile Butadiene rubber (NBR). HTV elastomers include NR and NBR, while RTV elastomers include Si as matrix.
The HTV elastomer was synthesized at a temperature higher than room temperature, while RTV was synthesized at room temperature. HTV MRE preparation (NR and NBR) was carried in two stages, which involve vulcanization of HTV rubber and addition of CIP into the matrix. The mastication process was carried out in the first stage, which involved passing uncured rubber sample between two rollers that rotated in opposite directions. The rollers were heated about 120°C, and that increases the fluidity of rubber. As the rubber continually passed between the roller, it attains the mushy state. Following that, the elements listed in Table 1 were added and the processed elastomer sample was kept for curing about 24 h. Zinc oxide enhances the physical and adhesive properties in addition to functioning with stearic acid as an activator to quicken the vulcanization process. As the curing agents, dibenzothiazole disulphide (MBTS), tetramethylthiuram disulphide (TMT) and sulphur are added. Trimethyl-1,2-Dihydroquioline (TDQ), one of the plasticizers, also functions as an antioxidant. The processed sample was passed through the rollers again in the second stage, and CIP was added once the mushy state was reached. To improve mixing, silicone oil is added during the addition of CIP. After the mixing process, uncured elastomer was kept in the mould (size 34 mm × 34 mm × 16 mm) and cured at 140°C under the constant load of 1000 N for 15 min. Table 1 displays the primary preparation reaction between natural rubber and nitrile butadiene rubber.
Ingredients for the synthesis of NR and NBR based MRE.
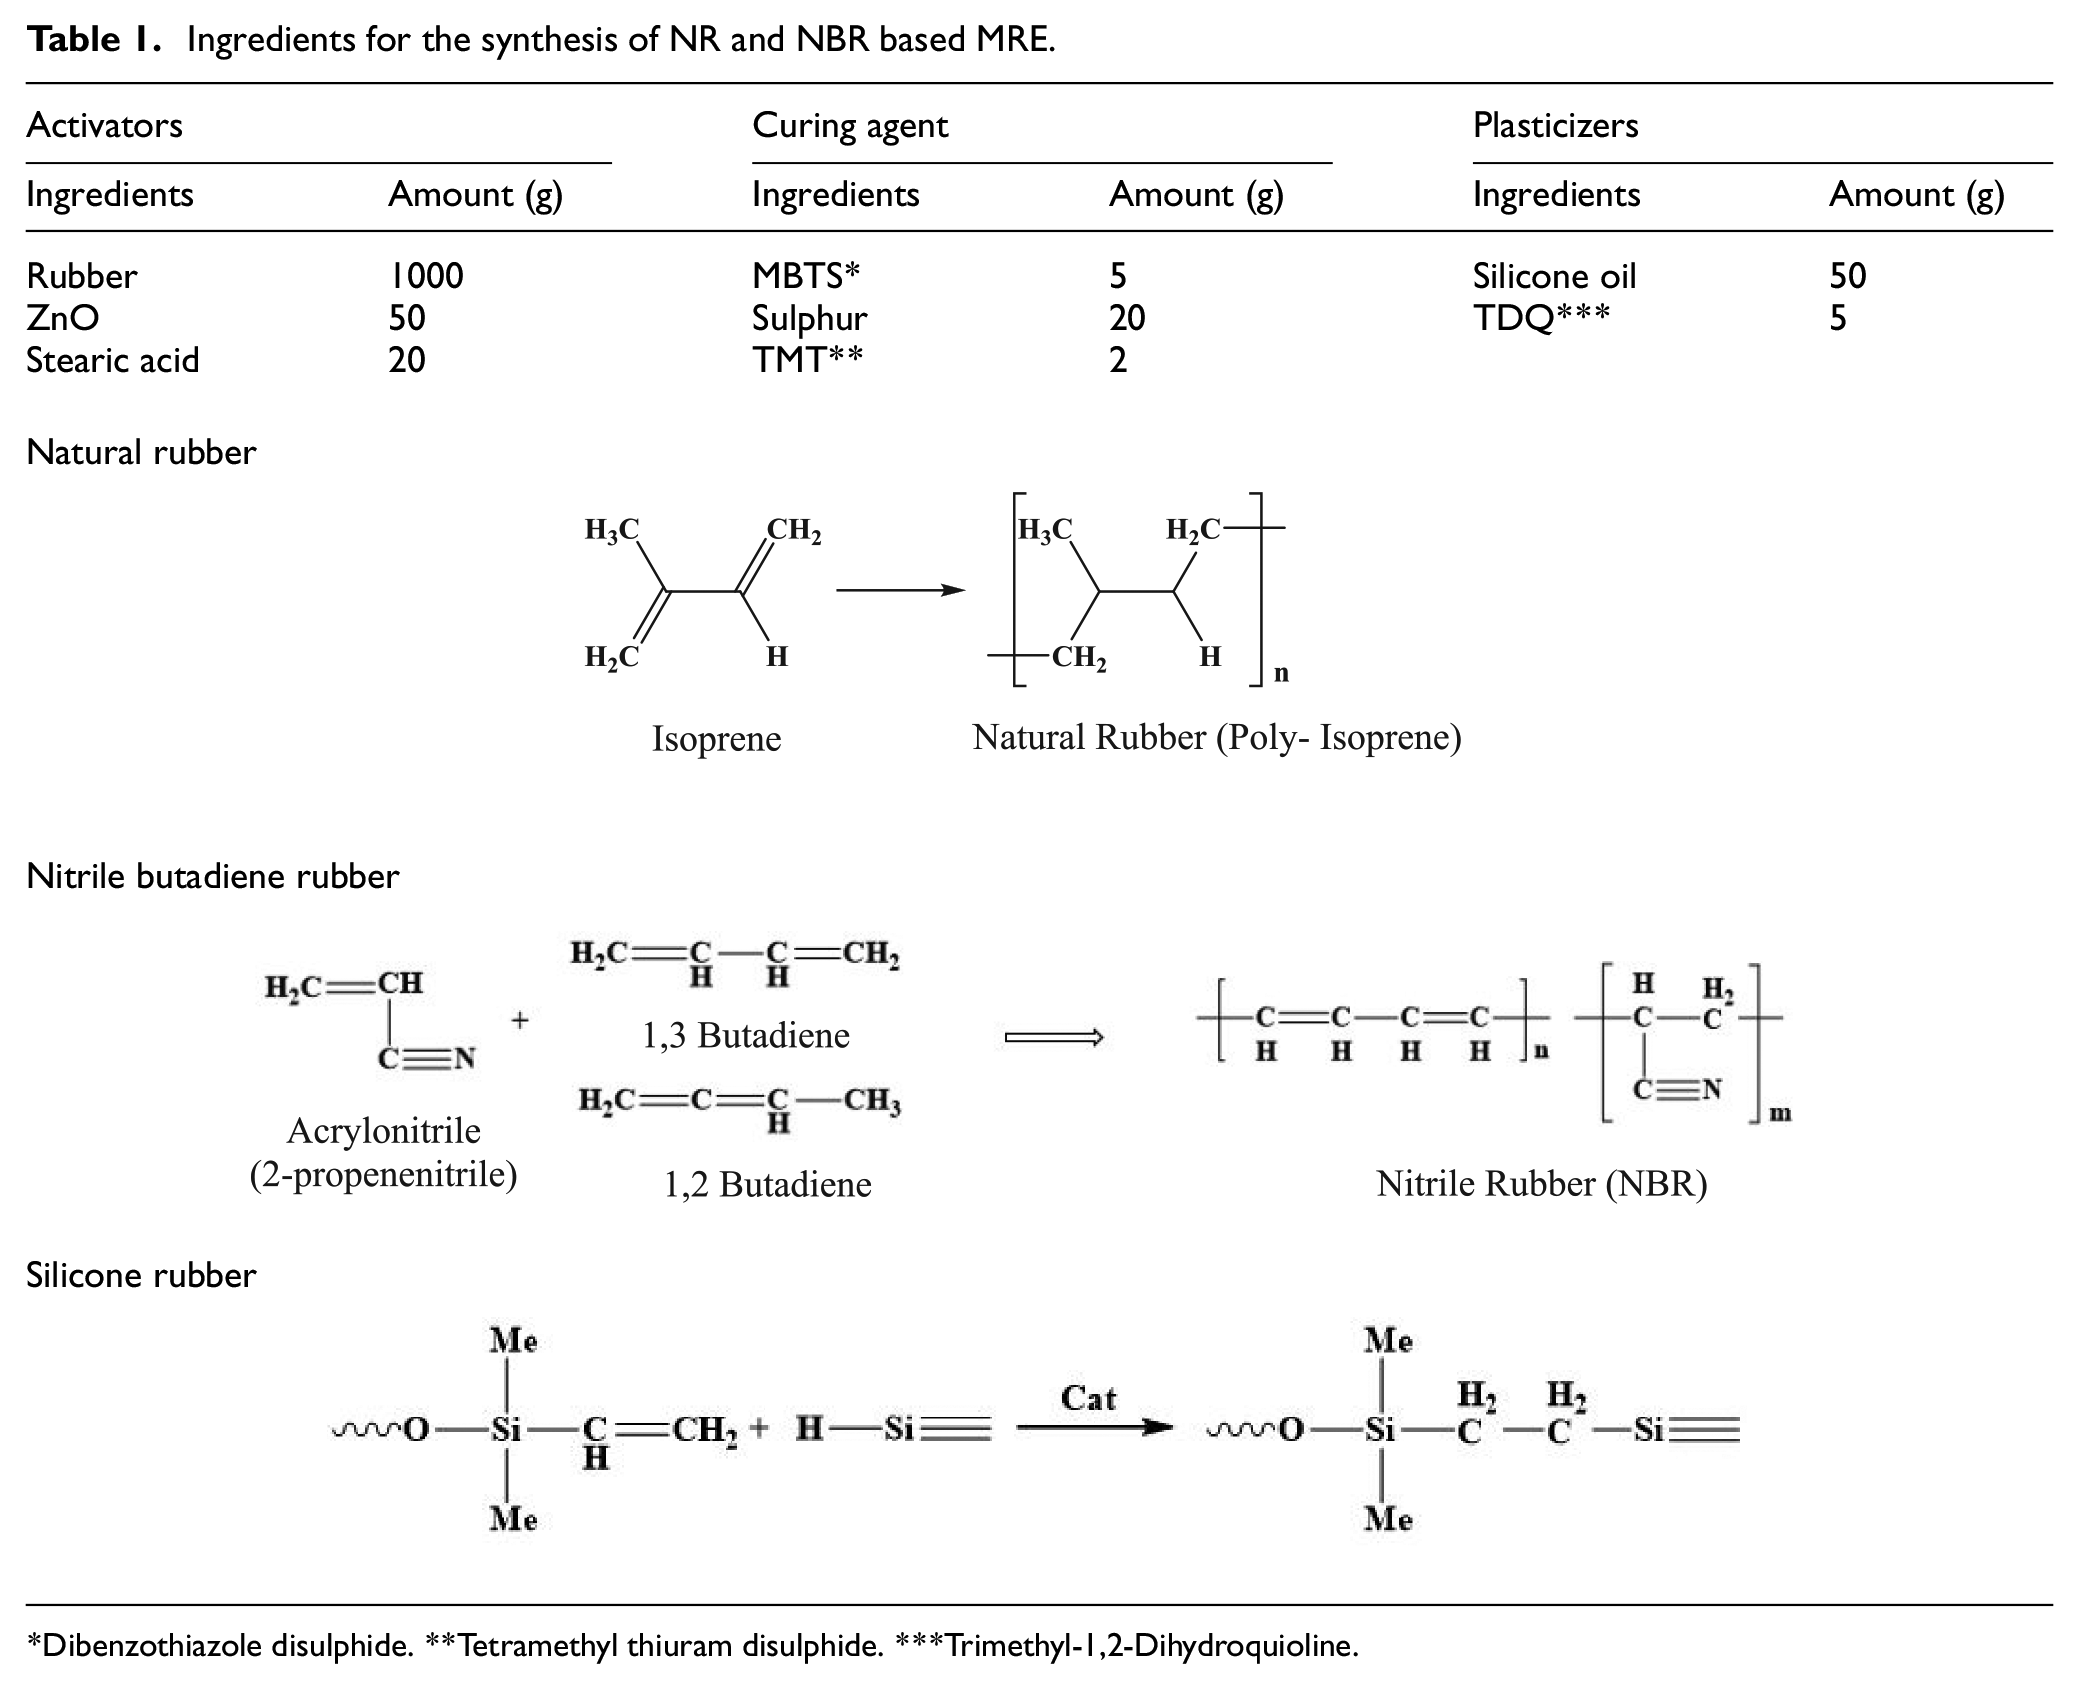
Dibenzothiazole disulphide. **Tetramethyl thiuram disulphide. ***Trimethyl-1,2-Dihydroquioline.
The RTV silicone used in the current work is a two-part system from Dow Corning (SILASTIC® 3483).The synthesis process involved mixing and curing. A suitable amount of carbonyl iron powder was mixed with resin and vigorously stimulated. After that, the curing agent was added and thoroughly mixed for around 15 min. The uncured matrix was then transferred to an aluminium mould, with any trapped air bubbles being in a vacuum chamber. The test samples were cured at room temperature for 15 h under constant pressure. Table 1 displays the primary Silicone rubber preparation reaction.
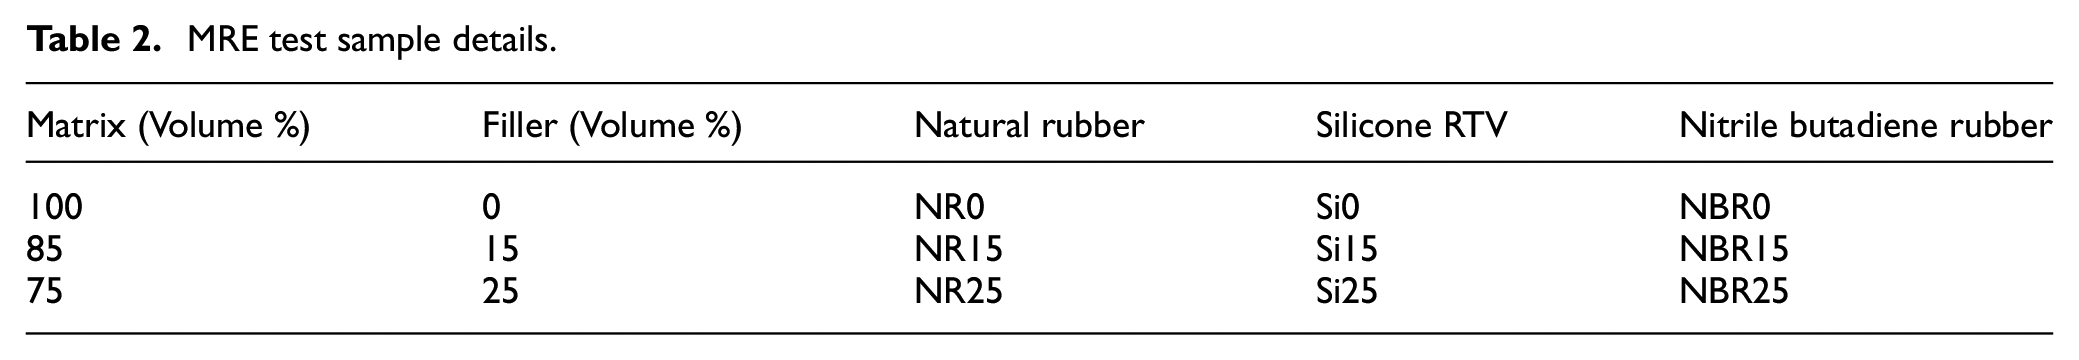
For each type of matrix, MRE samples were prepared with 0%, 15% and 20% by volume of CIP and in total nine specimens were synthesized. The particulars of the sample are listed in Table 2. To obtain isotropic MRE samples, the curing process was carried out without applying magnetic field. The microstructure of prepared MRE test specimens with 25% by volume of CIP is shown in Figure 3(a) to (c), which was observed using the Jeol SEM facility at NITK, Surathkal, to confirm the distribution of the fillers in the matrix. These images substantiate that the CIP particles are uniformly distributed which is the typical microstructure of isotropic MRE (Lokander and Stenberg, 2003; Poojary et al., 2016).
MRE test sample details.
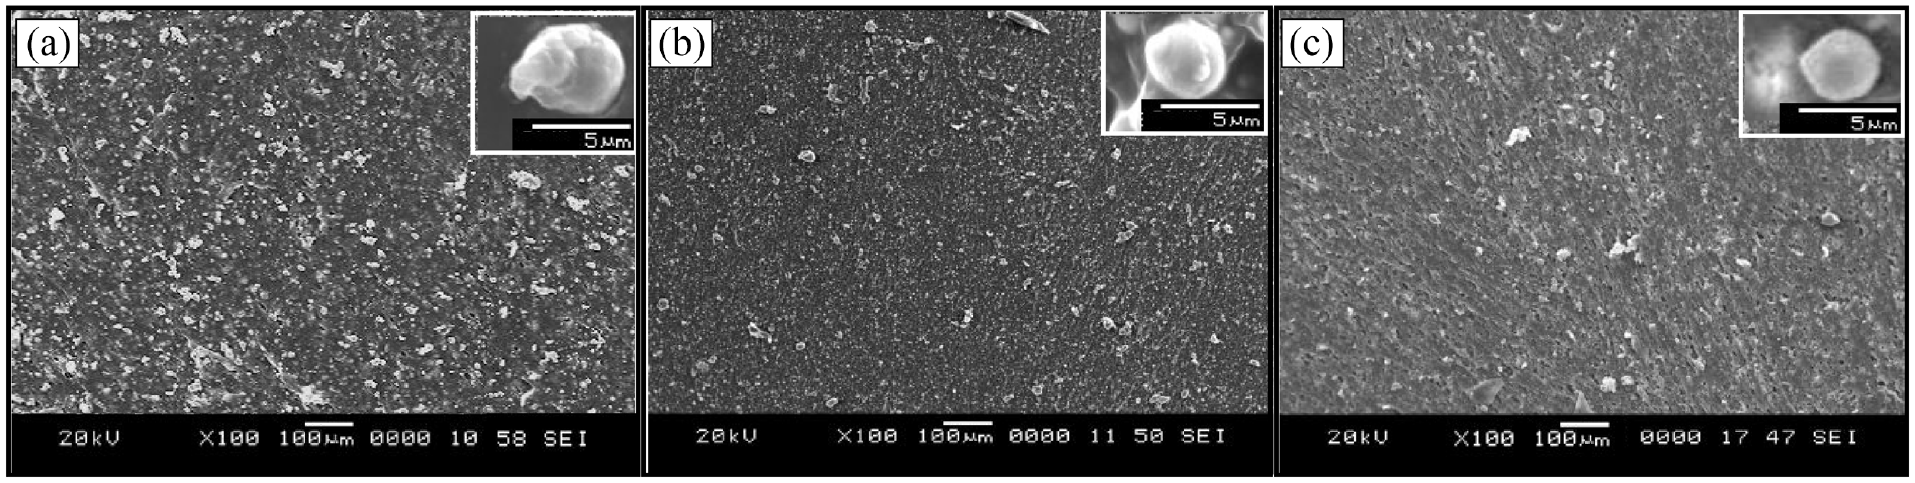
Micrographs of MRE with 25% by volume of CIP: (a) NR, (b) Si and (c) NBR.
Field sensitive properties of MRE depends on the interaction between the ferromagnetic fillers, which governs its ability to magnetize in response to the applied magnetic field. Generally, magnetic permeability is used as a base parameter to expresses the field sensitive behaviour. The magnetic permeability of MRE is a function of the content of the fillers present in the matrix. At higher volume fractions, the number of magnetic domains are more, which results in a larger permeability. However, it reduces at lower volume fraction of CIP. To utilize MRE as a material for semiactive vibration isolation or actuation applications, the magnetic permeability needs to accurately predicted and also its dependency on the properties of non-magnetic matrix needs to be assed. To characterize the magnetic permeability of MRE with the different matrix material and the volume fraction of fillers, the novel method developed by Schubert and Harrison (2016) is implemented. This approach is an inverse modelling technique to determine the permeability. According to this approach, the magnetic flux is measured at different location of the MRE samples. To estimate the permeability, the experimentally determined values are reproduced by performing magnetic field simulations in ANSYS Maxwell 14.
The schematic representation and the actual image of the permeability measurement experimental set up is shown in Figure 4. According to this approach, MRE sample is magnetized under the influence of magnetic field produced by an electromagnet. MRE sample is attached to the pole 1 and a distance of 20 mm is maintained between pole 1 and pole 2. Input current to the electromagnet is carefully monitored to ensure a constant magnetic flux of 0.3 T is generated at the poles. As depicted in Figure 4(a), the magnetic flux density is measured at 28 locations (top surface, bottom surface and along the thickness) using the gauss mater.
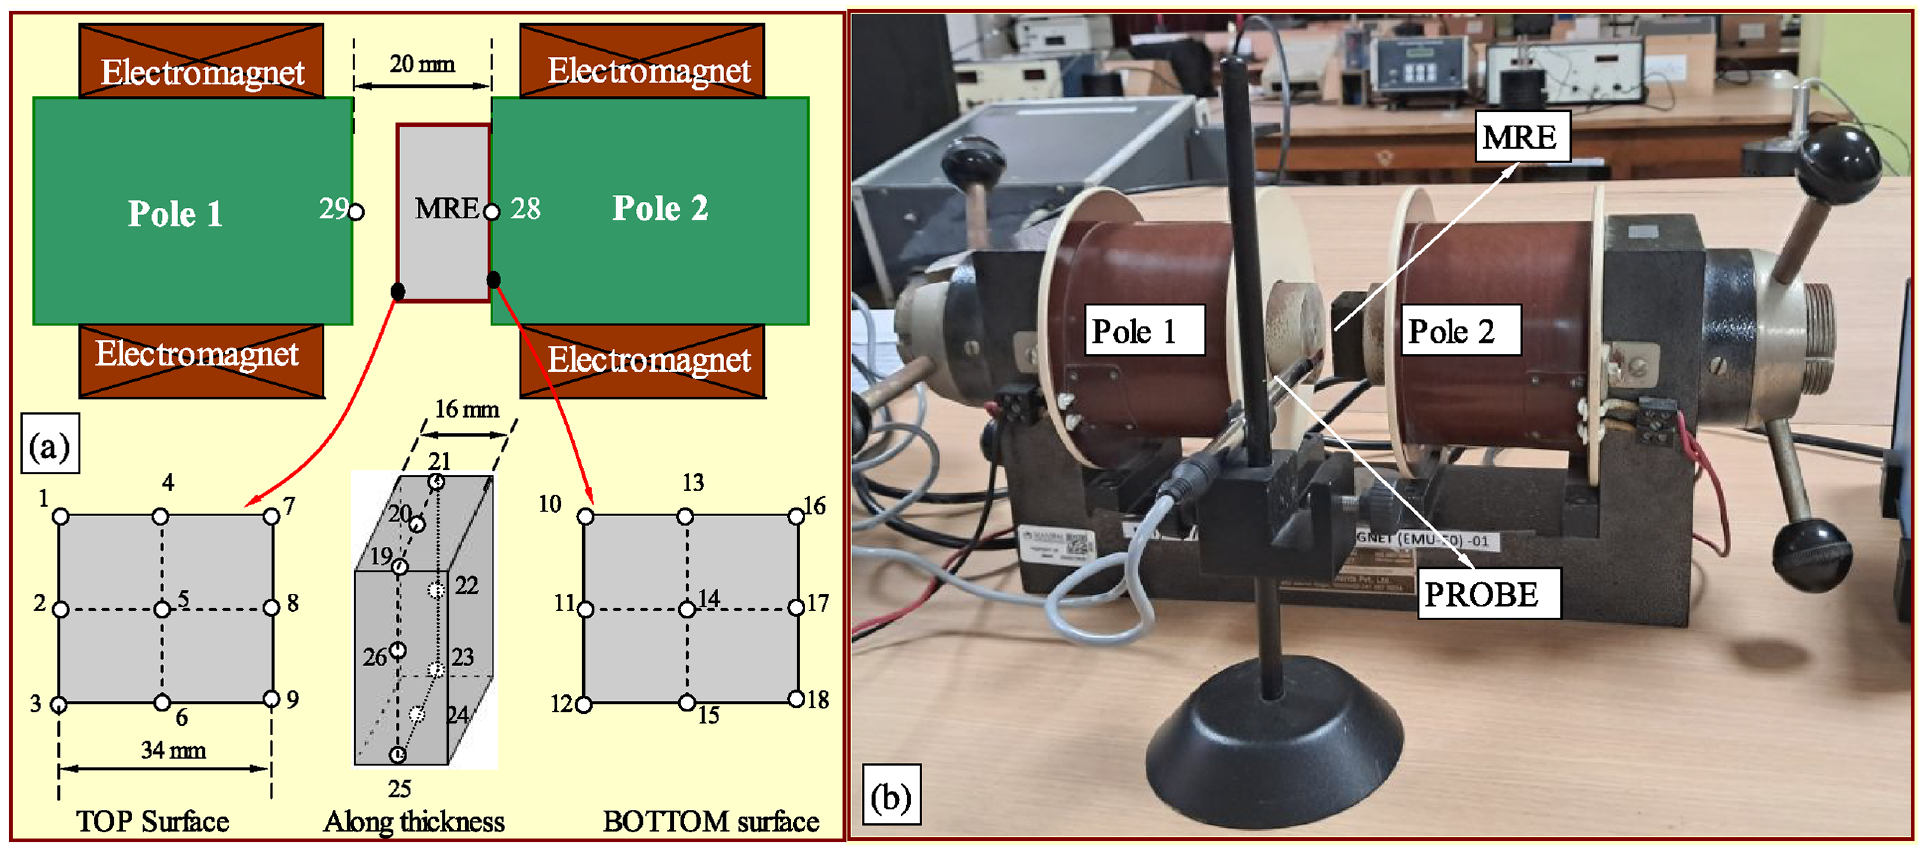
(a) Schematic representation of permeability measurement test setup and the locations of magnetic flux measurement and (b) actual image of the experimental set up.
To estimate the permeability of MRE, magnetic field FEM simulations were performed in ANSYS Maxwell 14. The Figure 5 shows the 3D model and the results of the FEM simulations. The FEM model was designed to include an electromagnet (Pole diameter 55 mm and length of electromagnet is 450 mm) that had the same dimensions as that of the experiment, with the MRE sample is placed at one end of the pole. The entire experimental setup was placed inside an air region (width 390 mm length 1350 mm height 600 mm) with a permeability value of 1. To produce a fine mesh, element length was set to 1 mm. To simulate the experimental conditions, a constant magnetic flux of 0.3 T is created at the poles. The permeability values of MRE samples were obtained from the simulations are adjusted until closer match is attained between the experimental results. These simulations were repeated for the MRE reinforced with 0% CIP (Figure 5(b)), 15% CIP (Figure 5(c)) and 25% CIP (Figure 5(d)) with different matrix materials.
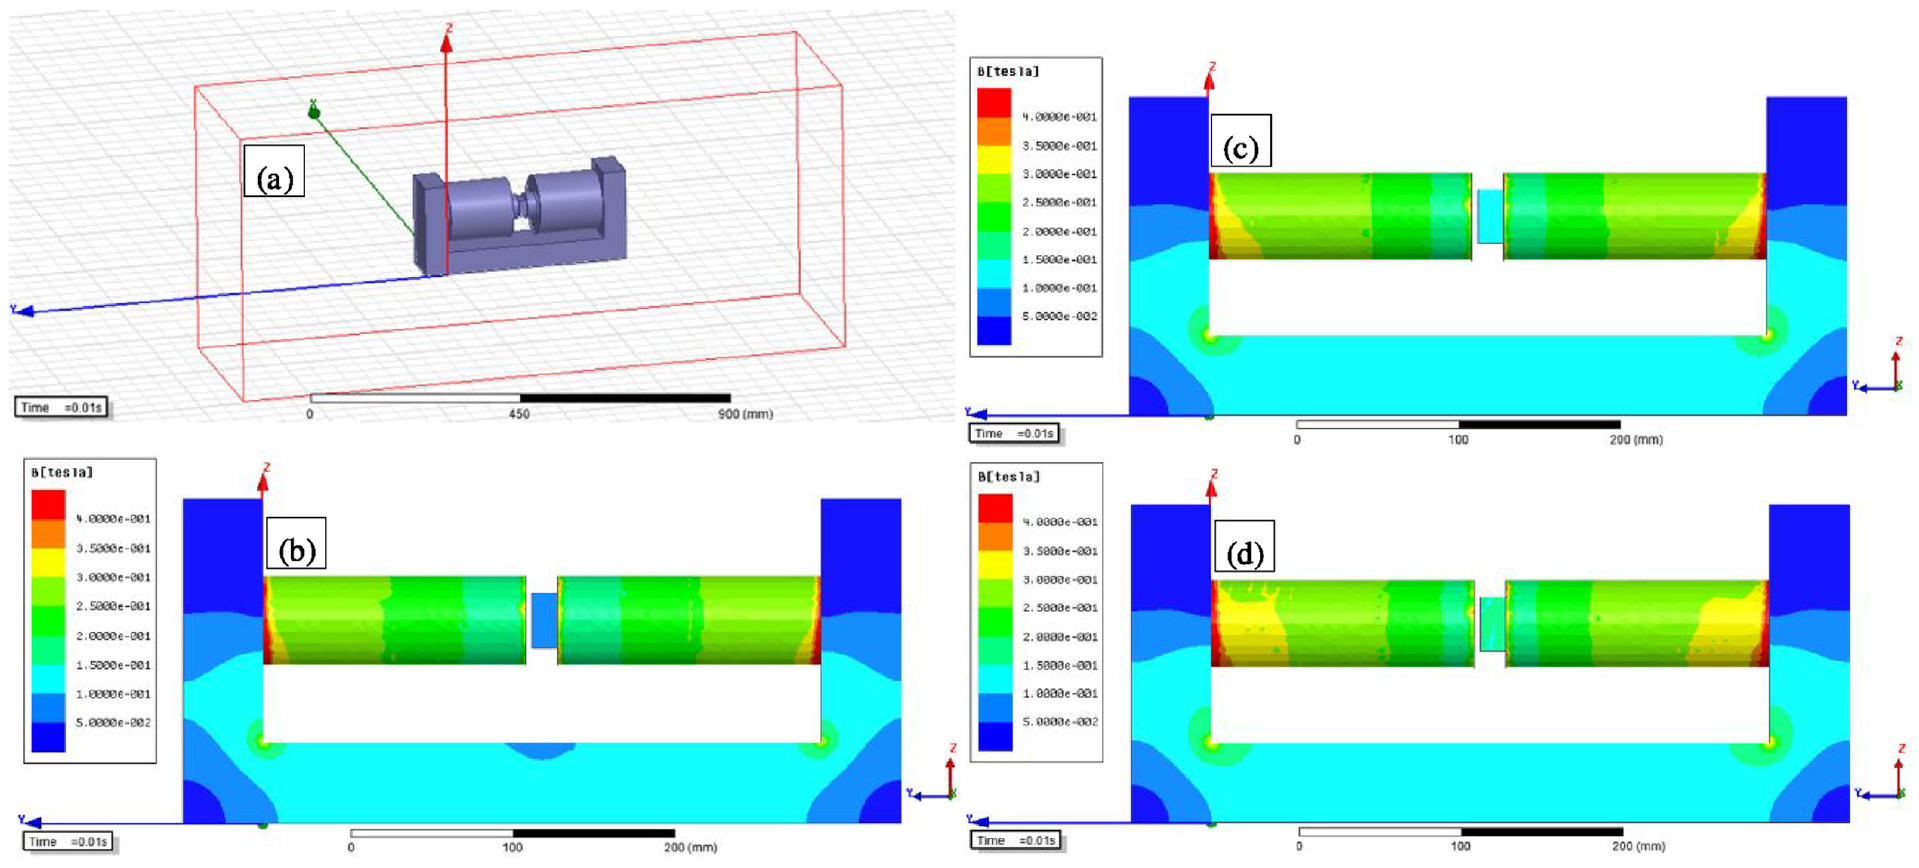
(a) 3D model of electromagnet and MRE to estimate the magnetic permeability. Simulation results for the MRE samples with (b) 0% CIP, (c) 15% CIP and (d) 25% CIP.
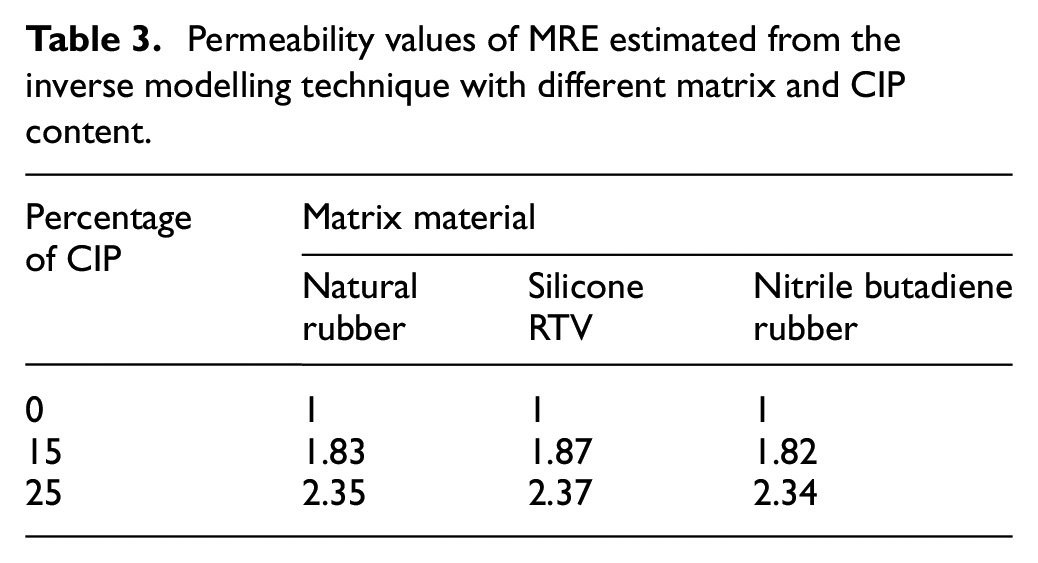
The permeability values of MRE samples with different matrix material and content of CIP are presented in the Table 3. Estimated values from the inverse modelling technique confirms that the permeability of MRE is a function of the content of the CIP. However, these values are independent of the matrix materials as it do not contribute to the magnetization of the sample. The permeability of MRE is maximum for MRE samples reinforced 25% CIP. On the contrary, the number of active magnetic domains are less in MRE with 15% CIP, that subsequently resulted in a permeability around 1.8.
Permeability values of MRE estimated from the inverse modelling technique with different matrix and CIP content.
4. Experimental set up
Figure 6 shows a schematic diagram and a photograph of the experimental setup used to characterize the rheological properties of MRE. The shaker receives sinusoidal input signals from the signal generator, which are manually controlled by an amplifier. MRE test samples to be tested in shear mode are attached to the electrodynamic shaker through a stinger Figure 6c (Li and Sun, 2011). The field sensitive MRE properties were investigated using two rare-earth neodymium (type: NdFeB 32, coercivity: 883,310 A/m and relative permeability: 1.045) permanent magnets which are attached to a fixture and fixed to the jaws of a self-centring vice to change the spacing between the magnets and regulate the magnetic field. The magnetic flux density was measured using a Gaussmeter (Lake Shore, Model 410). Two force transducers, one at the input end and the other at the output end, measure the forces (KISTLER, type 9712). The constant input displacement is measured using signals from an accelerometer mounted to the shaker table (KISTLER, K-shear). The signals from the accelerometer and force sensor are acquired at a rate of 25.6 kS/s using a 24-bit NI 9234 data-acquisition module. To exclude the temperature effects, all tests were performed under room temperature conditions.
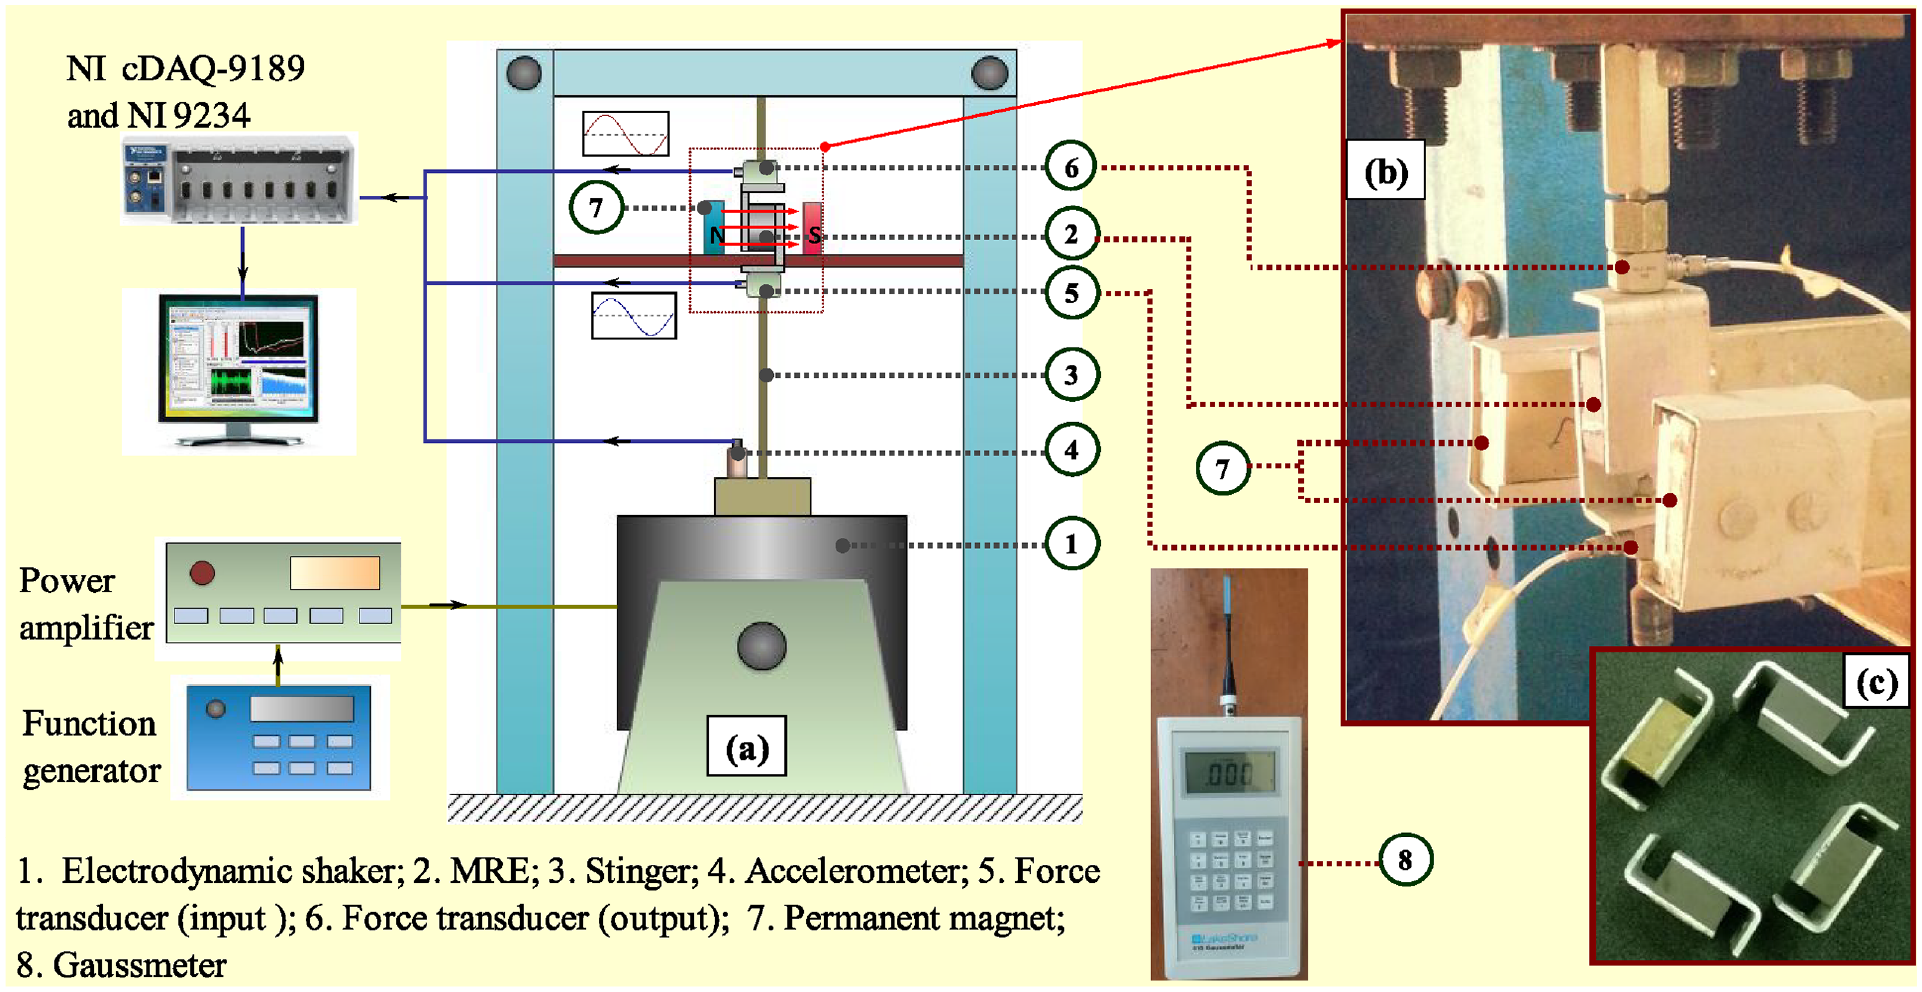
(a) Schematic image of forced vibration test set up, (b) an image of the experimental apparatus and (c) an image of single shear mode MRE test samples.
The ratio of force at output to force at input side was measured using a steady-state sinusoidal input since the frequency sweep generates errors in the collected signal, as we previously mentioned (Hegde et al., 2015). At frequencies of 40–200 Hz in steps of 20 Hz, measurements were taken. Experiments were conducted at magnetic field strengths of 0, 0.1, 0.2 and 0.3 T. The MRE samples were preconditioned eliminate the Mullin’s effect (Lion and Kardelky, 2004) and these cycles were performed until the steady-state response was achieved. Between the successive measurements, a gap of 15 min were given to eliminate the effect of deformation history on the measured readings (Stacer et al., 1990). For each trial, 10 cycles of data are considered and each set of experiment was for three times.
5. Results and discussion
Figure 7 shows a comparison between the dynamic stiffness of MRE with different matrix materials by varying the filler loading and magnetic field. The ‘0% CIP’ represents the unfilled state of MRE. MRE reinforced with 15% and 25% CIP are denoted as ‘15% CIP’ and ‘25% CIP’ respectively. As seen from the graph, the dynamic stiffness of MRE depends on matrix material. Under unfilled state, the highest value of dynamic stiffness is registered for NBR matrix based MRE. Si has the lowest dynamic stiffness value among the tested elastomers. The stiffness of NR is intermediate between NBR and Si. It is also evident that the dynamic stiffness is increased with frequency under unfilled state, implying the presence of pseudo-solid behaviour at higher frequencies (Poojary et al., 2016).
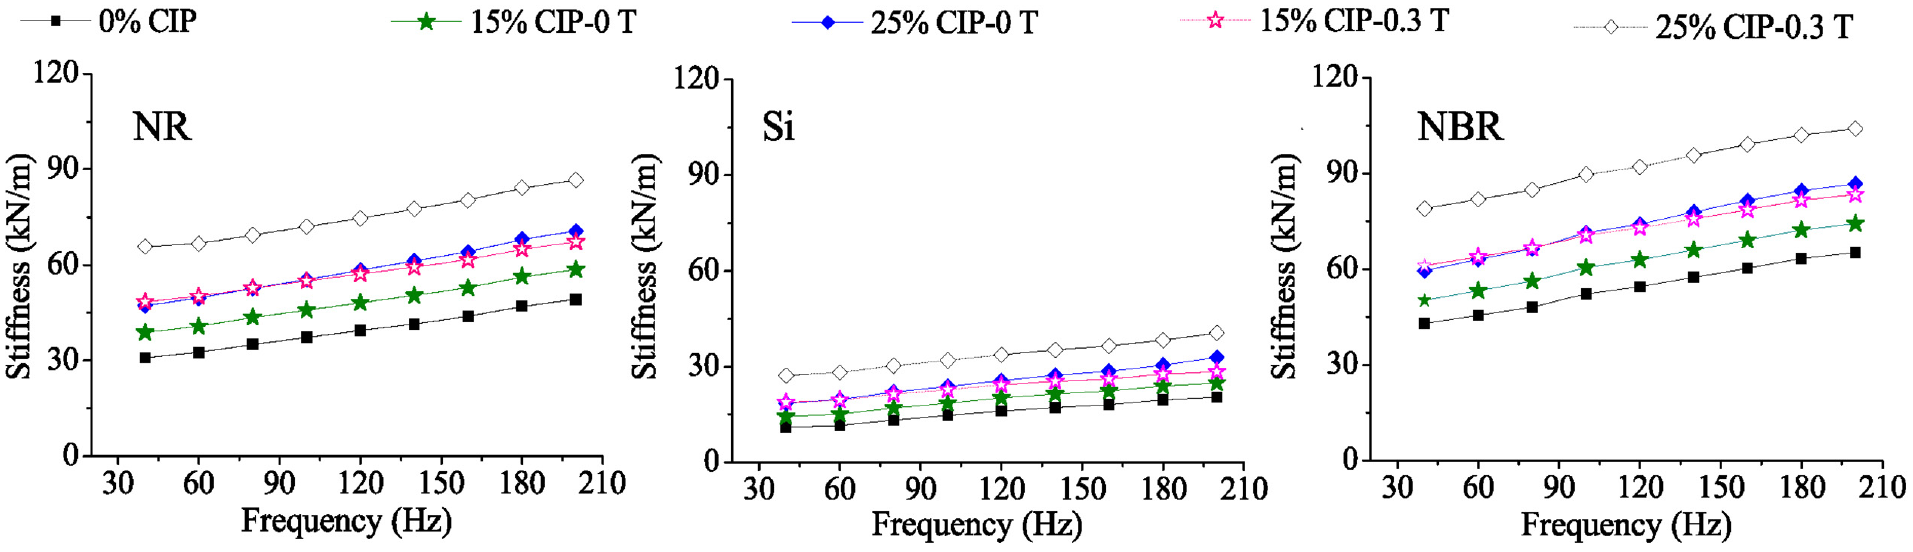
Effect of filler reinforcement and the magnetic field on the dynamic stiffness of MRE.
With the inclusion of CIP particles, the dynamic stiffness of MRE is significantly increased, as it acquires the properties of a filled rubber (Poojary et al., 2016). In addition, its response differ significantly under magnetized and non-magnetized states. The dynamic stiffness of NR-based MRE reinforced with 25% by volume of CIP is 49.57 kN/m at 60 Hz and 0 T magnetic flux density, and it increases to 66.65 kN/m at 0.3 T magnetic flux density. Enhancement in dynamic stiffness under magnetic field confirms the fact that magnetically sensitive fillers readily interact and alter the internal structure. Like the unfilled state of rubber, the stiffness of MRE increases with frequency for both magnetized and non-magnetized states. The addition of the CIP leads to more drastic increase in MRE stiffness as compared to magnetic field-induced enhancements. The matrix material determines the increase in dynamic stiffness of MRE as compared to the unfilled state. For the reinforcement of 25% by volume of CIP, the dynamic stiffness of MRE with NR matrix is increased from 32.51 to 49.57 kN/m at 60 Hz excitation frequency. Corresponding increase for Si rubber based MRE is from 11.544 to 19.70 kN/m, while for NBR it is increased from 45.51 to 63.07 kN/m. Furthermore, for NR, Si and NBR matrix based MRE, increasing the field strength from 0 to 0.3 T results in absolute increases of 17.08, 8.52 and 18.79 kN/m, respectively.
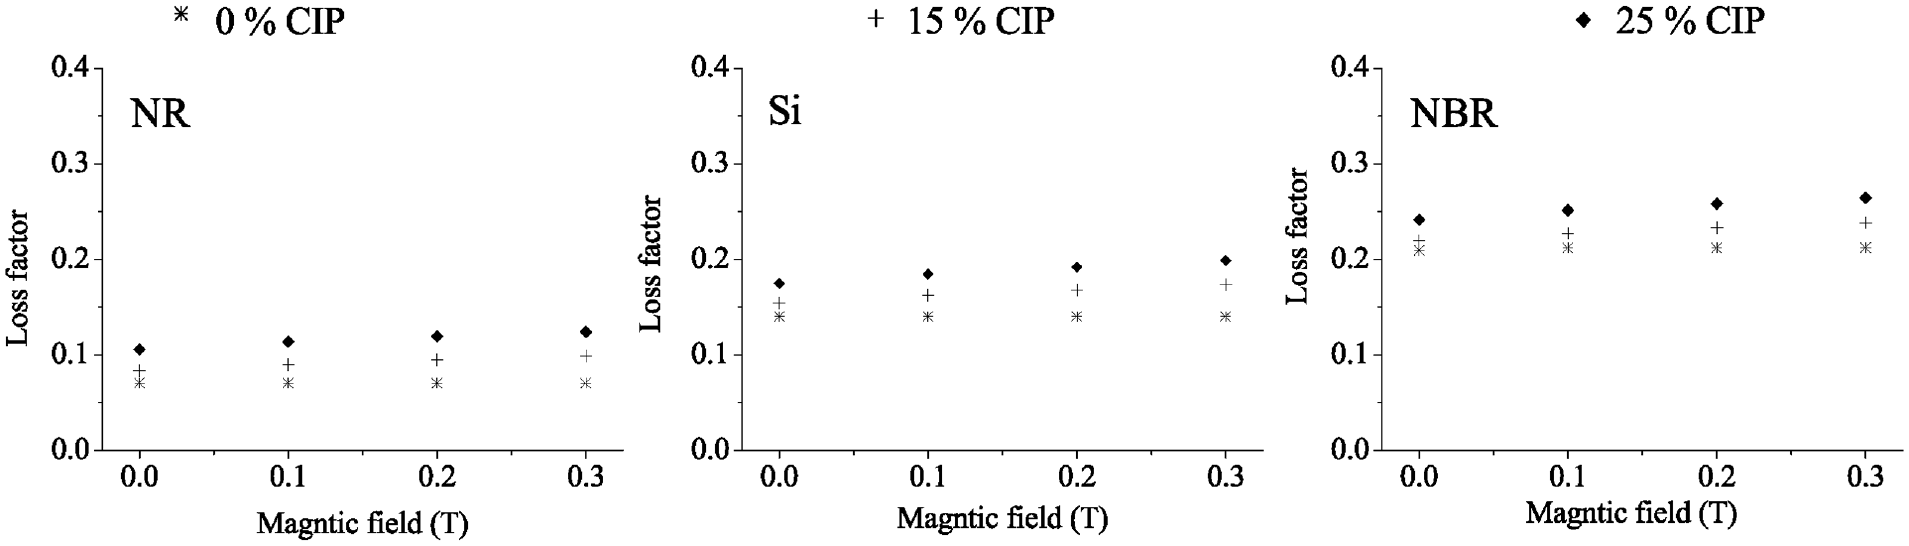
Variation in loss factor as function of matrix, filler reinforcement and magnetic field is shown in Figure 8. Natural rubber has the lowest loss factor in the unfilled state, while NBR has the greatest. Loss factor of silicone rubber falls between NR and NBR. It is also observed that the loss factor varies with excitation frequency, and it decreases with an increase in frequency. This confirms the dominance of elastic response of MRE over the viscous behaviour with an increase in frequency (Poojary et al., 2016). The addition of CIP enhances MRE’s loss factor, indicating that its energy dissipation capacity has improved. In the unfilled state, the loss factor for the NR-based MRE corresponding to 60 Hz is 0.0705, and with the addition of 15% CIP filler, it rises to 0.0835. With a further increase in reinforcement of CIP by 25%, the loss factor is increased to 0.1055. Similar trend is noticed for MRE with Si and NBR matrices. When the field intensity is increased from 0 to 0.3 T at 60 Hz input frequency, the loss factor of NR based MRE reinforced with 25% by volume of CIP increases from 0.1055 to 0.124. This confirms that interaction between the fillers contributes to the energy dissipation. For MRE reinforced with a higher volume fraction of CIP, the field-induced loss factor enhancements are more pronounced. Additionally, it is also observed that the varying trend in loss factor with respect to the frequency is independent of filler reinforcement as well as field-induced interactions.
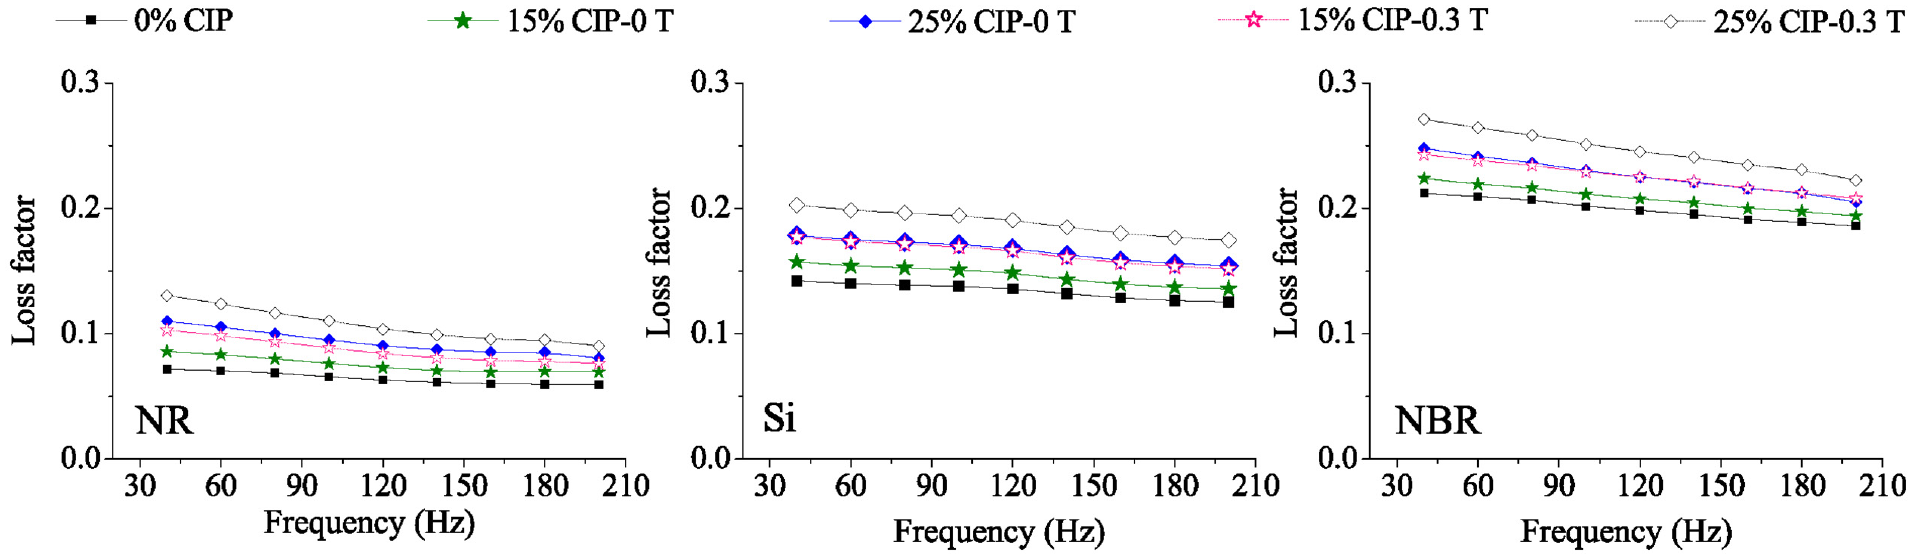
Effect of filler reinforcement and the magnetic field on the loss factor of MRE.
The loss factor and dynamic stiffness of MRE at 60 Hz excitation frequency are explored to understand the influence of matrix, filler reinforcement and the magnetic field on the dynamic response of MRE, and the associated graphs are provided in Figures 9 and 10. As shown in the graph, stiffness and loss factor are increased with the increase in CIP content and magnetic flux density. The larger value of stiffness is registered for MRE reinforced with 25% by volume of CIP, and it is further increased under magnetic field. A consistent trend in enhancement in stiffness and loss factor is noticed for MRE samples with NR, Si and NBR matrices. Under filled state of MRE, the disparity in the dynamic stiffness is more noticeable than the loss factor. On the contrary, the field sensitive variations depend on the properties of MRE sample under non-magnetized state. MRE with softer matrix is more responsive to the change in the field and it is relatively reduced for the MRE with stiffer matrix material.
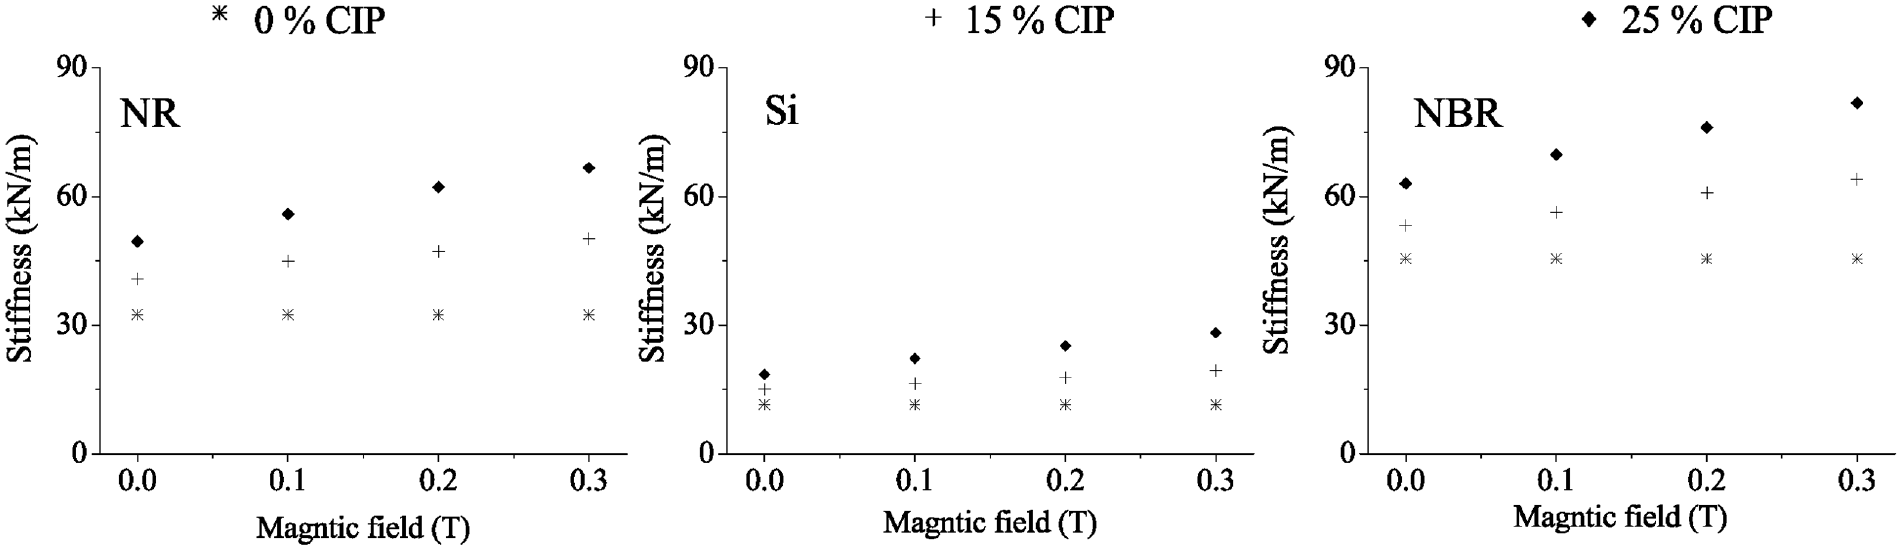
The effect of a magnetic field on the MRE’s dynamic stiffness at 60 Hz excitation frequency.
The effect of a magnetic field on the dynamic stiffness of MREs with excitation frequencies of 60 Hz.
The reinforcing effect and the MR effect are studied to assess the property enhancements due to the filler reinforcement and the magnetic field (Hegde et al., 2015; Lokander and Stenberg, 2003).The reinforcing effect are expressed as,

where,
The MR effect measures the difference in properties between the magnetized and non-magnetized states (0.3 T). It is expressed as,
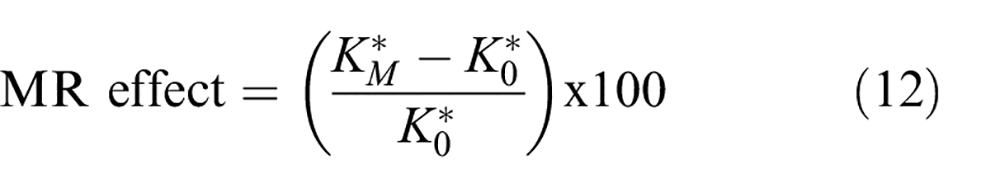
where,
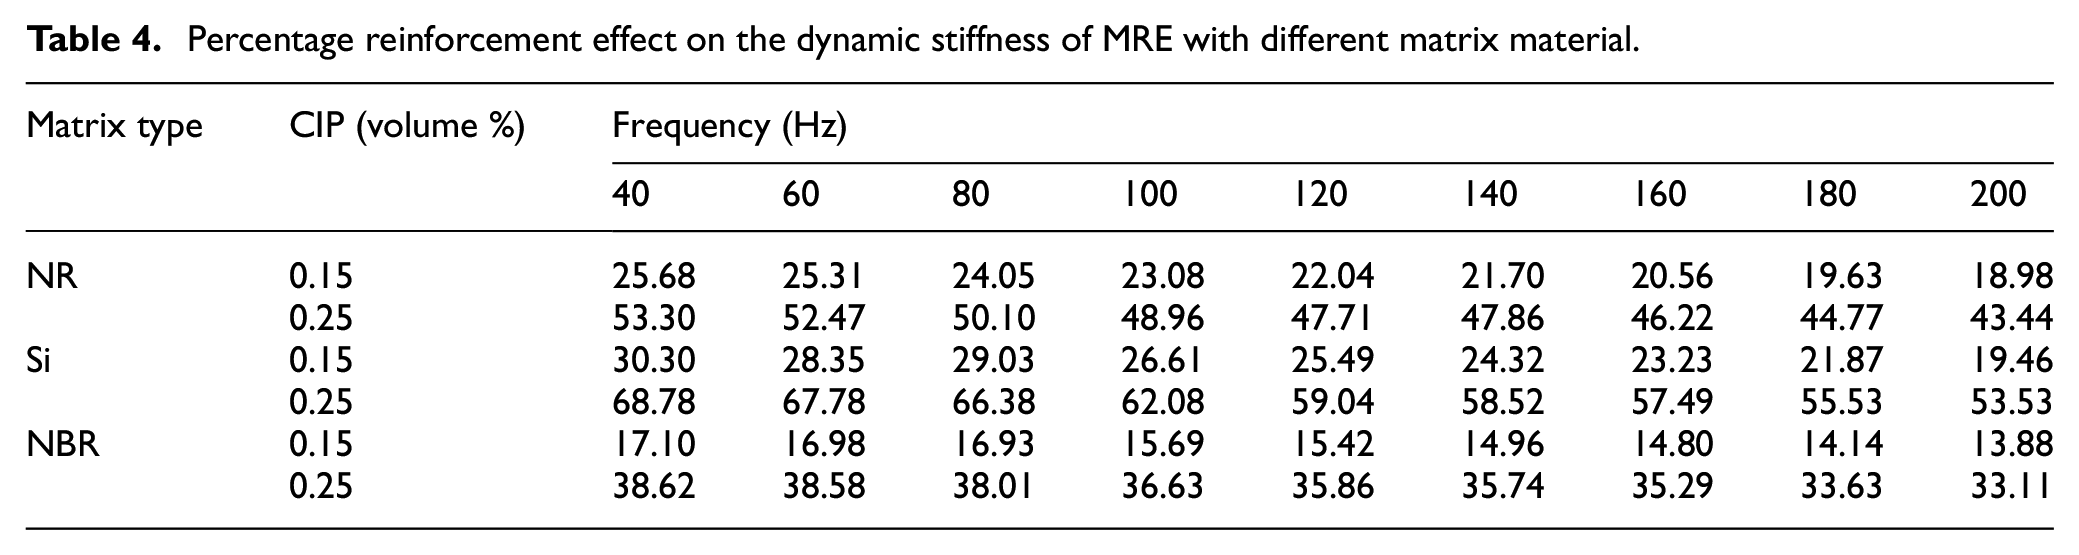
A comparison between the reinforcing effect and the MR effect (corresponding to 0.3 T) on the dynamic stiffness of MRE with different matrix material and varying levels of CIP reinforcement is presented in Tables 4 and 5. As evident from Table 3, the reinforcing effect on the MRE dynamic stiffness is monotonically increased with the addition of CIP. The Si-based MRE has a low initial stiffness, consequently the enhancements due to CIP addition are quite significant. At 60 Hz excitation frequency, with the addition of 15% by volume of CIP into Si rubber matrix, the stiffness is increased by 28.35% and further increasing the reinforcement to 25% by volume results in a total enhancement of 66.38%. The reinforcement effect is lowest for NBR-based MREs, and for NR based matrix, it is intermediate between the Si and NBR.
Percentage reinforcement effect on the dynamic stiffness of MRE with different matrix material.
Percentage MR effect on the dynamic stiffness of MRE with different matrix material.
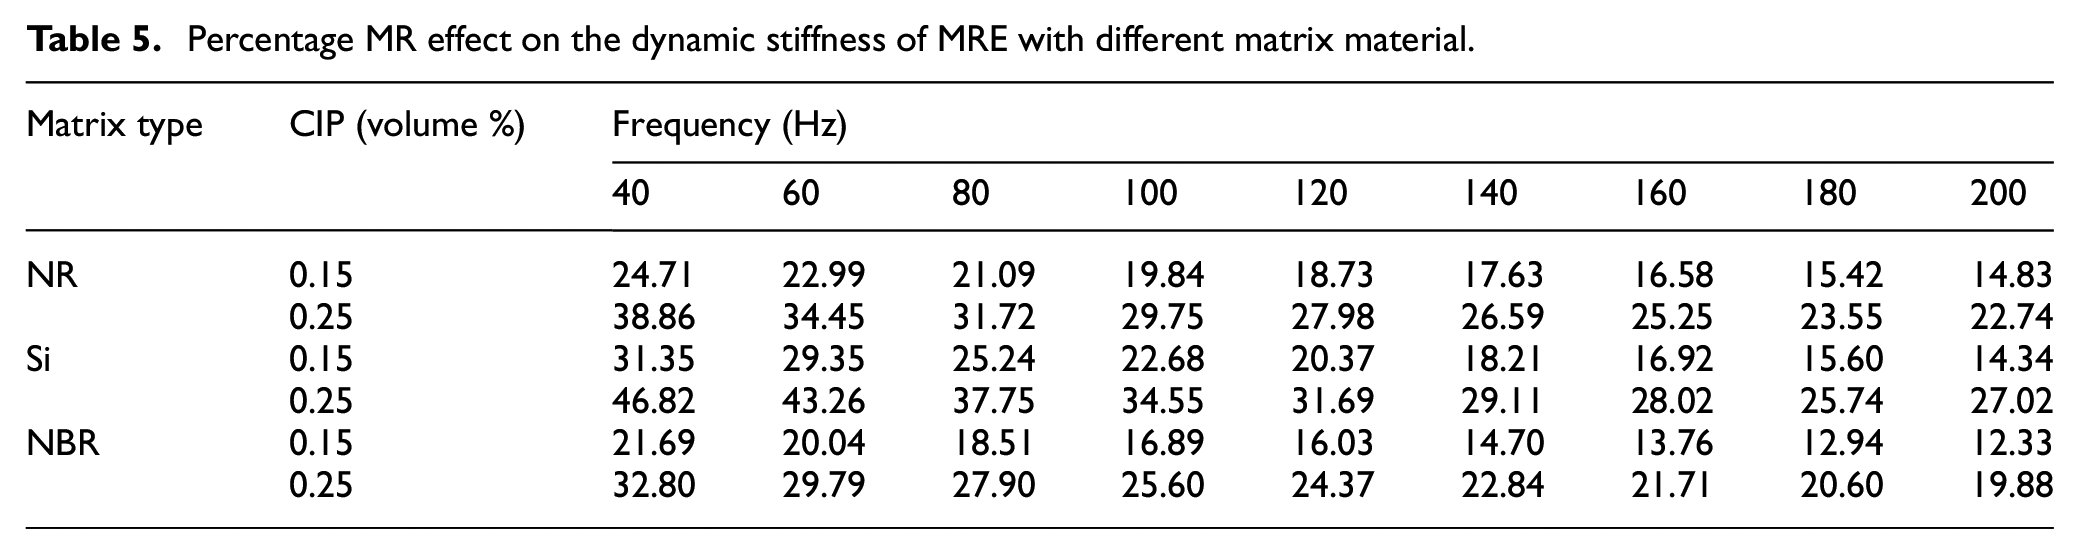
Table 4 reveals that at larger content of CIP, the MR effect is higher. Corresponding to a 60 Hz excitation frequency, the enhancement in dynamic stiffness for MRE reinforced with 15% by volume of CIP is 22.99%, 29.35% and 20.04% respectively for the NR, Si and NBR matrices. Further increasing the CIP content to 25% by volume, the MR effect is increased by 34.45%, 43.26% and 29.79% respectively for NR, Si and NBR based MREs. The MR effect is maximum for the MRE with Si matrix, and least for matrix made of NBR. This deviation can be attributed to the properties of MRE under the non-magnetized state where a lower zero field modulus results in a larger MR effect. Despite the fact that MRE reinforced with 15% CIP has a lower dynamic stiffness than MRE reinforced with 25% CIP, the MR effect is stronger in the latter case because the due to increased sensitivity to the magnetic field. Furthermore, enhancement in dynamic stiffness with respect to the frequency and magnetic field is frequency dependent and these enhancements are more pronounced at lower frequencies; however, when the frequency is increased, the enhancements become less prominent.
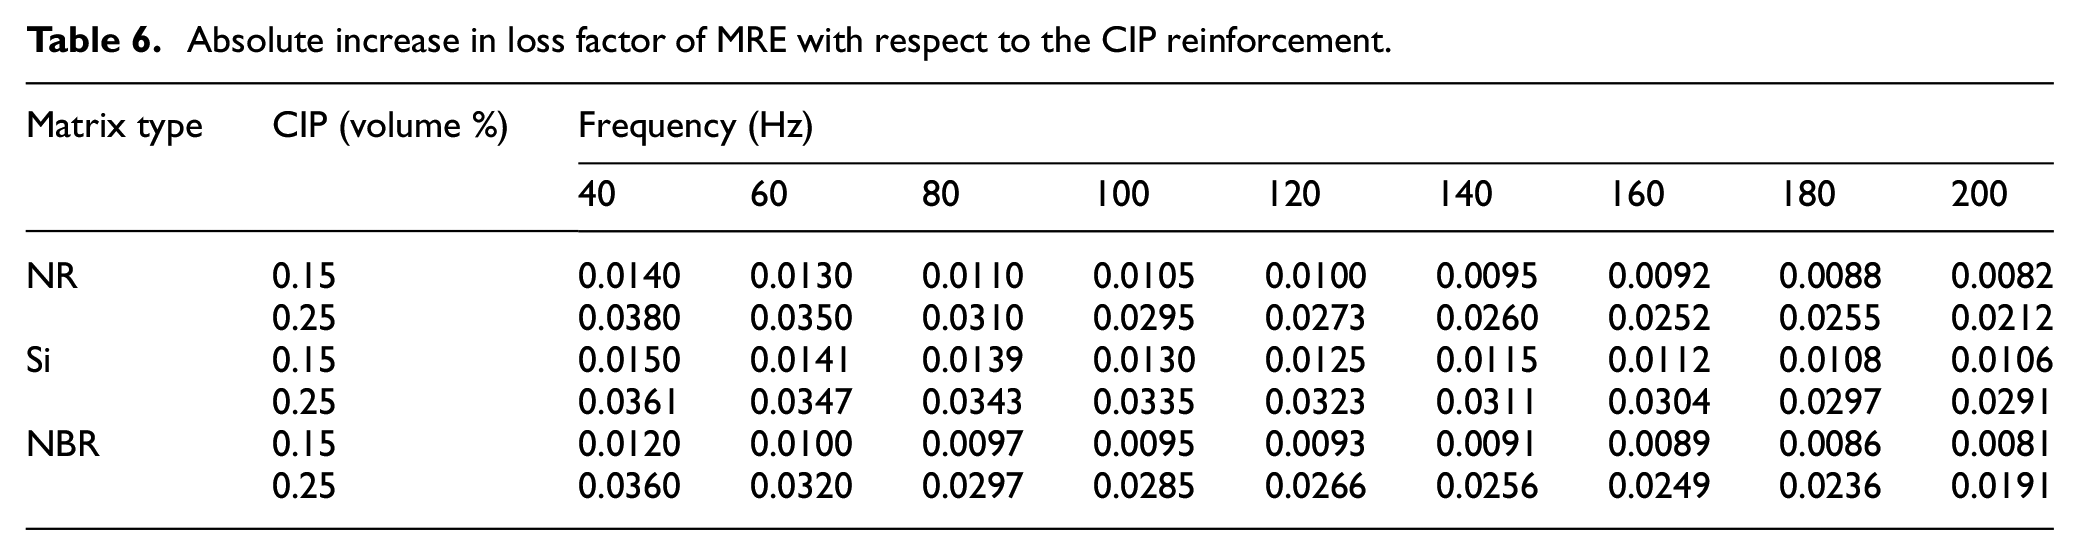
Tables 6 and 7 illustrate the absolute increase in loss factor of MRE owing to CIP reinforcement and the magnetic field (0.3 T). The absolute increase in loss factor with respect to CIP reinforcement is the difference in loss factor under filled and unfilled state. As seen from Table 5, the loss factor of MRE increases by the addition of CIP. When NR-based MRE is reinforced by 15% by volume of CIP at 60 Hz excitation frequency, the loss factor increases by 0.0130. Further addition of CIP (25% by volume), the loss factor is increased by 0.0350. Similar trends are noticed for MRE with Si and NBR matrices.
Absolute increase in loss factor of MRE with respect to the CIP reinforcement.
Absolute increase in loss factor of MRE under the magnetic field (0.3 T).
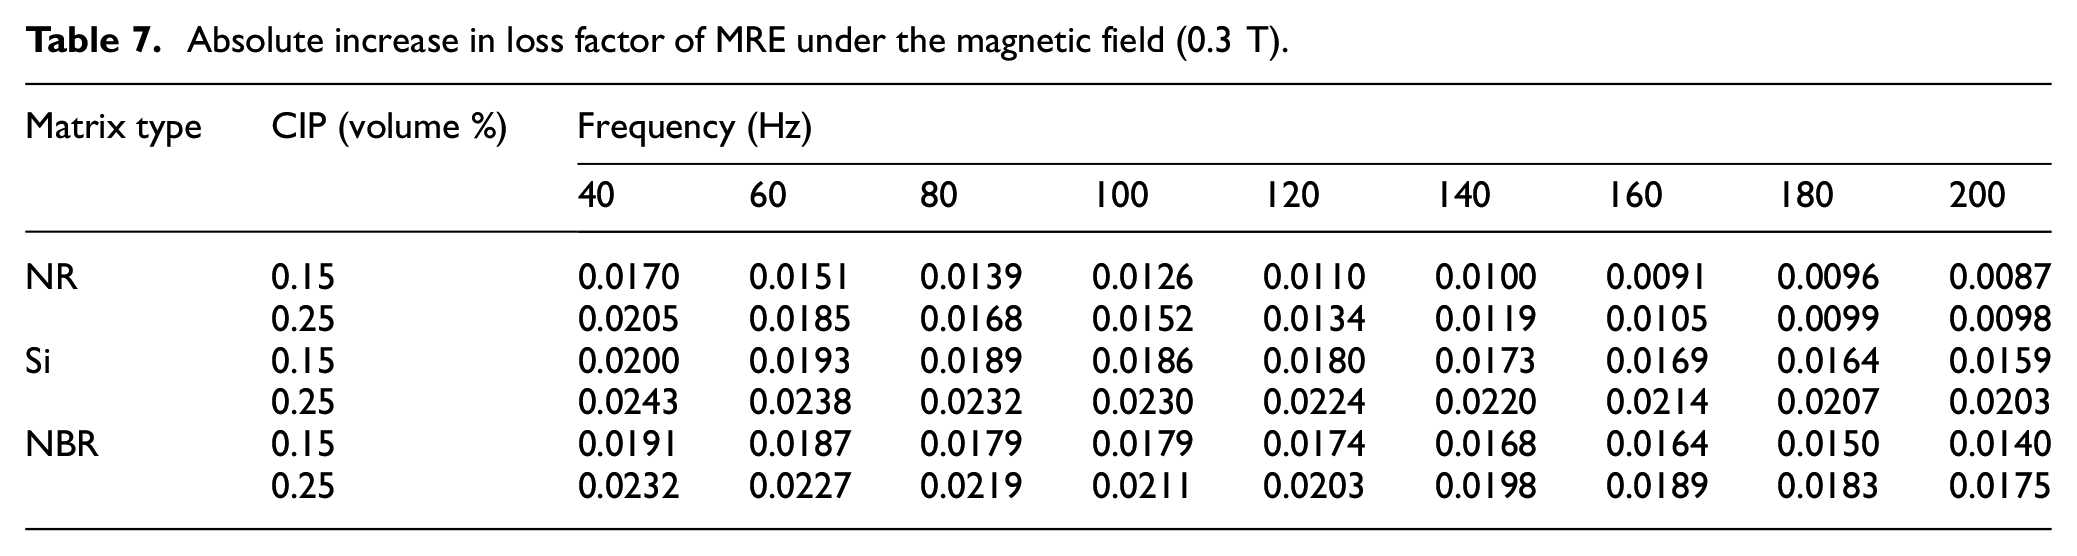
Table 5 shows the enhancement in loss factor under the influence of magnetic field. It compares the loss factor of MRE under magnetized (0.3 T) and non-magnetized state. The loss factor increases as the magnetic field becomes stronger. The loss factor of NR based MRE reinforced with 15% by volume of CIP is increased by 0.0151 at 60 Hz frequency. The corresponding value for reinforcement level of 25% by volume of CIP is 0.0185. MRE samples based on Si and NBR matrices show similar tendencies. Furthermore, it is obvious that the increase in loss factor due to CIP reinforcement is greater than the increase in loss factor due to magnetic field, but these differences are not significant. Additionally, it is also evident that the excitation frequency has a mild dependency on the enhancement in loss factor due to CIP reinforcement, and the magnetic field.
6. Discussion
Dynamic response of MRE is influenced by stiffness and damping. Stiffness refers to the material’s ability to absorb vibration energy, whereas damping refers to the energy dissipation in the form of heat. The loss factor is used to determine how much damping is there in the system. Stiffness and the loss factor of MRE are represented according to the equations (2) and (3). The K″ is related to energy dissipation Wd as (Brown, 1996),
where X0 is the peak amplitude of input displacement. According to equation (12), increase in dissipation of energy leads to an increase in K″.
As shown in the graphs (Figures 7 and 8), the stiffness and loss factor vary depending on the type of matrix. It also varies with the addition of CIP and exposure to the magnetic field. By accounting these factors, the modified form of the stiffness and loss factor are represented by
The ΔK′ and ΔK″ are the incremental changes that account for the variations in stiffness values with the type of matrix, reinforcement of CIP and the magnetic field. A comparison between the K′ and K″ for NR, Si and NBR based matrices with different volume fraction of CIP reinforcement and magnetic field are presented in Figure 11. These plots confirm that the K′ and K″ are sensitive to the percentage of CIP and the field strength. Furthermore, depending on the type of matrix material, these properties vary significantly.
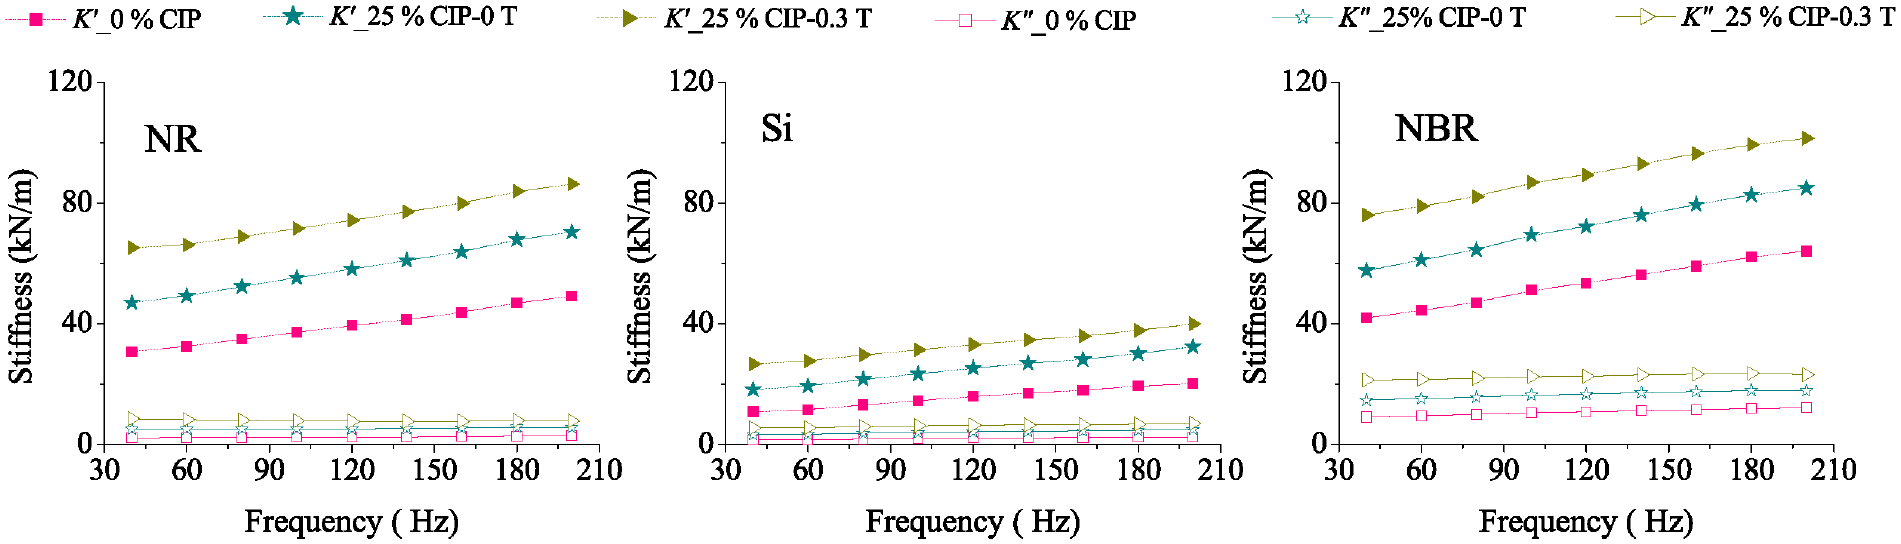
Variation of K′ and K″ for MRE with different matrices, filler percentage and magnetic field.
Typically, the properties of filled rubber are governed by the characteristics of the unfilled elastomer. The major factor contributing to the strength of polymer is the network of molecular chains. The elastomer comprises of a long chain of molecules interconnected by the chemical cross links. These cross links restrict chain movement, resulting in a response that is a combination of viscous and elastic effects (Lei et al., 2020; Pothen et al., 2013). The cross links are the topological constraints that decrease the number of accessible rotational degrees of freedom of the molecules. The cross link density is successfully employed as a base structure parameter to explain the properties of an elastomer (Baboo et al., 2016; Lei et al., 2020; Meinecke, 1991). It represents the number of network chains per unit volume. The rubber with low cross link density will experience lesser resistance for the flow of chains and can easily deform in response to the applied force. On the other side, a network with a higher cross link density will have a higher flow resistance (Pothen et al., 2013). As a result, a matrix with a higher cross link density will have a higher K′, while one with a lower cross link density will have a lower K″.
This means that the dynamic stiffness of the matrix with the higher cross link density is higher (Lei et al., 2020; Lemieux and Killgoar, 1984; Meinecke, 1991). However, the loss factor is not exhibiting the similar behaviour. The loss factor is a ratio in which the K″ is inversely related to the cross-linking density and the K′ is directly proportional. Thus, the loss factor depends on both the quantities. Therefore, it would not be ideal to say that the loss factor is effected with the cross link density (Fan et al., 2013; Meinecke, 1991). On the contrary a fair assessment can be made with respect to the variation in the K′ and K″. Accordingly, the NBR is having a larger K′ that substantiate fact that having a greater cross link density. The Si have a lower cross link density and also it is relatively softer matrix as it requires lesser energy to induce the moments to the tightly conjunct polymer segments. The NR has a cross link density that is between the NBR and the Si. The lower damping of NR is accounted for the larger diffrence between the K′ and K″ values under unfilled state of the NBR. However for NBR, the K″ is significant compared to K′, that subsequently resulted in relatively larger values of loss factor.
The properties of rubber is altered by the hydrodynamic effect induced due to the addition of the fillers. With the inclusion of fillers in the matrix, the crosslink density is increased significantly as the interface of the fillers serve as the localized cross links which subsequently resticts the motion of elastomer chains and enhances the K′ (Fan et al., 2013; Meinecke, 1991; Polmanteer and Lentz, 1975; Poojary et al., 2016; Pothen et al., 2013). Figure 12 displays an illustration of a unit cell of MRE in the filled and unfilled states to demonstrate the influence of CIP loading on the characteristics of MRE. As stated above, the matrix material is distinguished with respect to the cross-link density. An elastomer with lower cross-link density is represented in Figure 12(a) and Figure 12 (c) depicts the elastomer with higher cross link density. The matrix with higher crosslink density experiences more friction as the chains are densely packed. In addition, it experiences more restriction to the flexibility of the polymer links. On the contrary, molecular chains of the rubber with low cross-link density have relatively lesser restriction to the motion of the molecular chains. This signifies the fact that the dynamic stiffness is larger for elastomer with high cross link density, and it is decreased for the matrix with low crosslink density.
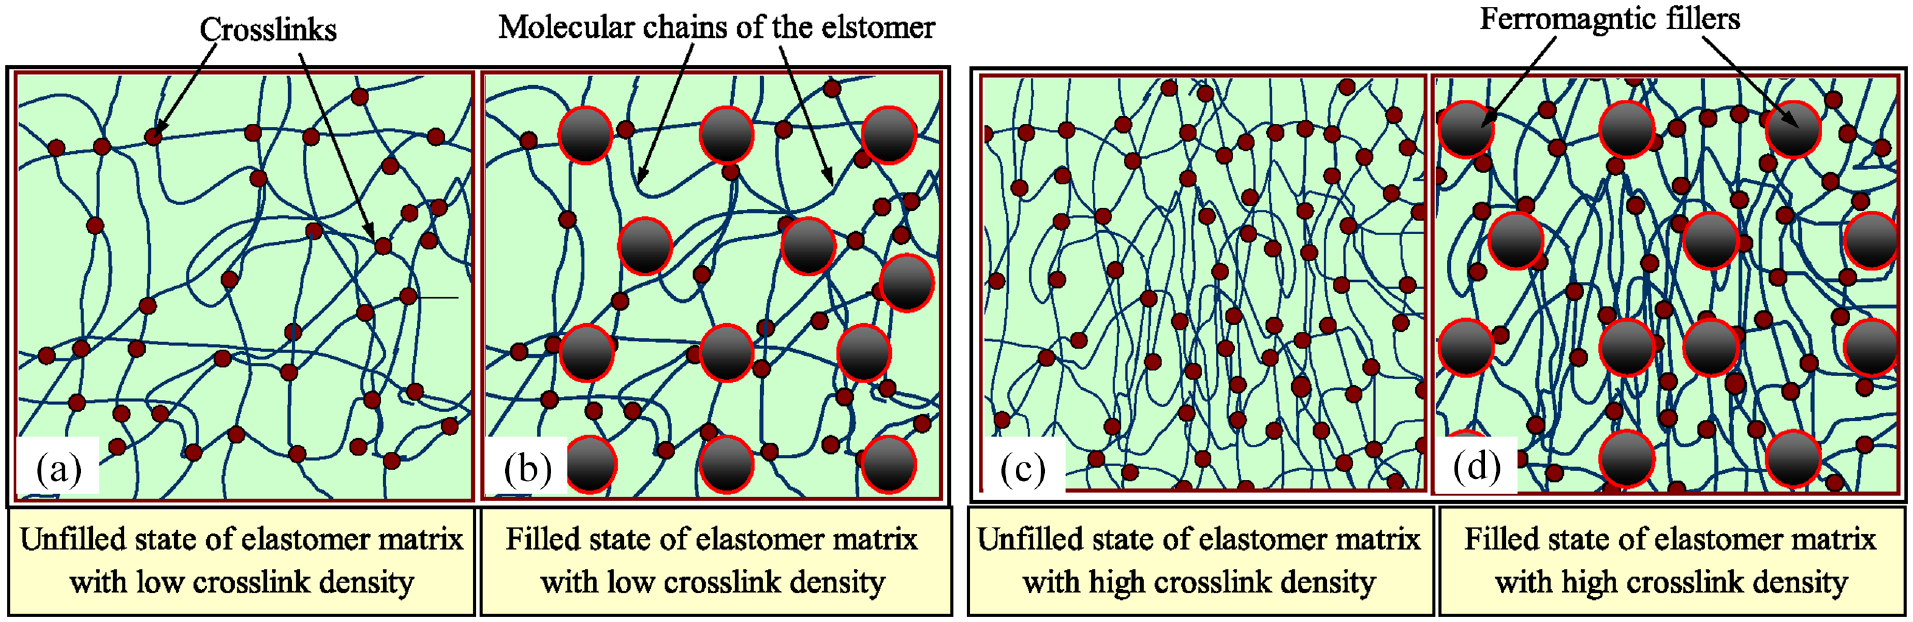
(a-b) Filled and unfilled state of elastomer with low cross-link density matrix, (c-d) Filled and unfilled state of elastomer with high cross-link density matrix.
The filled state of the elastomer is embodied in Figure 12 (b) and (d). As apparent from these images, crosslink density is increased with the inclusion of CIP in the matrix as the fillers function as localized cross-links, which subsequently restrain the mobility of polymer chains. As shown in Figure 12 (d), these effects are relatively larger for the MRE with matrix having higher crosslink density. However, the effect is relatively lower for MRE synthesized with lower crosslink density matrix (Figure 12(c)). Additionally, under filled state, apart from the viscous drag, other sort of heat generation is rubbing between the iron particles, friction among the rubber molecules and the chain at the interface. The interface amid the matrix and the filler becomes more defined as the filler content increases. As a result, the interaction among the fillers and the matrix increases, resulting in increased energy dissipation and, as a result, larger K″ according to equation (13) (Chen et al., 2008b; Fan et al., 2013; Li and Gong, 2008; Pothen et al., 2013). These aspects can be evident from the variation in K′ and K″ with the addition of CIP (Figure 11). The constraint to the movement of the polymer chains under sinusoidal loading is responsible for the increase in K′. On the contrary, the increasing trend in K″ is associated with the enhancement in the energy dissipation. The incremental changes K′ and K″ resulted in the overall variations in the MRE loss factor. For natural rubber, the loss factor is low as the addition of fillers could not induce a larger variation in K″. However, for the NBR, values of K″ is significant compared to K′ that subsequently resulted in larger values of the loss factor (Hazelton and Puydak, 1971).
As frequency increases, the dynamic stiffness of MRE is increased. At lower frequencies, the elastomer chains have enough time to rearrange, so the viscous effect dominates the overall response of MRE. The mobility of the polymer chain decreases as frequency increases, and the bulk polymer chains become rigid, offering more resistance to the applied load. Thus, elastic effects dominate the response of MRE at higher frequencies. Additionally, presence of CIP restricts the movement of polymer chains, resulting in higher stiffness as frequency reaches a relatively larger value. Furthermore, with increase in frequency, the enhancement in K′ is more noticeable compared to the frequency dependant increase in K″. Consequently, as the frequency of excitation increases, the loss factor decreases.
The dynamic viscoelastic characteristics of MRE vary under the effect of field as the magnetically sensitive CIPs act as magnetic dipoles. Figure 13 depicts the state of MRE unit cell under magnetized and non-magnetized state (Davis, 1999; Jolly et al., 1996; Poojary and Gangadharan, 2016; Poojary et al., 2016, 2017). The MRE unit cell (Figure 13(a)) is made up of two fillers separated by an elastomer matrix. When the field is on, the iron particles interact and exert a normal force F on the elastomer between the fillers, as shown in Figure 13(b) and (c) (Poojary et al., 2016). These interactions depend on the distance between the fillers and the medium separating them. Figure 13(b) and (c) represents the state of MRE unit cell with softer and stiffer matrix respectively. As evident from Figure 13(b), a softer matrix exhibits lesser resistance against the deformation induced due to the force F, which resulted in a displacement of the fillers by an amount X1. On the contrary, MRE with stiffer matrix experiences relatively larger restrain against the deformation, which consequently resulted in a displacement of X2 of the fillers with respect to the initial configuration. In comparison with the stiffer matrix, the motion of the fillers are easier in the matrix with softer matrix. This difference can clearly make out, as the displacement, X1 is larger than X2. As a result, the internal structure of the MRE with the softer matrix changes more, resulting in larger field-induced enhancements in the magnetic state. Furthermore, the mobility of the fillers is relatively easier in MRE with softer matrix, which enhances the magnitude of F. As a result, the MR effect is most pronounced for Si-based MRE and least pronounced for NBR-based MRE among the studied MRE samples. In addition the normal force at the interface at increases the friction, which further enhances the energy dissipation at the boundary and thereby contributing to the enhancement in K″ (Chen et al., 2008b; Li and Gong, 2008; Poojary et al., 2016).
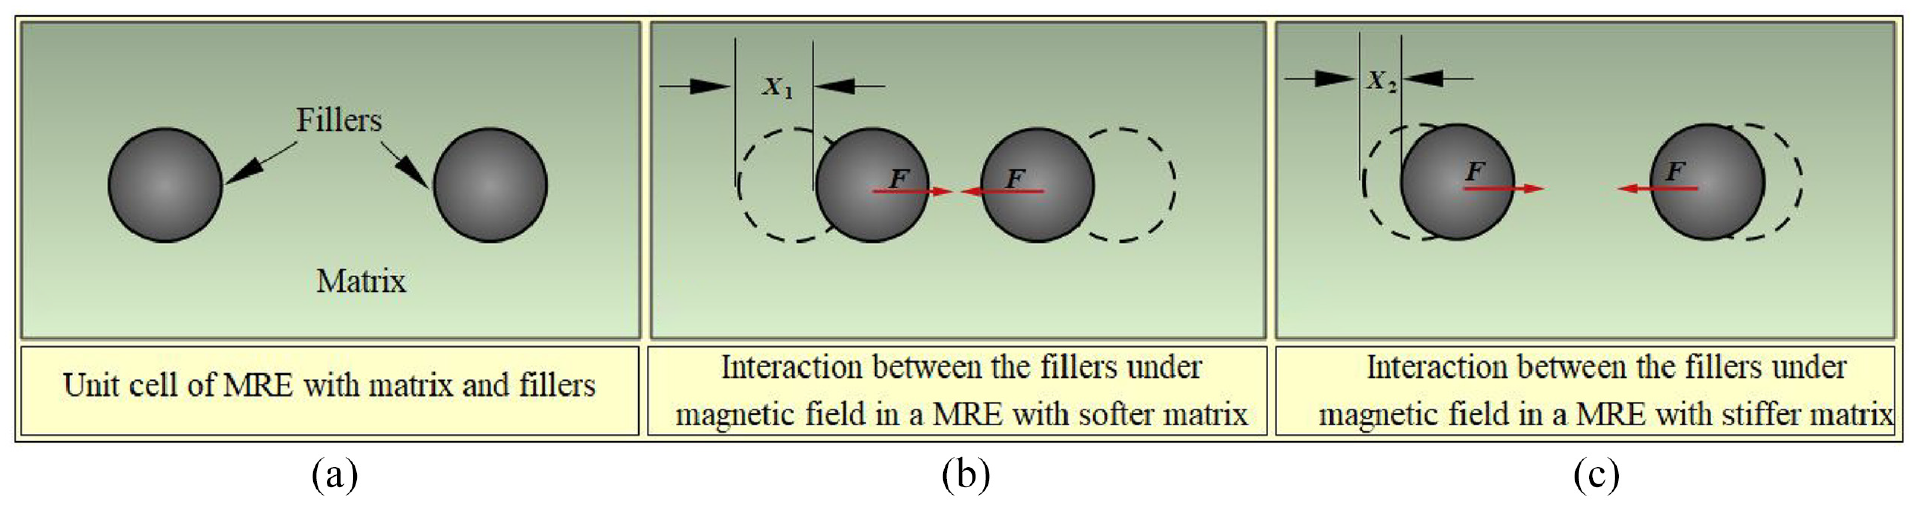
(a) A unit cell of MRE, (b) Magnetic field induced interaction between the fillers in a unit cell with softer matrix, and (c) Magnetic field induced interaction between the fillers in a unit cell with stiffer matrix.
Because the MRE device must be able to tolerate vibrations over a wide frequency range, it is vital to use MRE as a robust material for vibration mitigation applications. MRE’s ability to respond to a magnetic field is determined by the matrix material. A softer matrix or an elastomer with a low crosslink density will provide less barrier to CIP movement when exposed to a magnetic field. The magnetically active fillers experience a higher resistance as the cross-link density increases, which leads to the reduction in field induced enhancement. A medium with a larger cross-link density, on the other hand, has a higher load bearing capability and is better suited to heavy-duty applications. In addition, the cross-link density and the interaction between the fillers affect MRE’s ability to dissipate energy. Moreover, it is the fact that addition of filler enhances the properties of MRE and exposing it to the magnetic field, the properties are increased further. The variation in the energy absorbing characteristics of MRE are pronounced compared to the energy dissipation ability. However, these variations mainly depend on the properties under unfilled state. Any modification under the filled state of MRE could change the properties, but these variations do not cause a remarkable change in the properties. Thus, it is critical that for MRE based applications, a fair trade-off is essential while selecting the matrix material to meet the prerequisite of a specific application.
7. Conclusion
The focus of this research is on studying the effect of matrix material on the dynamic viscoelastic characteristics of MRE. The dynamic stiffness and loss factor of MRE are investigated from the forced vibration tests. Dynamic viscoelastic property of MRE is determined as a function of matrix medium and CIP content. MRE attains the characteristics of a filled elastomer when CIP is added to the matrix. These qualities change with excitation frequency, with the largest change occurring at 40 Hz, the lowest excitation frequency being tested in this study. For 15% by volume of CIP reinforcement, the maximum increase in dynamic stiffness of MRE with Si matrix is 30.30%, whereas for 25% volume of CIP, the maximum enhancement is limited to 68.78%. CIP reinforcement affects the loss factor as well. The loss factor of Si based MRE can be raised by 0.0361 with the reinforcement of 25% volume of CIP.
The properties MRE is modified by exposing it to the magnetic field. This enhancement is a function of content of CIP and the magnitude of the magnetic flux density. Maximum field induced enhancement in the dynamic stiffness of Si matrix based MRE at 0.3 T and for a reinforcement of 15% CIP is 31.35%. Further increasing the content of CIP to 25% by volume of CIP, the maximum enhancement is limited to 46.82%. The loss factor is also dependant on the magnetic flux density. For a reinforcement of 25% volume of CIP, under the influence of 0.3 T magnetic flux density, the loss factor of Si based MRE can be increased by an amount of 0.0243.
The matrix is very crucial in regulating the properties of MRE in both active and passive. Under passive state, inclusion of fillers enhances the properties, but the overall enhancements depend on the type of matrix. A softer matrix that is characterized by lower dynamic stiffness has higher reinforcing effect, and it is lesser for the matrix with the higher initial stiffness. However, commenting on MRE loss factor variation would be inappropriate because it is a consequence of storage and dissipation behaviour. The loss factor is quite low for matrices with a larger gap between the real and imaginary components of the dynamic stiffness. The loss factor gets increasingly substantial as the difference between the real and imaginary parts of the dynamic stiffness decreases. When a magnetic field is applied, the matrix filler interface plays an important role in the overall improvement in dynamic stiffness. The magnetic field is more susceptible to MRE with a softer matrix. MRE manufactured with a stiffer matrix has lower field sensitive characteristics. MRE with Si matrix is more sensitive to the applied magnetic field, it can yield a maximum enhancement in its dynamic stiffness of 46.82% for the magnetic flux density of 0.3 T. NBR which is a stiffer among the tested matrices have a least value with a maximum enhancement of 32.80%. It is clear that a stiffer matrix is more effective for the load-bearing capacity but it is less sensitive to the filler reinforcement and the magnetic field. However, a softer matrix can yield a better field induced enhancement but it is not preferred for high load bearing applications. To meet the specific application a careful consideration on these aspects important to select the suitable MRE. Also, the enhancements in the properties of MRE with the addition of CIP and exposure to the magnetic field depend on the properties of elastomer under unfilled state, and it is important that these properties should be the reference for the selection of the matrix material for the MRE.
Footnotes
Declaration of conflicting interests
The author(s) declared no potential conflicts of interest with respect to the research, authorship, and/or publication of this article.
Funding
The author(s) disclosed receipt of the following financial support for the research, authorship, and/or publication of this article: The authors acknowledge financial support from SOLVE: The Virtual Lab @ NITK (Grant number: No.F.16-35/2009-DL MHRD) (![]() ) and investigative support from the Centre for System Design ((CSD): www.solve.nitk.ac.in). NITK-Surathkal has established a Center of Excellence.
) and investigative support from the Centre for System Design ((CSD): www.solve.nitk.ac.in). NITK-Surathkal has established a Center of Excellence.