
Abstract
An electromechanical impedance (EMI) based structural health monitoring (SHM) approach is proposed for the localisation of skin-core debonds in composite sandwich structure (CSS). Towards this, laboratory experiments and numerical simulations of EMI in a CSS with core to bottom face-sheet debond have been carried out using a network of piezoelectric transducers (PZTs). The frequency-domain analysis of the registered EMI signals shows that the presence of inter-facial debonds in the CSS significantly influences the conductance magnitudes of the registered EMI data. It was also noticed that the conductance magnitudes of the signals are dependent on the debond-to-PZT distances. In all the study cases, an agreement between the simulation and experimental results is observed. Eventually, a simulated SHM approach is proposed that uses a debond detection algorithm to calculate the changes in conductance magnitudes to effectively locate such debonds in CSS. The study is further extended for the detection of debonds at different locations in the CSS, including a debond located at the edge to assess the potential of the proposed SHM approach.
Keywords
1. Introduction
The electromechanical impedance (EMI) based non-destructive evaluation (NDE) strategies have proven their potential in the detection of structural defects, due to their inspection capacity under hazardous environments (Soh et al., 2012). The present EMI based NDE techniques involve the application of cost-effective and lightweight piezoelectric transducers (PZTs) (Qing et al., 2019). It is described that electrical impedance is related to the mechanical impedance of the structure and the presence of damage in the structure alters impedance responses in EMI based measurements (Albakri and Tarazaga, 2017; Liang et al., 1997). A comparative study of electromechanical (EM) admittance and structural mechanical impedance (SMI) is presented by Yang et al. (2008). The study showed that the SMI is more sensitive to the damage than the EM admittance for concrete structures. The EMI method uses damage-identification formulas such as, root mean square deviation (RMSD), mean absolute percentage deviation (MAPD) and correlation coefficient (Giurgiutiu and Rogers, 1998; Huynh et al., 2017; Zagrai and Giurgiutiu, 2001). These metrics are usually based on a comparison of the healthy and damage spectrum. Giurgiutiu and Rogers (1998) mentioned that the successful detection of damage depends on the careful selection of the frequency band and the damage metric. A statistical damage metric and a probabilistic neural network are also applied to classify the EMI spectral data and identify the damage severity with near-field and medium-field frequency range in the EMI method (Giurgiutiu and Zagrai, 2005). Zuo et al. (2017) proposed a damage-sensitive feature extraction method based on a modified EMI technique that involves information from multiple sensors for crack detection in pipelines. The RMSD measurements are used to examine the severity and location of cracks in pipelines. Zhu et al. (2019) proposed a methodology for extracting the direct coupling mechanical impedance signatures. The authors used the RMSD index of the damage signatures obtained from a modified analytical EMI model of raw signatures for a honeycomb composite sandwich structure. However, identifying damage location and severity is always difficult using these damage metric-based approaches. Park et al. (2008) applied a principal component analysis (PCA) based data compression method in wireless sensor-network to identify damage in a metallic structure. The authors implemented RMSD with PCA and k-means clustering technique to remove unexpected environmental noise and claimed a better capability than the traditional approach.
Further, a finite element modelling based EMI method is proposed for damage location identification in beam-like structures using higher modes of admittance signal (Naidu and Soh, 2004). The damage locations are identified by correlating the changes in the natural frequencies of the equivalent finite element model of the undamaged structure. Park et al. (2005) presented an outlier detection framework in the frequency domain to diagnose damage with statistical confidence over traditional approaches. A modified auto-regressive model with exogenous inputs (ARX) in the frequency domain was described where the damage sensitive features were extracted based on the differences between the impedance and the ARX model results. Ezzat et al. (2020) presented a statistical calibration formulation that achieve the closest match between the outputs from a finite element model and the experimental data collected from the host structure. This statistical formulation was coupled with a pre-screening procedure to predict the impedance changes for quantifying the damage severity to enhance both fault diagnosis capability and computational efficiency. A model updating of EMI sensitivity and sparse regularisation based structural damage identification approach was introduced by Fan et al. (2018). The resonance frequency shifts in impedance responses concerning the stiffness parameters of the host structure to identify the location and severity of the damage. A chessboard distance metric was used to detect the damage severity in different temperature conditions using the EMI signature of the different frequency intervals (Wandowski et al., 2015). A united mechanical impedance (UMI) which combines the mechanical impedance of the structure as well as PZT sensors to interrogate the damage by showing the variation in the structural properties is presented by Ai et al. (2014). The theoretically derived UMI from EMI was implemented for corrosion damage detection in steel beams. Tinoco et al. (2016) proposed a decoupling of electrical signatures obtained from an array of coupled electrical impedances of piezo transducers for damage monitoring using EMI technique. The authors used damage metrics based on the ellipse of Gaussian confidence to locate the induced damage in the structure. An extreme learning method-based damage detection technique is proposed for notch damage localisation in aluminium beams using EMI signals (Djemana et al., 2017). In the recent study Singh et al. (2020, 2021) demonstrated the optimised data fusion based approach using the Conductance (G(S)) and resistance (R) variables to make robust damage detection. In the paper, both aluminium and composite data are studied using the multiplication of the variables as well as PCA. Towards the analysis of the effectiveness of the EMI method in handling practical issues like noise, the Hinkley criteria based analysis was performed on CFRP panels for the assessment of damage sensitive features in the EMI data (de Castro et al., 2019). Further, a new impedance-based imaging algorithm was used for the damage localisation in the aluminium structure under a noisy environment (de Castro et al., 2020).
Some researchers considered the time-domain EMI signals since the frequency domain spectrum is not suitable for some cases (Vieira et al., 2011; Zahedi and Huang, 2017). Zahedi and Huang (2017) used a time-frequency domain based physical connection to damage characterisation as the EMI methods are prone to influence due to ambient temperature variation. The authors converted the frequency domain EMI spectrum to a pulse-echo time-domain signal and observed that structural damage generates extra echo signals and the bonding damage affects the resonant features of PZTs. Further, an EMI based damage assessment using PCA in the time domain for frequency response function (FRF) was presented by De Oliveira et al. (2014). The authors used principal component coefficient based statistical indexes in damage detection of aircraft aluminium panels. A fourth-order voltage statistical moment-based damage indicator using the EMI based differential evolution algorithm was proposed by Zhou et al. (2018). Cracks in steel beams were investigated using time-domain voltage response for the several transducers for the desired accuracy range.
The use of composite sandwich structure (CSS) is gaining popularity in safety-critical engineering (e.g. aerospace, automatable, marine) applications, due to their high stiffness-to-weight ratios, high specific bending stiffness, and resistance against moisture, noise and fire. But, these structures are often prone to debond at the skin-core junctions due to ageing, impact, improper handling and cyclic-loading (Gay and Hoa, 2007; Sikdar and Pal, 2021). It is important to effectively identify such hidden debonds in CSS like complex composite structures. Xu and Liu (2002) presented a modified EMI model of the spring-mass damper system in debonding detection of the composite patches. The debond was assumed as an infinitesimal length spring between composite patches and its base structure. The debond monitoring using the EMI method was also carried out for fibre-reinforced polymer (FRP) strengthened concrete structures using the traditional damage indices (Li et al., 2018; Shi et al., 2018). A cross-correlation based analysis was used to quantify debonding in a carbon fibre-reinforced polymer (CFRP) laminated concrete structure using an impedance-based wireless SHM technique (Park et al., 2011). Further, the PZT and strain data was used to monitor early-stage debonding detection in FRP shear-strengthened reinforced concrete beam and it was observed that the EMI admittance data is more useful than the strain data. The interpolation of the EMI spectrums and inverse distance indicators were used for damage detection in a composite structure (Cherrier et al., 2013). Wang et al. (2019) described debonding detection in CFRP-strengthened steel beam using the traditional approach of EMI. The authors used RMSD and correlation coefficient algorithms for debond detection. Recently, a modified probability weight algorithm is used in damage location imaging. The direct-coupled mechanical impedance (DCMI) based RMSD damage indicator is used for the real and imaginary parts to enhance the accuracy of damage detection (Zhu et al., 2021).
A limited number of EMI based SHM approach is available in the literature, and there is a major scope of developing new SHM strategies for damage localisation in CSS. In the present study, experimental analysis and numerical simulations have been carried out on a CSS made of aluminium honeycomb core and carbon-fibre-reinforced face sheets. The numerical simulation is based on the finite element method for the sample CSS with debonds and a network of PZTs. The numerical simulation of experimental data is based on the observed changes in the conductance magnitudes of the registered PZT sensor signals.
2. Experimental setup and the concept of EMI based inspection of CSS
The calibration experiments are performed on a sample CSS (300 mm × 300 mm × 16.2 mm) with a 12-number of surface-bonded PZTs (actuator/sensor) of 0.5 mm thickness and 10 mm diameter. The PZTs are operated by an impedance-analyser, ‘HIOKI IM 3570’ for the EMI measurements. The magnitude of excitation chosen for the experiments is 1V using a sweep sine wave signal. Each measurement at a specific time is an average of the 50 measurements. The experimental setup for the EMI measurements in a sample CSS is described in Figure 1.
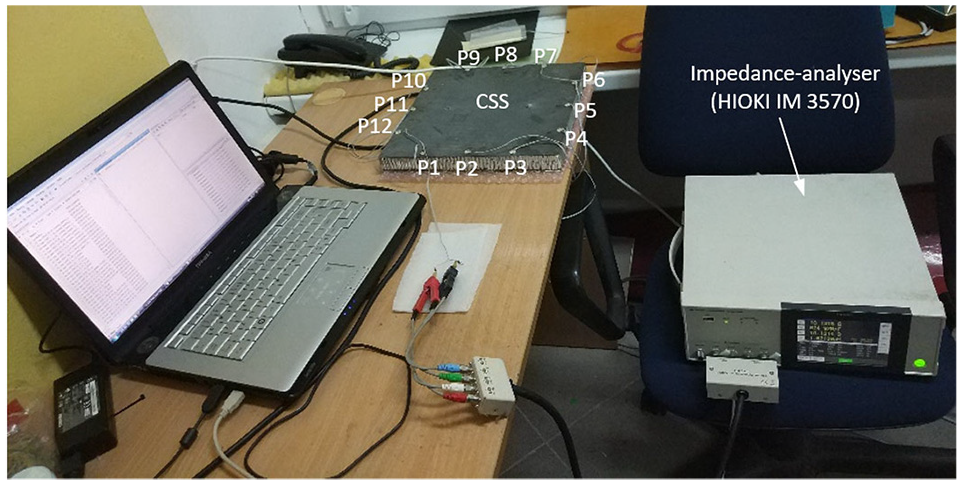
Experimental setup for EMI measurements of debond influence in CSS.
The CSS is made of a 15 mm thick aluminium honeycomb core and 0.6 mm thin carbon-fibre-reinforced composite (CFRC) face-sheets bonded to the top and bottom surfaces of the core. The face-sheets in the CSS are made of graphite-epoxy laminates with quasi-isotropic lay-up: [0°/90°/−45°/45°]s. The laminates were manufactured by using the prepreg lay-up process and the properties (as per the composite manufacturer) for carbon-fibre are: Young’s modulus, E = 256.5 GPa; mass density, ρ = 1752 kg/m3; Poisson’s ratio, ν = 0.26; volume fraction of fibres, vol. = 0.564. The matrix properties are: E = 3.44 GPa, ρ = 1270 kg/m3 and ν = 0.35. The material properties of epoxy adhesive resin used for the skin-core bonding are: E = 3.0 GPa, ρ = 1150 kg/m3 and ν = 0.34.
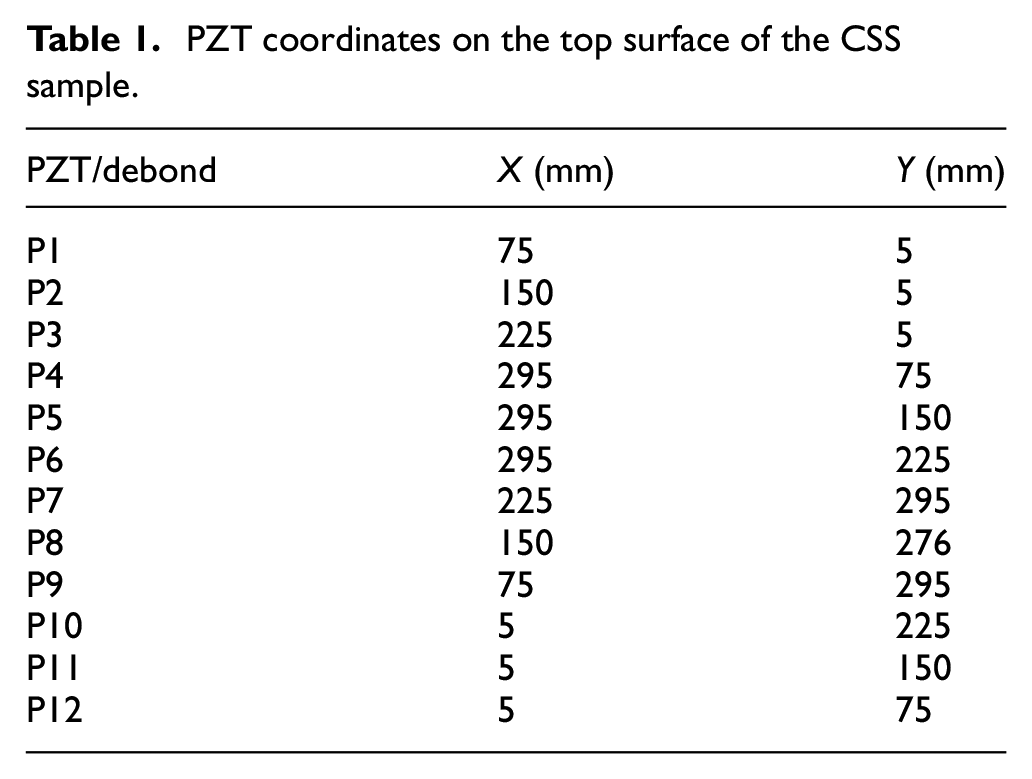
An artificial debond (30 mm × 30 mm) between the core and bottom face-sheet is introduced by inserting Teflon-film at a predefined location during the fabrication of CSS. In the experiment, a range of frequency spectrum of 1 kHz–1 MHz@100 Hz/step is considered. The ambient temperature was kept constant at 20°C during the experiments. The experimental setup in Figure 1 shows the PZT (sensors and actuator) arrangement on the sample CSS surface against the debond region. The PZT coordinates (x, y) concerning the origin ‘O(x, y)’ are given in Table 1. Here, 12-PZTs are used to cover the maximum inspection area of the structure based on the sensitivity radius of each PZT.
PZT coordinates on the top surface of the CSS sample.
3. Numerical Simulation
In the study, the finite element analysis based 3D numerical simulations of PZT (10 mm diameter and 0.5 mm thick) transducer induced using sweep sinusoidal signal with unit load (1 V) amplitude signals and the corresponding EMI analysis in the CSS (300 mm × 300 mm × 16.2 mm) models have been carried out using the explicit and implicit solvers in ABAQUS. In the numerical simulation, the explicit code is used for modelling the three-layer CSS, as the ABAQUS explicit solver offers a fast and accurate simulation of EMI in such multi-layered complex structures. But, the PZTs are modelled using the implicit code, as the ‘piezoelectric’ element properties are not available in the explicit solver. The PZT models are consists of two parts: ‘electrode-part (0.1 mm thin)’ at the top and ‘piezo-part (0.4 mm thin)’ at the bottom. For the piezo-mechanical analysis, the electrical voltage as excitation load is applied to the top surface of the piezo-part of the actuator PZT and zero-voltage is assigned to the bottom surface of the piezo-part of the actuator as well as sensor PZTs for grounding operation. Whereas, zero-voltage is assigned to the top and bottom of electrode-part of the actuator and sensor PZTs. The top surface of the sensor PZTs is assigned for the collection of output voltage. Both explicit model (assigned with Step-1: Dynamic, Explicit) and implicit models (Step-1: Dynamic, Implicit) contain the same assembly of CSS and PZTs but, no material properties/mesh of the PZTs are assigned in the explicit model and no CSS properties/mesh are assigned in the implicit model. In the explicit assembly, the implicit parts are linked by assigning ‘Link Instances’ In the process, the input files of the explicit and implicit models are separately generated and called during the ‘standard-explicit co-simulation’ in ABAQUS was assigned to inter-link the explicit and implicit simulation. A zero-volume backside skin-to-core debond (30 mm × 30 mm) was modelled at the selected locations (debond centre: x = 115, y = 115) in the CSS model by untying the nodes at the core-to-bottom skin interphase. The CSS model is shown in Figure 2(a).
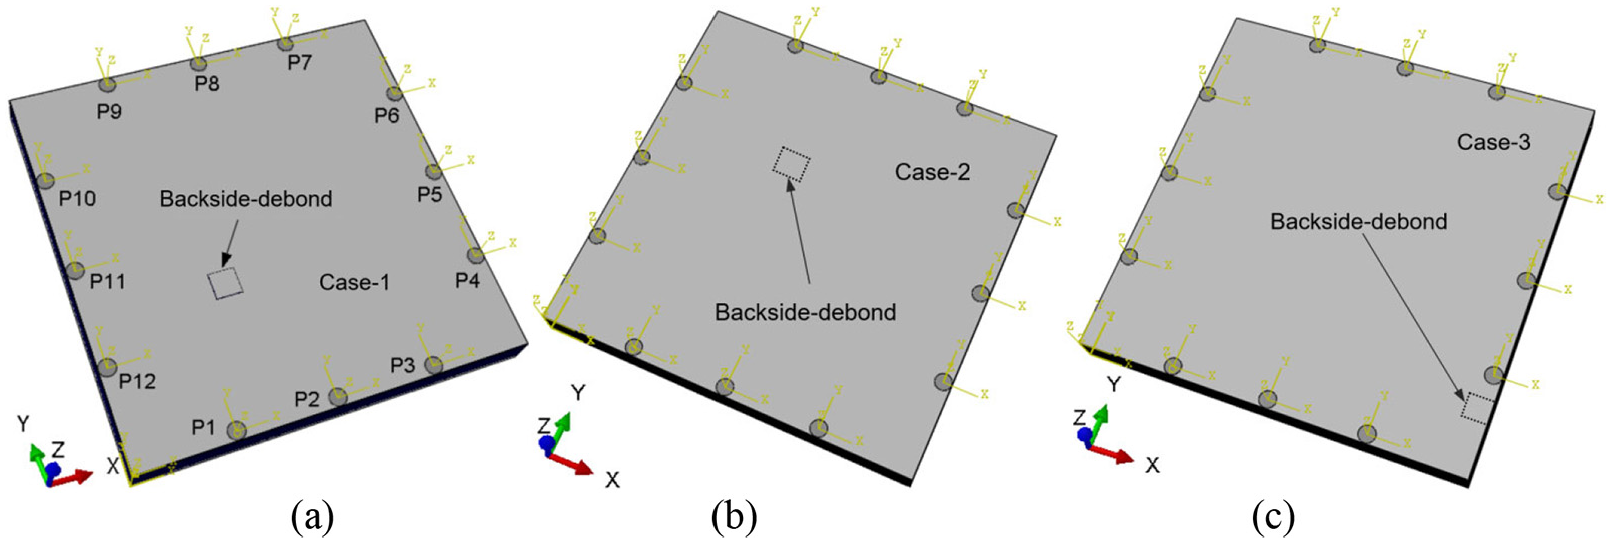
Numerical model of CSS for simulation of EMI: (a) case-1 (ref.), (b) case-2, and (c) case-3.
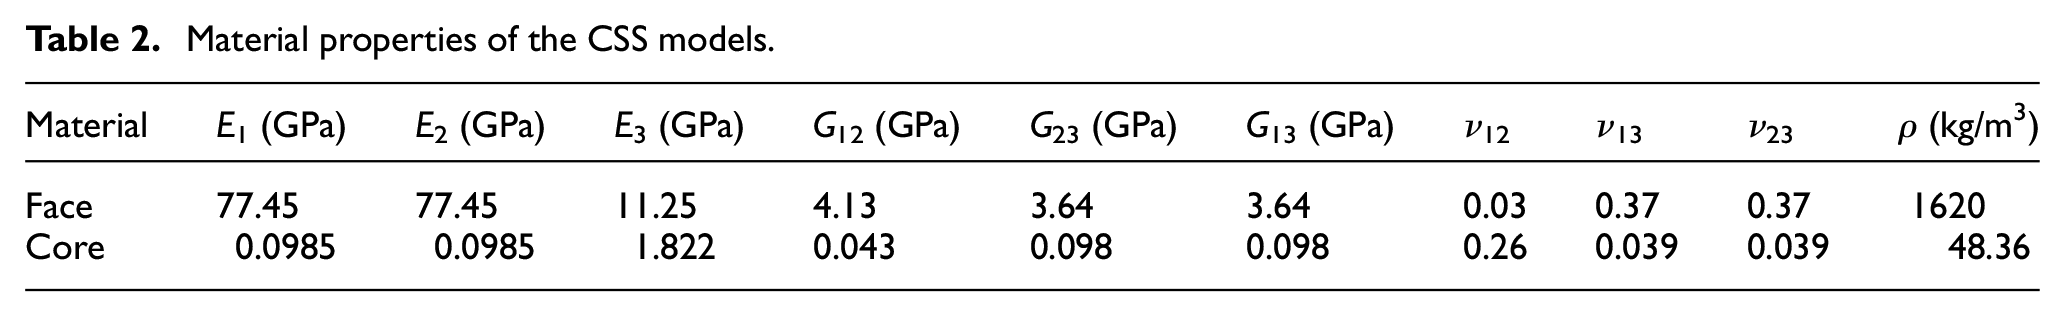
The eight-noded ‘C3D8R’ solid brick elements (0.5 mm × 0.5 mm × 0.1 mm) are assigned to model the CSS. The homogenised elastic properties of the CSS face-sheet (Face) was calculated as per Vinson and Sierakowski (2006) and the material properties are given in Table 2.
Material properties of the CSS models.
The electrical impedance, ‘Z’ as an inverse of admittance ‘Y’, is the ratio of the voltage ‘V’ to the alternating current ‘I’ in the PZT circuit (Kaltenbacher, 2007; Liang et al., 1996):
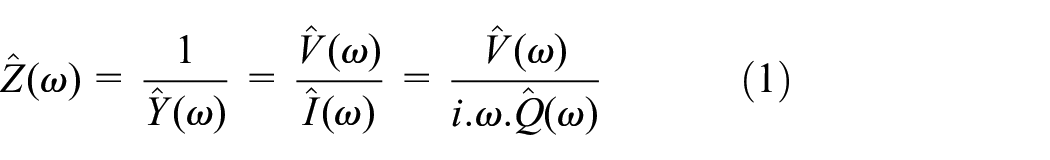
where ‘ω’ is angular frequency;
Conductance ‘G′’ (unit S (Siemens)) is calculated from the real part of admittance described as

where ‘B’ is susceptance.
The conductance spectrum of the PZTs is obtained from experiments using an impedance-analyser (HIOKI, IM3570) for a frequency range of 1–1000 kHz, and the experimentally obtained frequency range is applied to the numerical simulation. A sweep sine signal (Voltage) for the selected frequency range is applied for the PZT excitation. The properties of the Noliac NCE51 PZTs are given below.
Mass density, ρ = 7200.00 kg/m3,
Elastic stiffness,
permittivity,
charge-constant,
In the simulation, the above numerical model of CSS is termed as the debond case-1. The simulation is further extended to variable debond size at the same centre-point location in case-1. A debond (30 mm × 30 mm) at a different location (debond centre: x=100 mm, y=200 mm) in a similar CSS model, which is termed as debond case-2 has shown in Figure 2(b). Another numerical model is prepared for a debond (30 mm × 30 mm) located at the edge (debond centre: x = 270 mm, y = 50 mm) of a similar CSS and the simulation is termed as debond case-3 and shown in Figure 2(c).
4. SHM approach for debond detection in CSS
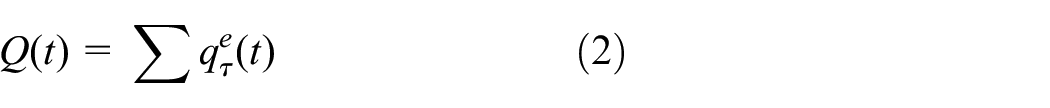
An SHM approach is proposed that uses a debond detection methodology to locate debonds in CSS based on the difference in conductance magnitudes (
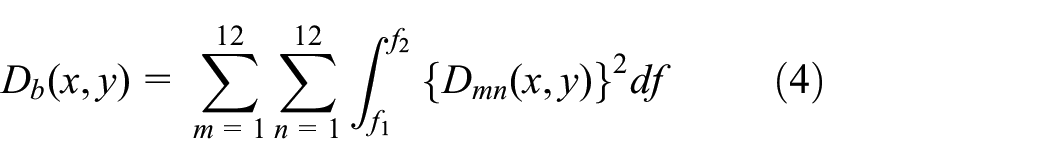
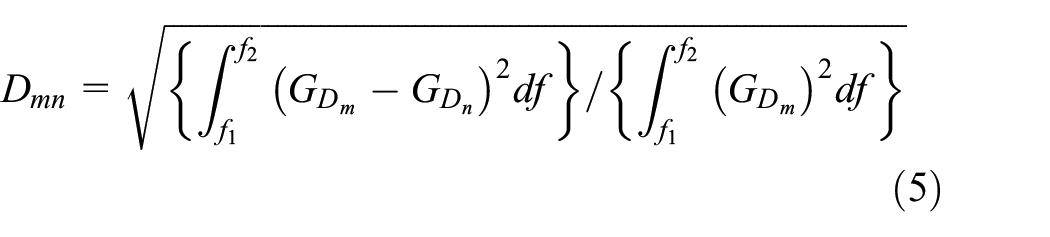
where ‘m’ and ‘n’ represents the initial (PZT-1) and end (PZT-2) PZT numbers (1, 2, 3 ..12; m ≠ n) in each PZT pair; f1 and f2 represent the lower and upper cut-off frequency, respectively; ‘
5. Results and discussion
Experimental EMI signals are obtained for a wide frequency range of 1 kHz–1 MHz at 100 Hz intervals and the conductance spectrum is shown in Figure 3. Based on a stringent analysis of the conductance data, a suitable frequency range: 160–300 kHz is selected for the debond identification in the CSS. In the experiment, for each PZT, 150-measurements (3-measurements at a time × 50-repetitions) are acquired and their average is considered for the analysis. From the analysis of experimental and numerical results, it is revealed that the conductance magnitude significantly decreases with the increase in debond-to-PZT distance, and an agreement is observed between the experimental and simulation results, in all the cases studied. A typical comparison between the experimental and numerical ‘G’ data corresponding to P3 and P12 (ref. Figures 1 and 2) is presented in Figure 4, which shows the agreement between the experiment and simulation results and the reduction in ‘G’ magnitudes.
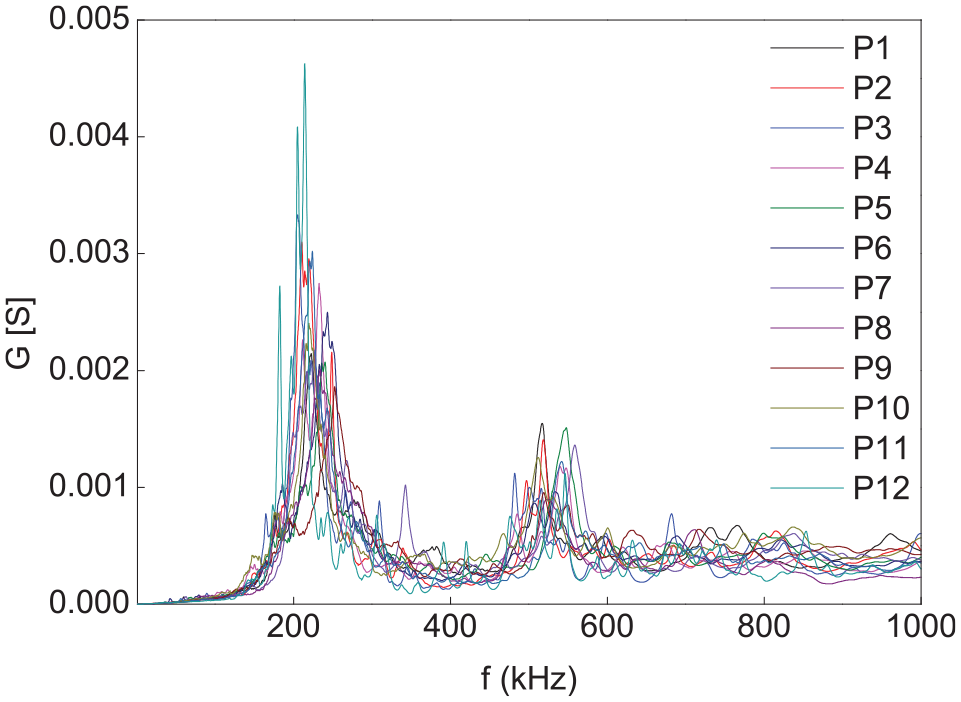
The frequency spectrum of conductance (G′) from experimental EMI measurement.
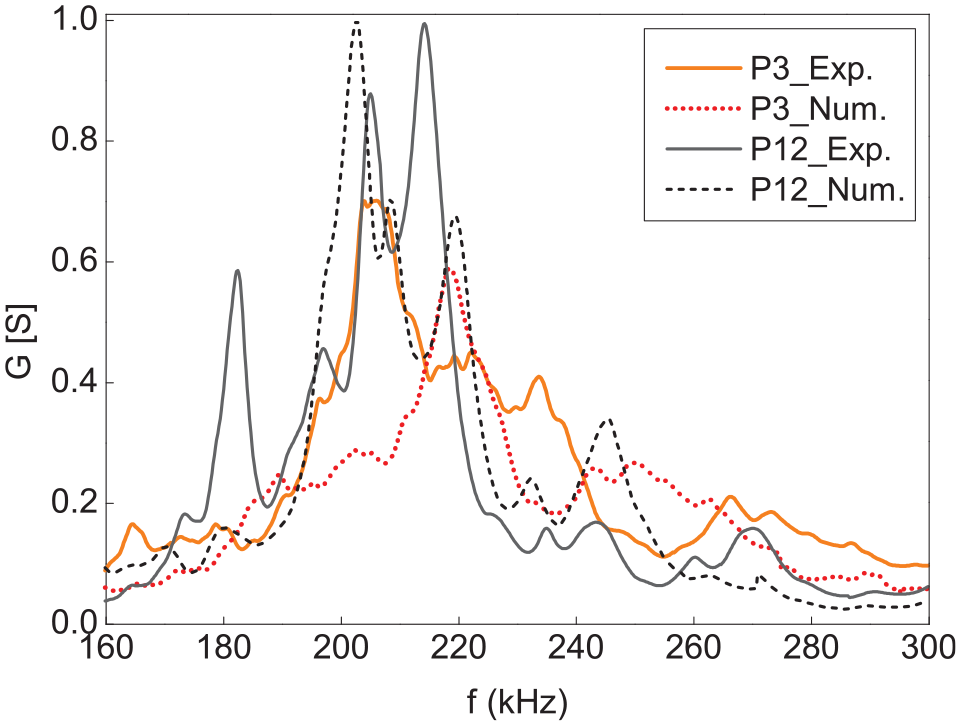
Comparison between the typical experimental (Exp.) and numerical (Num.) results corresponding to P3 and P12.
Based on the changes in experimental and numerical conductance data for 144 PZT combinations (Pm–Pn), the debond locations are effectively predicted from the SHM approach described in section 4. In the process, the lower and upper cut-off frequencies for the experiment as well as simulation data are selected as f1 = 200 kHz and f2 = 250 kHz, respectively. The cut-off frequency range is selected for better accuracy in the predicted SHM results.
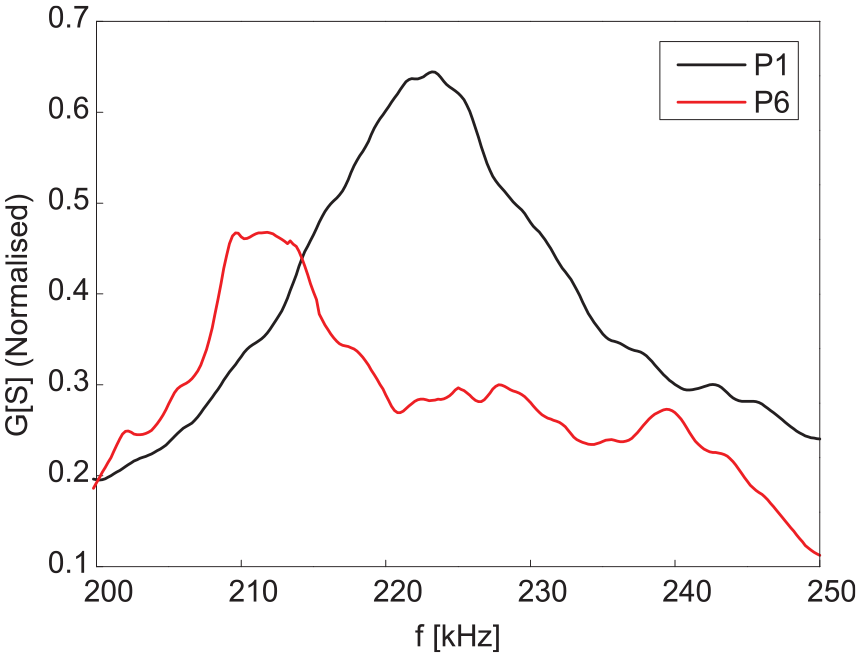
A typical comparison of experimental conductance data is presented in Figure 5 that indicate a prominent difference between the magnitude areas for the selected frequency band (200–250 kHz). The experimental conductance data are obtained for all 12-PZTs in the selected pairs and applied to the proposed SHM approach. Eventually, the debond index map is obtained and presented in Figure 6 which accurately predicts the debond location in the CSS.
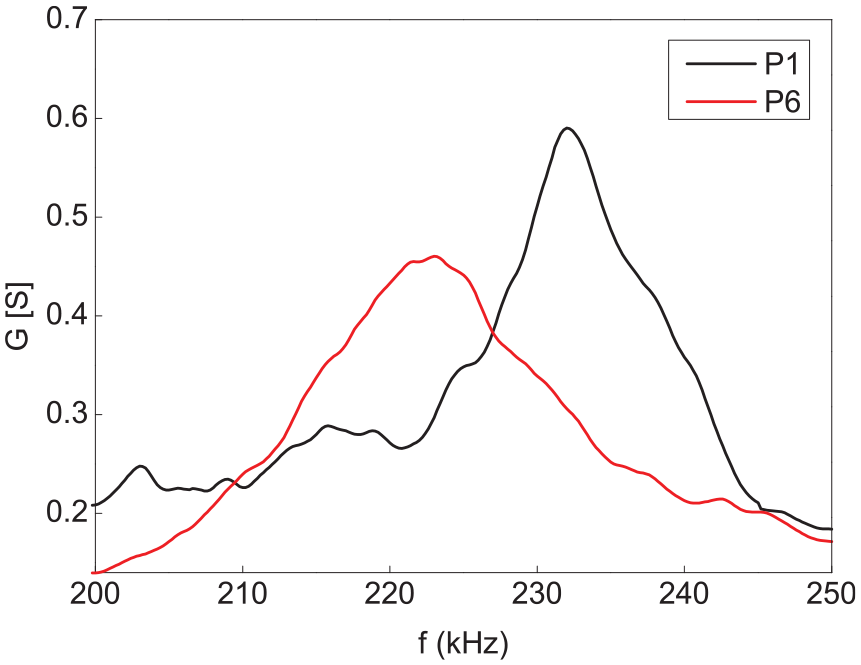
A comparison between the experimental conductance data from P1 and P6.
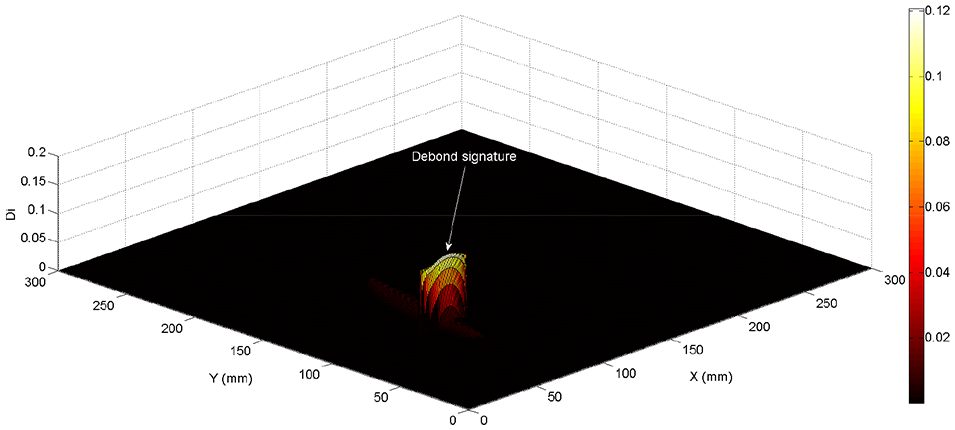
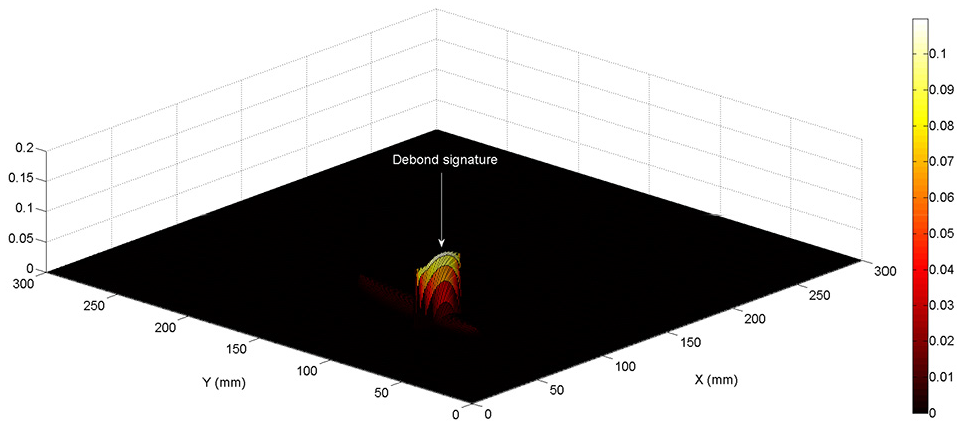
Debond index map showing the predicted debond location in the experimental CSS.
A comparison of simulation results is presented in Figure 7 which also shows similar characteristics in conductance data as in the case of the laboratory experiment. The numerical conductance data for the selected frequency range (200–250 kHz) applies to the SHM approach and the corresponding debond index map is obtained and presented in Figure 8 that accurately predicts the debond location in the CSS.
A comparison between the numerical ‘G’ data from P1 and P6 (ref. Figure 2).
Predicted debond location in the numerical CSS model in Figure 2(a).
The debond source localisation study is further extended to the variable frequency range of the conductance data, PZT combinations in the network and debond size. In the process, the debond source localisation error (
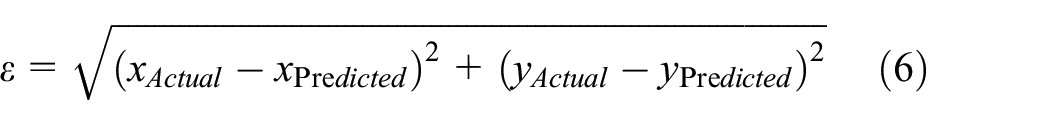
where ‘
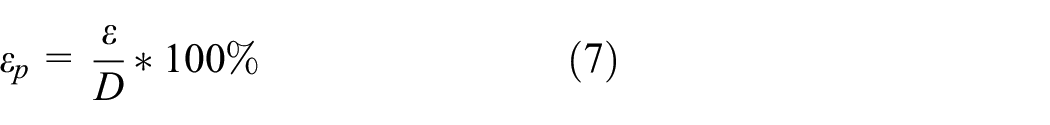
Where ‘D’ is the straight-line distance between the predicted and actual debond location. In the study, the percentage of accuracy = (100–
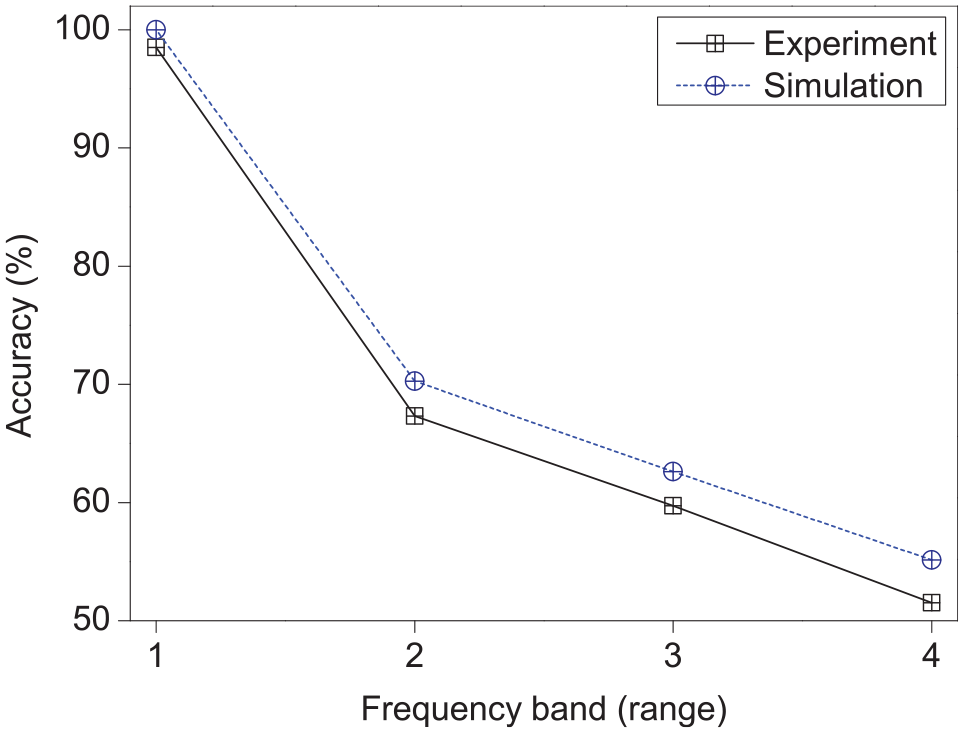
Influence of frequency range selection on debond localisation accuracy.
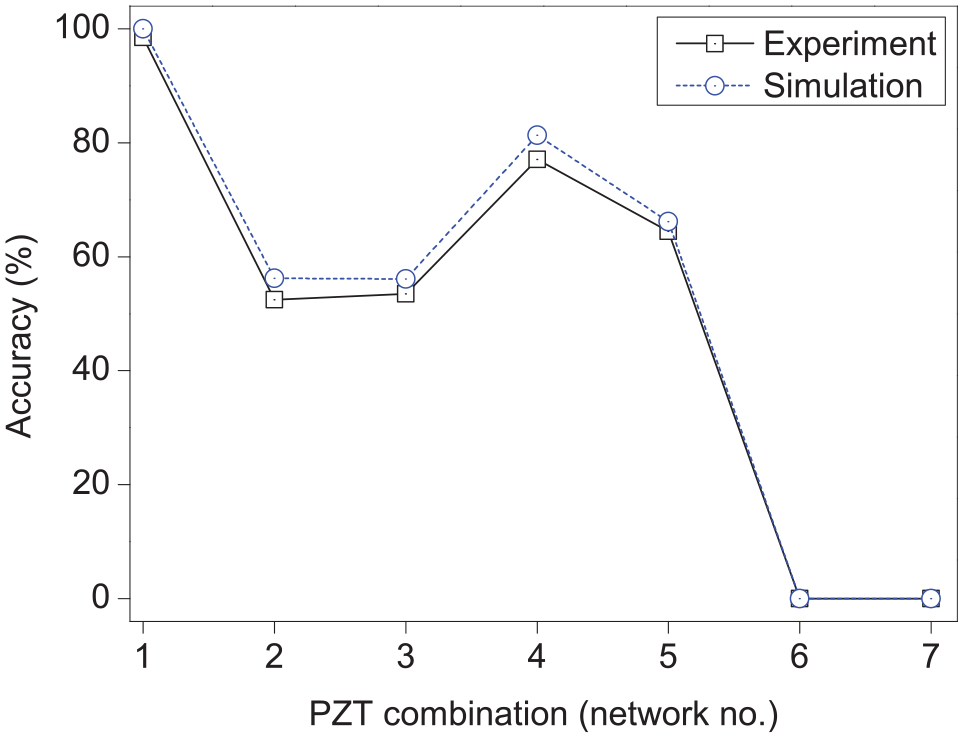
Influence of PZT number and combination on localisation accuracy.
The localisation potential of the proposed SHM approach is analysed for the lowest size of a debond in the CSS. A series of debond size (length = width = 30 mm (ref.), 25 mm, 20 mm, 15 mm, 10 mm, 5 mm) is considered for the numerical simulation of CSS models. The debond index maps are obtained based on the numerically obtained conductance data (200–250 kHz) for all the debond sizes and the corresponding debond index magnitudes are plotted in Figure 11. It is observed that the lowest size (among the given sizes) of the predictable debond in the CSS is 10 mm. The debond signature for the 5 mm debond size was not observed in the study, due to the presence of limited debond influence (i.e. change in conductance amplitude) in the registered EMI signals.
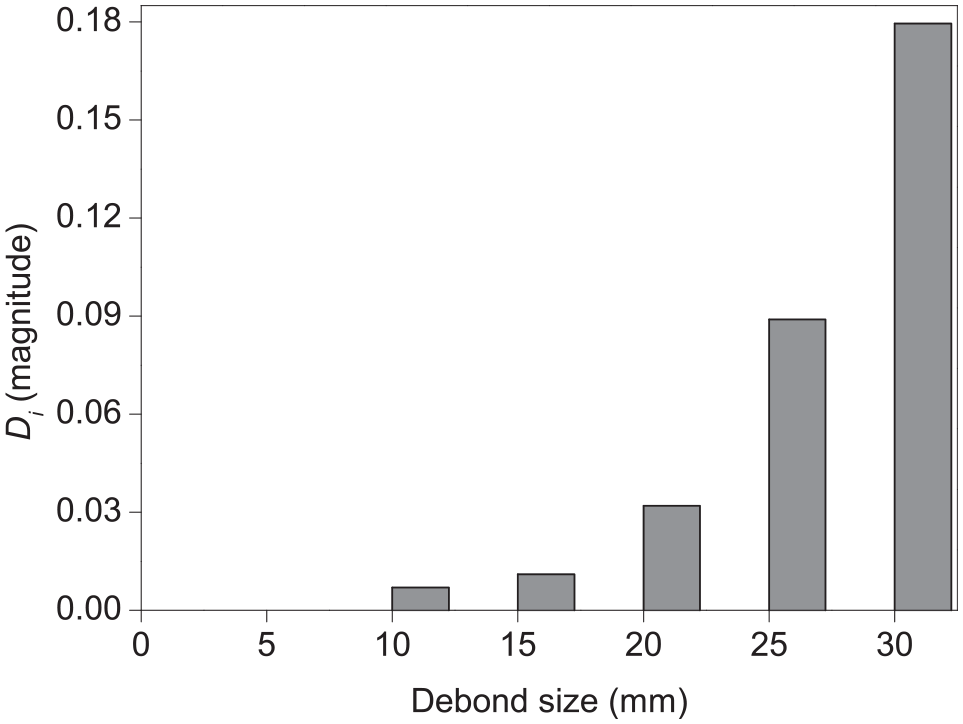
Variation in debond index magnitudes for different debond sizes in the CSS.
The debond monitoring potential of the proposed SHM approach is further verified for debond case-2 and debond case-3 from the numerical models in Figure 2(b) and (c), respectively. The debond index maps were obtained using the simulation signals and presented in Figure 12(a) and (b), respectively. The localisation results show that the proposed SHM approach is capable of predicting such backside skin-core debonds at varying variable locations in the CSS including the debonds at the edges of CSS.
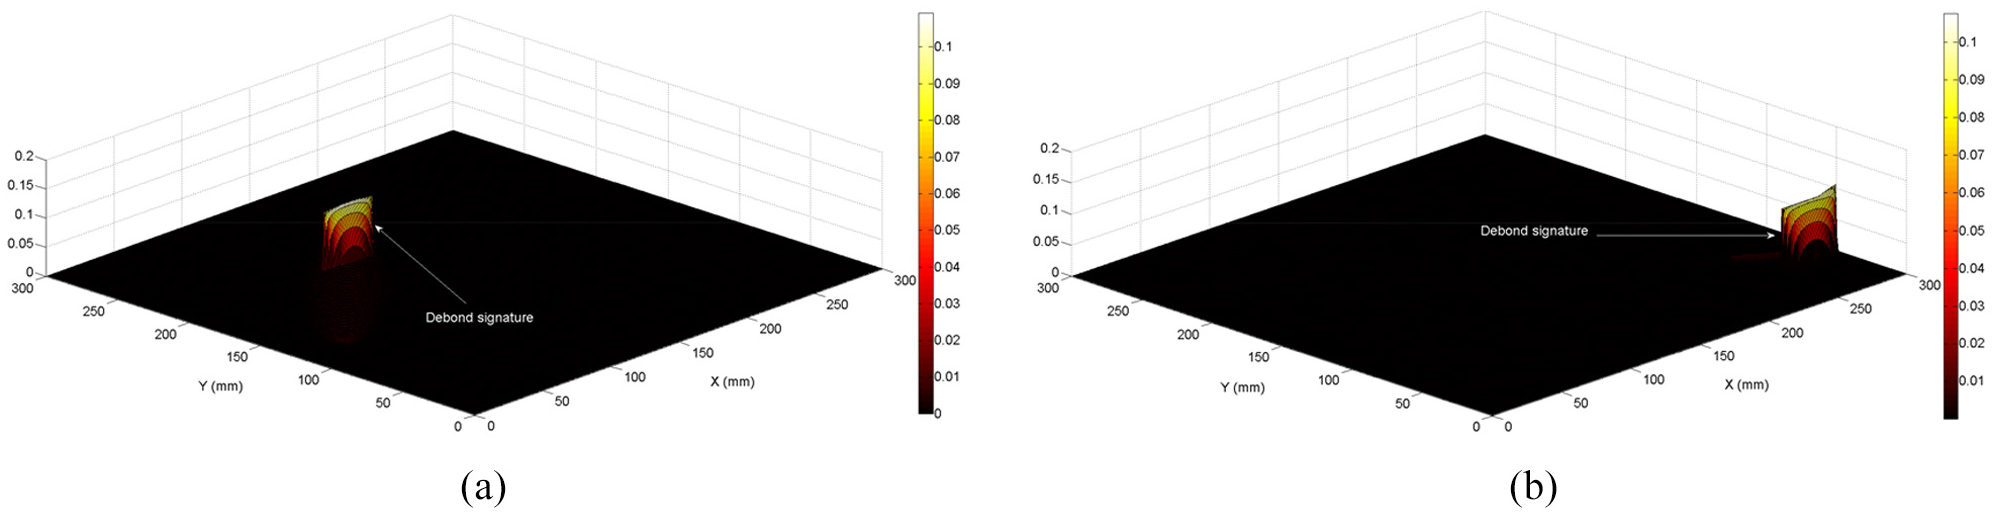
Debond index map showing the predicted debonds in (a) case-2 and (b) case-3 in the numerical CSS models.
6. Conclusions
A new SHM approach is proposed that uses a debond localisation approach for the assessment of CSS using conductance data from various PZT positions.
The proposed SHM approach proves its potential to effectively detect the backside debond locations in CSS using experimental and numerical conductance data for a selected frequency range.
This SHM approach can effectively detect debonds at the edges of the CSS using the EMI signals from the numerical simulation.
The accuracy of the proposed debond detection accuracy significantly depends upon the debond size, frequency bands, and PZT arrangement on the targeted CSS.
It is expected that this research will help in developing an industry-grade SHM approach for debond detection in composite structures. A robust SHM strategy for EMI based multi-level debond (multiple back/front-side debonds in a single CSS) localisations in CSS under noisy variable ambient conditions would be the future research scope.
Footnotes
Declaration of conflicting interests
The authors declared no potential conflicts of interest with respect to the research, authorship, and/or publication of this article.
Funding
The authors disclosed receipt of the following financial support for the research, authorship, and/or publication of this article: This research was supported by the NCN Poland under grant agreement number UMO-2018/29/B/ST8/02904 in the frame of an OPUS15 project and UMO-2016/22/E/ST8/00068 in frame of SONATA-BIS project.