
Abstract
Composites of multiwall carbon nanotubes (CNT) at 1, 2, and 3 wt.% on a polypropylene–polyethylene random copolymer matrix were prepared by melt compounding CNT powder and by dilution of a commercial polypropylene masterbatch (PMB). While the shear viscosity shows similar behavior for both dilution modes, the differences in their elastic properties clearly show the effect of the addition method and the presence of the PMB. This also indicates the relevance of having a difficult to mix masterbatch to enhance the elongational viscosity of the composites for free wall applications such as fiber spinning and blown film. On the other hand, the 2 and 3 wt.% CNT composites from both addition modes have similar electrical conductive behavior, with values near the semiconductors’ range. TEM and SEM images show different states of dispersion for each source of CNT. The immiscibility observed in those images is the simplest explanation for the differences in the molten composites’ elastic properties due to direct CNT addition versus CNT addition by dilution of a PMB.
Introduction
Ever since the discovery of fullerenes, nanotechnology has led the research and design of new materials with improved properties. The combination of a polymer with nanoparticles results in materials that can be tailored for specific applications (e.g. light weight and easy processability with excellent mechanical properties) and are extensively used by both researchers and industry (Kumar and Krishnamoorti, 2010; Liu and Brinson, 2008).
In this matter, carbon nanotubes (CNT) qualify as excellent fillers providing extraordinary properties such as a high surface area, large and tunable aspect ratios, and a high tensile strength and Young’s modulus, as well as great electrical conductivity (Al-Saleh, 2015b; Liu et al., 2010). However, it is widely recognized that the enhancement of polymer properties (e.g. elastic modulus and electrical conductivity) highly depends on the quality of the dispersion and the interfacial interaction between CNT and the matrix (Alig et al., 2012; Al-Saleh, 2015b; Bauhofer and Kovacs, 2009; Faghihi et al., 2015; Hussain et al., 2006; Müller et al., 2015; Prashantha et al., 2009).
CNT have a strong tendency to aggregate, leading to highly agglomerated particles, which makes dispersion a difficult issue for both production and processability (Faghihi et al., 2015; Hussain et al., 2006; Kumar and Krishnamoorti, 2010). Difficulties are particularly present with non-polar polymers such as polypropylene and polyethylene (Zhong et al., 2014). The viscosity of the matrix has been reported to play a key role in the final dispersion and morphological state of thermoplastic–CNT composites, with lower matrix viscosities resulting in better dispersion and lower percolation thresholds (Vega et al., 2014). Dispersion is highly accelerated by melt infiltration into the CNT agglomerates. Melt infiltration is promoted by lowering the matrix viscosity, as the agglomerate cohesive strength decreases continuously with decreasing viscosity (Faghihi et al., 2015).
Melt compounding of nanocomposites provides cost effectiveness, fast production and environmental benefits (i.e. free of solvents); therefore, this technique is a promising method to produce CNT-based nanocomposites (Al-Saleh, 2015b; Grossiord et al., 2006; Pandey et al., 2013; Prashantha et al., 2009; Vega et al., 2014). Although it has been reported that melt mixing is not enough to achieve full dispersion at high CNT contents, it is highly efficient for low contents (Pascual et al., 2012). The typical Banbury method has proven useful for nanofiber deagglomeration and high dispersion because of its high shear mixing zones (Lozano et al., 2001).
On the other hand, the use of high CNT concentration masterbatches has proven to be a feasible way to better disperse the filler into the polymeric matrix by further dilution of the original material in the polymer until the desired concentration is obtained (Boronat et al., 2012; Mičušík et al., 2009; Pascual et al., 2012; Vega et al., 2014; Zhong et al., 2014). Most morphology studies have concluded that masterbatch dilution gives a higher degree of filler dispersion with smaller agglomerates (Zhong et al., 2014). The objective is to reach a percolation threshold with the minimum amount of filler to obtain the largest enhancement in properties (Grossiord et al., 2006; Menzer et al., 2011; Nan et al., 2010). It is mostly recognized that a better dispersion is obtained with masterbatch dilution because of the high shear stresses and longer residence time during a second processing step, in the barrel of either an extrusion or injection process (Zhong et al., 2014).
Polyolefins such as polypropylene (PP) represent more than half of commercial polymers produced in the world, since they are known to be cost-effective and good performing materials used in a broad range of applications. The limitations of polyolefins are mainly the lack of functionality and structure diversity (Chung, 2013). PP is the most used plastic, as it includes in its applications either original commodity or the engineering markets. In addition, basic PP resins are among the cheapest plastics and can be easily recycled (Biron, 2011). A problem to overcome is that a non-polar polymer like PP is incompatible with CNT making nearly impossible to obtain a uniform dispersion and therefore it is unavoidable to have a presence of agglomerates in the prepared composites (Mičušík et al., 2009; Zhong et al., 2014). PP based copolymers have attracted a lot of attention since the copolymerization of these materials improve the performance of the original polyolefins. Polypropylene–ethylene random copolymers upgrade the performance in processability and mechanical properties; even more since the development of catalyst allows for the strict control of the PP–PE sequence (Li et al., 2019; Shin et al., 2001).
Melt viscoelasticity plays a key role in understanding the influence of CNT as a filler on the processing and behavior of nanocomposites (Du et al., 2004; Kumar and Krishnamoorti, 2010; Vega et al., 2014). CNT have a significant influence on the rheology of viscoelastic materials, increasing the low-shear viscosity substantially (Grady, 2013). Substantial viscosity increments can be attributed to fiber wetting or polymer–fiber interactions increasing the viscosity at low frequencies with increasing filler content (Lozano et al., 2001). At low concentrations of filler, a hydrodynamic effect is present as a reinforcement; no interactions between particles occur and the change in properties is mainly due to the matrix–particle interaction (Vega et al., 2014). Rheology can also give an insight into the network formation and dispersion of the filler in the matrix (Lozano et al., 2001), since the enhancement in rheological properties can be considered a result of the physical network structure (Song, 2006).
As has been stated by several authors (Du et al., 2004; Koo, 2006), nanotubes have a dramatic effect on the rheological behavior of the composites, since the particle–particle interaction results in a physical network inducing a rheological percolation threshold. As the loading increases, both the storage shear modulus (G′) and the loss shear modulus (G″) increase, especially at low frequencies. Furthermore, at a fixed CNT concentration, both G′ and G″ increase as the frequency increases. According to the literature, large-scale polymer relaxations in the nanocomposites are effectively restrained by the presence of the nanotubes; that G′ is almost independent of frequency (ω) at low frequencies and at concentrations higher than 0.2 wt.% is indicative of a transition from liquid-like to solid-like viscoelastic behavior (Du et al., 2010). This nonterminal low-frequency behavior can be attributed to a nanotube network, which restrains the long-range motion of the polymer chains (Koo, 2006). Additionally, composites in the low-frequency range are expected to become shear-dependent as the filler concentration is increased; this behavior, known as shear thinning, requires longer relaxation times and higher shear stresses to accomplish the same flow as that of the neat matrix that can be attributed to fiber wetting (Lozano et al., 2001). On the other hand, at high frequencies, the effect of the nanotubes on the rheological behavior is relatively weak. This behavior suggests that the nanotubes do not significantly influence the short-range dynamics of the polymer chains, particularly on length scales comparable to the entanglement length. The presence of nanotubes has a substantial influence on polymer chain relaxations but has little effect on polymer motion at the length scales comparable to or less than the entanglement length (Du et al., 2010).
Polymer nanocomposites also have potential applications in electrostatic discharge, electrical interconnects, conductive coatings, multilayer printed circuits, and electromagnetic interference (EMI) shielding among others, with conductivities tailored between 10−6 and 100 S cm−1 (Al-Saleh, 2015b; Grossiord et al., 2006; Kumar and Krishnamoorti, 2010). To obtain conductive CNT–polymer composites, the highly conductive CNT filler is dispersed into the polymer matrix to form a three-dimensional conductive network of CNT in the polymer matrix (Grossiord et al., 2006). The conductive network could also be connected not geometrically but electrically via tunneling. The tunneling of electrons between two adjacent conductive particles is a quantum-mechanical issue. The final electrical conductivity of the composites is thus determined by not only the intrinsic conductivity of the CNT employed but also by the polymer matrix and the processing parameters (Bauhofer and Kovacs, 2009).
Commercially available materials represent an attractive way to scale up nanocomposite production from research to industrial levels and make them available for mass usage. The use of a commercial masterbatch can be an option for the industry to produce polymer CNT composites in high quantities and ideally with secure processing and good dispersion.
It was puzzling to have a look at the influence of doing the compounding by, either, using a PP/CNT masterbatch, or by directly adding the CNT not to a PP matrix but rather to a PP–PE random copolymer. Therefore, the aim of the present study is to investigate how the immiscibility of the polypropylene random copolymer matrix and the CNT masterbatch produces agglomerates affecting the elastic properties of the composites, as compared to CNT direct incorporation via melt compounding, and how these two compounding modes affect the electrical properties of the resulting composites, since few studies have reported such effects on this type of materials and their understanding is needed for further improvement in their large-scale production.
The prepared materials include three different CNT contents, and their viscoelastic behavior was studied through capillary and oscillatory rheology. Additionally, the electrical conductivity of the composites was obtained and analyzed. Morphological images are presented as a reference and for better understanding of the rheological and electrical behavior. The rheological properties of nanocomposites are highly sensitive to the filler’s characteristics, that is, surface area, shape, size and crystalline structure, and particularly to the state of dispersion. In this study, both sources of filler use the same CNT to isolate the influence of the PP used in the masterbatch on the composites’ rheology, especially in the elastic melt response.
Experimental section
Materials
A blow molding grade random copolymer PP for medical applications (TOTAL Petrochemicals, USA) with a melt flow index of 2 g (10 min)−1 at 230°C and a density of 0.900 kg m−3 was selected as the matrix. GPC reports MWD values of Mn=73671 and Mw=335134.
Two sources of filler were used, a PP masterbatch, referred to as MB, (Plasticyl PP2001 with NC7000 by Nanocyl™) with an melt flow index (MFI) of pure PP of 12 g (10 min)−1, a CNT loading of 20 wt.% and a density of 872 g L−1; and CNT (NC7000 by Nanocyl™) with an average nanotube diameter of 9.5 nm, a mean length of 1500 nm, a carbon purity of 90%, a metal oxide content of 10% and a surface area of 250 to 300 m2 g−1, as reported by the manufacturer.
Preparation of PP/CNT composites
Three weight loadings were chosen for this study: 1, 2, and 3 wt.% CNT, with the objective of including the rheological percolation threshold within the filler range and based on the statement that the optimal balance between cost and properties lies between 1 and 3 wt.%. Furthermore, these compositions are more adequate from an industrial point of view (Pascual et al., 2012).
Samples of as-received CNT were prepared by pre-mixing PP and the appropriate quantity of CNT up to 40 g, and then the mixtures were fed to a three-head mixer (ATR Plasti-Corder Brabender GmbH & Co.) at 200°C and 50 rpm for 30 min. The conditions of the mixer were selected based on published works (Al-Saleh, 2015b; Bhattacharyya et al., 2003; Prashantha et al., 2009). The same procedure was applied for the dilution of the masterbatch, using commercial masterbatch pellets instead of CNT powder. Samples of neat PP (as a reference) and PP/CNT composites were further prepared for each characterization technique.
Even though recent studies have concluded that the best dispersion is obtained using the lowest viscosity PP because of the better wetting of the polymer to CNT (Mičušík et al., 2009; Zhong et al., 2014), the mixture of a high viscosity random copolymer with CNT was expected to behave as a PP/PE blend, where the CNT have a higher affinity with the PE phase, thus increasing the compatibility with the nanofiller (Al-Saleh, 2015a). In the case of the masterbatch composites, the mixture of a high viscosity PP copolymer (composite matrix with an MFI of 2 g/10 min) with a lower viscosity PP homopolymer (masterbatch PP with an MFI of 12 g/10 min) might lead to an incompatibility of materials and problems in the CNT dispersion. Even though both PP polymers are not necessarily thermodynamically immiscible, homogenization might be hampered due to differences in viscosity (Mičušík et al., 2009), and in any case the rheological behavior might show such differences that later can be inferred from SEM and TEM observations.
Characterization of PP/CNT composites
Rheological tests included oscillatory and capillary rheometry to characterize the rheological behavior of composites with different CNT sources and loadings. The samples were either used directly for testing in the capillary rheometer or formed into 1-mm-thick, 25-mm-diameter disks for oscillatory and constant stress testing by means of press melt compression (CARVER, Inc. model 4122) at 190°C and 40 kN for 1 min.
An Anton Paar Physica MCR301 rheometer was used to run frequency sweeps from 628 to 0.1 s−1 with set parameters of 10% strain and 190°C. The configuration selected was a 25-mm parallel plate geometry and 1-mm gap. Storage and loss moduli, as well as the complex viscosity and phase shift angle were recorded as a function of angular frequency.
Steady-state entrance pressure tests were performed using a Rosand RH10 twin-bore capillary rheometer (Malvern Instruments, Inc.). Flat entry (180°) dies 0.5 mm and 32 mm in length and 1 mm in diameter were used. The sample was loaded into the barrels and allowed to reach a temperature for 5 min, followed by a pre-compression step of approximately 1 MPa. The test included a pre-heating step of 5 min and 10 shear rate stages from 20 to 20,000 s−1 at 190°C. Flowmaster® Software recorded raw data and the Bagley and Rabbinowitch corrections attained to get the elongational viscosity by means of the Cogswell analysis.
Samples of uniform area were prepared for electrical testing by properly placing copper conductive tape in their extremes to enhance current flow. Five measurements were made for each material by varying the voltage input until reaching a steady resistance value. Specimens were obtained from water jet cut dog-bones. The electrical properties were measured using a two-point probe by means of a Keithley 2400 source meter.
To observe the morphology of the different prepared materials, images of samples were taken by an EVO MA25 (Zeiss) scanning electron microscope (SEM). Fractured samples from tensile tests were sputtered with a 5-nm film of gold using Quorum Q150R ES equipment. The microscope was set to 10 kV, and secondary electrons were used. Transmission electron microscopy (TEM) micrographs were collected at an operating voltage of 300 kV in a FEI-TITAN 80 to 300 kV from microtomed samples approximately 90 nm in thickness.
Results and discussion
Rheological behavior of PP/CNT composites
Oscillatory dynamic shear test and the rheological percolation
In the case of polymers, rheological properties play an important role in understanding the materials’ behavior, thus helping with the design and optimization of processing and as a final product (Penu et al., 2012). Frequency sweep rheological tests can be employed to detect the network that nanoparticles form in composites, as shown by a typical liquid-to-solid transition at low frequencies (ω) (Faghihi et al., 2015; Pan and Li, 2013). The filler loading at which this transition occurs is known as the rheological percolation threshold. To determine this parameter, a power law relation based on values of G′ is generally used because it is more sensitive to micro structural changes compared with G″. That is, the loss modulus is usually less sensitive to both particle morphology and dispersion state (Song, 2006).
Figure 1 shows the storage moduli for all samples at 190°C. Because of the full relaxation of polymer chains, neat PP (0%) shows a typical terminal behavior of G′ being directly proportional to ω at low frequencies. Similar results have been found by other research groups (Mičušík et al., 2009; Pan and Li, 2013; Vega et al., 2014). In this figure, the transition from liquid-like to solid-like behavior, that is, the independence of G′ from ω, increases along with the filler content for composites obtained by direct compounding, which is consistent with literature data. Explanations of this behavior compare the constriction of polymer chains in the long-range relaxation with the short-range dynamics that are less affected as ω increases. Additionally, the improvement in G′ is attributed to the higher interfacial interactions and stronger bonding at the interface leading to an enhancement of the elastic behavior. At a concentration of 3 wt.%, G′ behavior can be said to be nearly independent of frequency and demonstrating a solid-like response, similar to that described by Pan (Pan and Li, 2013).
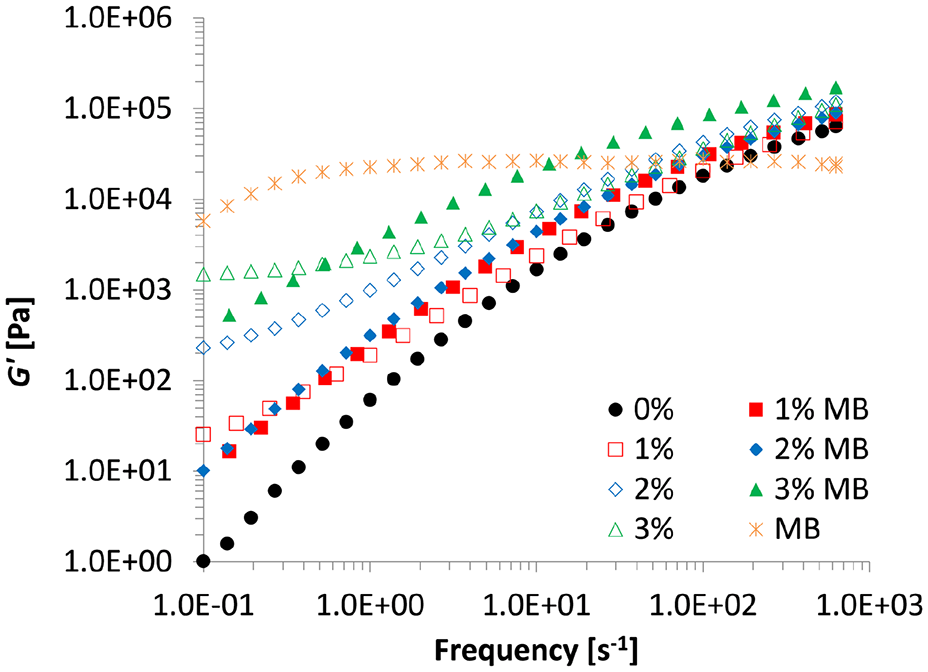
Storage moduli for all samples under study at 190°C.
However, the behaviors of the composites obtained by masterbatch dilution (identify by an MB legend) differ greatly from that of the direct compounding composites, especially in the storage modulus. As can be seen in Figure 1, direct compounding composites tend to become independent from frequency and present a plateau at low frequencies as the reinforcement content increases (see Figure 1, 3%). The direct compounding composites have higher G′ value that that of the neat matrix, however the 1 and 2 wt.% behaviors are similar, and a dramatic change happens for the 3 wt.%; that shows a nearly a two decade change at low frequencies when compared to the 1 and 2 wt.%.
All samples behaved similarly at high frequencies, making evident that the source of the CNT does not considerably affect the short-range dynamics of the polymer chains. In addition, the processing may not be affected when working with these materials at high shear rates, since they show the same viscosity independent of filler loading (Lozano et al., 2001).
The tangent of the phase angle (tan δ) versus frequency is presented in Figure 2. Clearly, different behaviors for the CNT composites and MB composites can be seen. While the MB composites follow the same tan δ trend as that of the neat copolymer, the CNT composites obtained by direct compounding present a tan δ maximum at 0.25, 0.72, and 7.2 s−1 for 1%, 2%, and 3%, respectively. These maxima represent a frequency where the viscous properties are most important and the difference with the elastic ones is the highest. The change in slope shown in Figure 2 for the CNT powder composites refers to a change in properties from elastic dominant to viscous dominant, or vice versa, that is, where tan δ = 1. In the case of 3 wt.%, this occurs at a frequency of 0.51 s−1 and backwards at 268 s−1. For 2 and 1 wt.%, there is just the one from viscous to elastic at 100 and 398 s−1, respectively. On the other hand, Song (2006) has identified ranges of tan δ to describe the interaction states between dispersed fillers: higher than 3 for particles that are not associated, between 3 and 1 for weak association and below 1 for strong association. From Figure 2, the 3 wt.% masterbatch sample shows particles that are strongly associated at high frequencies and the 3 wt.% from direct compounding at low frequencies; the 2 wt.% from direct CNT compounding and both samples with 3 wt.% show weak association (approximately between 1 and 100 s−1); and the remaining samples (1% MB, 2% MB, and 1% CNT) present no association until a frequency of approximately 10 s−1 and from that point on weak association. However, this type of interaction can be verified with the electrical conductivity corroborating network formation.
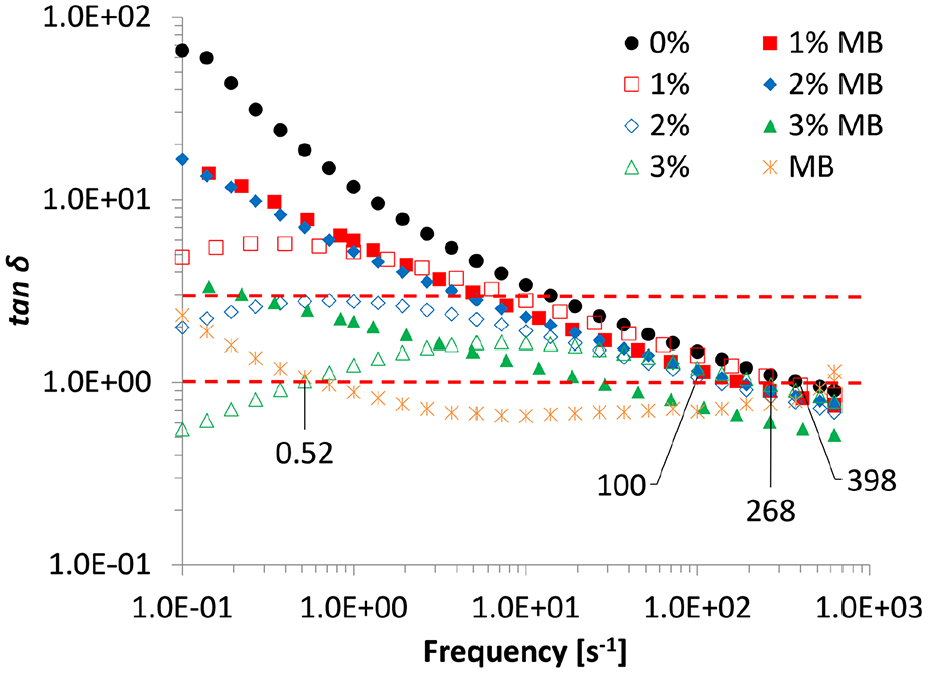
Phase angle for all samples under study at 190°C. Red dashed lines enclose tan δ values between 3 and 1.
Complex viscosity (η*) increases at low frequencies as the filler loading increases. As expected, a plateau region is shown in Figure 3 for neat PP and low concentrations of filler, that is, 1 wt.%. However, for 2 and 3 wt.%, this region is not clear, suggesting a constriction of the polymer chains’ movement by the presence of the CNT. Shear thinning behavior is more pronounced as the CNT content increases and the Newtonian region vanishes, indicating the formation of combined networks of polymer–polymer and polymer–nanotubes and an increase in polymer–CNT interactions (Lozano et al., 2001).
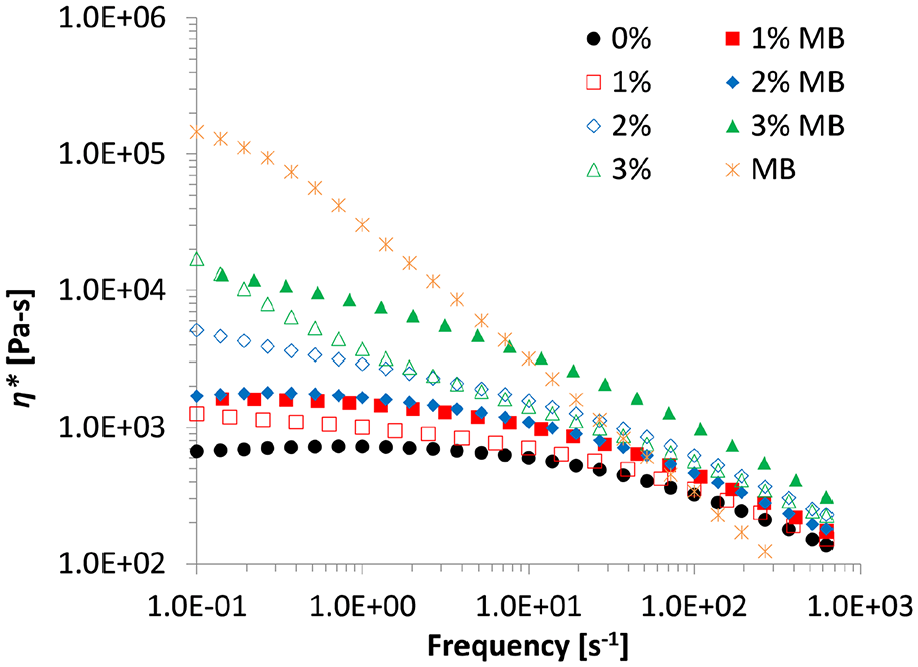
Complex viscosity for all samples under study at 190°C.
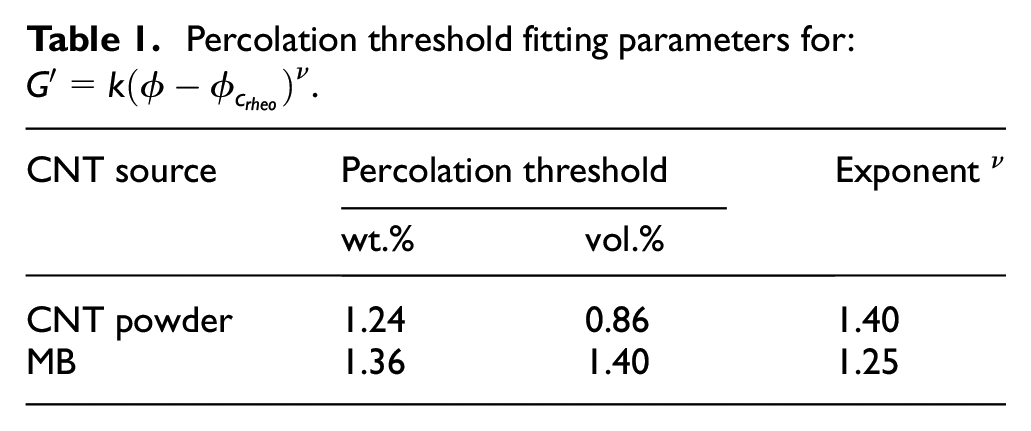
Rheological percolation occurs both for the formation of a CNT network and the polymer–CNT interaction when the nanotubes are connected by the tails of the polymer chains and restrict the polymer mobility. This phenomenon can be observed as the storage modulus improves, which is attributed to the presence of interfacial interactions (Faghihi et al., 2015). Above the critical concentration of filler (
Percolation threshold fitting parameters for:
To corroborate the liquid-to-solid transition, the phase angle (δ) is analyzed. Figure 4 presents the van Gurp–Palmen plots (δ vs G*), which have been used to estimate the rheological percolation threshold of composites containing inorganic fillers (Faghihi et al., 2015; Pan and Li, 2013). The incorporation of CNT from the powder (Figure 4(left)) significantly decreases the phase angle starting at a filler concentration of 1 wt.%, implying an improvement of the elastic property and the formation of a particle network within the CNT content range.
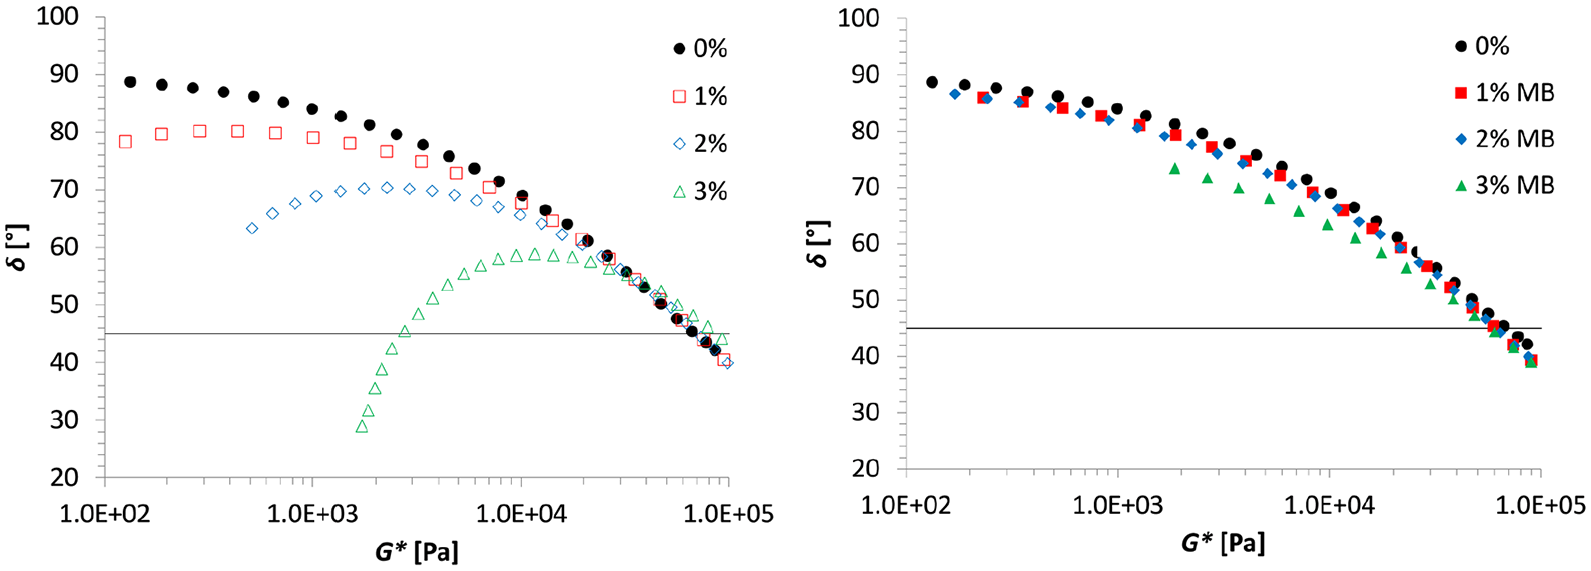
Van Gurp–Palmen plots for composites from the CNT (left) and the masterbatch (right) at 190°C.
At low complex modulus values, that is, low frequencies, the δ is close to 90° for neat processed PP. Deviations from 90° in the high G* region suggest the formation of a polymer chain network derived from the elastic response of the material. For composites from CNT, the van Gurp–Palmen graph follows a continuous descending trend and shows maxima of 80.1°, 70.3°, and 58.8° for 1, 2, and 3 wt.%, respectively. These maxima in the middle range of G* are attributed to the formation of a pseudo-solid-like CNT network (Pan and Li, 2013). As stated by Pan and Li (2013), phase angles with values above 45° refer to viscous flow, while the ones below 45° indicate an increasing elastic behavior. Based on this statement, the liquid-to-solid transition occurs between 2 and 3 wt.% in composites from the CNT powder; this is also consistent with the G′ behavior (Figure 1). Composites from MB (Figure 4(right)) present a behavior much like the neat polymer with no phase angles below 80° at low complex modulus values, indicating no clear rheological percolation threshold.
Capillary test
Figure 5 shows the viscosity curves of all materials under study at 190°C as a function of shear rate. Viscosity curves of nanocomposite melts exhibit non-Newtonian behavior in the whole shear rate range under study. The behavior agrees with typical shear thinning results that show a huge dependence of the viscosity on the shear rate. In previous similar studies, the shear thinning behavior comprised the lower shear rates as the CNT content increased. This has been attributed to an alignment of the nanotubes along the flow direction (Boronat et al., 2012).
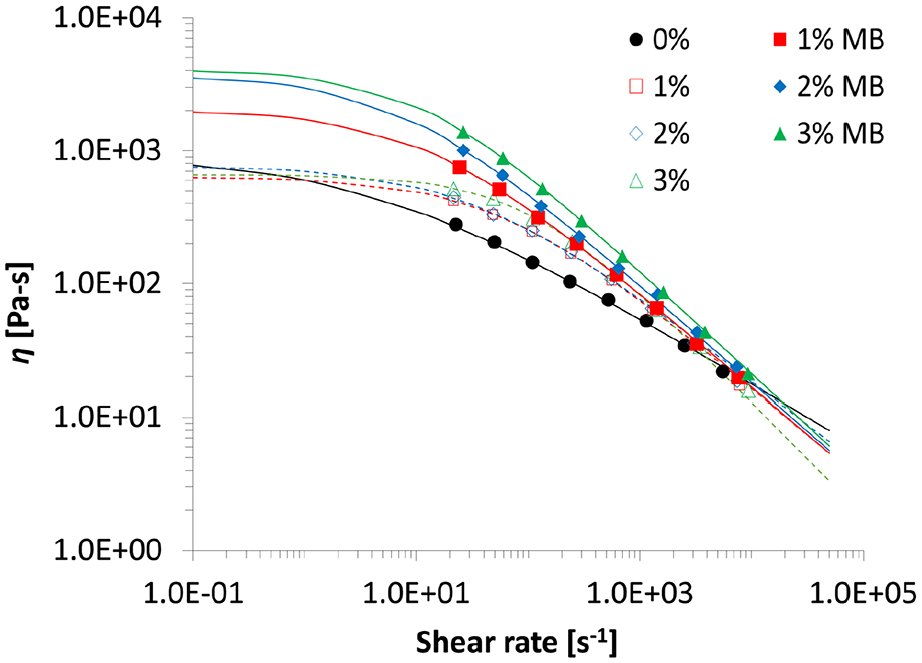
Shear viscosity at 190°C for all samples under study. Solid lines for composites from the masterbatch and dashed lines for composites from the CNT powder.
Viscosity increment with particle content is due to the interaction between the matrix and filler. The effect is more pronounced at low shear rates and decreases with increasing shear rate because of shear thinning. The zero-shear viscosity, that is, at the lowest shear rate (∼25 s−1) by capillary rheometry, augments from 277.8 Pa s for 0% P to 515.2 Pa s for 3% and 1379.4 Pa s for 3% MB.
Although the viscosity usually increases with CNT content (Boronat et al., 2012), viscosity reductions have also been previously found in polymer nanocomposites of well-dispersed nanoparticles, and it has been attributed to polymer confinement that may either cause enhanced constraint release and/or induce free volume effects (Vega et al., 2014). By looking at the differences in the viscosity increments from 0% to the different composites, the ones from the direct CNT compounding present less of an increase than those from MB, implying a better dispersion of filler in composites where the CNT were added directly.
From a free surface process point of view, the extensional properties of the melt are of special interest as they describe how the material will behave during and after processing. From capillary rheometry and by means of the Cogswell analysis, data on elongational viscosity (ηe) as a function of elongational rate (
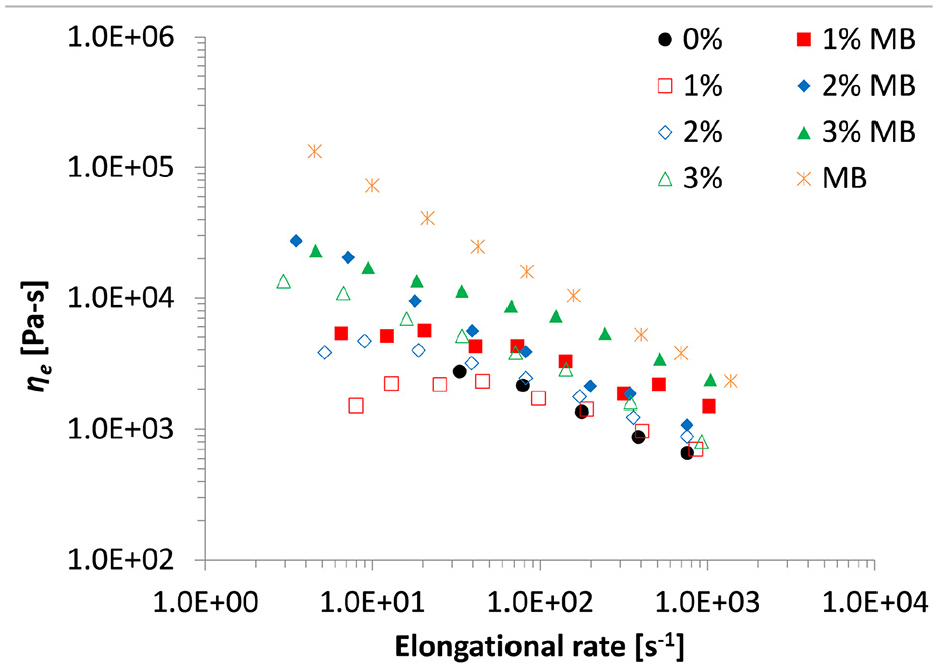
Elongational viscosity at 190°C for all samples under study. Solid symbols for composites from the masterbatch and open symbols for composites from the CNT powder.
Extensional viscosity presents clearly different behavior in composites from the CNT powder compared with the values of the composites from the masterbatch, particularly at low elongational rates. Below an elongational rate of 100 s−1, the elongational viscosity increases with increasing CNT concentration, and the effect is more dramatic for MB composites especially because in the other rheological tests the 1 and 2 wt.% were not as clearly different. For the 1 and 2 wt.% CNT powder composites, ηe increases with increasing
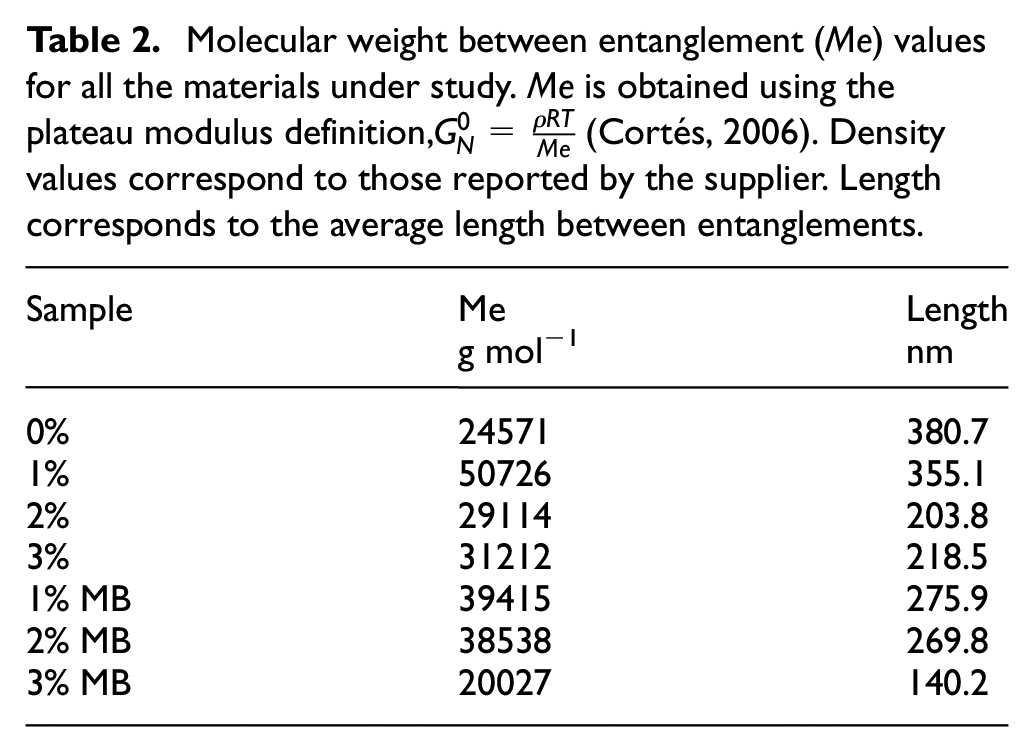
As stated before, it was expected to not observe a huge difference in the extensional viscosity behavior because of the presence of the CNT, since extensional properties are dependent on the motion of the material at entanglement length scales. In this case, the CNT have a mean length of 1500 nm. Compared with the mean values of length between entanglements calculated from the entanglement molecular weight (Me) (Table 2), they are an order of magnitude smaller, suggesting that polymer chains can entangle over the CNT several times. However, experimental results show clear differences between PP and the nanocomposites from both the CNT powder and masterbatch. Therefore, the number of interactions of the CNT are increased for the depicted square network, and then the CNT act as entanglement enhancers affecting at some level the elongational behavior.
Molecular weight between entanglement (Me) values for all the materials under study. Me is obtained using the plateau modulus definition,
Electrical conductivity
Electrical resistivity has shown high sensitivity to the microstructure of the nanocomposite, for example, the dispersion state and aspect ratio of the reinforcement. This property can be used as an indirect tool to learn about the dispersion state of the filler (Al-Saleh, 2015b). Two mechanisms exist for electrical conduction in CNT composites: direct conduction in which fillers are in direct contact, and electron hopping where electrons jump from filler to filler over a small distance, known as the tunneling effect (Penu et al., 2012).
Rectangular samples with a uniform cross-sectional area were cut, and their electrical resistance was measured at room temperature. The resistivity (ρ) was calculated by
Electrical test results for all samples under study.
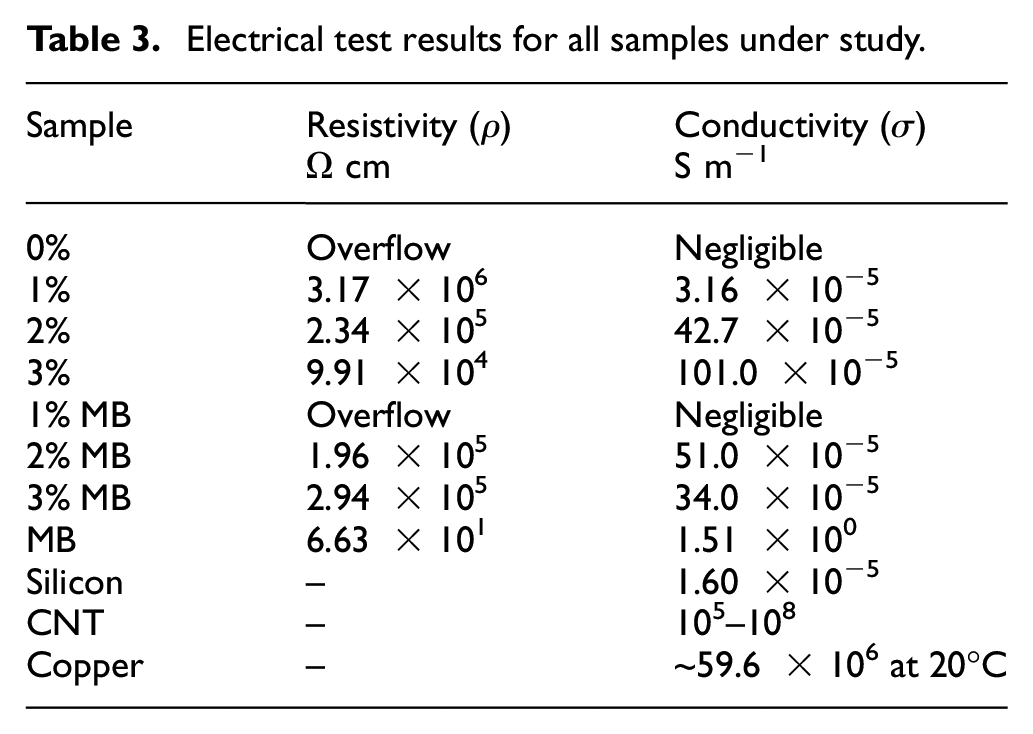
The aspect ratio of the CNT used is approximately 158, and conductivity has been found to be in the range of 1 to 3 wt.% filler loading for very high aspect ratios (∼1000) (Al-Saleh, 2015b; Grossiord et al., 2006; Zhong et al., 2014). Also, the electrical percolation threshold appears to be between 1 and 2 wt.% CNT loading even if the aspect ratio is one order of magnitude smaller than previous research has stated as minimum values to obtain a conductive network. No functionalization treatment was made neither to the polymer nor to the multi-wall CNT to enhance wettability; however, some degree of immiscibility between PP homopolymer and the copolymer may have hindered the improvement in conductivity for the MB composites (Graziano et al., 2018).
Interestingly, the 3 wt.% composites present a one order of magnitude difference when comparing both CNT sources. This can be attributed to the fact that composites from MB have had at least one more thermal treatment compared with the ones from the CNT powder. A possible explanation to such behavior has been proposed by Al-Saleh (2015b), stating that single dispersed nanotubes can have polymer chains wrapped around them functioning as isolators and serving as a detriment in the nanocomposite conductivity in spite of the enhanced CNT dispersion.
The electrical percolation threshold was obtained to compare it with the rheological one. The general power-law correlation was used,
Morphological characteristics of PP/CNT composites
Characterization of the dispersion and orientation of nanoparticles in the polymer matrix are critical for developing fundamental structure–property correlations. A uniform and homogenous dispersion of CNT in the matrix plays a key role in the macroscopic properties of the material (Pan and Li, 2013).
SEM images in Figure 7 show the fractured surfaces of the composites prepared. For all three different filler contents of the composites from as-received CNT (a, c and e), a homogeneous dispersion of the nanotubes can be observed in the matrix, with only small amounts of aggregates. It is believed that these loose aggregates’ effect would be trivial compared with the one produced by the large amount of dispersed CNT (Pan and Li, 2013).
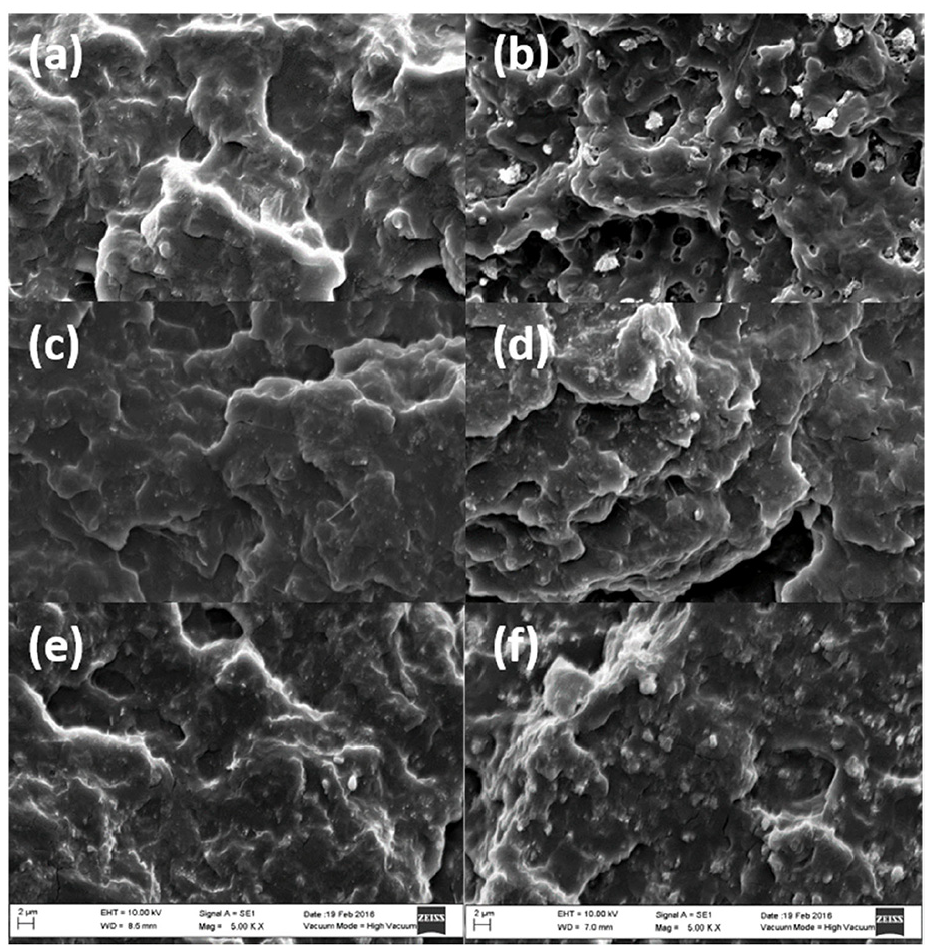
SEM images of composites from as-received CNT: (a) 1 wt.%, (c) 2 wt.%, and (e) 3 wt.%; images from the masterbatch (b) 1 wt.%, (d) 2 wt.%, and (f) 3 wt.%.
On the contrary, in composites from the masterbatch (b, d, and f), the presence of agglomerates is evident starting at 1 wt.% loading. This can be attributed to the fact that the CNT are well wetted by the masterbatch polypropylene (MFI 12 g/10 min), making it difficult to achieve a better degree of dispersion of the CNT in the PP matrix (MFI 2 g/10 min) because of the differences not only in the MFI of the polymers involved but also in the differences in their surface tensions leading to an immiscibility of the PP present in the CNT masterbatch (Graziano et al., 2018).
For samples with 3 wt.%, the images look more similar than the other compositions. However, a slightly larger amount of agglomerates can be observed in the one from the masterbatch (f) than can be observed in the one prepared from the as-received CNT (e). This dissimilarity is clear when analyzing the resistivity of the materials, where the difference is one order of magnitude going from 1×10⁵ Ω cm for the 3% direct compounding to 3 ×10⁵ Ω cm for the 3% MB.
TEM characterization was conducted to investigate the dispersion of CNT at the nanoscale. Figure 8 presents the TEM micrographs of samples with 3 wt.% from both CNT sources. The CNT dispersion seems good for the direct compounding (a1, b1), where the PP–HDPE random copolymer chains have infiltrated the CNT aggregates, compared with the masterbatch dilution (a2, b2) where large agglomerates can be identified. The level of dispersion can be attributed to the difference in viscosity between the masterbatch PP and the matrix PP/HDPE random copolymer, as well as their differences in surface tension, as has been reported in previous research (Mičušík et al., 2009). The latter being higher and therefore hindering the correct dilution of the masterbatch. Agglomerates shown in Figure 8 (a2, b2) look to be encapsulated by the masterbatch PP instead of entangled with one another, corroborating the influence of the difference in viscosity and surface tension.
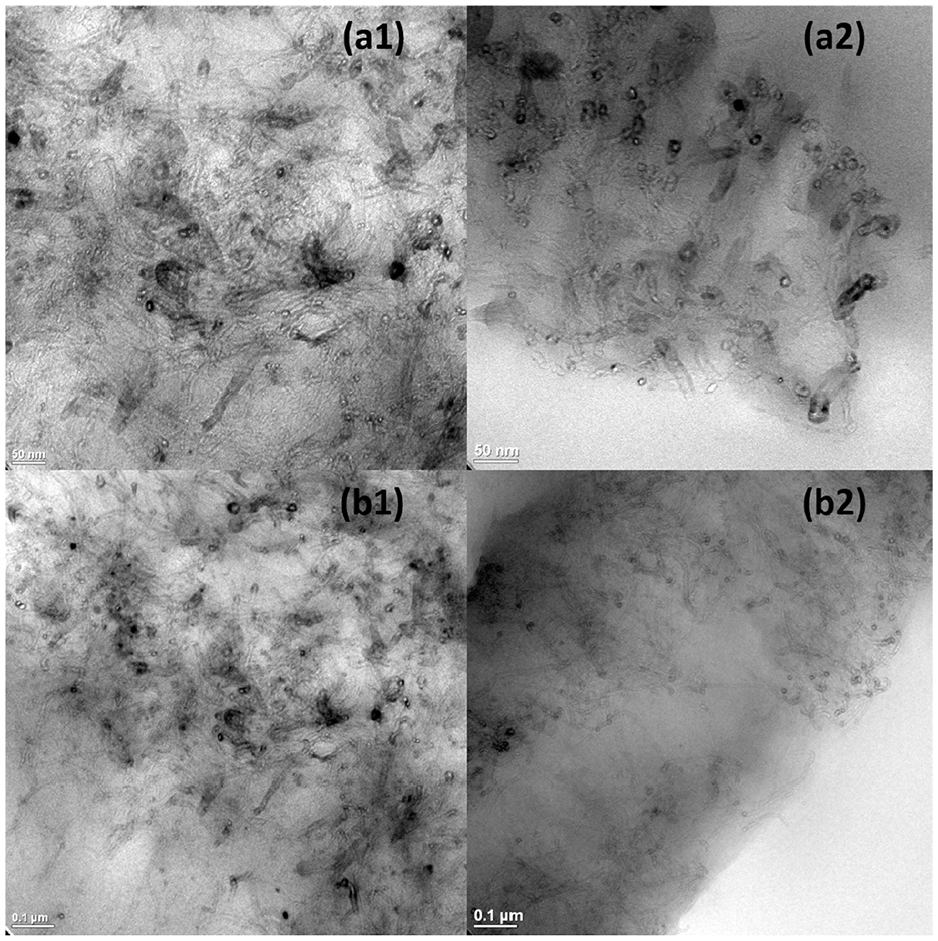
TEM images of 3 wt.% composites from the as-received CNT (a1, b1) and the masterbatch (a2, b2).
The difference in states of dispersion appreciated in Figures 7 and 8 is the simplest explanation for the variations found in their basic rheological characteristics (Vega et al., 2014) because the CNT used for all of the prepared materials are the same.
Characterizing the dispersion of CNT in polymer matrices remains a challenge because of the difficulty of detecting the dispersion state at the nanoscale. Even if optical microscopy, SEM, and TEM have been extensively used, the micrographs obtained are not representative of the whole material (Song, 2006).
The use of a masterbatch was expected to greatly enhance the dispersion of CNT into the matrix and thus obtain a conductive composite. Several factors have influenced the behavior of the samples in this study, including surface tension, blend behavior and working shear rate.
To attain a good dispersion of CNT in the matrix, it is not enough to have a commercial masterbatch, which is supposed to facilitate the mixing of the filler, but also to assure the compatibility between the composite matrix and the masterbatch matrix. The use of a random copolymer with a high PP content of around 90% was expected to have a very good mixing behavior; however, that prove to be the opposite. In this case, the viscosities of both polypropylenes are very different: 2 g (10 min.)−1 for composite matrix and 12 g (10 min.)−1 for MB matrix. Solubility variations because of molecular weight and viscosity differences are known to influence in the different applications of polymers. Small quantities of polyethylene present in the copolymer may have also caused a huge impact in the dispersion of CNT. The difference in surface tension between polypropylene and polyethylene is ∼1.6 mJ/m2 (Kwok et al., 1998), which may lead to the formation of clusters and have implications in the dispersion of CNT. As stated by other authors (Mahajan et al., 1996), the PP–PE blends are heterogeneous and crystallize independently but some show also improvements in end-use and mechanical properties (Xu et al., 2018).
Even though viscosities of the various polymers present in the composites are different, their viscosities at the >100 s−1 shear rates at which they were prepared are more similar (see Figure 3). The interface of two immiscible liquids impact the momentum profiles greatly; but as they approach similar values, the difference, present mainly in the interface, vanishes (Bird, 2002).
Conclusion
Composites of 1, 2, and 3 wt.% were prepared by CNT melt compounding and dilution of a commercial masterbatch (20 wt.% CNT) into a high viscosity PP copolymer matrix. It was found that the compounding of CNT using a masterbatch effectively shows a higher increase of the elastic properties of the PP–HDPE random copolymer as compared to the ones for the composite created by direct CNT addition. The same behavior is observed for their shear viscosities specially at lower shear rates. The best CNT dispersion results were obtained by direct CNT compounding and a less effective dispersion of the CNT when the masterbatch was used. The reason for the poor dispersion is the immiscibility of the PP of the masterbatch in the PP–HDPE copolymer. Such immiscibility created a non-homogeneous melt where the PP domains acted as a damping region increasing the elasticity of the melt. On the other hand, the electrical properties of the composites are on the same order of magnitude; however, the ones obtained via masterbatch have a lower electrical conductivity due to the lower dispersion of the CNT in the matrix. Both, the elastic and dispersion differences between the two CNT addition modes can be observed in the Van Gurp–Palmen plots, the elongational viscosity data and from the SEM and TEM images. These results can be very promising for tailoring composites with specific elastic properties that at the same time present desirable electrostatic discharge characteristics, without compromising the processing behavior, since all the composites have about same viscosity in the shear rates typically used in polymer extrusion.
Footnotes
Acknowledgements
The authors would like to thank Malvern Instruments, Inc. and the Material Science and Nanoengineering Department of Rice University for their support in the capillary rheology and electrical conductivity tests, respectively. Special thanks to CONACyT for the student sustenance support and to Tecnologico de Monterrey for the PhD student scholarship, travel expenses and access to the Polymer and Rheology Laboratory.
Declaration of conflicting interests
The author(s) declared no potential conflicts of interest with respect to the research, authorship, and/or publication of this article.
Funding
The author(s) received no financial support for the research, authorship, and/or publication of this article.