
Abstract
A novel application of magnetostrictive actuators in underplatform dampers of bladed disks is proposed for adaptive control of the normal load at the friction interface to achieve the desired friction damping in the structure. Friction damping in a bladed disk depends on operating parameters, such as rotational speed, engine excitation order, nodal diameter normal contact load, and contact interface parameters, such as contact stiffness and friction coefficient. The operating parameters have a fixed value, whereas the contact interface parameters vary in an unpredictable way at an operating point. However, the ability to vary some of these parameters such as the normal contact load in a controlled manner is desirable to attain an optimum damping in the bladed disk at different operating conditions. Under the influence of an external magnetic field, magnetostrictive materials develop an internal strain that can be exploited to vary the normal contact load at the friction interface, which makes them a potentially good candidate for this application. A commercially available magnetostrictive alloy, Terfenol-D is considered in this analysis that is capable of providing magnetostrain up to 2 × 10⁻³ under prestress and a blocked force over 1500 N. A linearized model of the magnetostrictive material, which is accurate enough for a direct current application, is employed to compute the output force of the actuator. A nonlinear finite element contact analysis is performed to compute the normal contact load between the blade platform and the underplatform damper as a result of magnetostrictive actuation. The nonlinear contact analysis is performed for different actuator mounting configurations and the obtained results are discussed. The proposed solution is potentially applicable to adaptively control vibratory stresses in bladed disks and consequently to reduce failure due to high-cycle fatigue. Finally, the practical challenges in employing magnetostrictive actuators in underplatform dampers are discussed.
Keywords
1. Introduction
Dry friction damping is widely used to reduce vibratory stresses in bladed disks to avoid failure due to high-cycle fatigue (Griffin, 1980; Srinivasan and Cutts, 1983). Friction damping is the most popular solution in this field, since it works effectively in harsh environmental conditions and it is very economical. Different designs of friction damper, such as underplatform dampers (UPDs), shroud and snubber contacts, lacing wire, ring dampers, blade roots, strip damper, and multiple friction contacts, are investigated in the literature to characterize their damping potential and to design the best possible solution for a given bladed disk (Afzal et al., 2016; Laxalde et al., 2007, 2010; Lesaffre et al., 2007; Petrov and Ewins, 2006, 2007; Szwedowicz et al., 2008b; Wu et al., 2012; Yang and Menq, 1997a; Zucca et al., 2012). In addition, several numerical tools (Petrov and Ewins, 2002; Sextro, 2000; Yang and Menq, 1997b) are developed to predict the nonlinear response of a bladed disk with friction contacts. Nevertheless, the experimental studies (Sanliturk et al., 2001; Sever et al., 2008; Szwedowicz et al., 2008a) performed by several researchers indicate that the simulated and measured nonlinear response curves often differ in amplitudes and resonance frequencies, which is attributed to the complicated nature of measurement, contact modeling approach, and the variability in the input data.
The nonlinear forced response curve depends on operating parameters (rotational speed, engine excitation order, nodal diameter, and normal load), contact interface parameters (normal and tangential contact stiffness and friction coefficient), and relative motion at the friction interface. The operating parameters have a fixed value at an operating point, and therefore, friction dampers are often tuned for a single nodal diameter and engine excitation order (Szwedowicz et al., 2005). The UPDs that are commonly adopted to mitigate resonant vibration are often optimized with respect to their mass that determines the normal contact load at the friction interface. A typical variation of the nonlinear forced response curve with normal contact load, is shown in Appendix 1, indicates that the optimum damping in the system occurs at a particular normal load. However, due to uncertainty and variability of the contact interface parameters, the friction damping obtained, in practice, may differ significantly from the optimum value. Moreover, in the real operating conditions, the nonlinear forced response curve can deviate from the predicted response curve, due to parameters that are not considered in the simulation. Therefore, this article proposes a novel method to control the normal contact load adaptively, in a way that the optimum friction damping in the system can be achieved despite the variation in the interface parameters and other unknown factors. Moreover, resonances at different operating conditions are possible to damp using adaptive control of the normal load.
To achieve an adaptive control of the normal load, use of a magnetostrictive actuator is proposed in this article. Terfenol-D is an often used commercially available magnetostrictive alloy for actuator application due to its high magnetostrain capacity, fast response, and high magneto-elastic transduction efficiency (>50%) and therefore also known as giant magnetostrictive material (GMM; Zhang et al., 2012). This means that actuators driven by Terfenol-D have larger displacement and higher output force capacity compared to other common transducer materials. In this application, actuator displacement is restrained by the UPD walls, as described in section 4. This leads to a change in the contact load between the blade platform and the UPD as the magnetic field is altered in the actuator. A linearized model of the magnetostrictive actuator (Braghin et al., 2011) is employed to characterize the magnetoelastic behavior of the actuator. Three mounting configurations of the actuator are proposed for this application. The nonlinear static contact analysis of the bladed disk and the UPD reveals that a change in normal load more than 700 N can be achieved using a reasonable actuator size. This will give a very good control on friction damping once applied in practice.
This article is organized as follows: Section 2 gives an overview of GMM, section 3 describes the linear modeling approach used in this article, section 4 details the proposed mounting designs of actuator, section 5 presents finite element (FE) contact analysis results, and section 6 concludes the study.
2. GMM
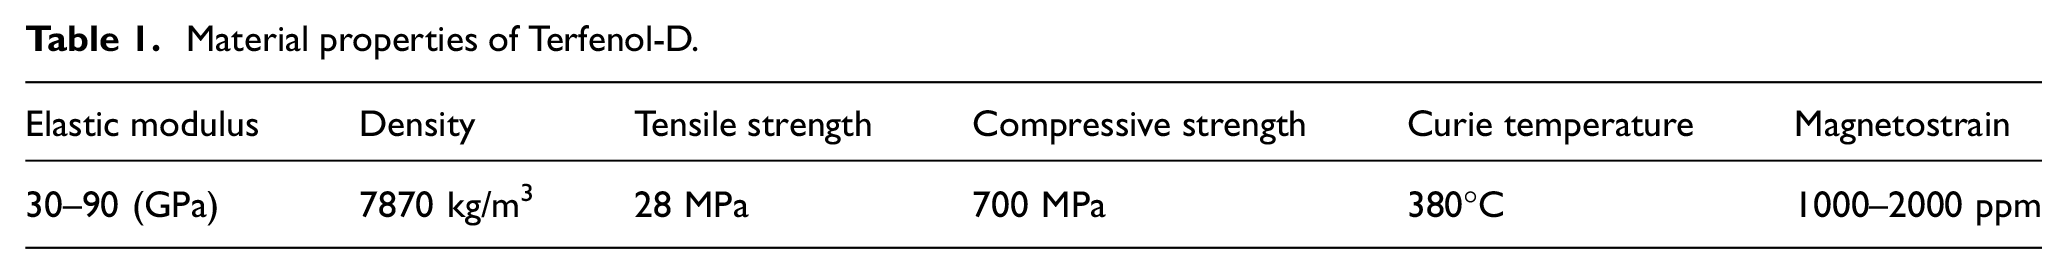
The GMM Terfenol-D (Tb0.3Dy0.7Fe1.95) is a compound of the rare earth metal terbium, dysprosium, and iron. It is used in a wide range of quasi-static and dynamic applications, for example, active noise and vibration control, acoustic devices, linear and rotational motors, ultrasonic cleaning, micro-positioning, infrastructure applications, and many other actuation and sensing devices (Dapino, 2004). The magnetostriction property of GMM involves a bidirectional energy exchange between magnetic and elastic states of the material, and therefore, it provides mechanisms both for actuation and sensing (Olabi and Grunwald, 2008). Strain generated in the GMM is caused by the re-orientation of the small magnetic domains in the direction of the applied magnetic field, which is known as Joule effect (Calkins et al., 2007; see Figure 1(a)). Conversely, mechanical stress imposed on the GMM can produce measurable changes in magnetization, known as the Villari effect (Calkins et al., 2007) which is used in sensing applications. In this article, we focus on the Joule effect for the purpose of quasi-static actuation. Nominal material properties of Terfenol-D are listed in Table 1. Material properties such as the elastic modulus E often vary substantially during operation (Kellogg and Flatau, 1999), and the magnetostrain (
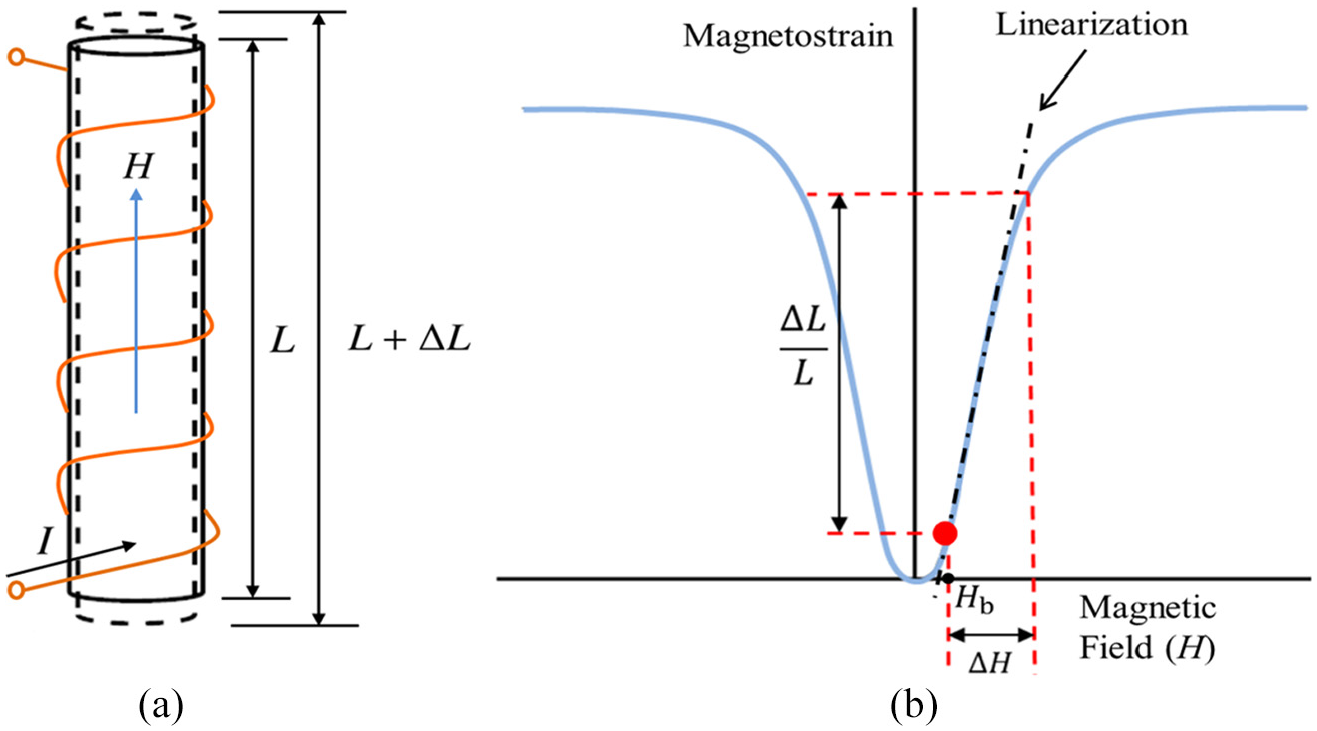
(a) Joule magnetostrain produced by a magnetic field H. (b) Magnetostrain
Material properties of Terfenol-D.
Hysteresis behavior (not shown in the figure) is also present in the
3. Linear modeling of magnetostrictive actuator
Computation of the stress and strain generated by the input current I in a GMM actuator is a complex task due to its bidirectional energy exchange characteristic and nonlinearity present in the
The primary components of a magnetostrictive actuator are shown in Figure 2 and consist of a cylindrical Terfenol-D rod, a wound coil, an enclosing permanent magnet, and a prestress mechanism. The rod is manufactured such that magnetic moments are primarily oriented perpendicular to the rod axis. Moreover, a prestress mechanism is required to fully align the distribution of magnetic moments perpendicular to the rod axis and to allow the transducer to be operated in compression (Zhang et al., 2004). A supplied current, flowing through the coil, generates a magnetic field inside the Terfenol-D rod. Consequently, this leads to an alignment of the magnetic domains along the longitudinal axis and thus generates a strain inside the rod and a high output force (Fm). Note that the output force is only generated if the end of the rod is constrained and is known as a blocked force (Fb) at an infinite blocking (see Figure 5(b)). Since infinitely rigid constraint is not practically possible in real life and therefore Fm < Fb in practice.
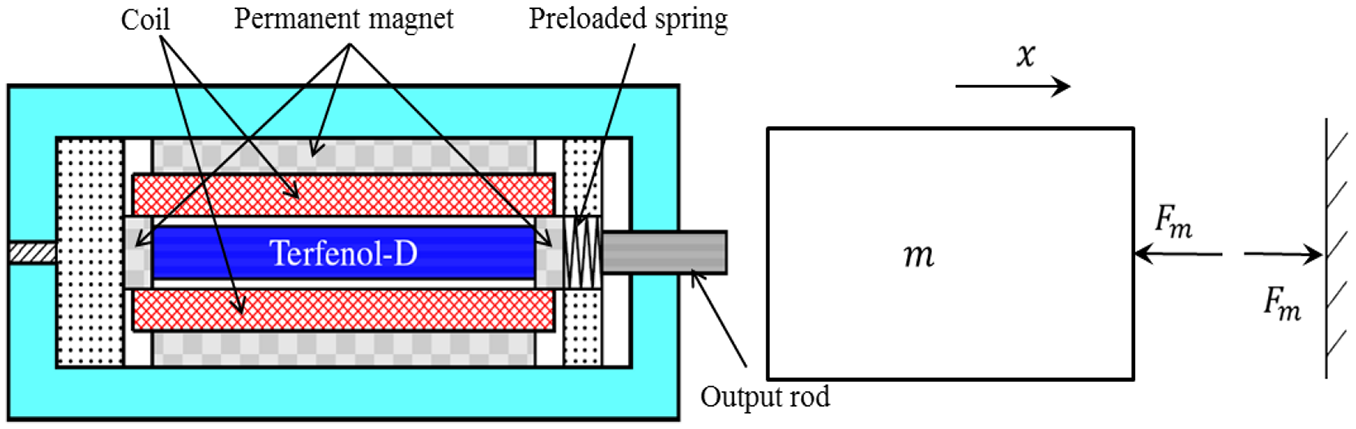
Typical actuator cross section and the output force schematic.
Linearization of GMM behavior is performed around the bias magnetism (Hb) under the following assumptions (Figure 1(b)):
Low working frequencies close to DC application;
Reversible magnetostriction processes (hysteresis can easily be avoided in a DC application);
Stress and strain distribution uniform throughout the magnetostrictive rod.
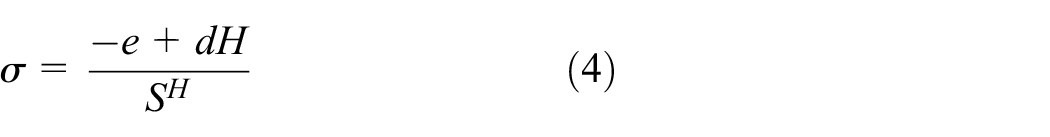
All the above assumptions are valid for a quasi-static application, and thus, the linear coupled magnetomechanical equations (Clark, 1980) read as


where e is the strain, σ is the stress, s
H
is the mechanical compliance at constant applied magnetic field strength H, and

where
Furthermore, Ampere’s law describes a simple relationship between the generated magnetic field H and the current I in a coil winding that reads
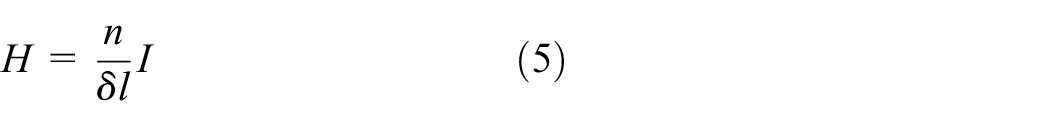
where n is the number of turns in the coil and

where L is the initial length of the rod at bias magnetism (
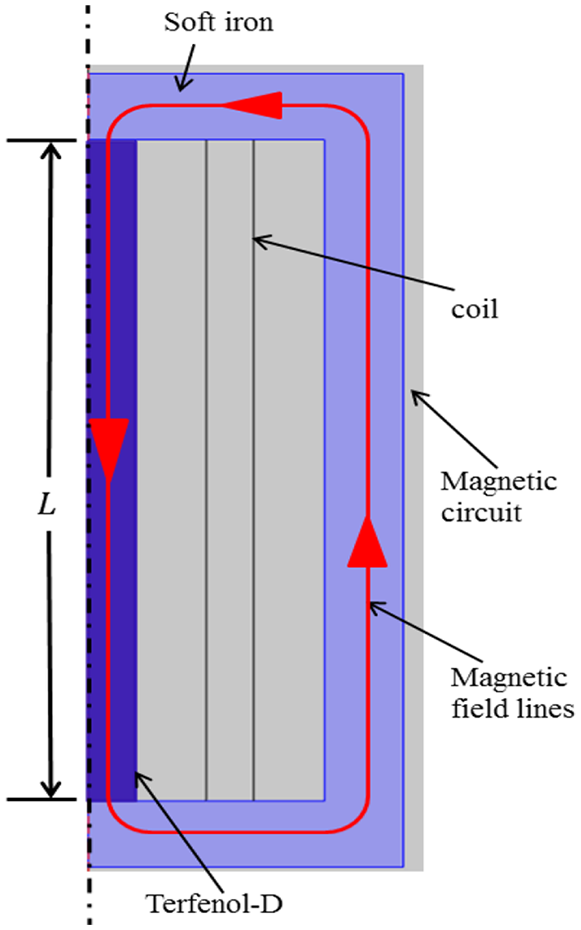
2D axisymmetric schematic of the actuator magnetic circuit and the magnetic lines (approximate path length = 2L).
Since the magnetic lines flow inside the ferromagnetic materials (soft iron and Terfenol-D) and due to the shape of the actuator, the suggested length of the magnetic field lines in Braghin et al. (2011) is twice the length of the magnetostrictive rod, that is,
Thus, equation (3) reads
where
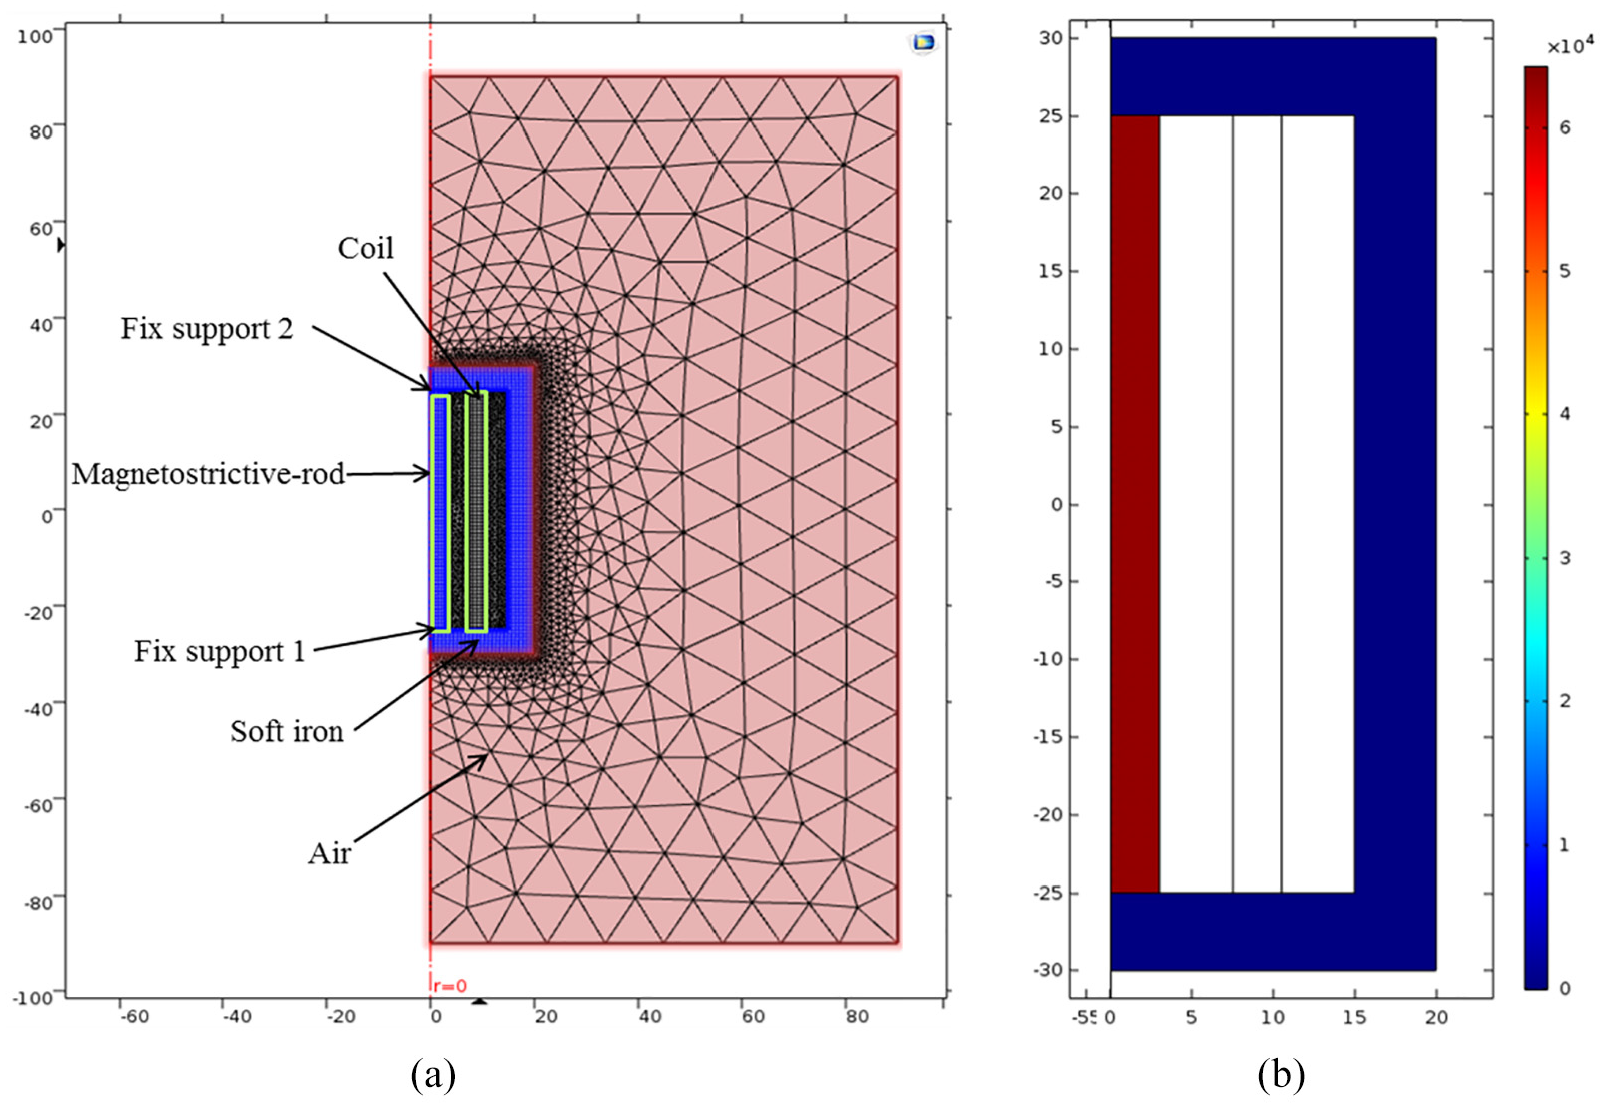
(a) 2D axisymmetric model of the actuator in COMSOL Multiphysics and (b) the magnetic field distribution at I = 3 A, where the lengths and magnetic field are in millimeter and Ampere/meter, respectively.
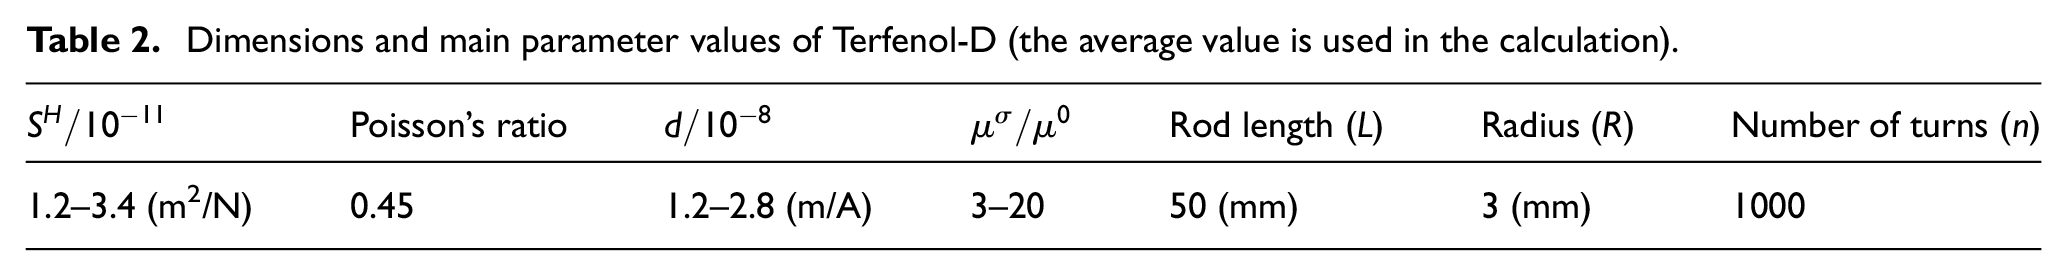
Dimensions and main parameter values of Terfenol-D (the average value is used in the calculation).
The computed distribution of the magnetic field using COMSOL at I = 3 A is shown in Figure 4(b) and depicts a discontinuity at the end of the Terfenol-D rod, while the magnitude of H inside the rod is very high compared to its casing, which is made of soft iron. This is due to the large difference in relative permeability between soft iron (
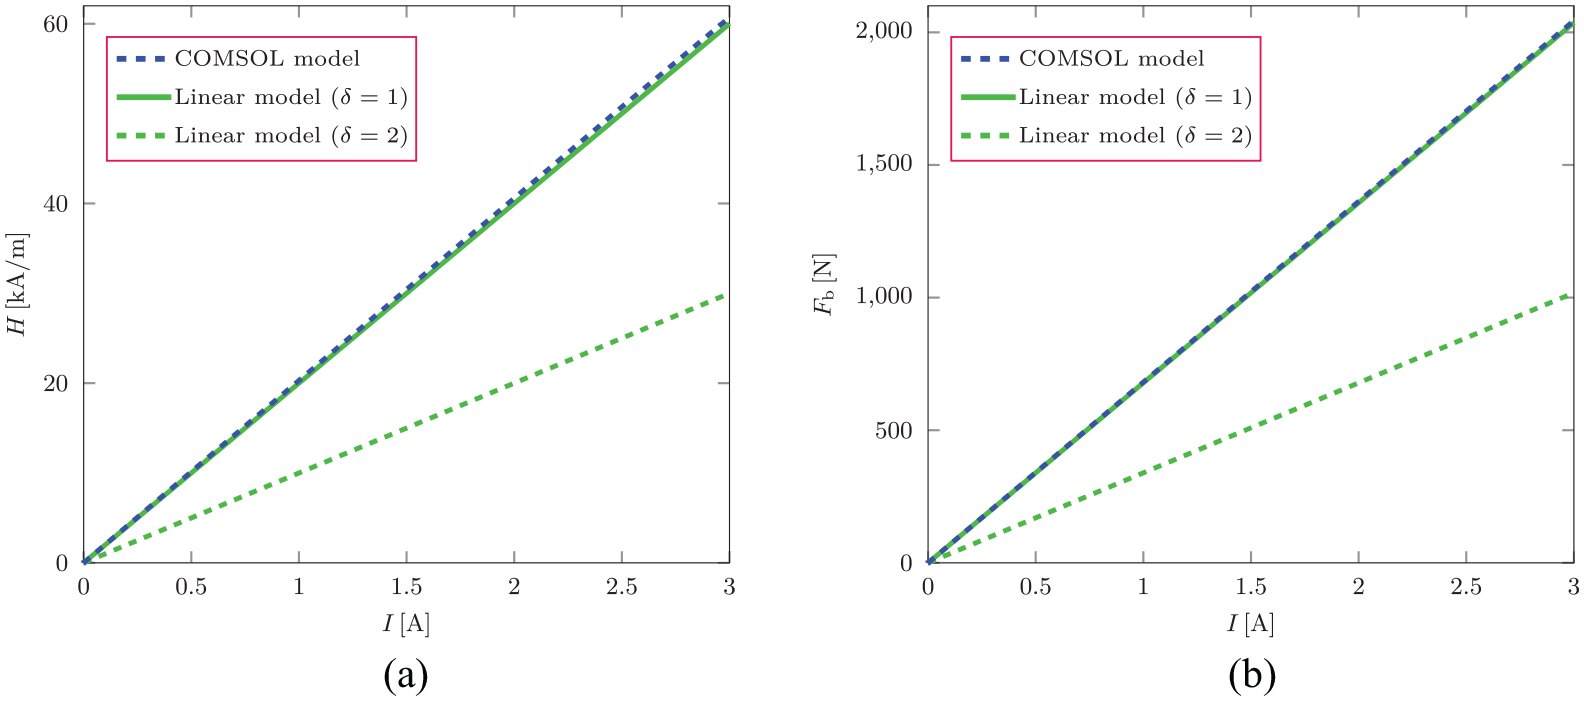
Comparison of the magnetic field (H) and the blocked force (Fb) obtained using the linearized model with a model in COMSOL: (a) The magnetic field and (b) the blocked force as a function of current (I).
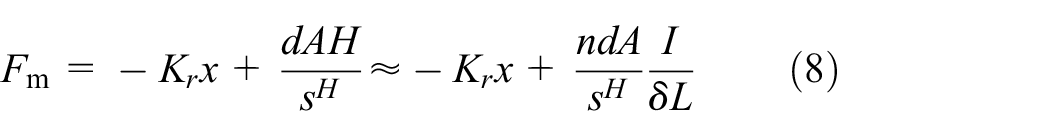
As mentioned before, the blocked force can be obtained by constraining the rod to an infinitely rigid support. This is achieved in the simulation by fixing both ends of the rod and solving the magnetomechanical equation (1), which is solved for the Terfenol-D rod only (see Figure 4(a)). The blocked force for the linear model is obtained by substituting x = 0 in equation (8). The obtained results are compared in Figure 5(b), and the curves are similar to Figure 5(a) and the results are in agreement for
4. Proposed design of actuator mounting
To generate an output force and transform it to the normal contact load between UPD and the blade platform, the standard design of a wedge damper (Borrajo et al., 2006) is modified to a thin wall damper and the actuator is placed between the damper walls as shown in Figure 6(b) to (d). Note that a thin wall UPD has a good damping potential of bladed disks as presented in Szwedowicz et al. (2008a). The actuator is fixed on the disk using a rigid support and the disk is assumed to be rigid enough in the radial direction. Three actuator mounting designs (dsg1 to 3) and two boundary conditions between the UPD walls and the actuator ends are proposed. The magnetostrictive rod length is 50 mm (Table 2) for dsg1 and 2 and it is half of this length for dsg3. In the first boundary condition (BC1), there is a frictional contact and in the second boundary condition (BC2), the UPD walls and the actuator ends are bonded. In other words, in the first case, relative motion between the actuator ends and the UPD walls is allowed and therefore the normal contact load on the blade platform has a contribution from the centrifugal load; whereas in the second case, the UPD is fixed with actuator and therefore the normal load is only controlled by the actuator output force.
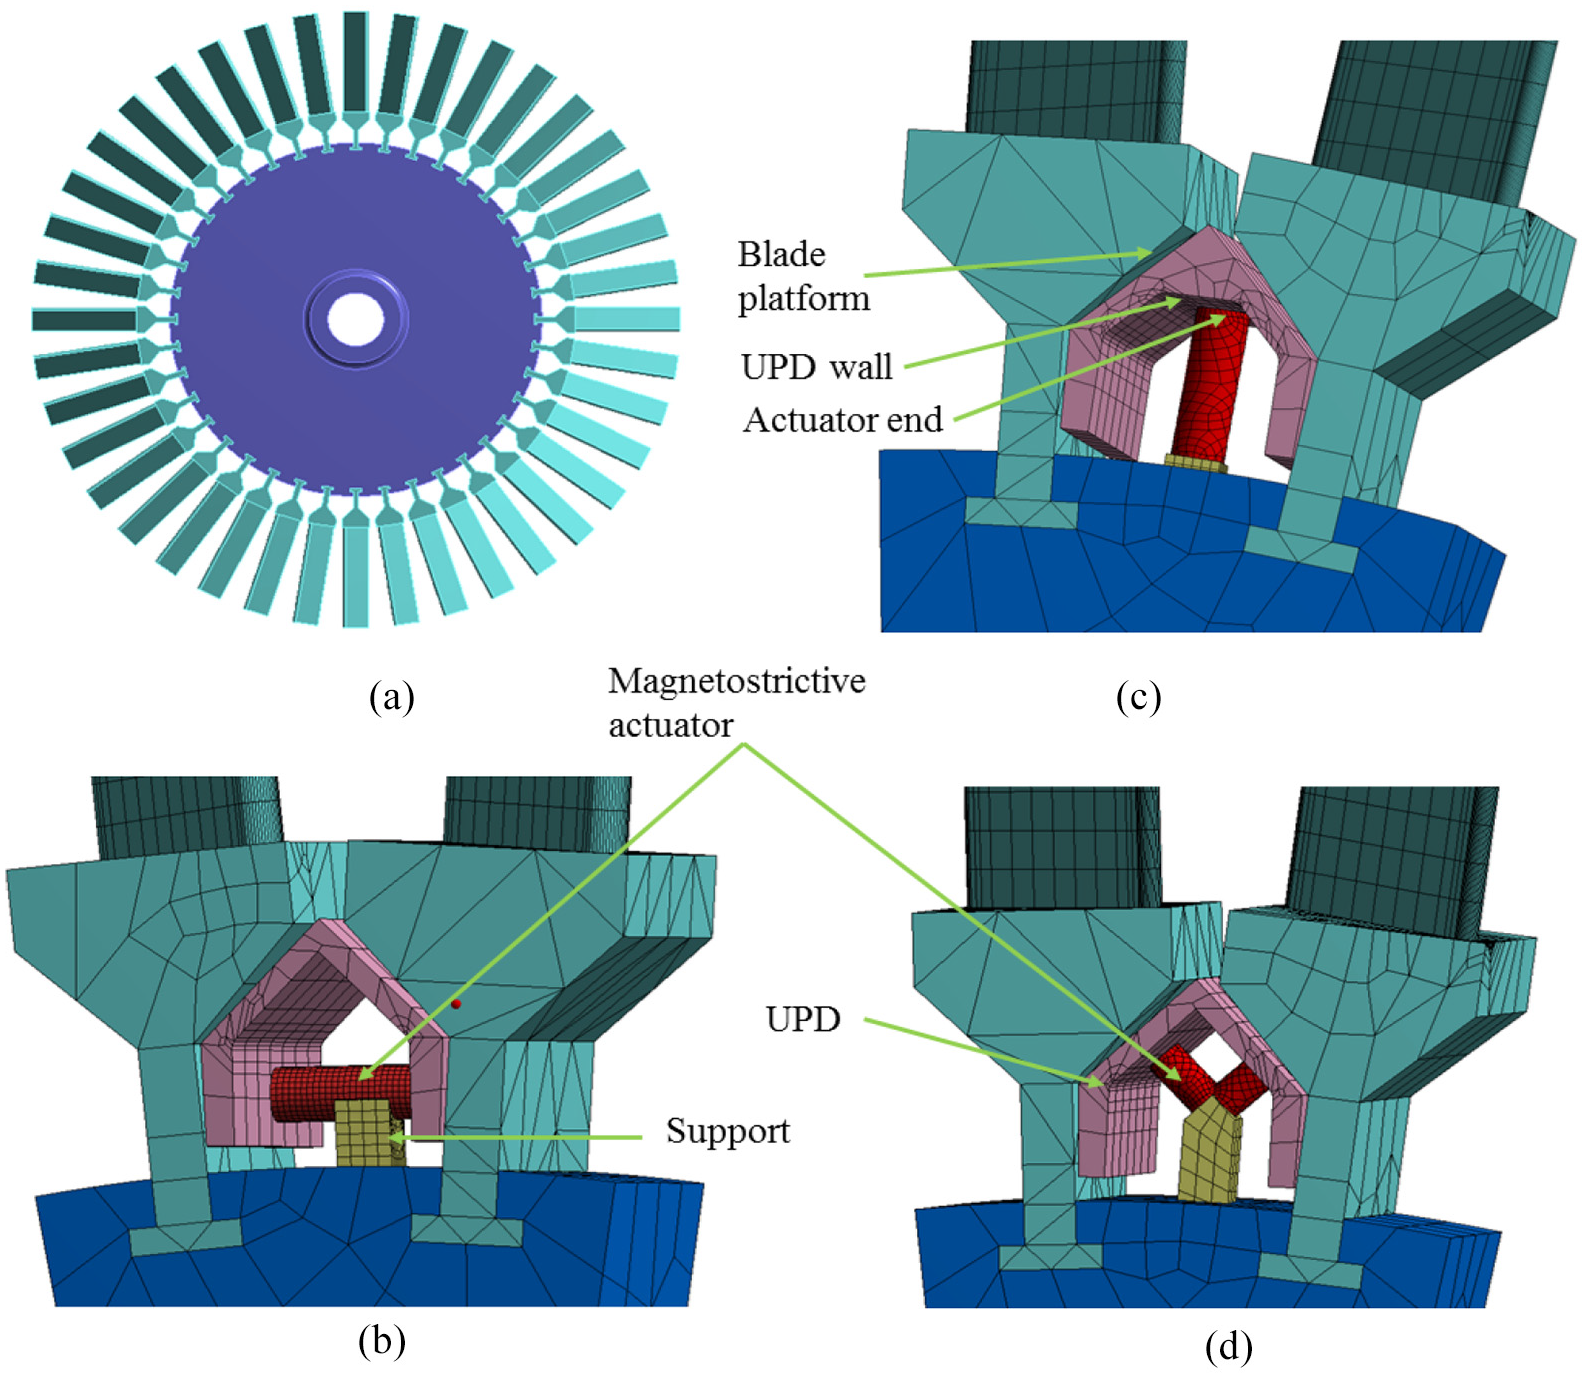
(a) Full bladed disk and the proposed design for actuator mounting, (b) dsg1, (c) dsg2, and (d) dsg3.
In the present analysis, the different designs aim at maximizing the transmissibility ratio of the normal load over the output force. Note that with the proposed mounting configurations, normal contact load can only be increased on the blade platform. Therefore, BC1 is potentially applicable where a high normal contact load variation is required on the blade platform such as for a large turbine with low rotational speed and high excitation amplitude. However, in the case of a medium-size bladed disk, BC2 is potentially applicable, where required variation in the normal load is moderate.
5. Adaptive control of normal load using output force
A simplified model of two blades is considered to demonstrate the proposed concept and to compute the resulting normal load (N0) between the blade platform and the UPD, as shown in Figure 7(a). The model is meshed with SOLID186 quadratic elements in ANSYS® and consists of 9834 nodes. The UPD is designed to accommodate the actuator and meshed separately with 4763 nodes. The material properties of the structural steel (E = 200 GPa and
(a) In the first example, the input current, I, is varied from 0 to 3 A and its influence on the change in the N0 is discussed.
(b) In the second example, the effect of friction coefficient on the N0 is analyzed for a constant current.
(c) In the last example, the input current and the friction coefficients are varied and their influence on the pressure distribution and the contact status of the UPD are analyzed.
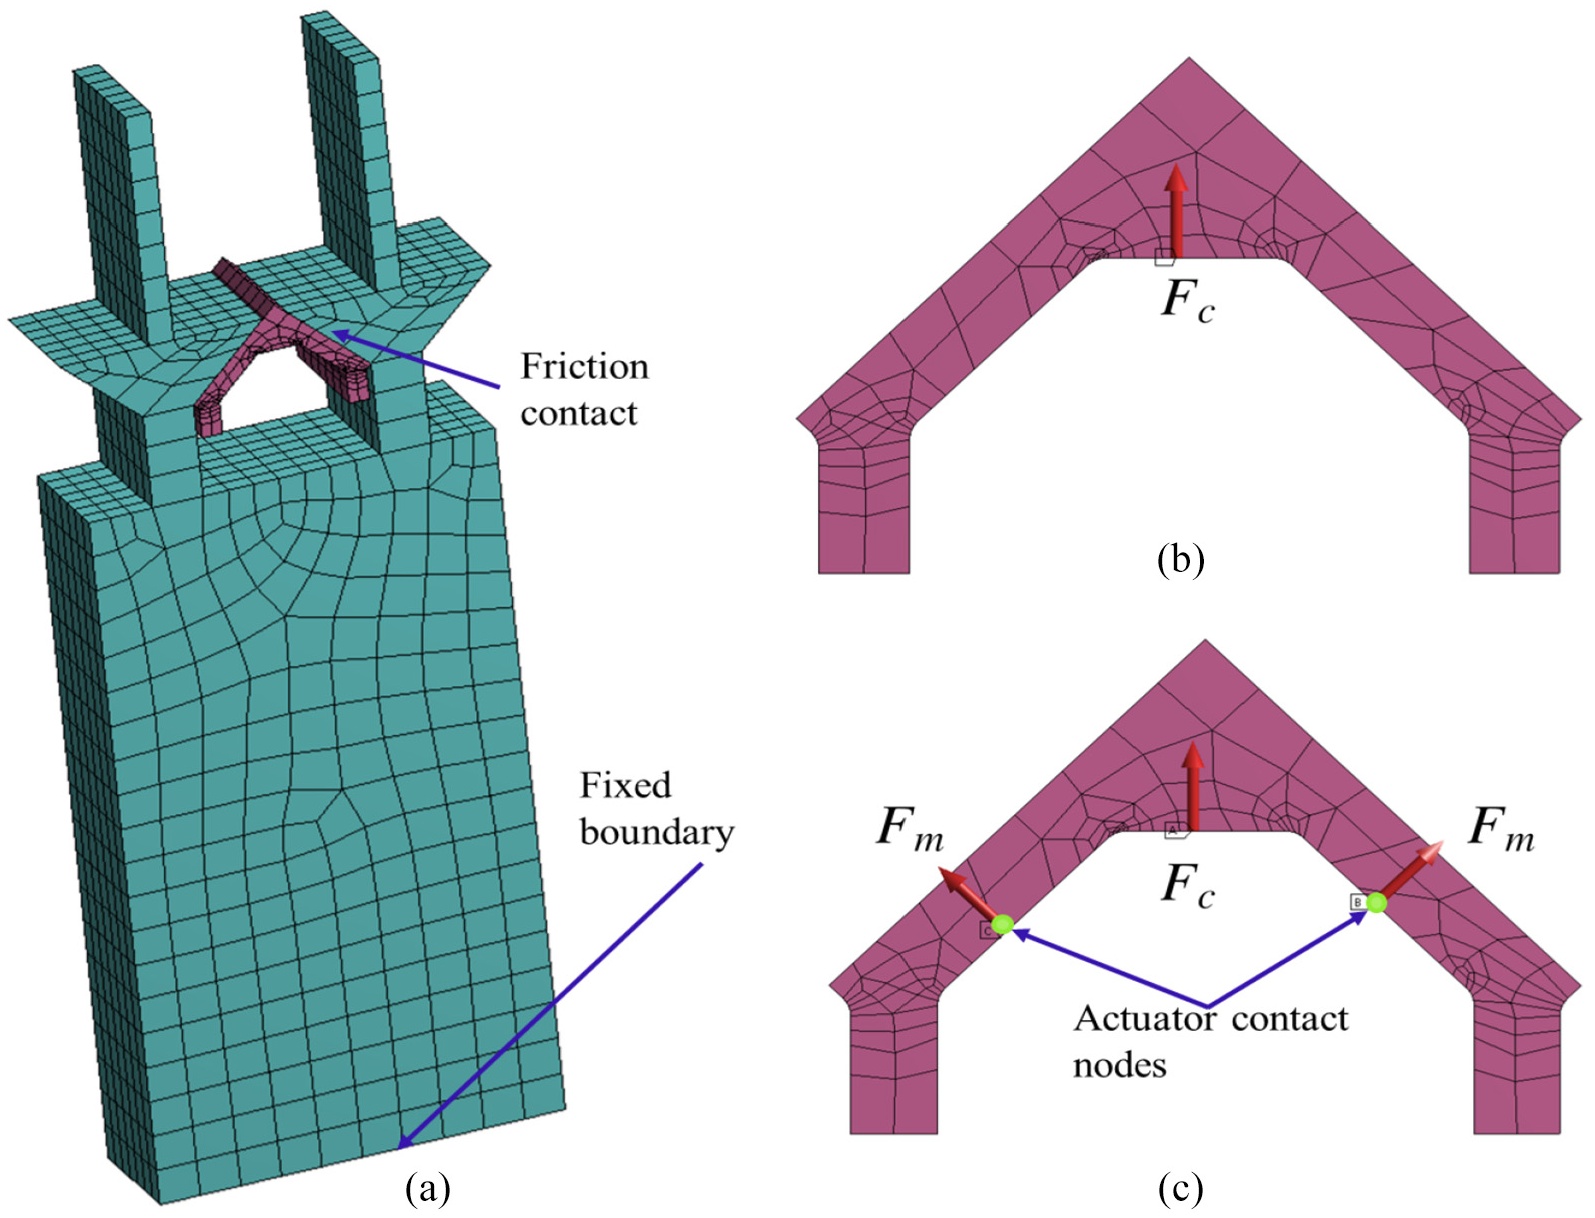
(a) Simplified model of two blades with UPD, (b) UPD with the centrifugal force (Fc), and (c) UPD with the centrifugal force and the output force for the actuator mounting dsg3.
5.1. Influence of input current on the normal load
The input current is altered from 0 to 3 A and its influence on N0 is analyzed in this example. The friction coefficient (
The resulting output force and the normal load on the blade platform as a function of input current for different mounting designs are depicted in Figure 8(a) and (b) for BC1 and BC2, respectively. The obtained relationship between the input current and the normal load is almost linear despite a nonlinear friction contact existing between UPD and the blade platform, which is a quite beneficial result from the computational perspective. For BC1, the computed normal load on the blade platform due to the centrifugal load only (
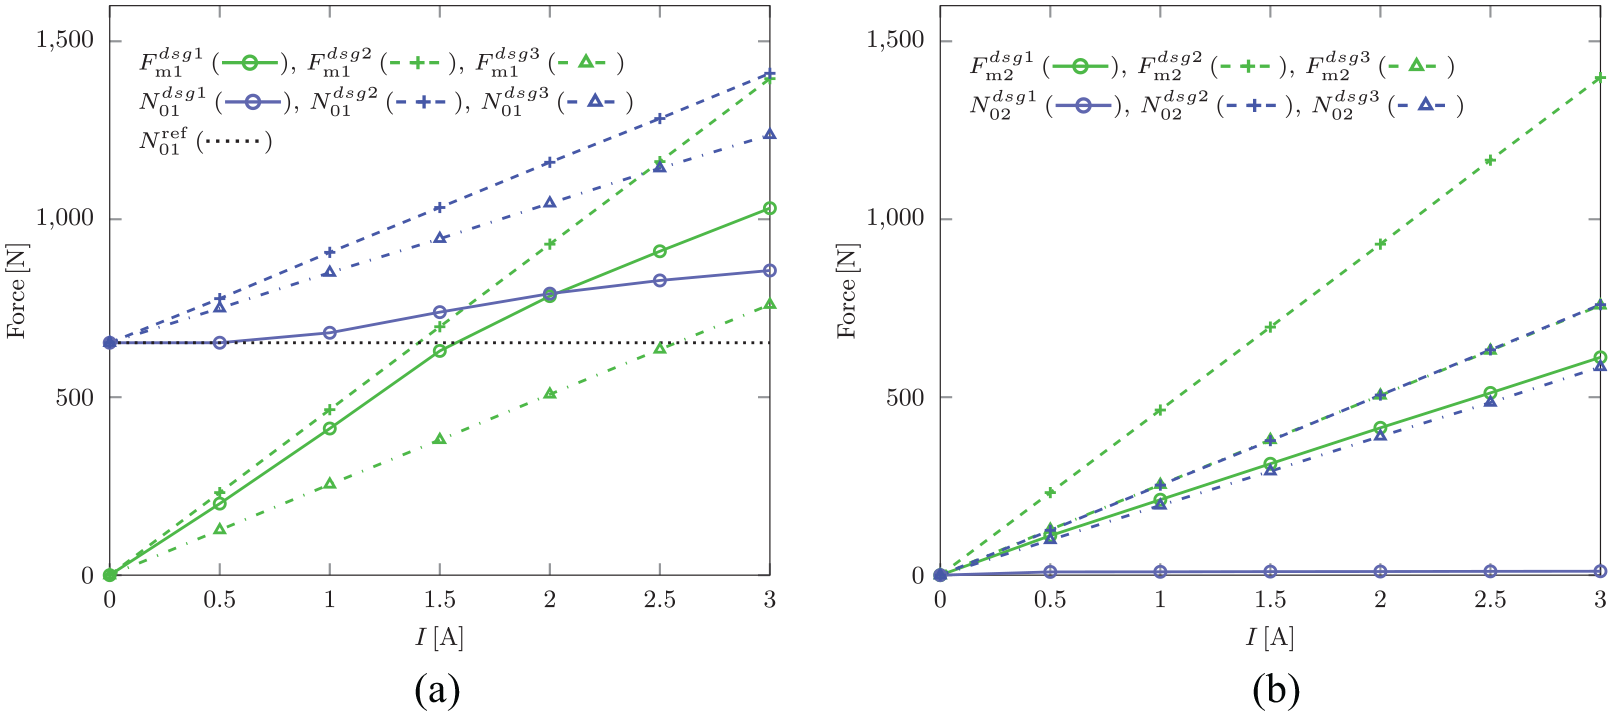
Variation in the normal load (N0) and the output force (Fm) with input current (I) at
For BC2, the change in the normal load due to the mounting dsg1 is negligible, and therefore, this design is not recommended for a practical application. The change in the normal load due to the mounting designs dsg2 and dsg3 are 760 and 585 N, respectively, at I = 3 A and the obtained values are the same as for BC1. In other words, the change in the normal load is independent of Fc for the mounting designs dsg2 and 3, but it is influenced by Fc for the dsg1.
For BC1, the design configuration dsg1 is the most preferable from the implementation point of view, since the radial and the axial motions of the UPD will not change the contact condition between the actuator ends and the UPD wall, but a smaller change in the normal load is transmitted to the blade platform. The other mounting configurations (dsg2 and dsg3) can provide a significant change in the normal load at the blade platform. However, they require the same contact condition between UPD and actuator before and after applying the centrifugal load. This may be a challenge in practice. The selection of the mounting design and the boundary condition depends on the dynamics of the bladed disk and the required variation in the normal contact load. Nevertheless, BC1 should be potentially employed where a high normal load is required to achieve the optimum damping in the system and the BC2 (with dsg2 and 3) is recommended for a low normal load case.
The transmissibility ratio of the normal load over the output force is presented in Figure 9(a) and (b) for BC1 and BC2, respectively. In both cases, mounting dsg3 has the highest transmissibility ratio and dsg1 has the lowest value for the range of input current. The results are in agreement with the previous discussions, and the obtained curves are horizontal for mounting dsg2 and dsg3. This means that the transmissibility ratio is independent of the input current, and therefore, the normal contact load can be determined without performing a nonlinear contact analysis if the ratio is known for one current value. Note that the line between 0 and 0.5 A has a slope since all forces are zero at I = 0 A. Furthermore, the transmissibility ratio for mounting dsg1 with BC1 increases with input current that indicates that mounting dsg1 will have a better performance at high input current.
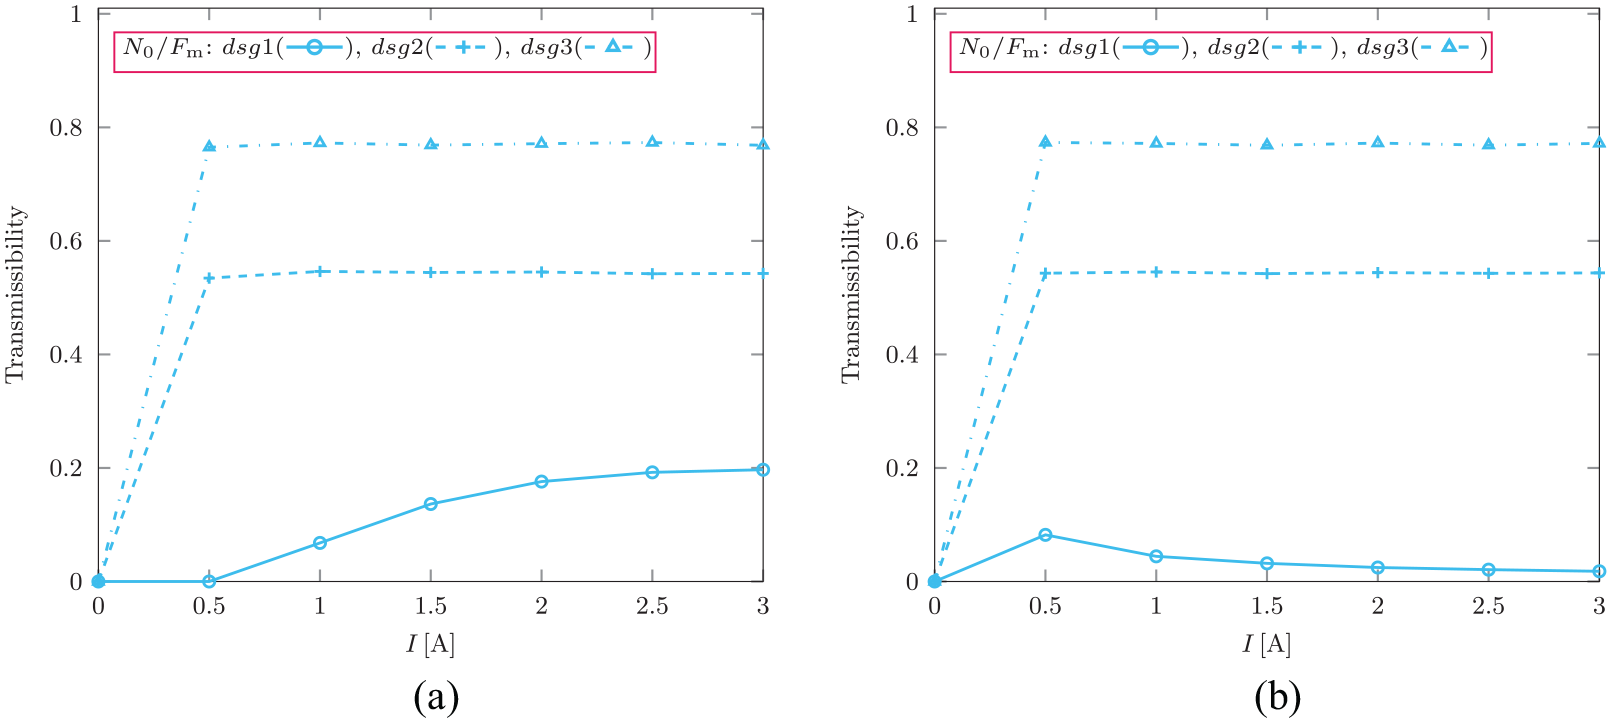
Variation in the force transmissibility (N0 = Fm) with input current (I) for (a) BC1 and (b) BC2 at
5.2. Influence of the friction coefficient
To analyze the effect of the friction coefficient on the normal contact load, the nonlinear static contact analysis is performed at a constant input current, I = 3 A. The corresponding blocked force for dsg1 and dsg2 is 2000 N and for dsg3 is 1000 N since the magnetostrictive rod is half of the original length in this case (Figure 6 and Table 2). The friction coefficient is altered from 0.01 to 1 and other parameters and the boundary conditions are the same as in the previous example.
The computed response curves are presented in Figure 10(a) and (b) for BC1 and BC2, respectively. In contrast to the previous example, the obtained curves are nonlinear in nature.
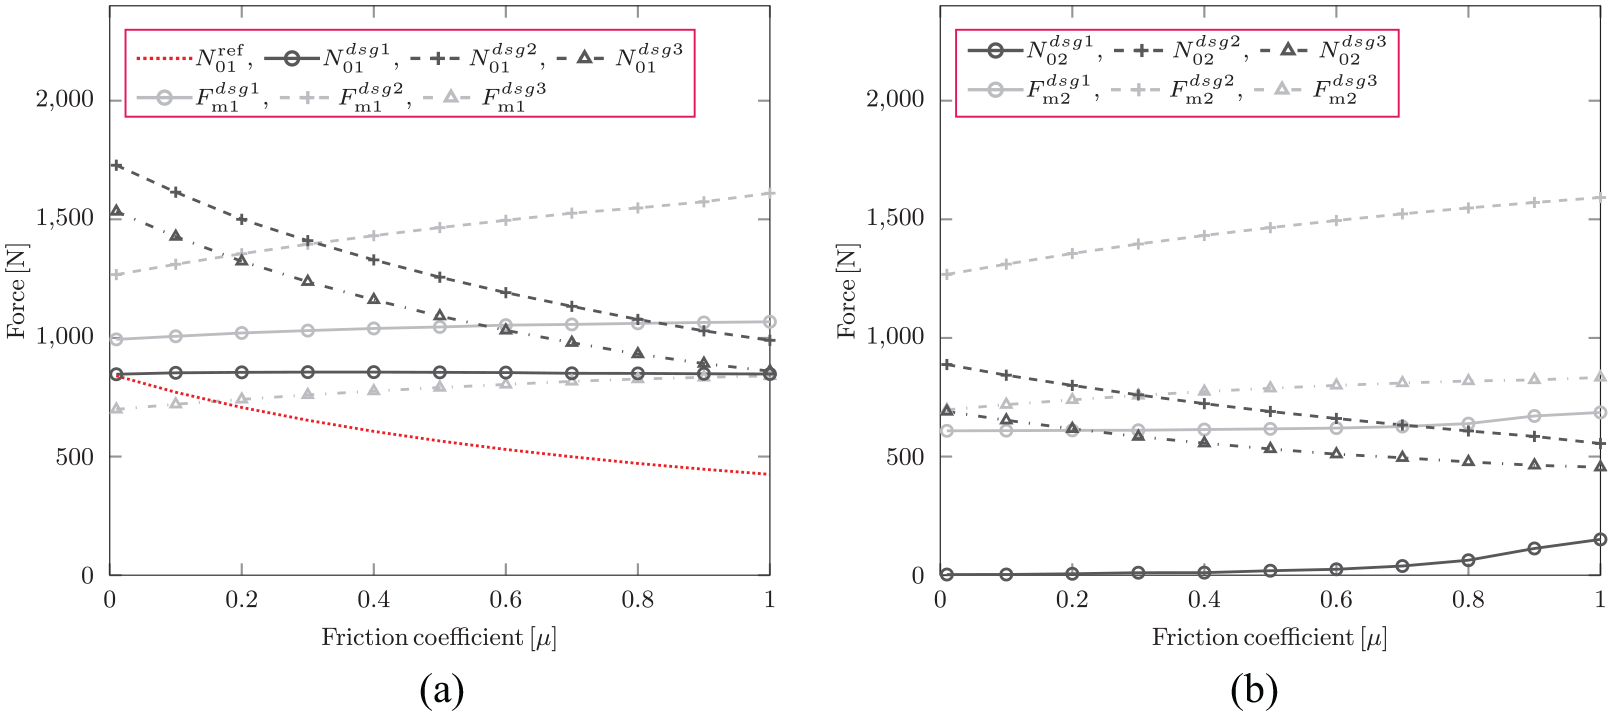
Variation in the normal load (N0) and the output force (Fm) as a function of the friction coefficient (
Moreover, the normal contact load is significantly influenced by the friction coefficient and decreases as the friction coefficient grows. For example, the normal contact load (
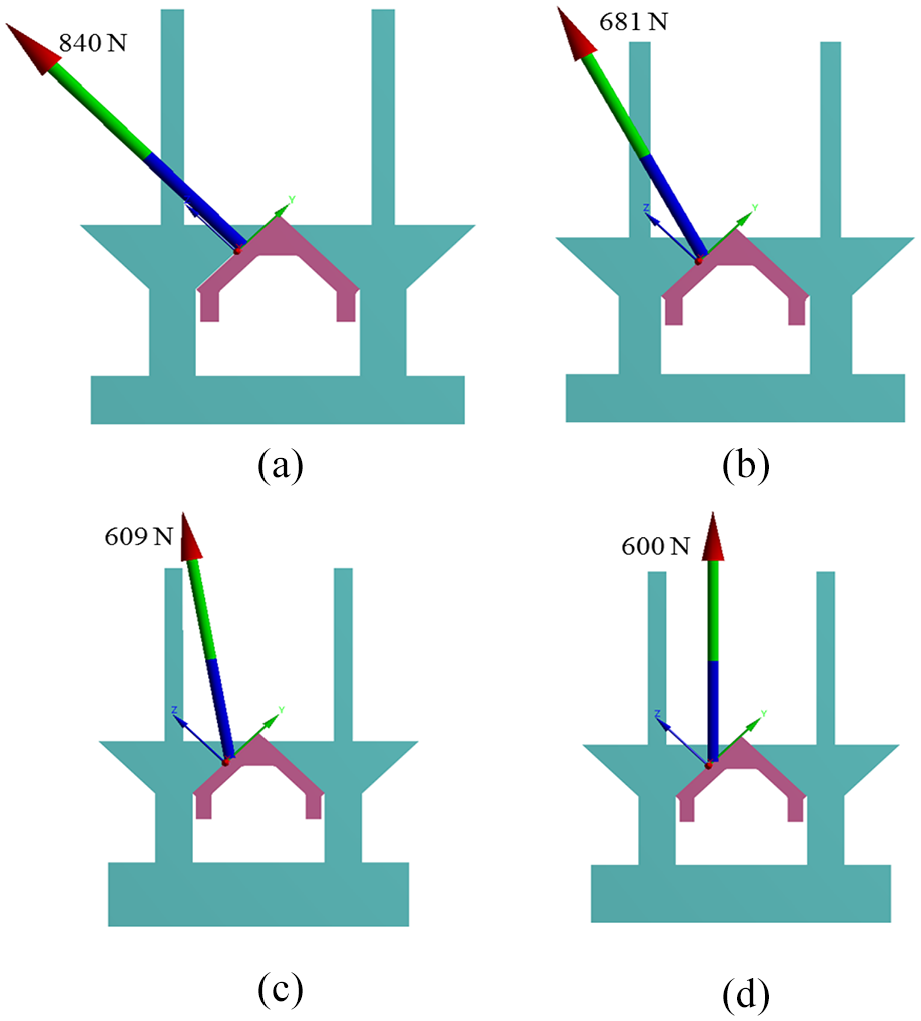
The change in the direction of the total contact force due to the centrifugal force (Fc = 1200 N) with the variation in friction coefficient. (a) µ = 0.01, (b) µ = 0.3, (c) µ = 0.7, and (d) µ = 1.
The normal contact load (
5.3. Influence of input current and friction coefficient on the pressure distribution
In this example, the pressure distribution and the contact status of UPD are analyzed for varying input current and friction coefficient. All the parameters are the same as in the first example and only BC1 is investigated in this case. The resulting pressure distribution and the contact status of UPD due to Fc and dsg1 are depicted in Figures 12 and 13, respectively. These results are computed at increasing input currents and at a constant friction coefficient, µ = 0.3. A noticeable shift in the pressure distribution is observed when the actuator is turned on and the highest pressure location moves toward the edge of the contact interface from the mid of UPD, which is due to the topology of this design (see Figure 6(b)). Furthermore, an increase in the current amplitude leads to a smaller effective contact area and a higher maximum contact pressure as shown in Figure 12(c) and (d) that is likely to alter the tangential contact stiffness as presented in Asai and Gola (2015), Filippi et al. (2004) and Siewert et al. (2006) and discussed before. Therefore, the proposed solution will not only change the normal contact load at the blade platform but may also influence the contact interface parameters and thus the nonlinear response curve. Nevertheless, these variations can be countered by adjusting the input current amplitude in the actuator and thus vibratory stresses in the bladed disk can be minimized. A change in the contact status of the UPD is depicted in Figure 13, which is similar to Figure 12.
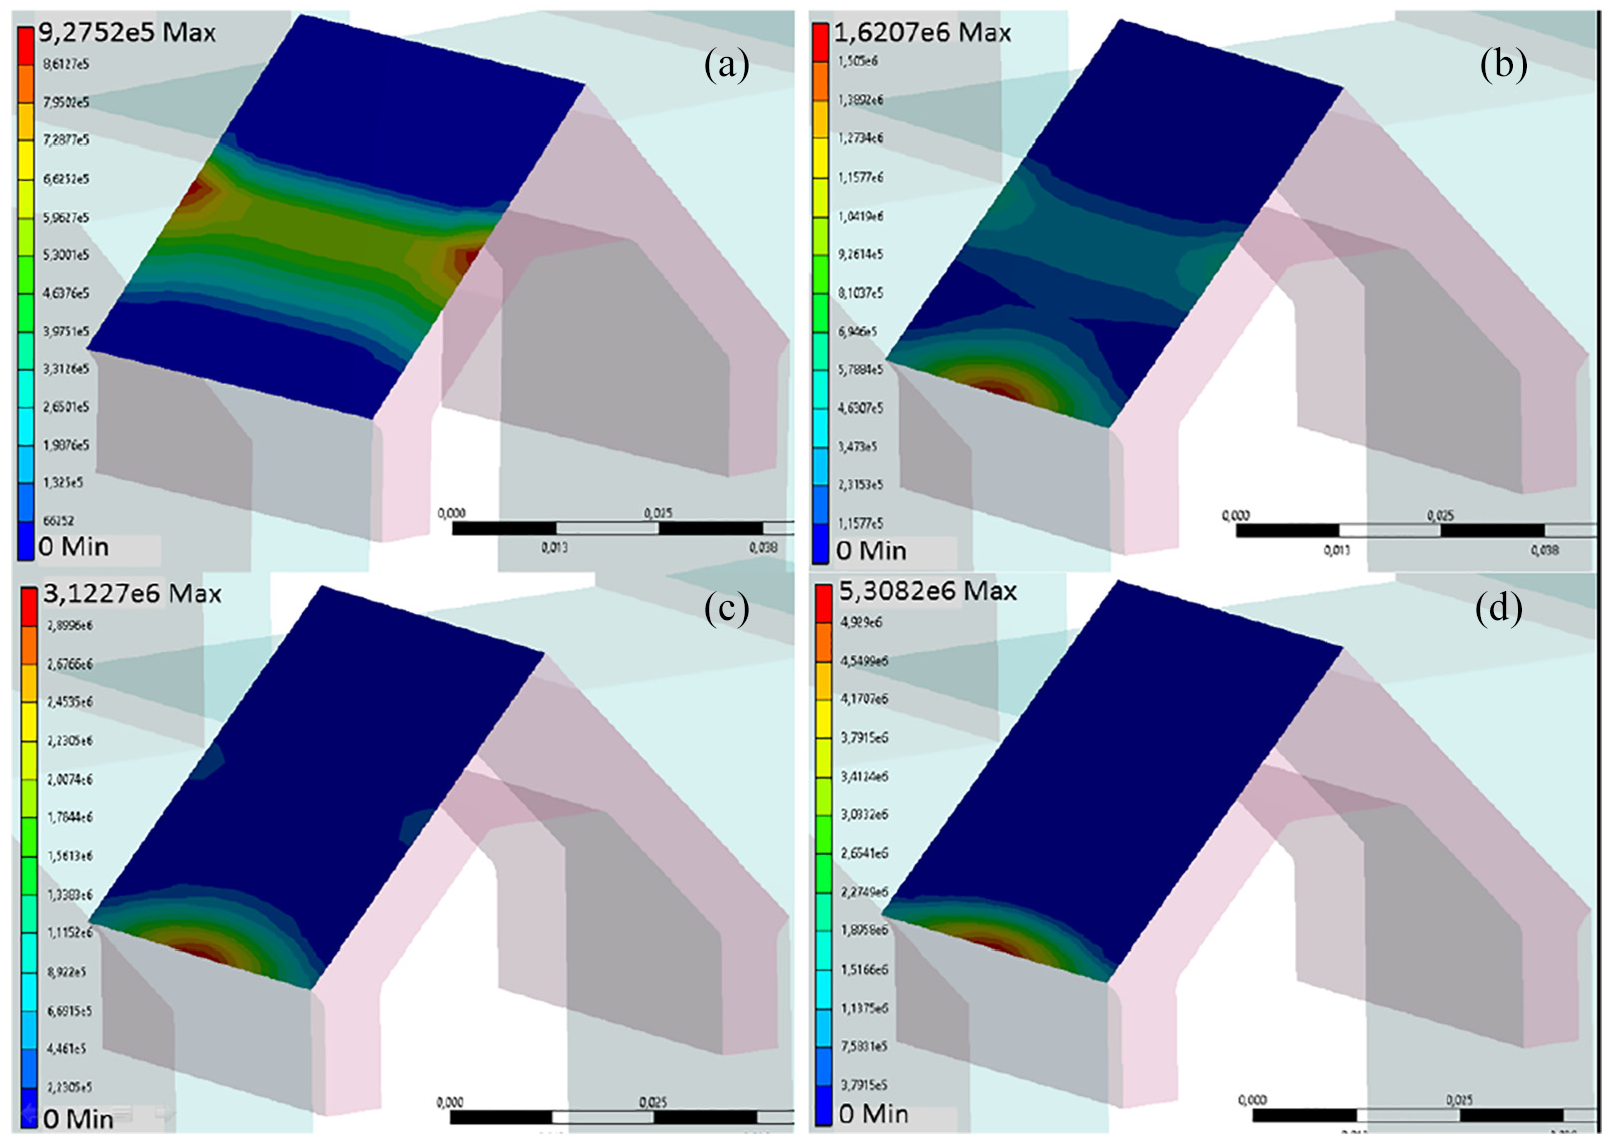
Variation in the pressure distribution on the UPD with input current caused by Fc and dsg1: (a) I = 0 A, (b) I = 1 A, (c) I = 2 A, and (d) I = 3 A at µ = 0.3 with BC1, where the pressure is in Pascal.
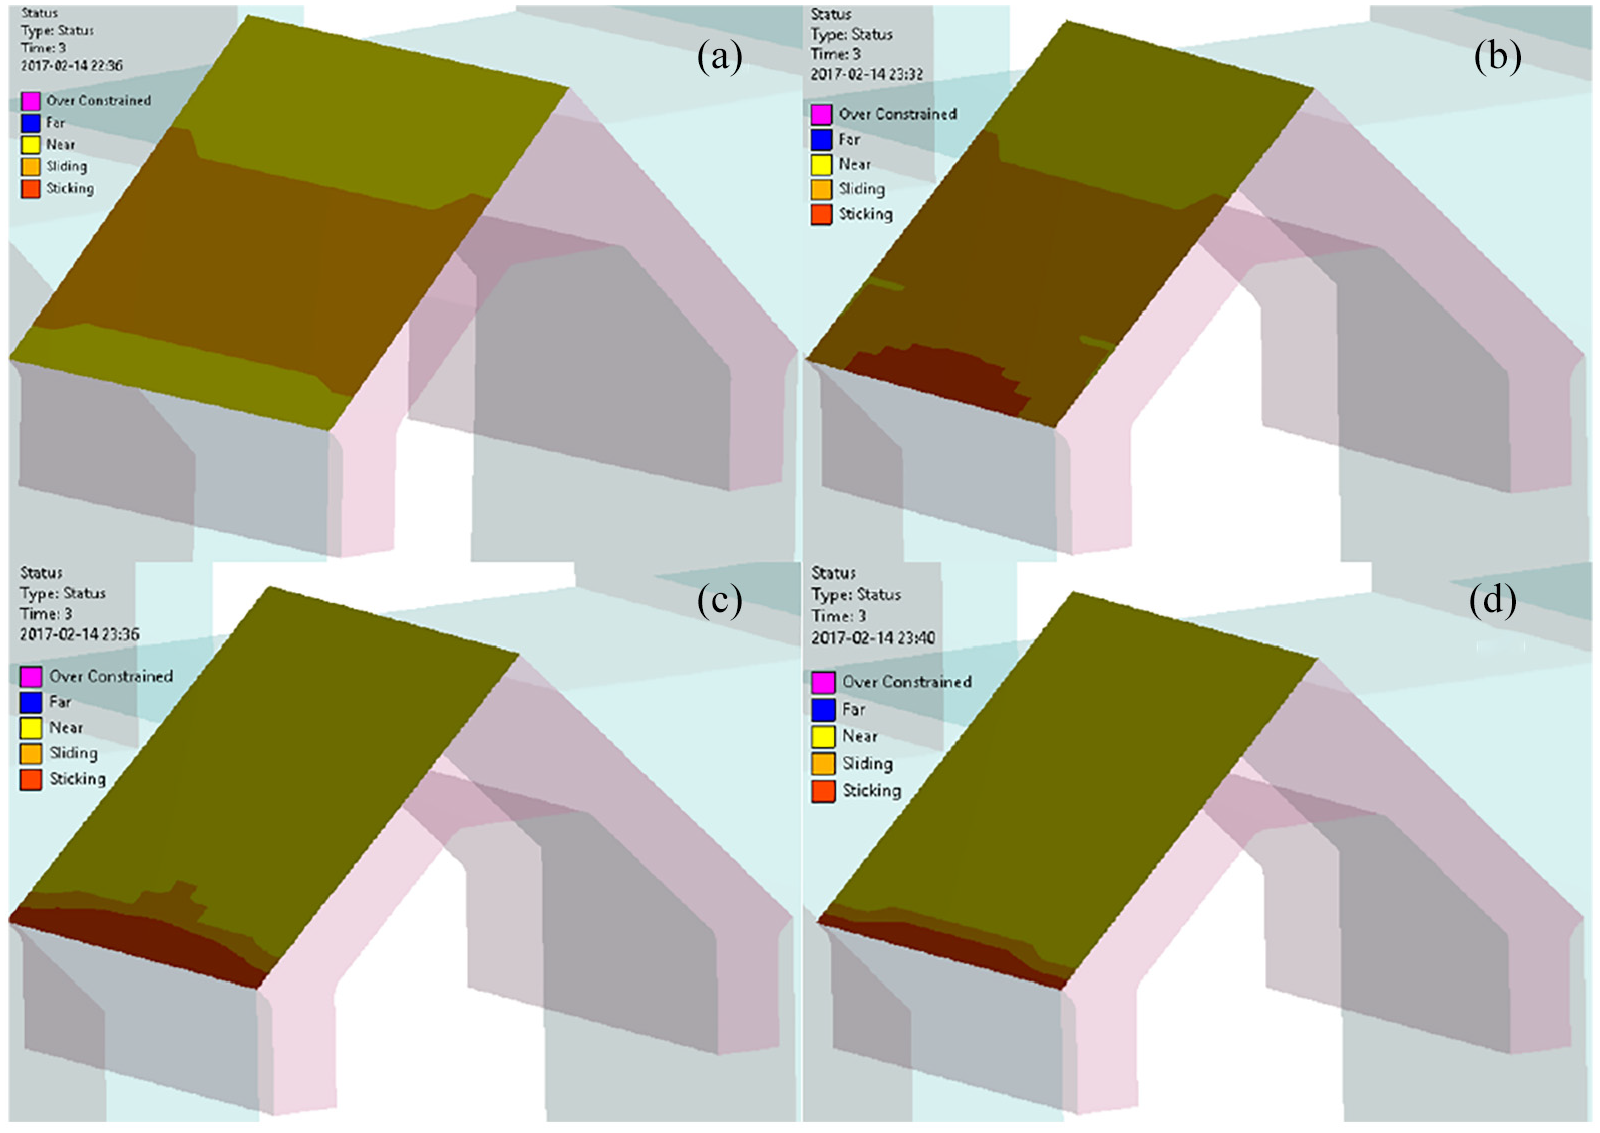
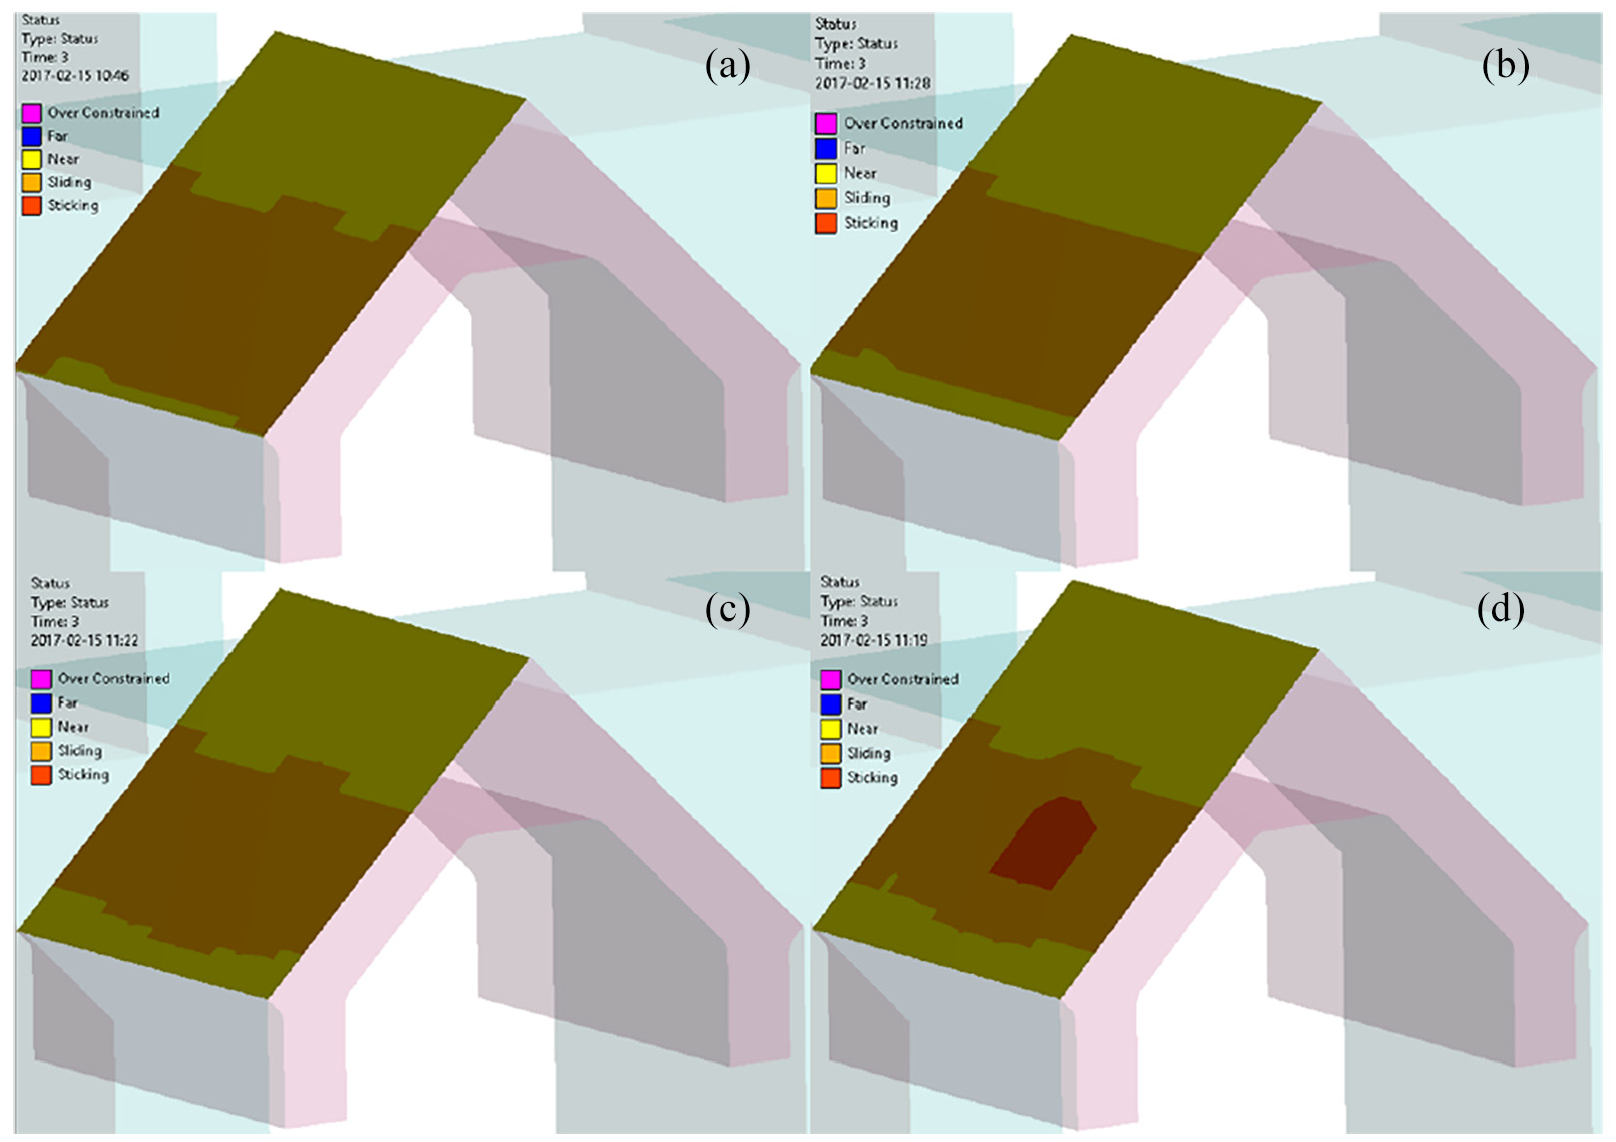
Variation in the contact status of the UPD with input current caused by Fc and dsg1: (a) I = 0 A, (b) I = 1 A, (c) I = 2 A, and (d) I = 3 A at µ = 0.3 with BC1.
The obtained pressure distribution and the contact status of the UPD due to Fc and dsg3 are depicted in Figures 14 and 15, respectively. These results are computed at increasing value of the friction coefficient and at a constant input current, I = 3 A. The shift in the pressure distribution is not as drastic as in the previous case, and maximum pressure on the UPD decreases as friction coefficient increases. This is in line with the previous result (Figure 11) where the normal load decreases as friction coefficient increases due to the emergence of the tangential contact force. Furthermore, the contact area is almost constant with the increase in the friction coefficient, which is due to a constant input current, and the output force direction is toward the normal of the contact interface. Nevertheless, a part of UPD interface goes into sticking state at µ = 1, which is as expected.
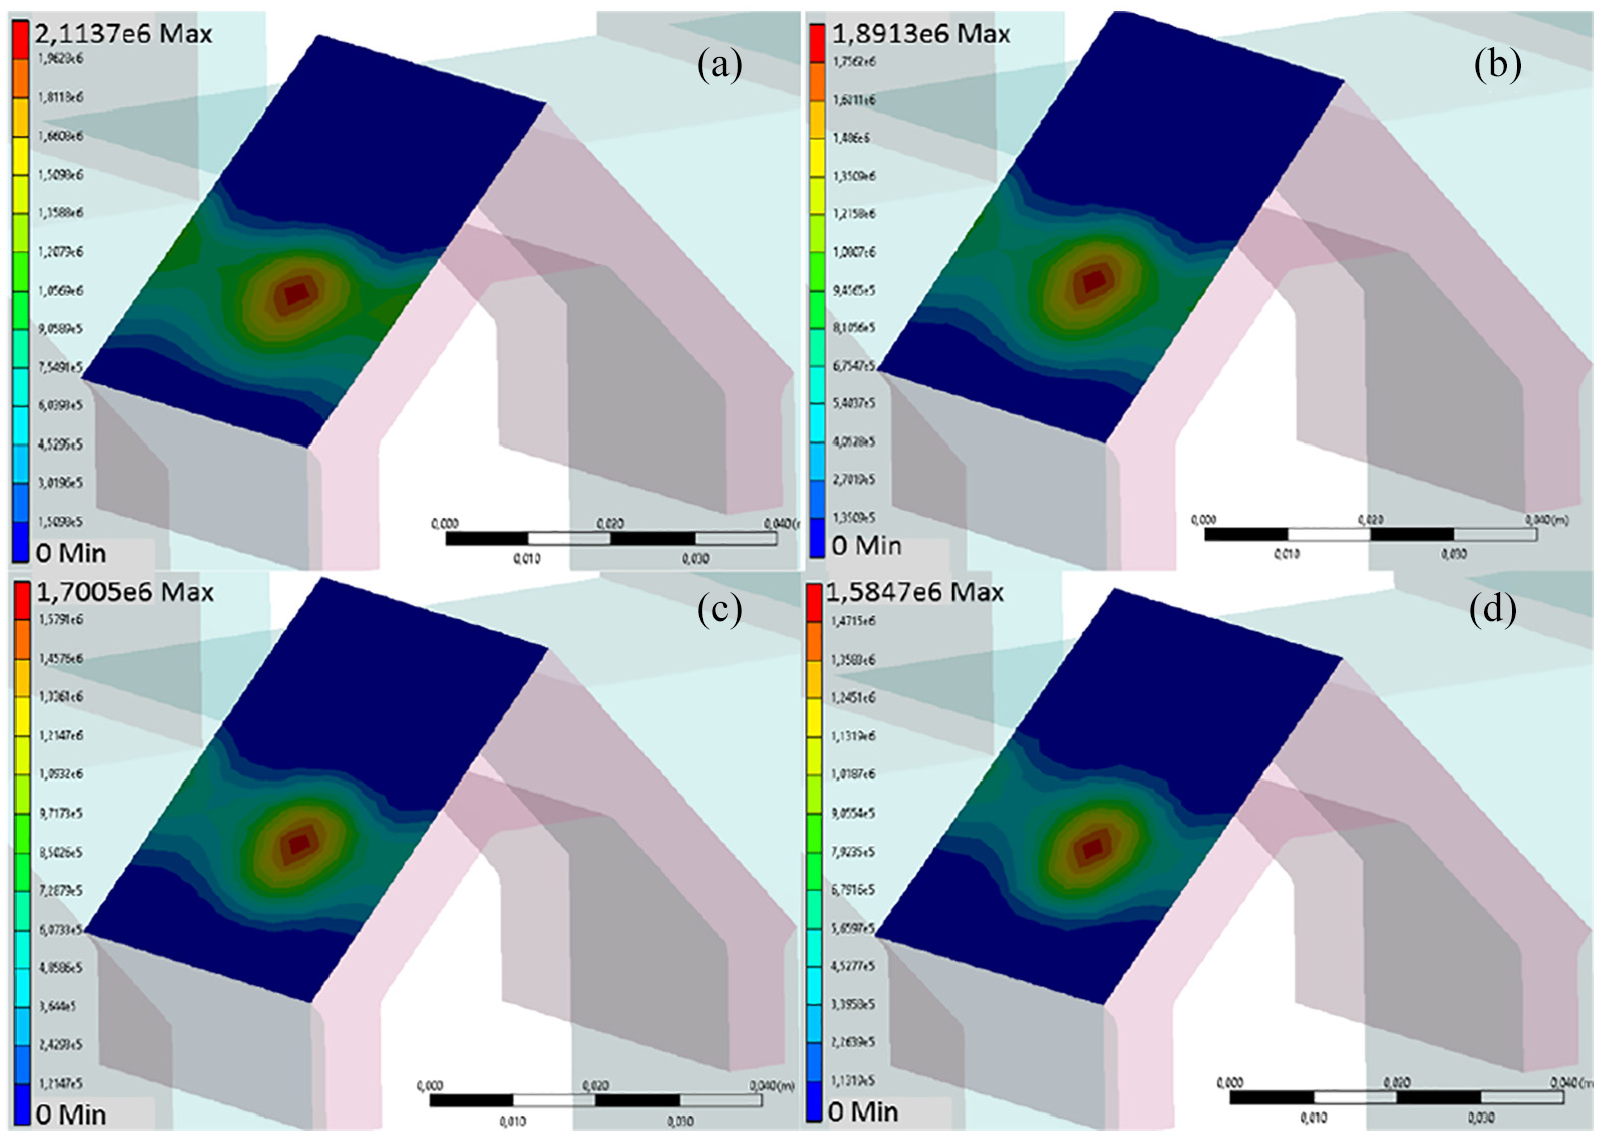
Variation in the pressure distribution on the UPD with input current caused by Fc and dsg3: (a) I = 0 A, (b) I = 1 A, (c) I = 2 A, and (d) I = 3 A at µ = 0.3 with BC1, where the pressure is in Pascal.
Variation in the contact status of the UPD with input current caused by Fc and dsg3: (a) I = 0 A, (b) I = 1 A, (c) I = 2 A, and (d) I = 3 A at µ = 0.3 with BC1.
6. Conclusion
A novel application of the magnetostrictive actuator in controlling the normal contact load at the friction interface of a bladed disk is proposed. This is achieved by constraining the output rod of the actuator between the walls of the UPD. The computed results reveal that a change in normal load as high as 750 N can be obtained by properly designing the actuator mounting. It means that the change in the normal load can be from 0 to 750 N by varying the input current from 0 to 3 A in the actuator circuit, and thus, an optimum damping in the system can be achieved despite a variation in the contact interface parameters during vibration. Moreover, two boundary conditions (BC1 and BC2) between the actuator ends and the UPD walls are proposed, where the BC1 is potentially applicable where a high normal load is required to achieve the optimum damping in the system and the BC2 is recommended for a low normal load case. Furthermore, it is demonstrated that the friction coefficient has a significant influence on the normal contact load and thus on the nonlinear vibration prediction of the bladed disk with friction contact. Finally, it is possible to damp several resonances at different operating conditions by altering the normal load at the friction interface.
Footnotes
Appendix 1
A typical variation in the nonlinear forced response curve with normal load is shown in Figure 16. The curves reveal that an increase in the normal load initially leads to a decrease in the response amplitude and then the response amplitude increases. Consequently, the maximum response amplitude of the curve passes through a minimum that is known as optimum damping in the system.
Declaration of conflicting interests
The author(s) declared no potential conflicts of interest with respect to the research, authorship, and/or publication of this article.
Funding
The author(s) disclosed receipt of the following financial support for the research, authorship, and/or publication of this article. This research is funded by the Swedish Energy Agency, Siemens Industrial Turbomachinery AB, GKN Aerospace, and the Royal Institute of Technology through the Swedish research program TurboPower. The support of which is gratefully acknowledged.