
Abstract
California has fundamentally reformed its criminal justice system. Since 2011, the state passed several reforms which reduced its massive prison population. Importantly, this decarceration has not harmed public safety as research finds these measures had no impact on violent crime and only marginal impacts on property crime statewide. The COVID-19 pandemic furthered the state’s trend in decarceration, as California reduced prison and jail populations to slow the spread of the virus. In fact, in terms of month-to-month proportionate changes in the state correctional population, California’s efforts to reduce overcrowding as a means to limit the spread of COVID-19 reduced the correctional population more severely and abruptly than any of the state’s decarceration reforms. Although research suggests the criminal justice reforms did not threaten public safety, there is reason to suspect COVID-mitigation releases did. How are COVID-19 jail downsizing measures and crime trends related in California, if at all? We address this question in the current study. We employ a synthetic control group design to estimate the impact of jail decarceration intended to mitigate COVID-19 spread on crime in California’s 58 counties. Adapting the traditional method to account for the “fuzzy-ness” of the intervention, we utilize natural variation among counties to isolate decarceration’s impact on crime from various other shocks affecting California as a whole. Findings do not suggest a consistent relationship between COVID-19 jail decarceration and violent or property crime at the county level.
Keywords
Perhaps more than any other state, California has been immersed in a period of fundamental reform to its criminal justice system. Since 2011, the state passed a series of reforms, most of which were intended to reduce its massive prison population. They worked, and California has reversed course when it comes to incarceration. In 2009, 2 years prior to the first reform, California’s incarceration rate was 329 per 100,000 residents. In 2019, after the bulk of reforms passed, the rate dropped to 290 (https://trends.vera.org/state/CA). Importantly, these reforms, and decarceration more generally, did not harm public safety. Research finds the downsizing measures had no impact on violent crime and only marginal impacts on property crime statewide (Bartos & Kubrin, 2018; Groff et al., 2021; Lofstrom & Raphael, 2016; Sundt et al., 2016).
The COVID-19 pandemic furthered California’s trend in decarceration, as the state reduced prison and jail populations to slow the spread of the virus. In fact, in terms of month-to-month proportionate changes in the state correctional population, California’s efforts to reduce overcrowding as a means to limit the spread of COVID-19 reduced the correctional population more severely and abruptly than any of the state’s decarceration reforms. Release actions resulted in a population reduction of around 40,000 (or 21% of the in-custody population), and they occurred within a single year (compared with the reductions resulting from nearly a decade of reforms).
Although research finds California’s criminal justice reforms did not threaten public safety, there is reason to suspect the state’s COVID-mitigation releases may have. Concerns regarding what impact these actions would have on crime rates were voiced immediately after the releases were announced, with critics pointing to crime increases across the state as cause for concern. Although data from four California cities (Los Angeles, Oakland, San Diego, San Francisco) show that violent and property crime declined overall during the pandemic, homicide and motor vehicle theft increased notably (Lofstrom & Martin, 2021).
At the same time, crime data published by the FBI in 2021 reveals that increases in homicide and motor vehicle theft were experienced nationwide. These national trends imply that California’s crime increases were driven, at least in part, by shared macro-level factors rather than state-specific COVID responses. They also suggest it is premature to interpret recent crime changes in California as a causal or permanent effect of COVID decarceration efforts until more systematic analysis is performed. How are COVID-19 jail downsizing measures and crime trends related, if at all? We address this question in the current study.
We employ a synthetic control group design to estimate the impact of jail decarceration intended to mitigate COVID-19 spread on crime in California’s 58 counties. Adapting the traditional method to account for the “fuzzy-ness” (Ragin, 2000, 2009) of the intervention, we utilize natural variation among California’s counties to isolate decarceration’s impact on crime from various other shocks affecting California as a whole. For the analyses, we use monthly jail average daily population (ADP) counts spanning January 2013—December 2021 for California counties, collected via the Jail Profile Survey administered by the Board of State and Community Corrections along with county-level monthly crime data covering the same time span gathered from the California Department of Justice’s “Crimes and Clearances” open data portal. Findings do not suggest a consistent relationship between COVID-19 jail decarceration and violent or property crime at the county level.
The California Case: Background Context
California has come a long way given its previous status as a U.S. leader in incarceration, a status achieved through passage of “tough on crime” policies such as truth in sentencing, mandatory minimums, and Three Strikes and You’re Out, along with the construction of 23 new correctional facilities from 1980 to 2010. These policies committed the state to housing more and more individuals for longer periods of time and threatened to overwhelm facilities with a greater population than they had the capacity to house, even after accounting for new construction. Indeed, after years of steady growth, in 2007, California’s prison population was nearly 200% of the system’s rated capacity (Schlanger, 2016). In 2011, California reached a breaking point. Spurred on by budget pressures and a court order, the state implemented reforms designed to reduce its correctional population (Kubrin & Seron, 2016). Within a matter of years, the court-ordered reductions were met. Notably, prison downsizing did not harm public safety (Bartos & Kubrin, 2018; Groff et al., 2021; Lofstrom & Raphael, 2016; Sundt et al., 2016) as critics charged, raising questions about the nature of the relationship between incarceration and crime. 1
Only a few years later, the COVID-19 pandemic hit, inducing “a variety of major changes to the operation of criminal justice systems” (Jossie et al., 2022, p. 1244). COVID-19 spread easily among those incarcerated, as well as among those employed at correctional institutions (Wallace et al., 2021), compelling a range of responses (Jossie et al., 2022, pp. 1249–1251). 2 Jails and prisons, including in California, released individuals where possible, an approach many interpreted as generalized amnesty (Jossie et al., 2022, p. 1249). Although California’s decarceration reforms occurred over variable time frames and impacted prison and jail populations to varying degrees, in terms of month-to-month proportionate changes in the correctional population, the state’s efforts to reduce overcrowding as a means to limit the spread of COVID-19 reduced the population more severely and abruptly than any decarceration reform.
Starting in March 2020, the California Department of Corrections and Rehabilitation (CDCR) announced the decision to release 3,500 non-violent, non-sex offenders that had 60 days or less remaining on their sentence. Although this constituted only a 2.8% reduction in the state’s 123,030 population from 2 weeks prior, it was the first of many actions taken and it was accompanied by similar actions at the county level. By April 2020, for example, Los Angeles County had released 4,276 non-violent inmates, or about 25% of its jail population. In July 2020, the state announced another round of releases, expanding early releases to those with <6 months remaining rather than 60 days, to allow for greater distancing within its facilities amid a spike of cases in San Quentin State Prison. In August 2020, prison officials announced they planned to release as many as 17,600 people early to limit the spread of the virus.
Although many doubted whether these actions were necessary, by Fall 2020 it became clear that even further releases would be necessary to slow or reverse outbreaks in facilities. California prisons reached an in-custody population low point of 94,607 in February 2021, down 23.6% from a year prior and accompanied by only a 4% increase in the population under community supervision during the same time (CDCR Monthly Population Reports 2021). Jail populations also decreased substantially during this time, suggesting release actions amounted to true (i.e., direct path to community re-entry) decarceration rather than simply shifting custody operations to alternative jurisdictions. And, California’s county jail population hit its low point much earlier than the prison population. According to Jail Population Survey data, California housed 72,387 individuals in its county jails in February 2020 but by May 2020, the population reached as low as 50,680 (a 30% reduction). 3
In short, California’s downsizing reforms resulted in a drop in the state’s jail and prison population from a peak of about 257,000 in 2007 to 192,000 in January 2020, a reduction of 25%. Further reductions related to the pandemic brought the incarcerated population down to 158,000 by December 2021. Although research finds that the criminal justice reforms did not threaten public safety, there is reason to suspect the COVID-mitigation releases, in fact, might have.
Most obviously, California’s decarceration reforms were carefully constructed, fervently debated, and implemented at around a 10th of the pace of the COVID-mitigation release actions. Beyond distinct dosages and durations, however, the reforms prior to the pandemic selectively focused on individuals convicted of the least risky, non-violent, non-serious, and non-sexual offenses. Once these individuals were removed from the population, the lowest risk inmates still remaining in-custody became higher risk. By iteratively removing individuals serving sentences for the least serious offenses, the remaining correctional population had, by default, become more serious and riskier in aggregate.
It should come as no surprise, then, that concerns regarding what impact these actions might have on crime rates were voiced immediately after the releases were announced (Thomas, 2023). Yet, a close examination of crime trends paints a complex picture, with long-term decreases in most crimes but steep increases in some (Lofstrom, 2022). Most notably, there was a troubling increase in some violent crimes, particularly homicide, in California. The year 2020 saw an increase in more than 500 homicides, the largest jump in state history since record-keeping began in 1960. California also experienced a 39% rise in aggravated assaults involving a firearm (Lofstrom, 2022).
Although these statistics are cause for concern, trends in California reflect broader trends for the nation as a whole, raising doubt that the COVID-19 mitigation releases are to blame for rising crime. Researchers examining crime rates in 34 U.S. cities found that homicide rates were 30% higher in 2020 compared with the year prior—an historic increase—even as they remained well below peak rates in the early 1990s (Rosenfeld et al., 2021). Homicide rates further increased by 5% in 2021, compared with 2020, according to a follow-up study that examined 27 U.S. cities (Rosenfeld & Lopez, 2022).
Beyond these statistics, what can research on prison downsizing and crime rates during the pandemic tell us? We were able to locate only one study that considers this—a report on jail populations, violent crime, and COVID-19 from the Safety and Justice Challenge (Khan et al., 2023). The researchers determined whether increases in violent crime were related to the pandemic and criminal justice reforms from 2016 to 2021 across 23 U.S. cities and counties, including two California cities (Los Angeles and San Francisco). Examining the outcomes of five cohorts of individuals released on pretrial status between 2015 and 2020, these individuals were tracked for 6 months (up to April 2021) to see if they returned to jail and if so, whether the rebooking was for a felony or misdemeanor, and violent or non-violent charge. They find: (a) There is no correlation between declines in jail incarceration and increases in violent crime through COVID-19 (p. 6); (b) Most individuals (over 70%) released on pretrial status were not rebooked into jail, which was consistent over the study time frame (p. 8); and (c) Of the small percentage of individuals rebooked into jail, it was very rare (<4%) to return with a violent crime charge and exceedingly rare (<0.1%) to return with a homicide charge (p. 9). Findings for the two California cities included in the study mirror these trends. The study concludes, It is likely that many complex social and economic factors related to the pandemic contributed to the overall increases in violence, and particularly in homicides, that occurred across cities in 2020. However, these findings suggest that evidence-driven criminal legal reforms were not among those factors. (p. 10)
In light of this discussion, it is premature to interpret crime increases in California as a causal or permanent effect of the state’s COVID decarceration efforts until more systematic analysis is performed—something we take up in the current study. More broadly, we respond to recent calls asking researchers “. . . to examine changes in patterns of crime, particularly pertaining to homicide and gun violence, to examine whether there is a relationship between COVID mitigation decisions and related increases” (Jossie et al., 2022, p. 1254). As “The pandemic created rare natural experiment research conditions that enable unique and potentially valuable insights on necessitated innovations that may indicate future justice practices and policies” (Jossie et al., 2022, p. 1243), we agree that “Researchers can meaningfully investigate the ongoing applicability of justice system adaptations mandated by the pandemic in terms of effectiveness and efficiency toward the interrelated goals of evidence-based practice discovery and justice reform” (p. 1243). California represents an ideal laboratory in which to study relationships among the COVID-19 pandemic, prison downsizing and crime trends.
Data and Methods
We employ a synthetic control group design to estimate the impact of jail decarceration intended to mitigate COVID-19 spread on crime in California counties. We adapt the traditional synthetic control method to account for the “fuzzy-ness” (Ragin, 2000, 2009) of the jail decarceration intervention and utilize natural variation among California’s counties to isolate the impact of jail decarceration on crime from various other shocks affecting the state as a whole. We use monthly jail ADP counts spanning January 2013 through December 2021 for California’s 58 counties, collected via the Jail Profile Survey administered by the Board of State and Community Corrections. We also use county-level monthly crime frequency data (eight UCR categories) covering the same time span gathered from the California Department of Justice’s “Crimes and Clearances” open data portal.
Table 1 lists mean jail ADP by county for the 12 months prior and subsequent to March 2020. Aside from five counties that do not operate jail facilities and thus are not exposed to the decarceration treatment, California’s remaining 53 counties reduced their jail populations by some amount in the 12 months following the COVID-19 crisis compared with the 12 months prior. At the same time, there is significant variation across counties regarding the degree of decarceration, ranging from <1% reduction (Lassen) to a 43% reduction (Imperial).
Average Daily Jail Populations 12-Month Pre- and Post-Intervention (March 2020).
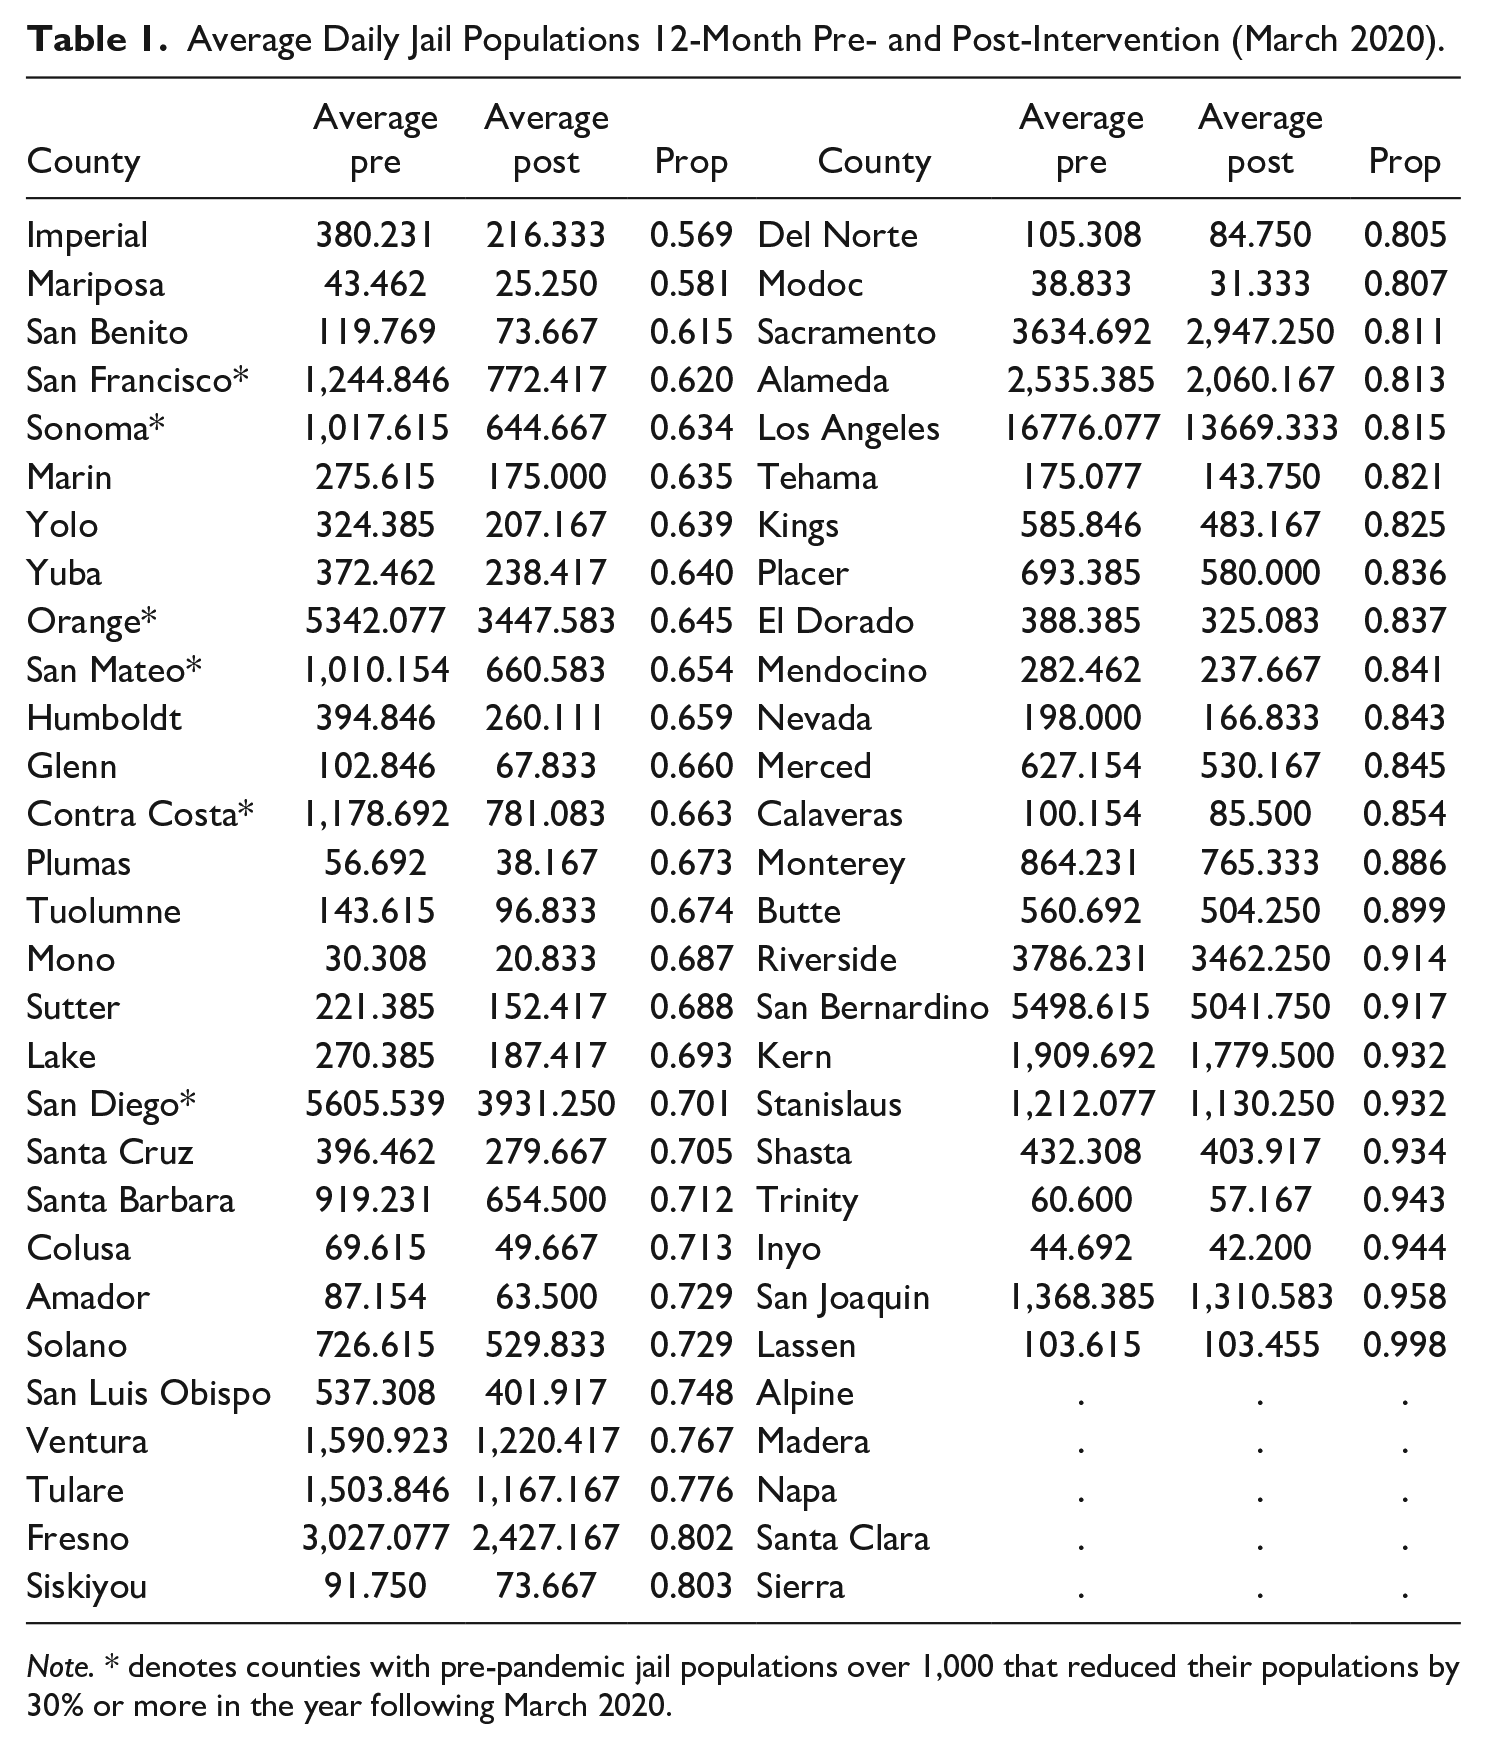
Note. * denotes counties with pre-pandemic jail populations over 1,000 that reduced their populations by 30% or more in the year following March 2020.
We consider the proportionate change in county jail populations from the year prior to the year following the March 2020 COVID-19 lockdowns as the dosage distribution of the jail decarceration treatment. Although extreme ends of the distribution include small counties managing jail populations of less than a few hundred, there are larger counties on each end that were more cautious about releasing any meaningful proportion of their jail population. Although a 50% reduction is a greater proportionate reduction than was observed in any California county, if that county had a pre-pandemic jail population of only 50 people, for example, it would be foolish to expect those 25 released individuals to impact the county’s crime rate. As such, identifying the highest dosage treatment counties must also involve accounting for the size of their jail populations. Among counties with pre-pandemic jail populations over 1,000, there are six that reduced their populations by ~30% or more (see “*” in Table 1). We consider these six counties as the high dosage jail decarceration treatment group.
If release actions by jails were to cause crime increases, their impact is most likely to be distinguishable from noise in counties where a given proportionate reduction in the jail population constitutes a larger number of releases. To be clear, the counties that reduced their jail ADPs by the greatest proportion post-intervention experienced the highest dosages of the jail decarceration treatment. In the interest of identifying a pattern of effects on crime across high-dosage counties, however, we further restrict our analysis to counties with pre-pandemic jail ADPs greater than 1,000. With these conditions in mind, we identify San Francisco, Sonoma, Orange, San Mateo, Contra Costa, and San Diego as high-dosage counties.
If the state’s decarceration efforts were the only exogenous shock impacting county crime rates during the study period, estimation of the constant elasticity between per capita jail incarceration and per capita crime across counties would be relatively straightforward. However, the year 2020 is laden with multiple exogenous shocks, parallel treatments, and multi-level complications. For example, California imposed more stringent lockdown measures than other states, decarcerated its prisons gradually, and experienced the post-George Floyd protest movement along with political conflict leading up to and following the 2020 general election. Comparing California to another state, therefore, would be an immense task given challenges associated with parsing the impact of these confounding interventions on crime from the impact of jail decarceration. Examining county-level variation within California resolves some of these confounds by virtue of them being experienced statewide.
As shown in Figure 1, California county jails reduced their in-custody population from ~68,000 in February 2020 to just under 48,000 in May 2020. If a county reduced its jail population in response to the pandemic, it appears that it happened at this point. Variation across counties stems not from the timing of decarceration but from the size of the decline and how temporary the reduction was. Thus, we consider March 2020 the time point at which the intervention occurs. The synthetic control method is especially useful for its ability to partial out universally experienced events from its estimate of a local intervention’s impact (Kubrin et al., 2022, p. 126). This is because the synthetic control is fit on the pre-intervention series which reflects these impacts. But, as the post-intervention period is extended, the risk of confounding (i.e., unknown/unspecified) interventions that impact the outcome and were not experienced by all treated and donor pool counties increases (Bartos et al., 2020, p. 134). We thus limit the results period to December 2020 to avoid conflating localized election unrest with our effect estimate as some counties, such as Sacramento, appear to have experienced election-related violence in early 2021. If Sacramento contributes a non-zero weight to a synthetic control, that election-related violence would drive up the synthetic control’s violent crime time series in those months.
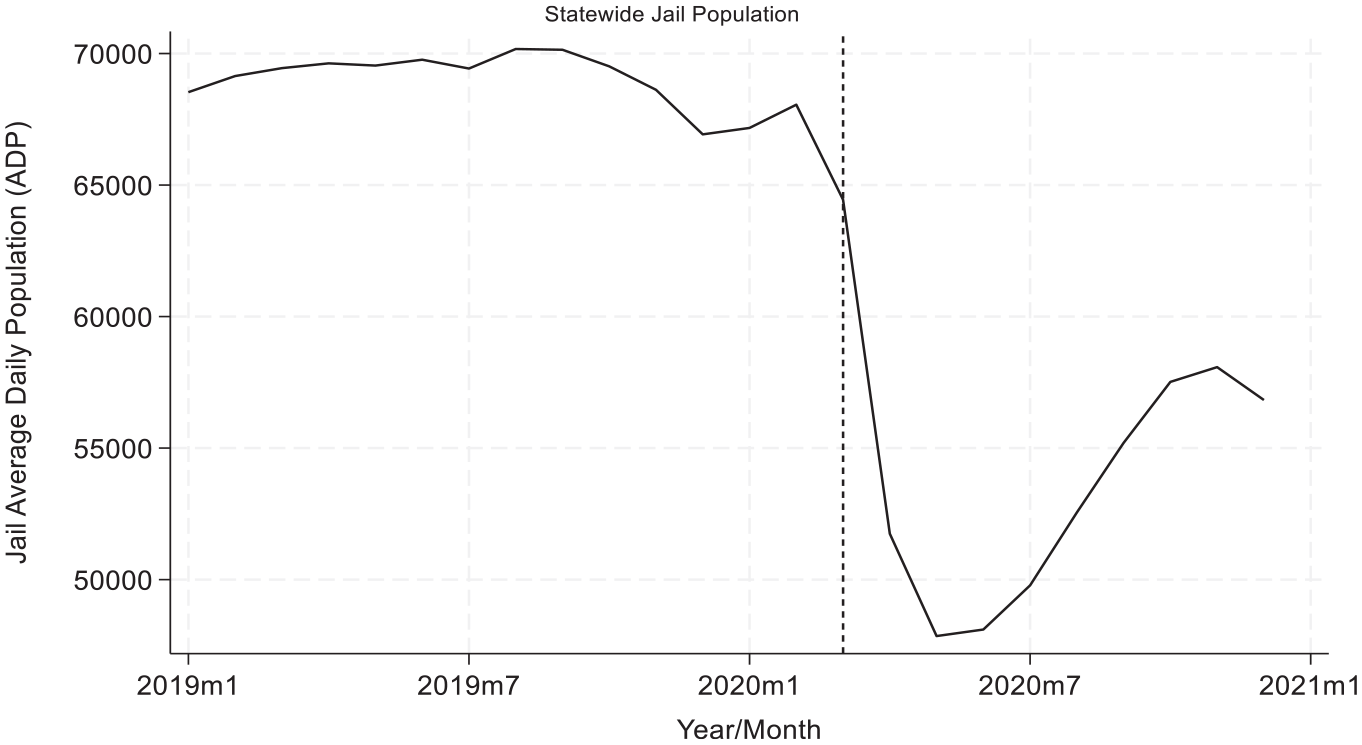
California’s Combined County Jail Population by Month.
With a set of treated units and an analysis time frame identified, the conventional synthetic control method (Abadie et al., 2010) proceeds with populating a donor pool of untreated potential comparison units that are eligible to contribute to the synthetic control units. The aim is to identify a weighted combination of untreated donor pool units that mimics the treated unit’s pre-intervention crime trends. If a linear combination of donor pool units tracks the treated unit’s outcome series up to the point of the intervention and is comprised of untreated units, if the two series diverge following the intervention, the gap that emerges can be attributed to the impact of the intervention. Put another way, the synthetic control series is intended to approximate the treated unit’s outcome series had the intervention never occurred (Abadie et al., 2010; McCleary et al., 2017, p. 284).
We diverge from the conventional approach at this stage and incorporate Ragin’s (2000, 2009) notion of fuzzy set analysis to account for the distribution of jail decarceration dosage. Given the state’s various programs, policies, and interventions in the year following the March 2020 COVID-19 lockdowns, populating the donor pool with other California counties conveniently positions the synthetic control method to parse the impacts of these statewide shocks from the impact of county-level variation in jail decarceration on crime. Thus, we allow for a degree of contamination and ensure sufficient contrast in treatment dosage by using the counties whose jail populations reduced their pre-pandemic mean in the year following March 2020 by 20% or less as the donor pool for the high-dosage counties. By constructing synthetic controls from the counties least contaminated by the decarceration treatment, any gap that emerges post-intervention between the treated counties’ actual crime rates and their synthetic counterparts can be interpreted as the effect of high-dosage jail decarceration on crime versus what would have happened at low or no dosage. We discuss limitations imposed by the contaminated donor pool in the discussion section.
Crime counts were transformed into proportionate changes from counties’ mean frequency over the 12 months prior to the intervention (Feb 2019-Feb 2020). This transformation allows units of different sizes to contribute, fitting primarily on shape rather than level. We further applied a 5-month moving average smoothing function. Smoothing reduces month-to-month variance in both the treated and donor pool counties, and reduces the impact of single observation spikes and valleys (Bartos et al., 2020, p. 132; Kubrin et al., 2022, p. 126).
If jail decarceration during COVID-19 caused crime to increase, then across the six highest dosage units we would expect to consistently see the synthetic control series fall below the treated series. We would further expect the gap between treated and synthetic trends to be greatest when the treated and synthetic units reflect the largest difference in treatment dosage (i.e., % reduction year pre-post March 2020). In other words, if more jail decarceration causes crime increases, then the largest increases should be observed among the treated and synthetic units that reflect the largest difference in decarceration. Although it is an idiosyncratic nuance of this study’s particular adaptation of the synthetic control design, we cannot say from Table 1 alone which of the six treated counties is expected to produce the largest post-intervention gap. As the synthetic control is constructed from a contaminated donor pool, to some degree it also represents some dosage of the intervention, depending upon its composition (i.e., donor pool weights). We thus expect the county and synthetic control that differ the most in terms of percent jail population reduction to experience the largest post-intervention gap between the treated and synthetic series.
Our approach resolves many common obstacles that otherwise plague evaluations of pandemic-era policies and programs. Foremost among them is the rate at which exogenous shocks altered everyday life and routine activities as the threat posed by COVID-19 became apparent, as well as the inadequacy of various attempts to limit its spread. For quantitative researchers, it quickly became clear that annual crime measures reflect not only the impact of the pandemic but also various federal, state, and local attempts to navigate it. Beyond variation in pandemic era policy, shocks seemingly unrelated to the pandemic and collective attempts to stop COVID-19 spread were abundant.
To estimate the impact of a state’s lockdown measures, a nation’s travel policies, or any one of these events on crime in a given unit, traditional regression-based estimation requires the ability to model all of these confounds directly. However, the data required to partial out other impacts often does not exist at small enough units of analysis or time intervals to provide adequate coverage across conditions (McDowall et al., 2019, p. 165). The adapted synthetic control design approach we take here resolves issues of parallel trends that obstruct difference-in-differences analyses, while further partialling out universally experienced exogenous shocks (such as the lockdowns and stay-at-home orders themselves) that would otherwise be conflated with the effect of high-dose jail decarceration in cross-sectional estimates.
The primary limitation of our adaptation is that the treated and synthetic series do not reflect the fully treated and completely untreated versions of county crime rates generally produced via synthetic controls. Rather, they reflect a high dosage treated unit and a low-dosage comparison unit. In the analysis, we thus stop short of producing effect size estimates and focus instead on the overall pattern across treated units. If jail decarceration during COVID-19 caused crime to increase, then across the six highest dosage units we expect to consistently see the synthetic control series’ trend below the treated series post-intervention. If, however, we observe no or variable (in sign and magnitude) gaps, it would suggest the relationship between jail decarceration and crime is weak or inconsistent.
Results
Violent Crime
To estimate the impact of COVID-19 jail decarceration on crime at the county level, we construct synthetic control groups for the six highest-dosage counties as outlined above. For these counties, Figure 2 plots the proportionate change in violent crime series (solid black line) against their constructed synthetic control series (dashed black line), with a reference line at March 2020 indicating the jail decarceration intervention, which breaks the plots into pre- and post-intervention segments.
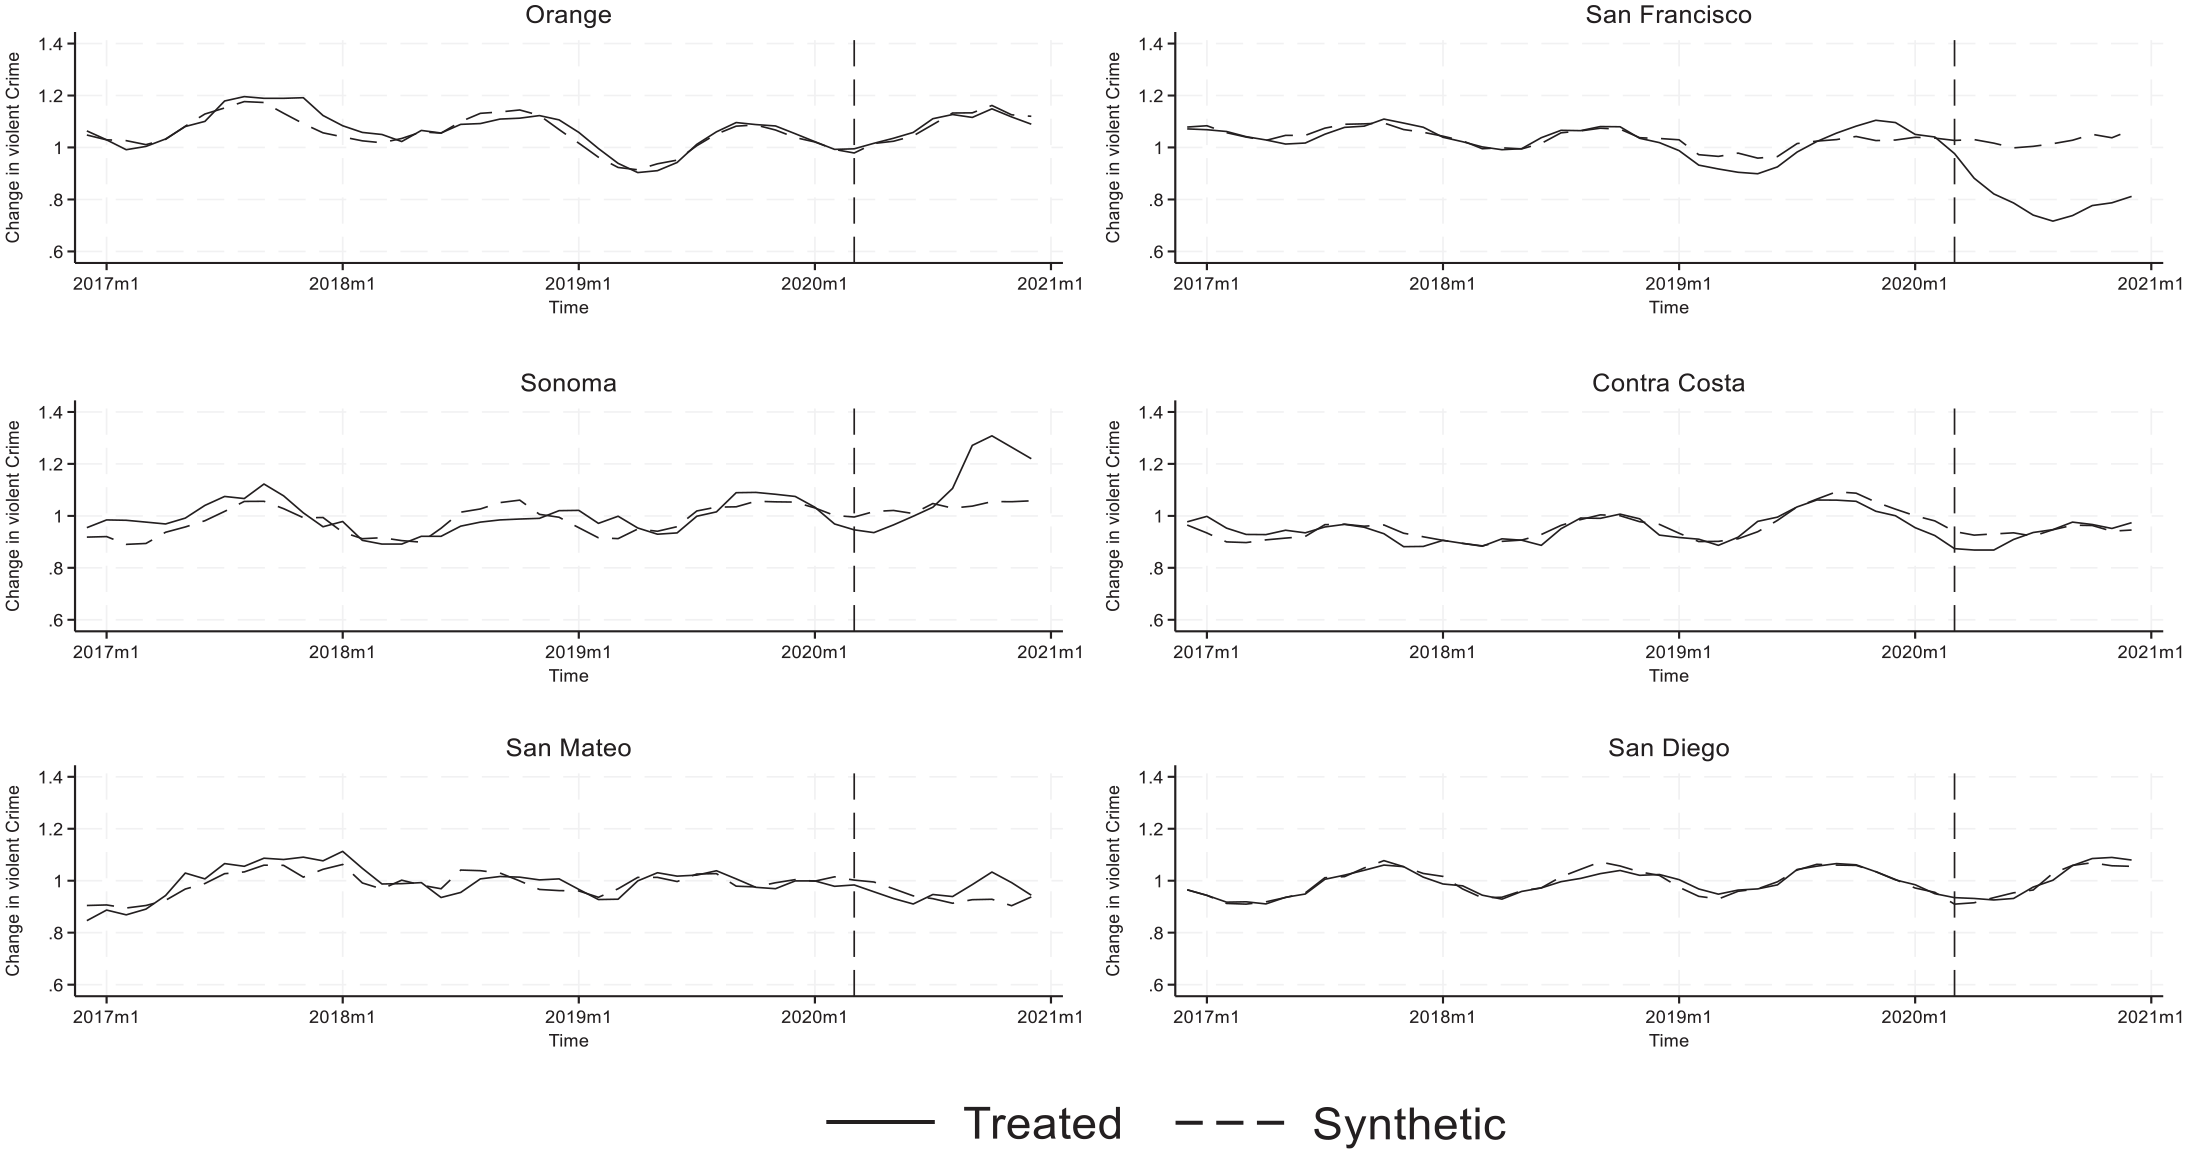
Synthetic Control Plots, Violent Crime.
As shown in Figure 2, the overall quality of the pre-intervention fit for the six high-dosage counties is relatively strong, even as it varies across them. More importantly, however, the post-intervention gaps across these counties do not reveal a consistent impact on violent crime. Orange, Contra Costa, and San Diego counties, for example, track quite well throughout the pre-intervention period, yet no gap emerges post-intervention, suggesting a null impact on violence. San Mateo county is also close to a null impact, although a temporary gap does appear to emerge in late 2020, which suggests jail decarceration temporarily increased violent crime. San Francisco and Sonoma counties, however, show opposing impacts. San Francisco’s violent crime rate falls well below its synthetic control series post-March 2020 suggesting that the county experienced less violent crime than it would have had they not decarcerated their jails in a high-dosage manner (a finding we return to in the Conclusion). Sonoma County, in contrast, tracks above its synthetic control series in the post-intervention period, indicating the intervention caused violent crime in the county to be more frequent than it would have been without jail decarceration.
Figure 3 plots the difference between high-dosage counties’ actual violent crime time series and their synthetic controls. Until the March 2020 intervention, the difference in series hovers around zero with relatively small deviations. Following the intervention, the difference plots begin to take quite different paths. San Francisco trends down (indicating a reduction in violence due to jail decarceration), Sonoma trends upward (indicating an increase due to jail decarceration) and the other four high-dosage counties remain close to zero, indicating a null effect.
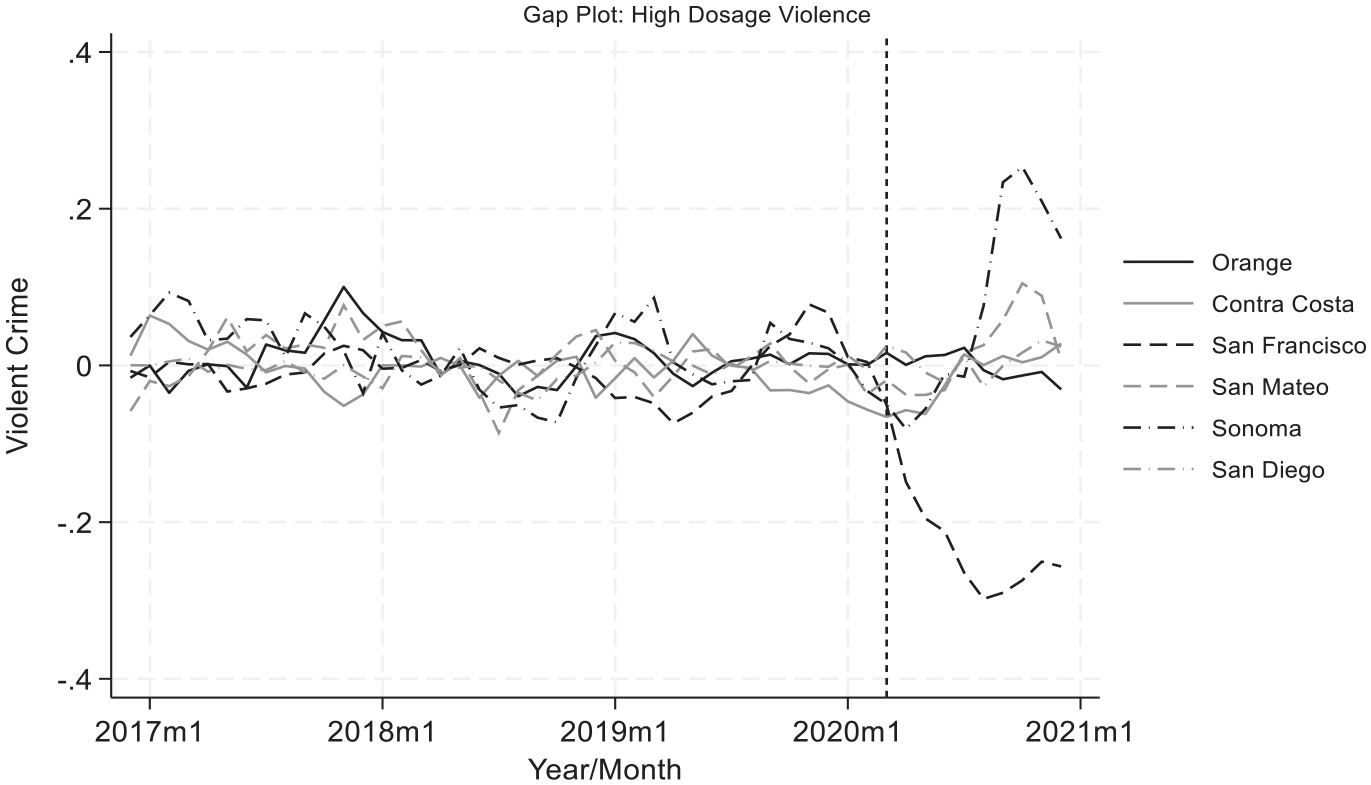
Gap Between Treated and Synthetic Controls, Violent Crime.
If jail decarceration during the pandemic caused violent crime to increase, we would have expected more uniformity across the series, consistent with Sonoma’s post-intervention path. With four models showing a null impact and one model indicating a reduction in violence due to high-dose jail decarceration, the relationship between decarceration and violent crime appears weak and inconsistent.
The donor pool weights (i.e., composition) of the violent crime synthetic controls are listed in Table 2. The quality of the pre-intervention fit is assessed via a root mean squared prediction error and is listed alongside the average post-intervention gap. The ratio of post-intervention gap to pre-intervention error is conventionally used as a heuristic for distinguishing effect size from matching error (McCleary et al., 2017, p. 287). By this metric, only San Francisco and Sonoma suggest non-null impacts of the high-dosage jail decarceration treatment on violent crime. As noted earlier, the San Francisco and Sonoma synthetic control analyses suggest impacts with opposing signs (+/−).
Violent Crime, Synthetic Control Model Composition, Fit, and Effect Estimates.
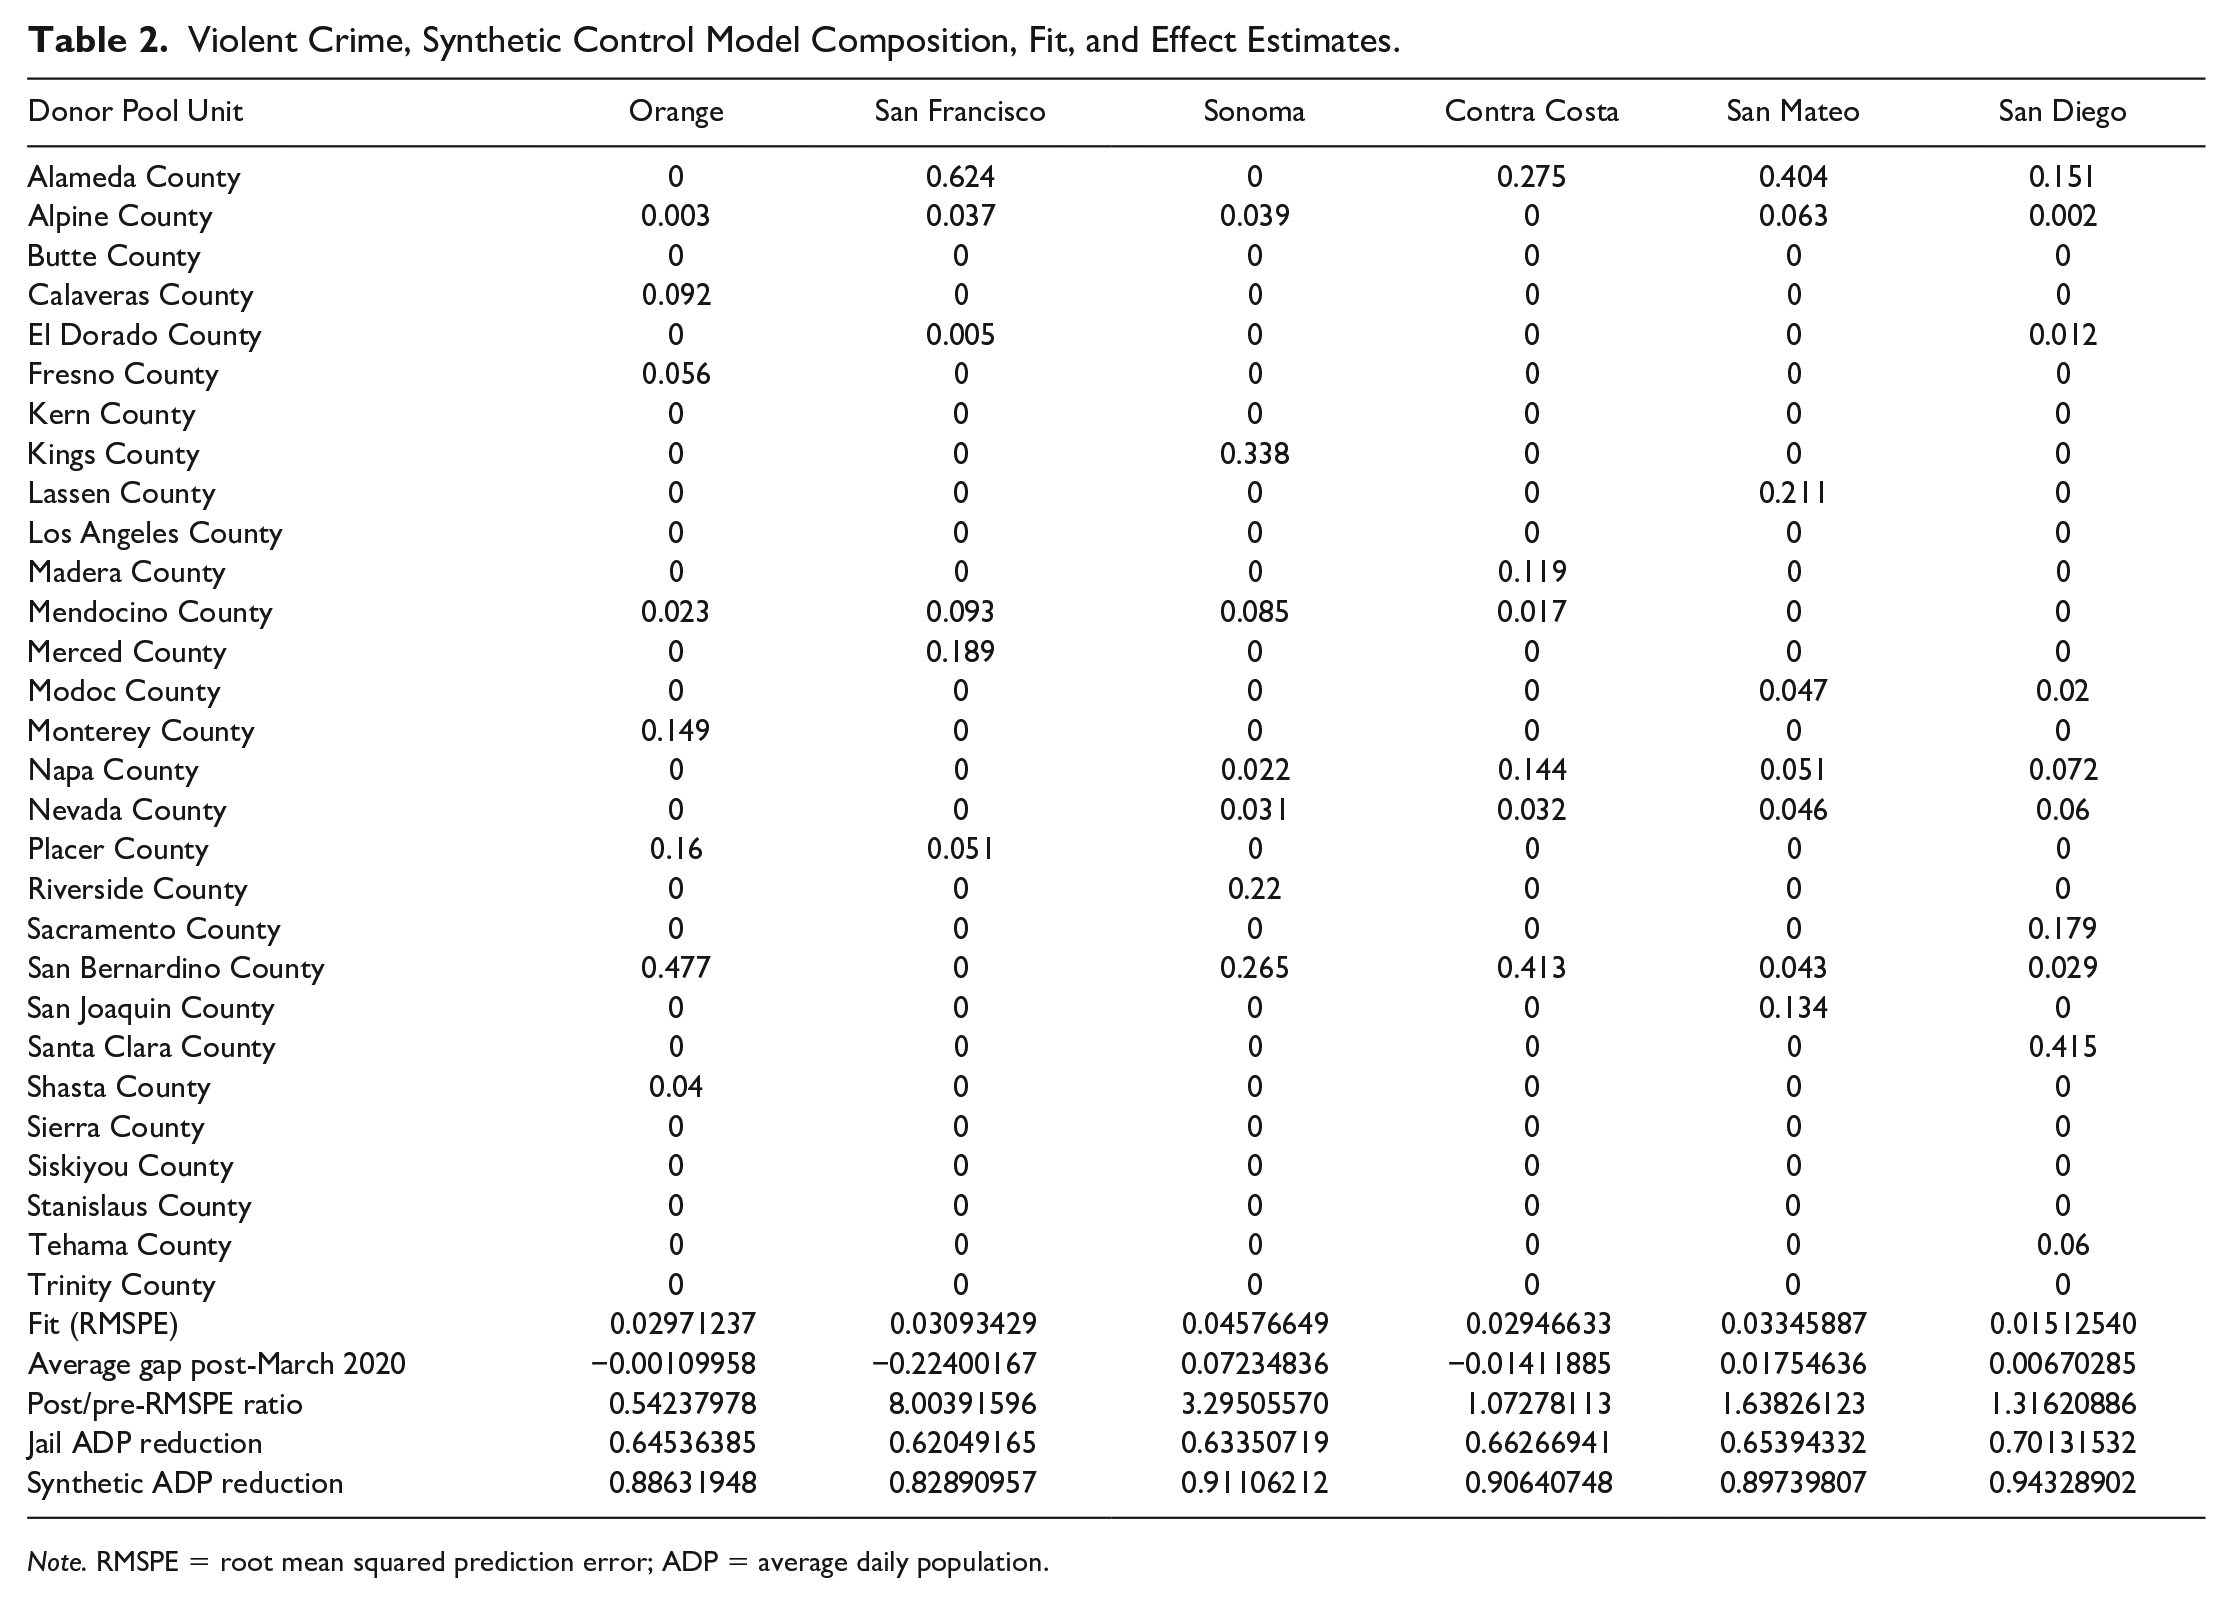
Note. RMSPE = root mean squared prediction error; ADP = average daily population.
According to ADP reductions listed in Table 2, the high-dosage counties reflect jail population reductions ranging from ~62% to ~70% of pre-pandemic baseline ADPs, and their synthetic control units reflect ADP reductions that are at least 20% less than their counterparts. Thus, the treatment dosage contrast between the high-dosage counties and their constructed synthetic controls is sufficiently large to rule out contamination of the synthetic controls as a reason the intervention effect on violent crime may be masked.
To evaluate whether the effects of jail decarceration on crime are being driven by, or are dependent upon, a particularly influential donor pool contributor, we reconstructed the synthetic controls with the donor pool county that contributed the largest weight in Table 2 excluded from the matching algorithm. This “leave one out test” is primarily focused on whether the sign or significance of an intervention effect changes once the primary donor pool unit is excluded. Figure 4 plots gaps between the high-dose county violent series and their reconstructed “leave one out” synthetic controls. Appendix Table A1 lists the composition, fit, and treatment contrast for the violent crime “leave one out” synthetic controls.
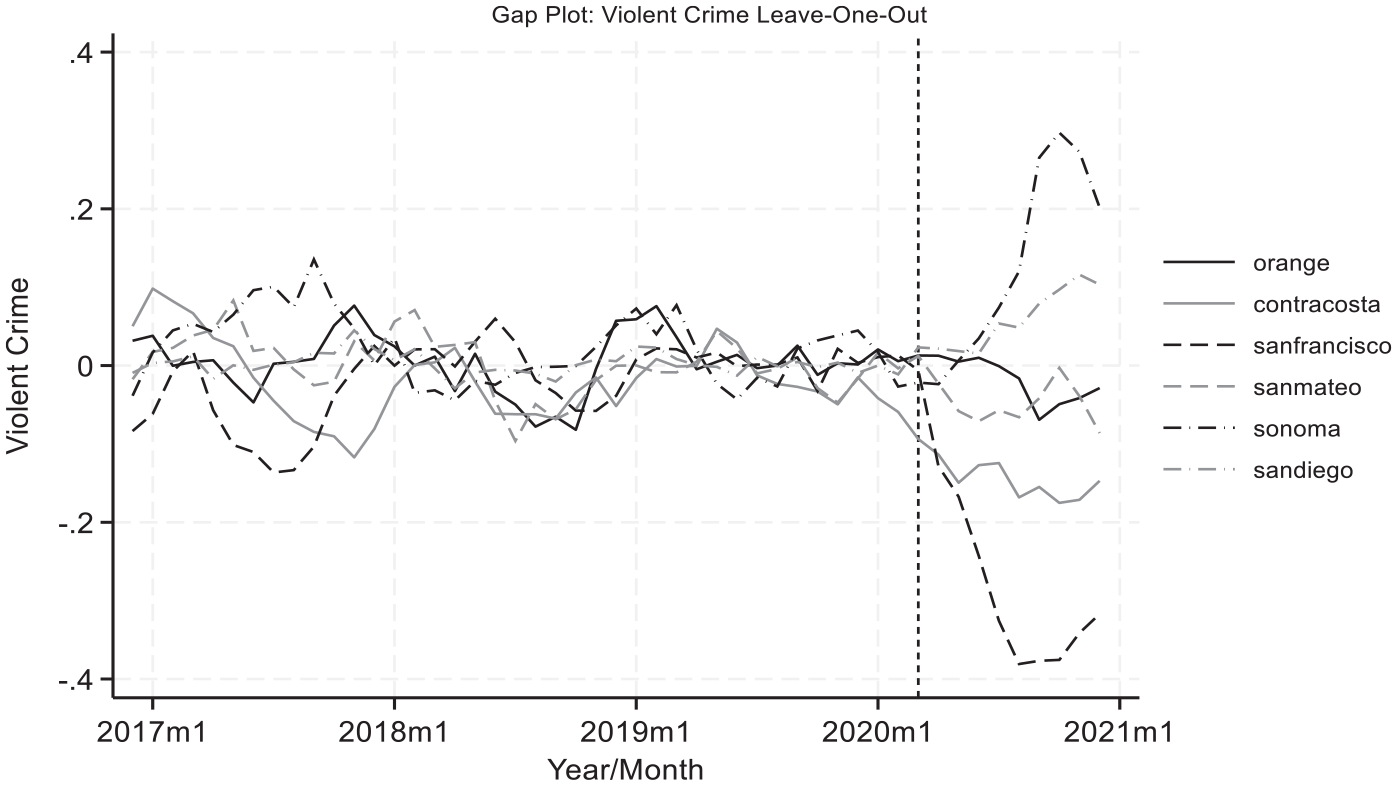
“Leave One Out” Gaps Between Treated and Synthetic Controls, Violent Crime.
According to Figure 4, the pre-intervention fit, as expected, suffered for all high-dosage counties, but the interpretation remains the same. Only San Francisco and Sonoma have decarceration effects on violent crime that are distinguishable from null. Overall, then, the analyses do not suggest a consistent relationship between COVID-19 mitigating jail decarceration and violent crime at the county level.
Property Crime
Figure 5 plots the high-dosage counties’ proportionate change in property crime (solid black lines) against their constructed synthetic control series (dashed black lines), with reference lines at March 2020 indicating the jail decarceration intervention. The quality of the pre-intervention fit varies across the six high-dosage counties, but again, there does not appear to be a relationship between precision of the pre-intervention fit and the direction of the post-intervention gap.
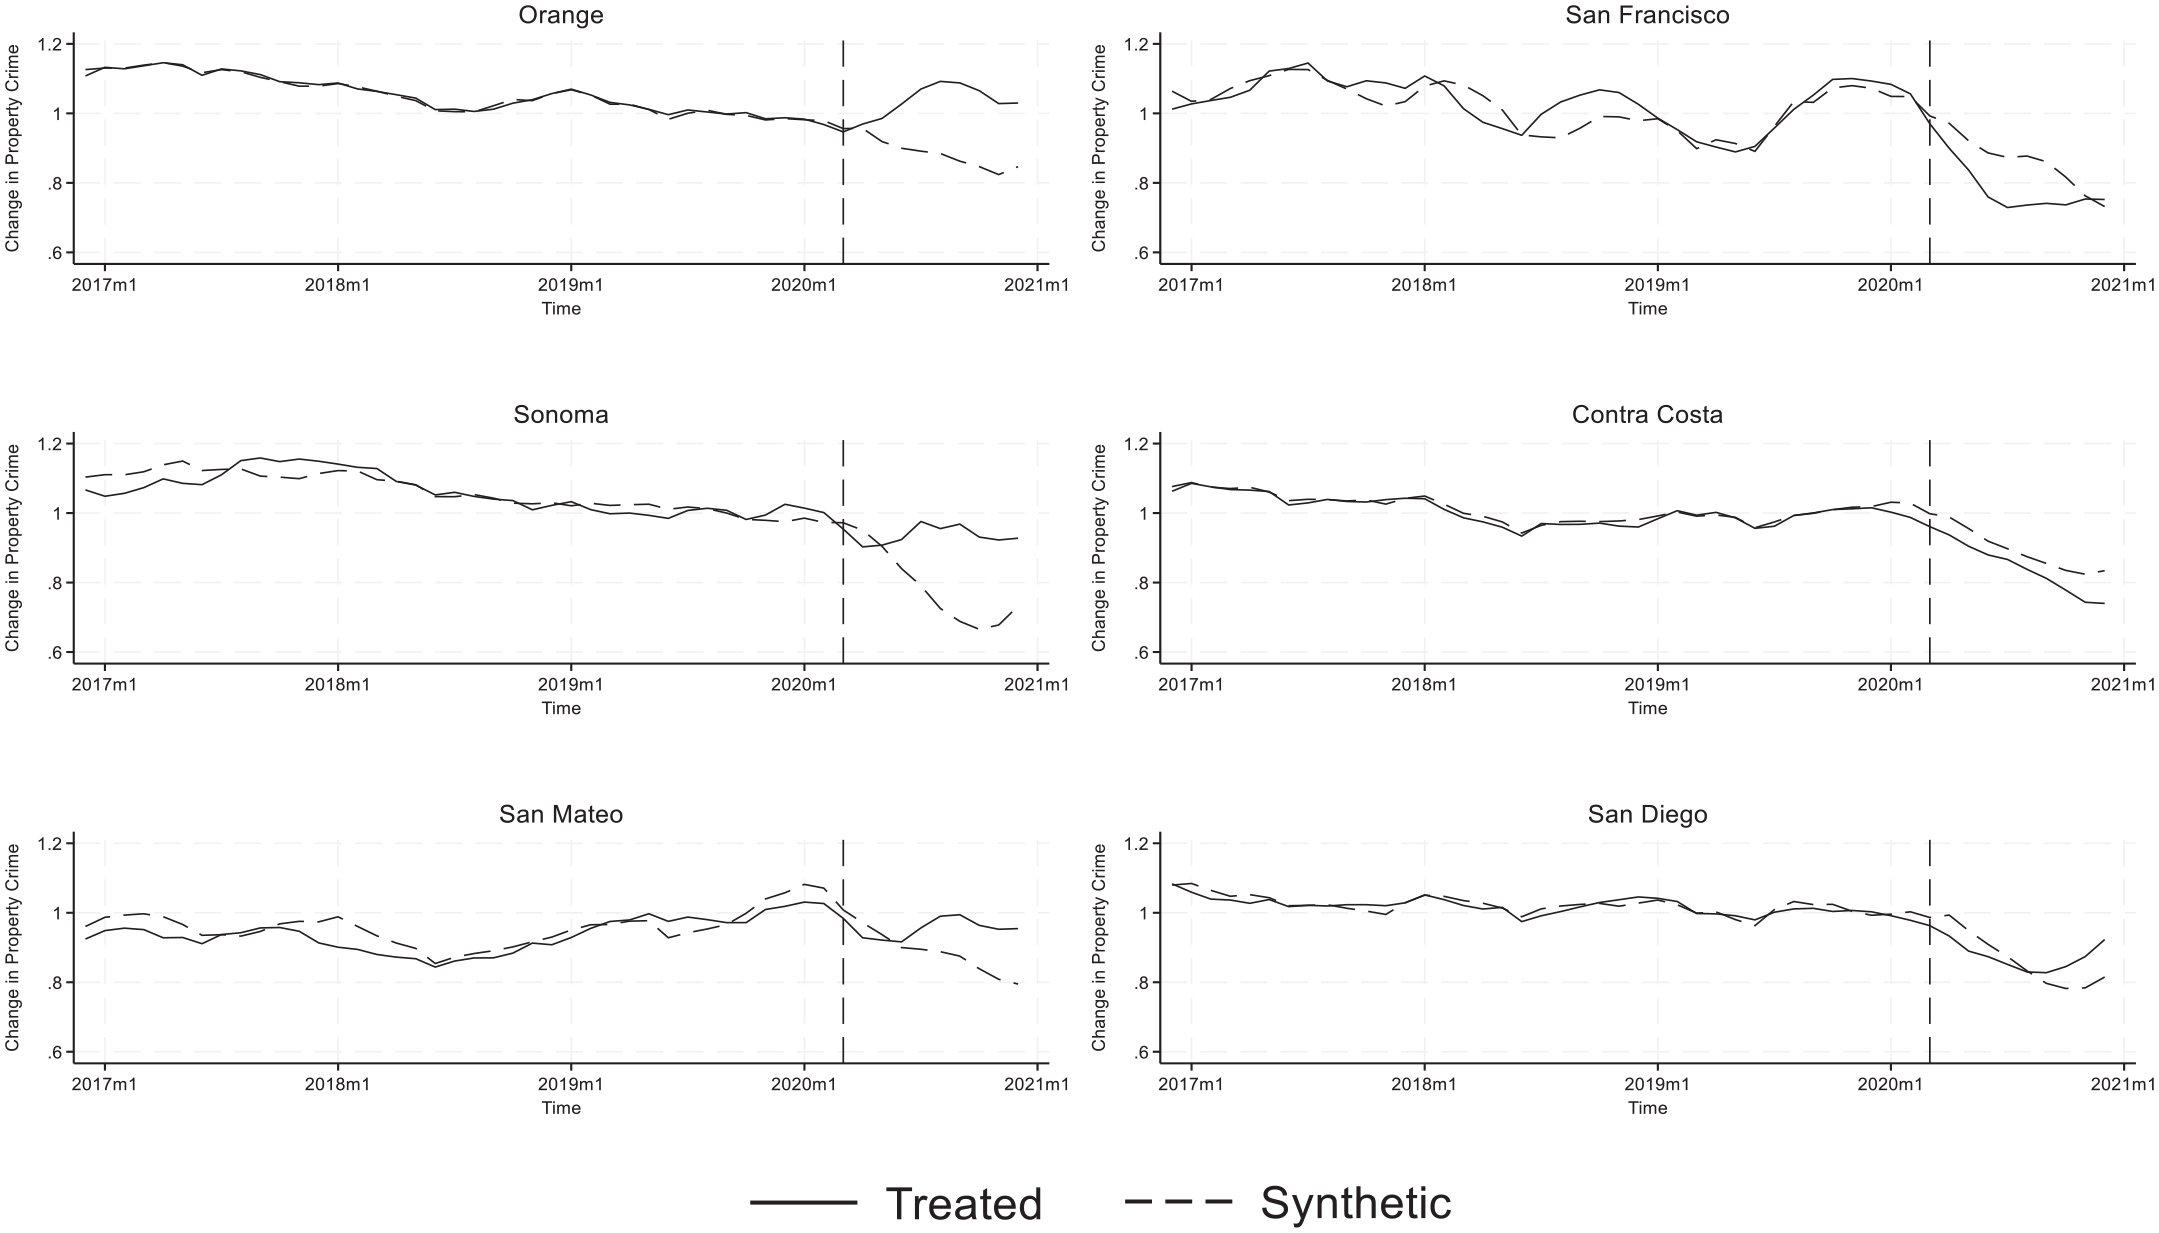
Synthetic Control Plots, Property Crime.
Differences between high-dose county property crime series and their synthetic controls are plotted in Figure 6. San Francisco, San Mateo, and Sonoma have larger pre-intervention residuals than the other counties, for example, but the effects they suggest are not merely at risk of being indistinguishable from null. Rather, they suggest effects with opposing signs (+/−) altogether.
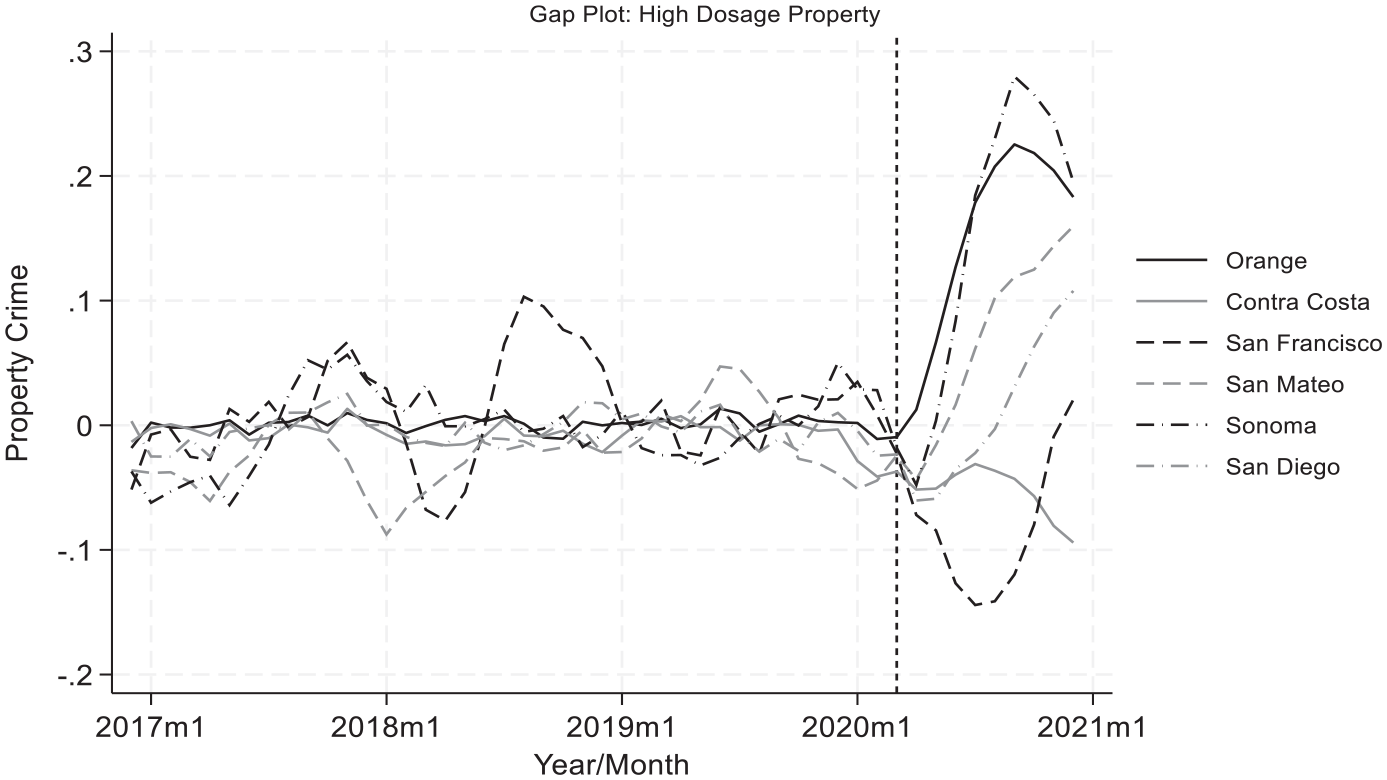
Gap Between Treated and Synthetic Controls, Property Crime.
Orange County, for example, is the best fit synthetic control presented from this analysis. Up until the point of intervention, Orange County and its synthetic control follow each other with no substantial deviations but at the intervention point the series immediately split, suggesting that jail decarceration led to an increase in property crime that persists through the analysis time frame.
In contrast to the violent crime models, a subset of counties (Orange, Sonoma, and San Mateo) show that property crime rates were higher in these counties than they would have been had they not decarcerated as heavily (i.e., at a low or no dosage). Although there is more reason to suspect that jail decarceration impacted property crime—at least in Orange County—than violent crime, there again is no consistent pattern across the high-dosage jail decarceration counties. San Francisco again appears better off in terms of property crime than it would have been had they not decarcerated as heavily (again, a finding we return to in the Conclusion), whereas findings from Contra Costa and San Diego counties show a null relationship.
If jail decarceration during the pandemic caused property crime to increase, we would have expected the series in Figure 6 to follow a path similar to Orange County and its synthetic control. In fact, with only three models suggesting a criminogenic impact, San Francisco’s model indicating a reduction in property crime, and two well-fit models showing null effects, there is an inconsistent or weak relationship between the extent of a county’s jail decarceration and their property crime rate in remainder of 2020. According to the ADP reductions listed in Table 3 for the counties and their synthetic controls, all models reflect a contrast in jail decarceration of >20% of their prior year baseline ADP. Again, the treatment dosage contrast between the high-dosage counties and their constructed synthetic controls is sufficiently large to rule out contamination of the synthetic controls as a reason the intervention effect on property crime may be masked.
Property Crime, Synthetic Control Model Composition, Fit, and Effect Estimates.
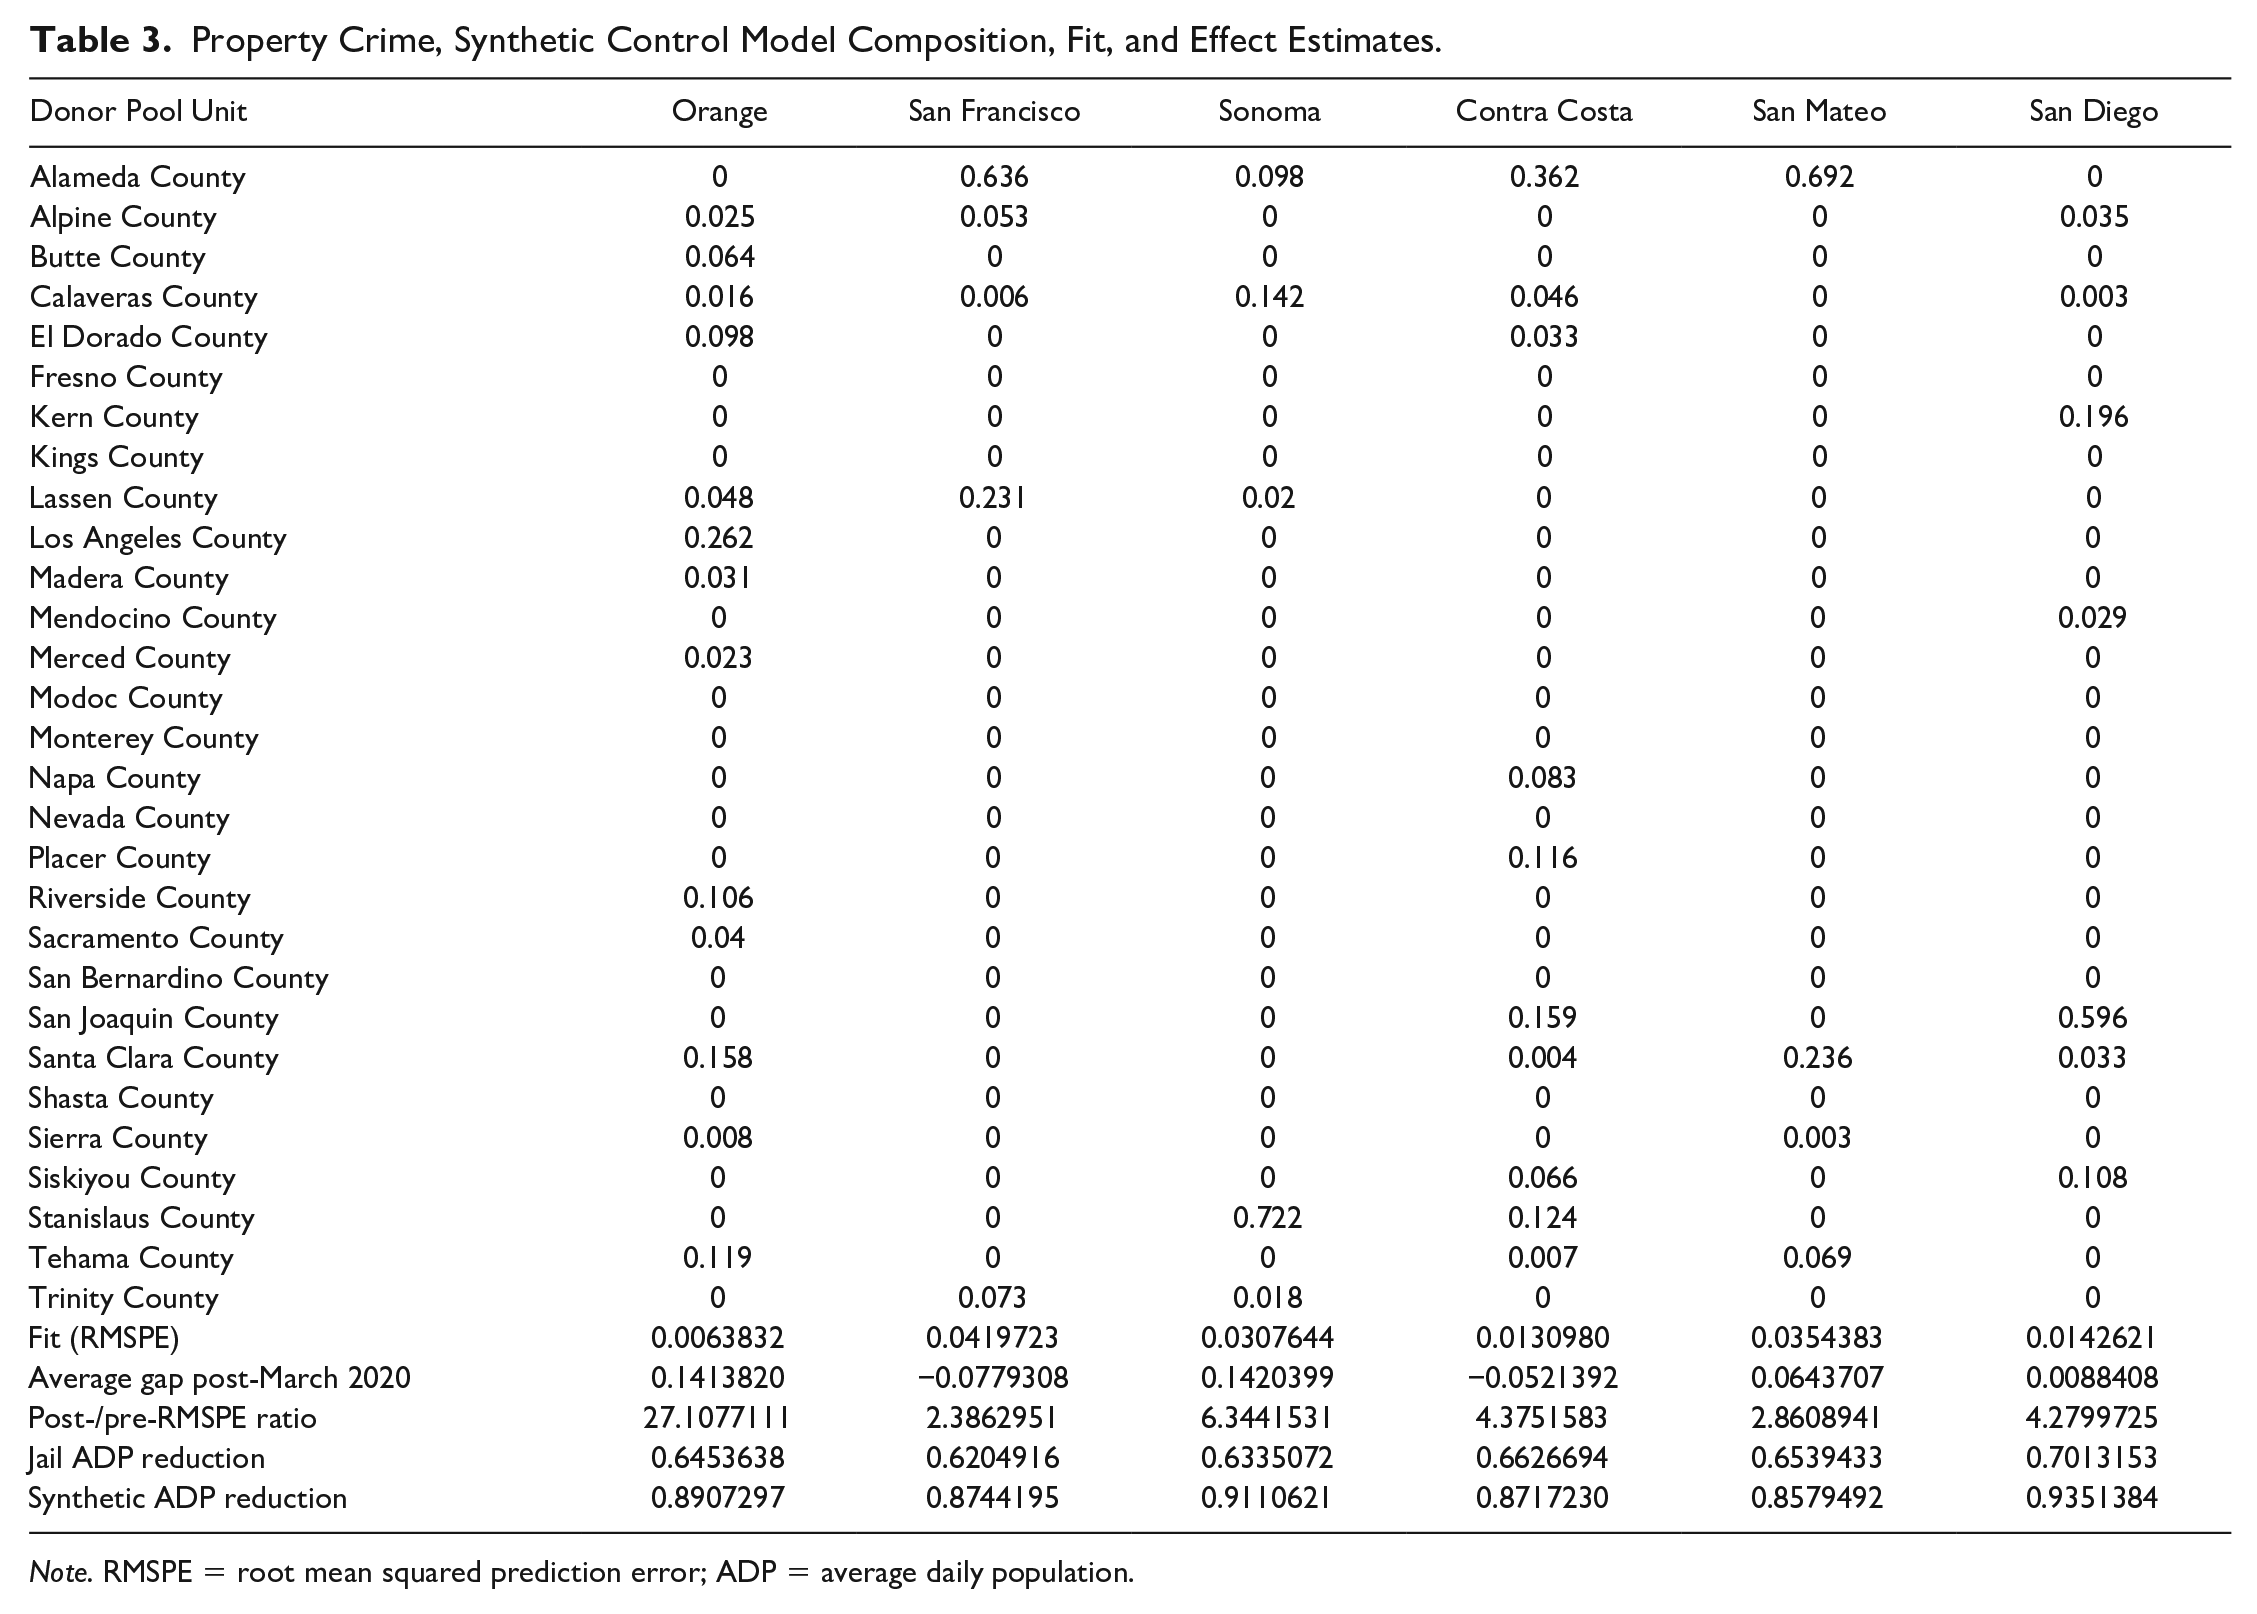
Note. RMSPE = root mean squared prediction error; ADP = average daily population.
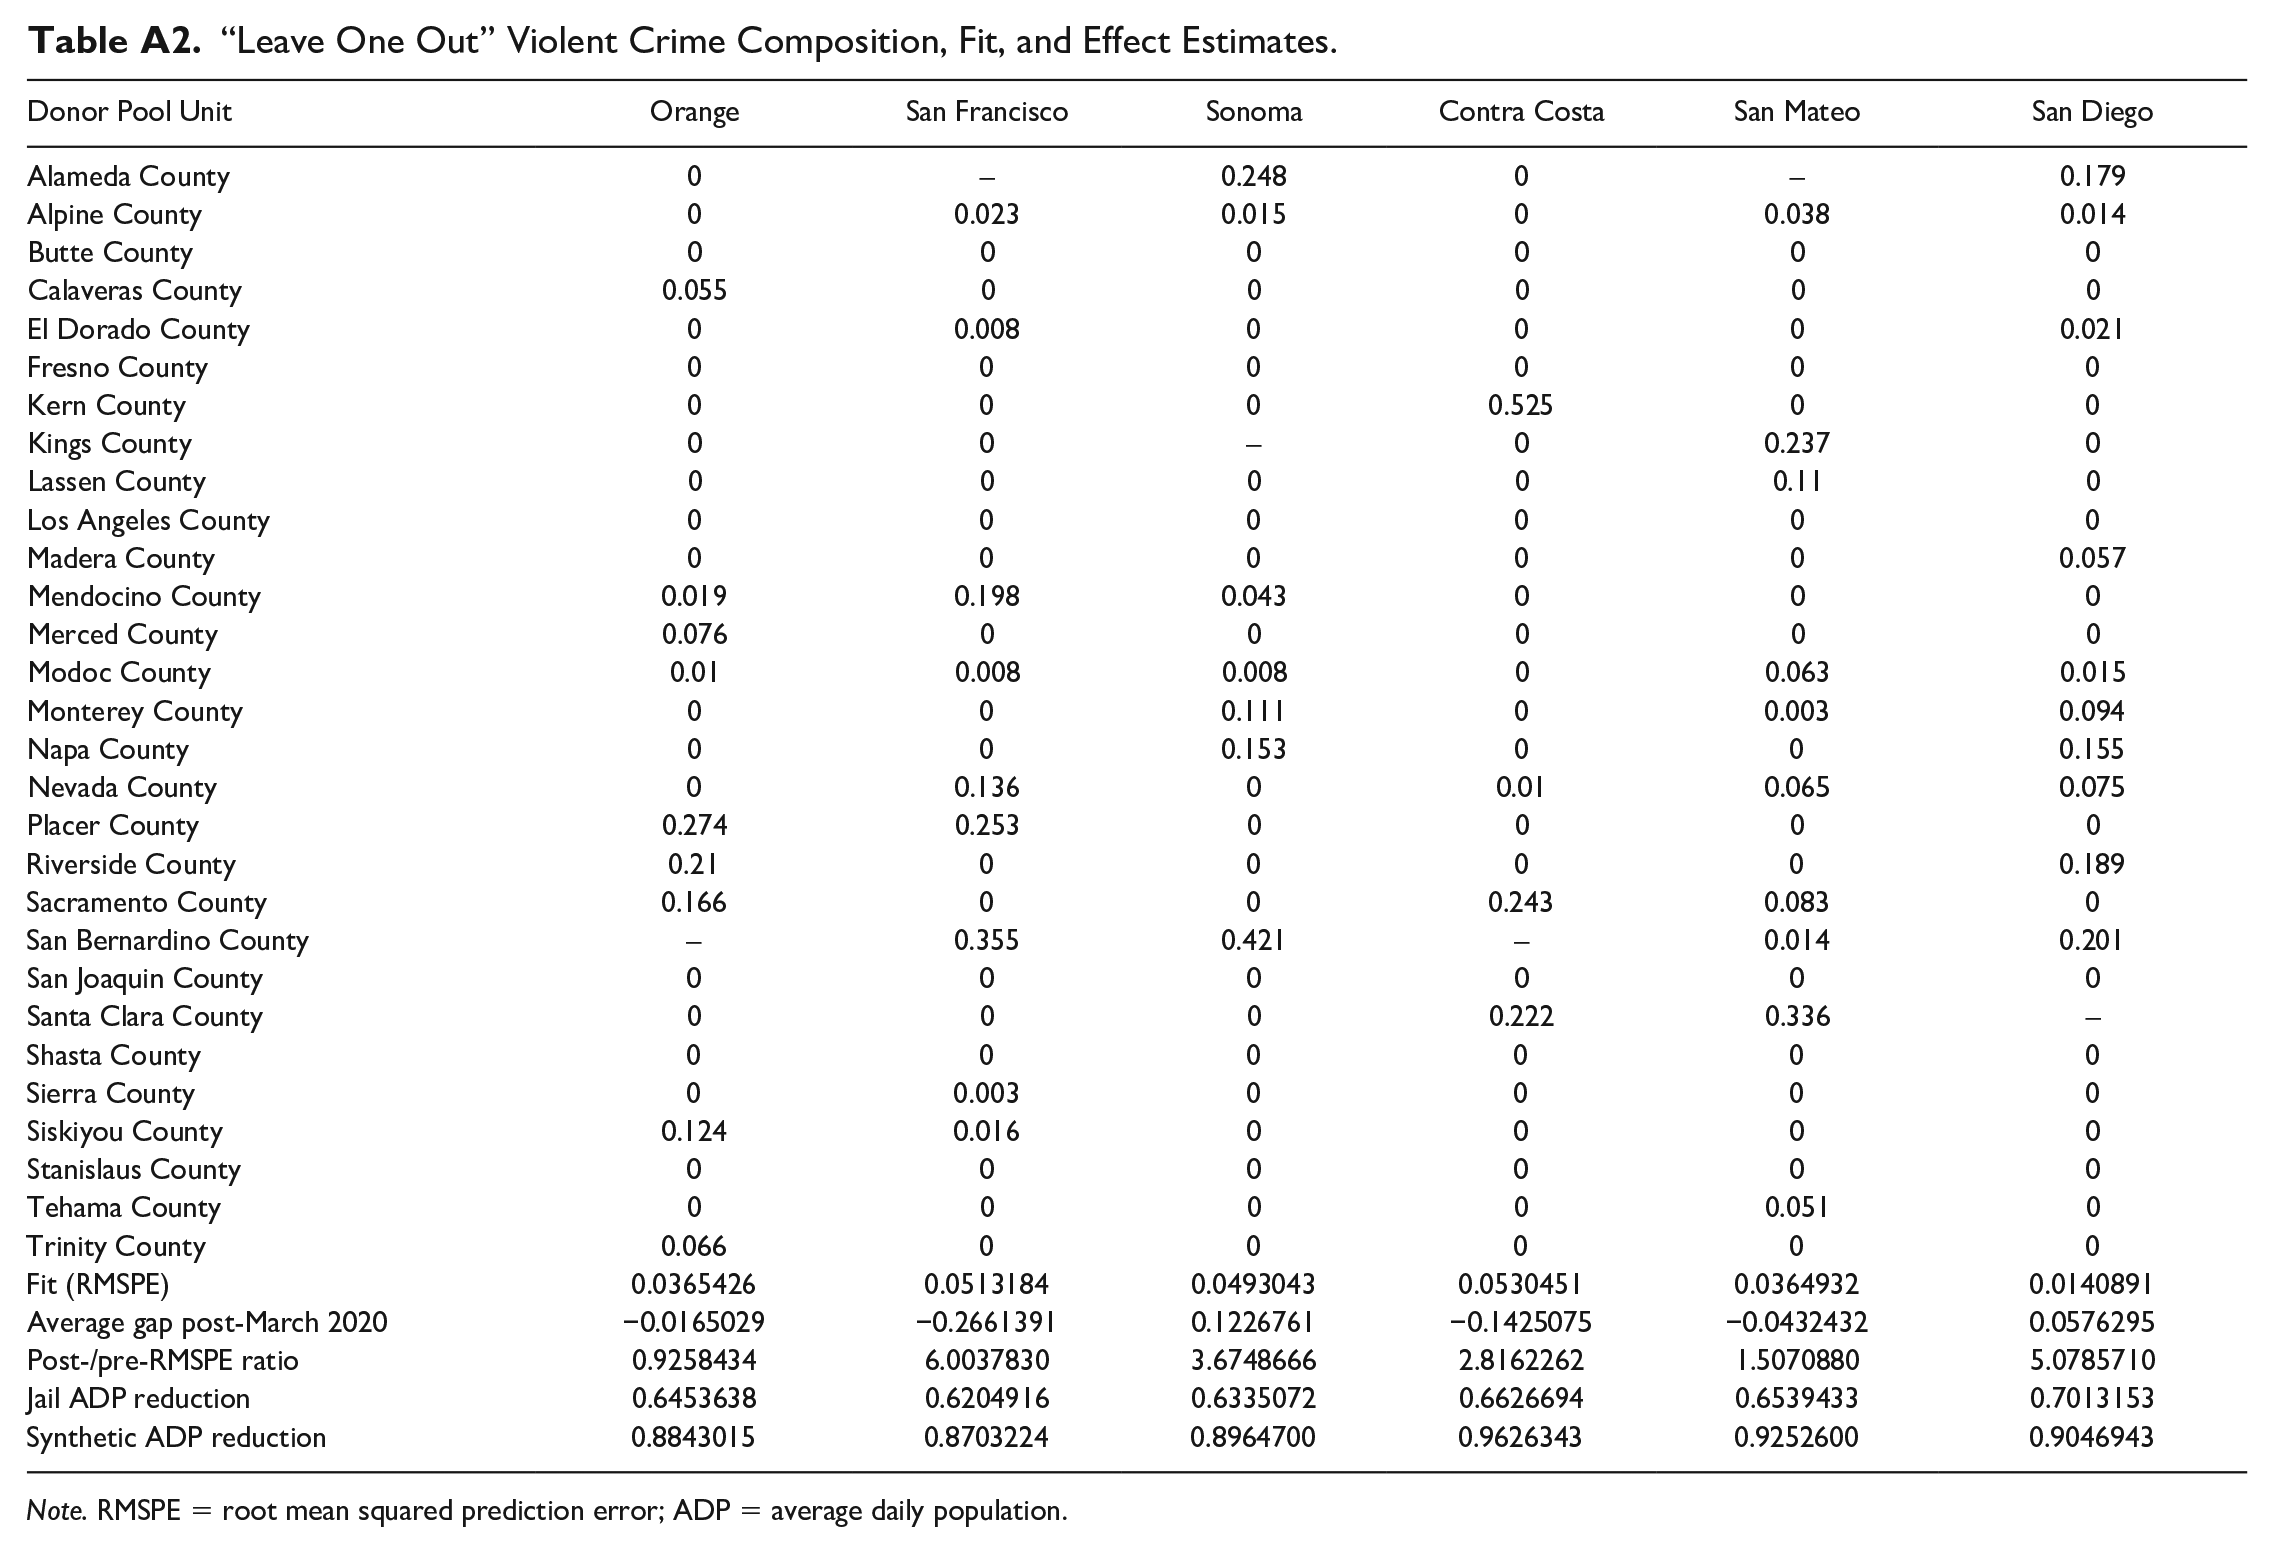
To evaluate whether the effects of jail decarceration on crime are being driven by or are dependent upon a particularly influential donor pool contributor, we once again reconstruct the synthetic controls with the donor pool county that contributed the largest weight in Table 3 excluded from the matching algorithm. Figure 7 plots gaps between the high-dose county property series and their reconstructed “leave one out” synthetic controls. Appendix Table A2 lists the composition, fit, and treatment contrast for the property crime “leave one out” synthetic controls.
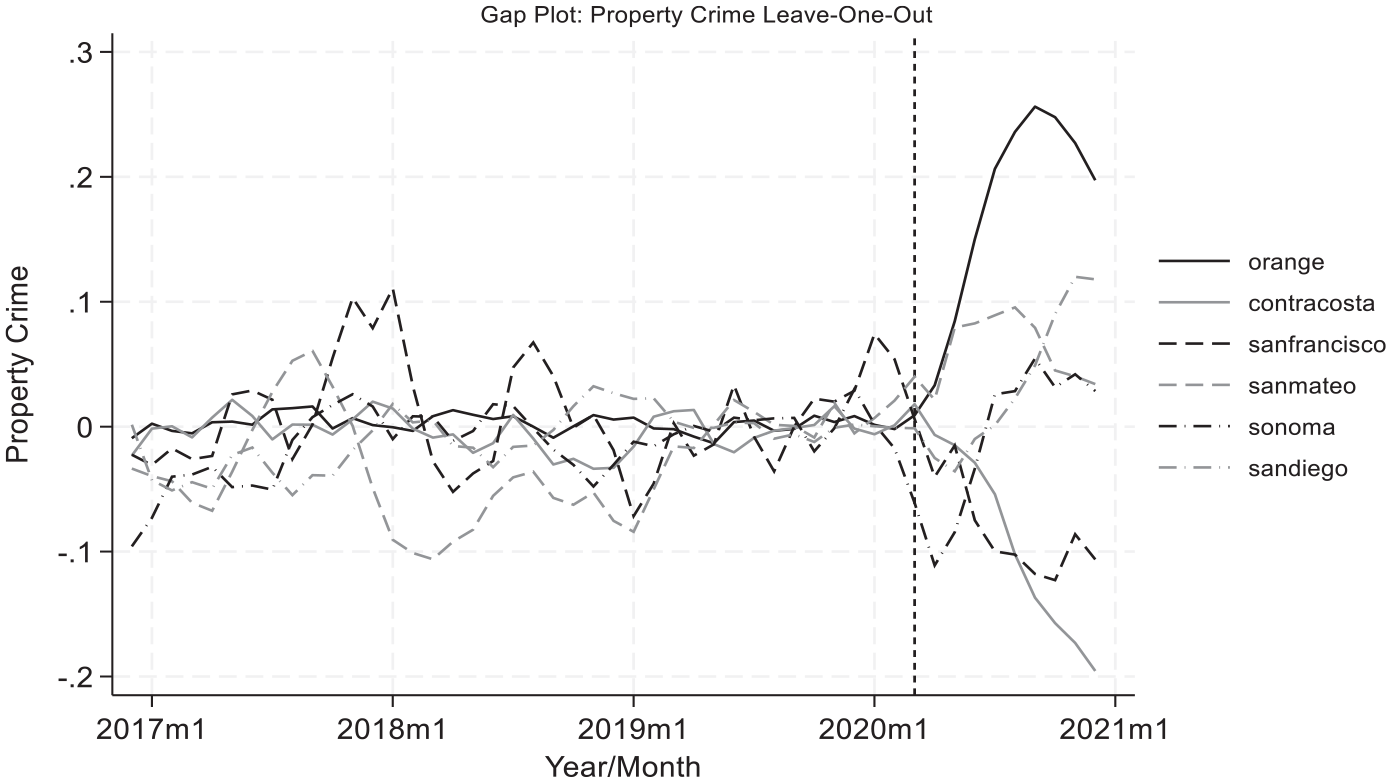
“Leave One Out” Gaps Between Treated and Synthetic Controls, Property Crime.
According to Figure 7, the pre-intervention fit between Sonoma and its synthetic control suffered quite a bit, rendering the intervention effect largely null. Orange, however, appears quite robust to the “leave one out” exclusion. Overall, however, no pattern of jail decarceration dosage and property crime effects emerges.
Conclusion
The COVID-19 pandemic induced major changes to the operation of criminal justice systems in the United States. Like so many other states, California implemented emergency strategies to reduce jail populations and mitigate the virus’s spread. Did decarceration during the pandemic lead to spikes in crime across the state? Although “Early release and home confinement mitigated most virus consequences within facilities,” we agree that “safe release policies and principles require development with important concerns for public safety, and subsequent crime and recidivism” (Jossie et al., 2022, p. 1253). For this reason, we sought to analyze the impact of jail decarceration intended to mitigate COVID-19 spread on crime in California. Adapting the traditional synthetic control method to account for the “fuzzy-ness” (Ragin, 2000, 2009) of the intervention, we utilized natural variation among counties to isolate decarceration’s impact on crime from various other shocks affecting the state as a whole. We did not find a consistent relationship between COVID-19 jail decarceration and crime at the county level, suggesting downsizing, on average, did not drive crime upticks statewide.
Considering individual counties, one set of findings worth discussing in greater detail are those for San Francisco. Recall we found that San Francisco’s crime rates fell well below their synthetic control series post-March 2020, suggesting the county experienced less violent and property crime than it would have had they not decarcerated their jails in a high-dosage manner. What may explain this puzzling (for some) finding, especially given a perception that San Francisco’s progressive policies and “permissiveness” more generally have led to increased homeless and crime (Rufo, 2020)? Although we can only speculate, it may have something to do with the county’s significant population loss during the pandemic. According to the U.S. Census, a quarter of a million people fled the Bay Area from 2020 to 2022 (Thompson, 2023), and among all nine counties in this area, San Francisco reported the highest population percentage loss at 7.5% (the next highest, San Mateo County, reported a loss of 4.6%). Population loss coupled with pandemic-induced changes in residents’ routine activities that may be unique to San Francisco (i.e., large number of tech employees working from home) may have depressed crime rates during the study period. Indeed, in supplemental analyses not reported here, we find that declines in violent crime were driven largely by reductions in robbery and aggravated assault while declines in property crime were driven entirely by reductions in larceny—consistent with this speculation. Importantly, those relocating out of San Francisco County are unlikely to be individuals released from jail, suggesting our conclusions regarding downsizing and crime remain unchanged.
Our findings should be considered in the context of study limitations. The primary limitation of our synthetic control adaptation is that the treated and synthetic series do not reflect fully treated and completely untreated versions of county crime rates that are generally produced via synthetic controls. Rather, as we noted earlier, they reflect high-dosage treated units and low-dosage comparison units. Thus, the discussion focuses on the pattern of results across treated units. Given opposing impacts observed for violent and property crime alongside null effects in between, we have no reason to believe that high-dosage jail decarceration caused crime to increase in California counties during the study period. However, it is worth noting that imposing treatment contrast by excluding counties that experienced similarly high dosages of the treatment (e.g., jail population reduced by more than 20%) limits how precisely the optimal synthetic control series can mimic the treated unit’s pre-intervention crime time series merely due to the reduced donor pool n. In other words, imposing a larger treatment contrast via donor pool restrictions comes at the cost of pre-intervention fit, so a balance was struck between precision and interpretability.
Another limitation is the study’s relatively short time span. Because the synthetic control method only accounts for shocks experienced in the pre-intervention segment of the time series, to avoid conflating 2020 election denial protests and clashes with counter-protestors with the impact of jail decarceration, we limit the results period to March through December 2020. While ending in December 2020 protects against attributing the effects of election denial, inflation, and other shocks in 2021 and beyond to the effect of the intervention, if jail decarceration has a many month lagged impact on crime, we may not observe the accrual of that lagged effect before December 2020.
Finally, although the first few months of the pandemic were largely lockdown focused, from May 2020 to August 2020 protests emerged nationwide following the murders of Breonna Taylor, George Floyd, Jacob Blake, and others. If some California counties experienced protests that produced clashes with police or property damage while others did not, then these events may be conflated with the jail decarceration impact. If the post-intervention gap between treated counties and their synthetic controls is being driven by differential exposure to the May-August 2020 protests in addition to jail decarceration, then we would expect the post-intervention gaps in Figures 2 and 5 to emerge or quickly increase between 3- and 6-month post-March 2020. Although the violent crime synthetic controls plotted in Figure 2 do not suggest a confounding impact of the protests, in Figure 5, San Mateo and Sonoma property crime models suggest null impacts in the first few months post-March 2020 before gaps emerge. However, they suggest impacts with opposite signs (+/−). Even if we consider those two estimates as null, it does not render the inconsistent effect estimates on property crime meaningfully consistent. Therefore, our interpretation of jail decarceration’s impact on property crime as weak or inconsistent appears resilient to the potential confound posed by the summer 2020 protests.
These limitations reveal it is challenging to identify decarceration’s possible impact from any other factor in one of the most dynamic and challenging periods this state—and the nation as a whole—has experienced (Lofstrom, 2023). Even if our findings of no consistent relationship between COVID-19 jail decarceration and crime hold, the question remains: How to make sense of recent trends in crime and recidivism? And what do they mean for California (and the nation) moving forward? As Lofstrom (2022, p. 4) suggests, there are likely several forces at play: “Exceptional pandemic conditions along with economic hardship, civil unrest, changes in policing, a turbulent election year, and escalating gun sales (including a record-setting year for handguns sold in California) all may have contributed.”
Although it remains unclear what specific factors are behind crime increases in California (and beyond), our findings suggest they do not appear to be driven by downsizing measures implemented in the wake of COVID-19, consistent with findings from the Safety and Justice Challenge study reported earlier. The burden of proof shifts, then, to critics who claim a decarceration–crime connection. As Khan et al. (2023, p. 3) argue, “To date, these claims have not been grounded in any evidence. They do not acknowledge the concurrent complex web of pandemic-related social and economic strains, or the fact that homicides increased in many major cities that did not enact progressive jail population reform efforts.” Beyond critics’ claims, our findings suggest, ultimately, that “advancing equitable and thoughtful criminal legal reform is possible without compromising public safety” (Khan et al., 2023, p. 11).
Footnotes
Appendix
“Leave One Out” Violent Crime Composition, Fit, and Effect Estimates.
| Donor Pool Unit | Orange | San Francisco | Sonoma | Contra Costa | San Mateo | San Diego |
|---|---|---|---|---|---|---|
| Alameda County | 0 | – | 0.248 | 0 | – | 0.179 |
| Alpine County | 0 | 0.023 | 0.015 | 0 | 0.038 | 0.014 |
| Butte County | 0 | 0 | 0 | 0 | 0 | 0 |
| Calaveras County | 0.055 | 0 | 0 | 0 | 0 | 0 |
| El Dorado County | 0 | 0.008 | 0 | 0 | 0 | 0.021 |
| Fresno County | 0 | 0 | 0 | 0 | 0 | 0 |
| Kern County | 0 | 0 | 0 | 0.525 | 0 | 0 |
| Kings County | 0 | 0 | – | 0 | 0.237 | 0 |
| Lassen County | 0 | 0 | 0 | 0 | 0.11 | 0 |
| Los Angeles County | 0 | 0 | 0 | 0 | 0 | 0 |
| Madera County | 0 | 0 | 0 | 0 | 0 | 0.057 |
| Mendocino County | 0.019 | 0.198 | 0.043 | 0 | 0 | 0 |
| Merced County | 0.076 | 0 | 0 | 0 | 0 | 0 |
| Modoc County | 0.01 | 0.008 | 0.008 | 0 | 0.063 | 0.015 |
| Monterey County | 0 | 0 | 0.111 | 0 | 0.003 | 0.094 |
| Napa County | 0 | 0 | 0.153 | 0 | 0 | 0.155 |
| Nevada County | 0 | 0.136 | 0 | 0.01 | 0.065 | 0.075 |
| Placer County | 0.274 | 0.253 | 0 | 0 | 0 | 0 |
| Riverside County | 0.21 | 0 | 0 | 0 | 0 | 0.189 |
| Sacramento County | 0.166 | 0 | 0 | 0.243 | 0.083 | 0 |
| San Bernardino County | – | 0.355 | 0.421 | – | 0.014 | 0.201 |
| San Joaquin County | 0 | 0 | 0 | 0 | 0 | 0 |
| Santa Clara County | 0 | 0 | 0 | 0.222 | 0.336 | – |
| Shasta County | 0 | 0 | 0 | 0 | 0 | 0 |
| Sierra County | 0 | 0.003 | 0 | 0 | 0 | 0 |
| Siskiyou County | 0.124 | 0.016 | 0 | 0 | 0 | 0 |
| Stanislaus County | 0 | 0 | 0 | 0 | 0 | 0 |
| Tehama County | 0 | 0 | 0 | 0 | 0.051 | 0 |
| Trinity County | 0.066 | 0 | 0 | 0 | 0 | 0 |
| Fit (RMSPE) | 0.0365426 | 0.0513184 | 0.0493043 | 0.0530451 | 0.0364932 | 0.0140891 |
| Average gap post-March 2020 | −0.0165029 | −0.2661391 | 0.1226761 | −0.1425075 | −0.0432432 | 0.0576295 |
| Post-/pre-RMSPE ratio | 0.9258434 | 6.0037830 | 3.6748666 | 2.8162262 | 1.5070880 | 5.0785710 |
| Jail ADP reduction | 0.6453638 | 0.6204916 | 0.6335072 | 0.6626694 | 0.6539433 | 0.7013153 |
| Synthetic ADP reduction | 0.8843015 | 0.8703224 | 0.8964700 | 0.9626343 | 0.9252600 | 0.9046943 |
Note. RMSPE = root mean squared prediction error; ADP = average daily population.
Declaration of Conflicting Interests
The author(s) declared no potential conflicts of interest with respect to the research, authorship, and/or publication of this article.
Funding
The author(s) received no financial support for the research, authorship, and/or publication of this article.