
Abstract
Within the crime trends literature, there exist several notable studies that have examined the linkages between various economic measures and trends in violent and property crime. This research expands on that literature by examining whether and to what extent racial income gaps are related to changes in city-level crime. Pulling together data from the Uniform Crime Report, U.S. Census, and American Community Survey, this project focuses on homicide and violent crime trends of 73 cities from 2006 to 2020 and changes in city-level racial-ethnic income gaps. This study employs a series of multilevel longitudinal models to measure whether changes in this income gap, whether widening or constricting, are related to changes in rates of violent crime and homicide both within and between cities. Results find that changes in any of the racial-ethnic income gaps tested are not related to trends in violent crime and homicide within or between cities. However, the inclusion of the White-Hispanic income gap and total income gap explained sizable portions of the between-city and within-city rates of violence and homicide.
Introduction
Many prior studies have found evidence linking economic conditions to crime rates on a variety of levels (i.e., city, county, and country) and across many different periods of time (Lauritsen & Heimer, 2010; Rosenfeld, 2009; Rosenfeld & Fornango, 2007; Rosenfeld & Messner, 2009). Research has examined measures of income inequality, poverty, consumer sentiment, and other measures of socioeconomic status, generally finding evidence of relationships between these measures and levels of crime (Pratt & Cullen, 2005). However, the prior research has largely used measures that look at the populations of the geographic unit of analysis as a whole. But when examining economic measures especially, overarching measures mask any potential nuance in these measures between individuals. There are well-documented wealth gaps across different demographic characteristics, but race and ethnicity are especially glaring.
In the United States specifically, the wealth gap between White and Black individuals is well documented (Shapiro et al., 2013). Scholars point to several contributing factors to the persistent gaps in wealth, such as income, assets, home ownership, and generational wealth (Conley, 2001; Shapiro et al., 2013). Within criminological research, several studies have found that criminal justice contact and disparate sentence lengths and associated fines have also added to this wealth gap (Sykes & Maroto, 2016). However, research has not yet examined whether the gap itself can contribute to offending behaviors.
Research on income inequality and its relationship to different types of crime has been mixed. While the relationship between socioeconomic status and crime has been repeatedly established (Pratt & Cullen, 2005), the underlying mechanisms driving this relationship are not as settled. Some work argues that it is instead levels of economic inequality, rather than measures of absolute poverty, that are most important, drawing on theory related to relative deprivation and anomie (Ouimet, 2012; Savolainen, 2000). Other work has found that measures of levels of poverty (i.e., poverty indices and infant mortality rate) are more strongly linked to rates of crime than indicators of economic inequality (Pare & Felson, 2014; Pridemore, 2008, 2011). Regardless of the argument, race and/or ethnicity is most commonly included only as a control variable in this prior work and rarely pulled out to be examined in the main part of the analysis.
This study seeks to incorporate race, ethnicity, and economic indicators together to explain changing trends in city-level violent crime. Specifically, this study examines whether changes in the size of racial-ethnic income gaps over time are associated with changing homicide and violent crime rates within a city. In addition, this study assesses whether differences across cities in racial-ethnic income gaps can explain between-city differences in rates of violent crime and homicide. While most of the prior research in racial income inequality focuses on Black-White comparisons, this study incorporates comparisons with Hispanic and Asian populations as well. The article first details the prior research and theory related to racial-ethnic income gaps and racial-ethnic wealth gaps more broadly and the relationship between economic factors and crime. Then, the analysis and results are presented and discussed.
Background
Prior research on racial-ethnic wealth gaps within the context of the United States has primarily focused on the gap between Black and White individuals. This Black–White gap has increased over time, with one study showing a near tripling of the wealth gap between 1984 and 2009 (Shapiro et al., 2013). Explanations for this gap point to differences in income, stock ownership, business ownership, homeownership, parental wealth, and inheritances (Conley, 2001; Herring & Henderson, 2016; Shapiro et al., 2013). Gaps in Black–White earnings have been found to increase over the life course, with the gap becoming much more pronounced in middle adulthood compared with gaps in young adulthood (Thomas et al., 1994). This widening of the gap across the life course may in part be due to the differential returns on the same actions between White and Black individuals. Herring and Henderson (2016) found that African Americans had significantly lower wealth returns to educational attainment, age, income, stock ownership, and business ownership. Other work has found that race and ethnicity are stronger predictors of economic well-being than a host of other factors such as educational attainment, income, employment status, or type of position (Addo & Darity, 2021).
Embedded within this Black–White wealth gap is the long-lasting effects of differential treatment by and consequences of contact with the criminal justice system. Sykes and Maroto (2016) argue that mass incarceration in the United States has contributed to the continued wealth inequality between Black and White individuals. Juveniles who have been arrested have lower assets and net worth later in young adulthood (Siennick & Widdowson, 2022). Contact with the criminal justice system can limit the ability for young adults to accumulate wealth before the age of 30, with incarceration found to reduce net worth by 34% and reduce assets by 76% (Maroto & Sykes, 2020). A portion of the Black–White wealth gap can be explained by racial differences in the risk of incarceration (Price, 2022). While the impact of differential criminal justice contact has been shown to account for portions of the racial wealth gap, some research argues that racial wealth gaps exist among those who would later become incarcerated as well (Zaw et al., 2016). This research suggests the wealth gap emerges even before criminal justice contact and that the existence of the wealth gap could be associated with later contact.
The larger body of research on the linkages between inequality and crime offers some theoretical rationale as to why a racial-ethnic wealth gap may be related to levels of offending. Studies of inequality are rooted in discussions of relative deprivation and anomie. The concept of relative deprivation emphasizes the social and comparative nature of deprivation, highlighting the importance of subjective perceptions rather than objective measures of absolute deprivation. Put simply, it focuses on the gap between what individuals believe they deserve or expect and what they actually have. This perceived gap can lead to feelings of frustration or resentment, creating a sense of anomie (Merton, 1938) or institutional anomie (Messner & Rosenfeld, 1997a, 1997b) where societal rules surrounding behavior are undermined and lose their legitimacy. When this occurs, crime is hypothesized to increase, as individuals no longer feel a need to abide by the rules set by a society they deem to be unfair (Blau & Blau, 1982).
Research has supported this notion. Glaeser et al. (2009) found that homicide was higher in more economically unequal cities. Furthermore, the authors found a correlation between levels of happiness and their measure of inequality, with levels of inequality explaining some of the between-city variation in levels of happiness. While happiness levels do not perfectly capture the subjective feelings of relative deprivation, they are certainly related. Inequality has been linked to increased levels of both violent and property crimes (Quillian, 2012; Wilkinson & Pickett, 2009). While many studies of inequality and crime tend to be cross-national, levels of economic inequality have been found to have more proximate effects on crime as well, having been linked to neighborhood crime through its relationship to social disorganization and collective efficacy (Bursik, 1988; Sampson et al., 1997). In addition, racial income inequality has been linked to differences in race-specific crime rates as well, with studies finding positive relationships between measures of racial inequality and race-specific rates of crime (Messner & Golden, 1992; Parker & McCall, 1999).
However, some scholars argue that it is not inequality, but poverty, that is actually associated with varying levels of crime. Using indirect measures of poverty, Pridemore (2008, 2011) argues that cross-national homicide rates are not predicted by income inequality once poverty level is included in the model. Later research finds similar results and suggests that the theoretical motivations behind the inequality research, namely, relative deprivation, are misguided, arguing that one has to make assumptions about the groups individuals compare themselves against (Pare & Felson, 2014). Important in this debate is a discussion of the level of analysis. While points about the flaws in relative deprivation and measures of inequality may hold true at a cross-national level, research examining the relationship between economic inequality and crime has found associations across various levels of analysis. When comparing cities within a country, as well as comparing cities with themselves over time, inequality likely has a stronger effect than absolute levels of poverty.
The current study draws upon theories of anomie and relative deprivation to examine whether and to what extent racial-ethnic income inequality can explain trends in violence and homicide. It is hypothesized that in cities where there is higher income inequality across racial and ethnic groups, homicide and violence will be higher. Furthermore, changes over time in racial-ethnic inequality within cities will be related to changes in homicide and violent crime. While prior research has highlighted numerous concepts that contribute to determining household wealth, this study focuses on racial-ethnic income inequality due to a lack of city-level publicly available indicators of wealth that are able to be disaggregated by race and ethnicity. Concentrating this research on racial-ethnic income inequality also allows for the examination of comparisons beyond Black–White inequality to include Hispanic and Asian populations largely absent from the prior work on racial economic inequality.
Data and Methods
The data set for this project was created using information aggregated via Social Explorer from the U.S. Census, American Community Survey (ACS), Uniform Crime Reports (UCR), and the Atlas of U.S. Presidential Elections. Using counts from the 2020 Census, the 100 most populous cities were selected to be included in the data set. Data on all measures were then compiled for each city from 2006 to 2020. 1 After the data were gathered, cities with missing crime rate or median income data were dropped from the data set, resulting in 73 final cities used for analysis.
Following the theoretical logic of the deprivation/anomie explanation for the relationship between inequality and crime, this study examines trends in both the overall violent crime rate and the homicide-specific crime rate. Relative deprivation or anomie would theoretically lead to feelings of frustration or anger, which should be more likely to result in violence rather than property crime. Crime data were obtained from the Federal Bureau of Investigation’s (FBI) UCR and represent offenses reported to the police. Rates were calculated per 100,000 persons for both the measure of overall violent crime and homicide. While the UCR data are limited in that it cannot account for any crime incidents unknown to the police, when compared with self-reported victimization data, the general trends in crime tend to be quite similar (Blumstein et al., 1991; Lauritsen et al., 2016). However, due to the underreporting limitations of official data, the homicide-specific rate was pulled out and analyzed individually as it generally does not suffer from the same underreporting limitations of other violent crimes and is thus a more reliable indicator.
The main independent variables of interest for this specific project are median household income, race-specific median household income, and varying calculations of the median income gap between racial groups. Overall median household income is included in all models as a more traditional measure of the economic condition of each city in a specific year. Using this broad measure of central tendency likely hides any nuances happening underneath the surface of the number. Multiple cities could have similar median household incomes, but the median does not indicate how spread out (or how condensed) individual household incomes may be within a city.
One way to begin to disaggregate the median household income is to look at median household income by racial/ethnic group. For this study, median household income was collected for White, Black, Asian, and Hispanic residents. 2 After data were collected on median household income by race and ethnicity, variables calculating the difference between the median incomes of White and Black households, White and Hispanic households, and White and Asian households were created for each year. White was chosen as the comparison group due to its higher percentage of the total population for most cities included in the data. In addition, a fourth variable was created to represent the total gap between the racial or ethnic groups with the highest and the lowest median household incomes each year. This variable was created to account for years where the largest gap was between two non-White groups. All years of income data were adjusted for inflation to 2020 dollars to better compare changes in income across the 15-year period studied.
In addition to the median income measures, controls for population, region, a measure of the change in voter turnout, and unemployment rate were also included in the models. These variables were chosen due to their prominence in prior crime trends research. The population measure was pulled from the U.S. Census on Census years and from the ACS estimates for all other years. Region was coded based on the map created by the U.S. Census breaking the continental United States into four groups: Northeast, South, Midwest, and West.
The measure of the change in voter turnout is a time stable variable that calculates the change in the percent of the county population that voted in the U.S. Presidential Election from 2004 to 2020. First, the total number of individuals in a given county who cast ballots in the Presidential Elections of 2004 and 2020 were gathered from the Atlas of U.S. Presidential Elections via the Social Explorer website. Then, estimates from the U.S. Census and ACS for 2004 and 2020 were gathered for the number of individuals 18 years of age or older residing in the county to estimate the total possible voters. 3 The total number of votes was then divided by the total number of individuals of voting age to obtain the percent of the voting-age population who voted in each of the years. The difference between turnout in 2020 and 2004 was then calculated, with positive numbers indicating an increase in voter turnout and negative numbers indicating a decrease in voter turnout. Prior research has found evidence that over long periods of analysis, times where there was a lack of trust or a sense of government illegitimacy, levels of crime tend to be higher (LaFree, 1998, 1999; Roth, 2010). Voter turnout is used in this analysis as a proxy for government trust, with the assumption that individuals are less likely to participate in elections if they do not believe the government is legitimate.
Unemployment rates for each of the four racial and ethnic groups analyzed in this study were collected for each year in each city. Unsurprisingly, a correlation matrix found all four were moderately to highly correlated with one another. The four measures were then combined together to form an average unemployment rate across race. This was done instead of using the Census provided overall unemployment rate so as to only include the rates of the racial and ethnic groups analyzed in the median household income measures.
The primary analysis examines city-level trends over 15 years in violent crime and homicide using a series of two-level hierarchical models where time is nested within cities. This strategy allows for the analysis of both within- and between-city trends in crime rates that are the focus of the research questions driving this study (Raudenbush & Bryk, 2002). Level 1 of the models represents the within-city changes in crime rates over time. With the exception of the measure of the change in voter turnout, all variables are time varying and thus included in the first level of the model. Level 2 of the models represents the between-city variation in crime rates. Likelihood ratio tests performed on all models showed that the multilevel analysis was better suited to the data than single-level fixed effects models clustered by city.
Following prior crime trends research, time is coded from −7 to 7, with 0 representing the midpoint of the data, 2013 (Baumer et al., 1998). For the models predicting homicide, the quadratic function of time was found to best fit the trend, while the cubic function of time was found to best fit the overall trend in violent crime. All other independent variables in the model are grand mean centered (Gelman & Hill, 2006; Raudenbush & Bryk, 2002).
For all models, both random intercepts and slopes are included. The random intercept allows for cities to vary at time 0 on the crime rate. Random slopes for time allow for the effect of year (i.e., the slope of the trend line) to vary across cities. In addition, random slopes are included for the measures of the gap in median household income to capture between-city differences in the effects of income gaps.
To begin, base models are first estimated with only the time variables included in the model to establish the amount of within- and between-city variation in rates of crime. These variations are then re-examined with each successive step in the modeling to estimate how much of the variation across time and over cities is explained by the variables included in the model. The second model adds the total income gap variable and all other controls. The third, fourth, and fifth models switch the total income gap variable for the White–Black, White-Hispanic, and White-Asian income gap variables, respectively. The income gap variables are moderately to highly correlated to one another and therefore cannot all be in the same model at once.
Results
Table 1 details the descriptive statistics for the data, averaged across all 73 cities over the 15-year analysis period. The average violent crime and homicide rates per 100,000 persons were about 741 and 11, respectively. As can be seen from the standard deviations and ranges of both rates, there is quite a bit of variability in these measures across time and place. Median household income was about US$61,000, but again shows quite a large range with a minimum value of about US$28,000 and a maximum value of about US$142,000. The average income gap across all groups studied was just below US$33,000. When looking at the group comparison variables, on average White households made about US$25,000 more than Black households, about US$19,000 more than Hispanic households, and about US$1,500 less than Asian households. The majority of cities included in the analysis are either in the Western (42.5%) or Southern (37%) regions of the country. Compared with 2004, on average there was 7.5% increase in voter turnout in 2020, but this measure has quite a bit of variability, with one city experiencing a 56% decrease.
Descriptive Statistics (N = 1,095).
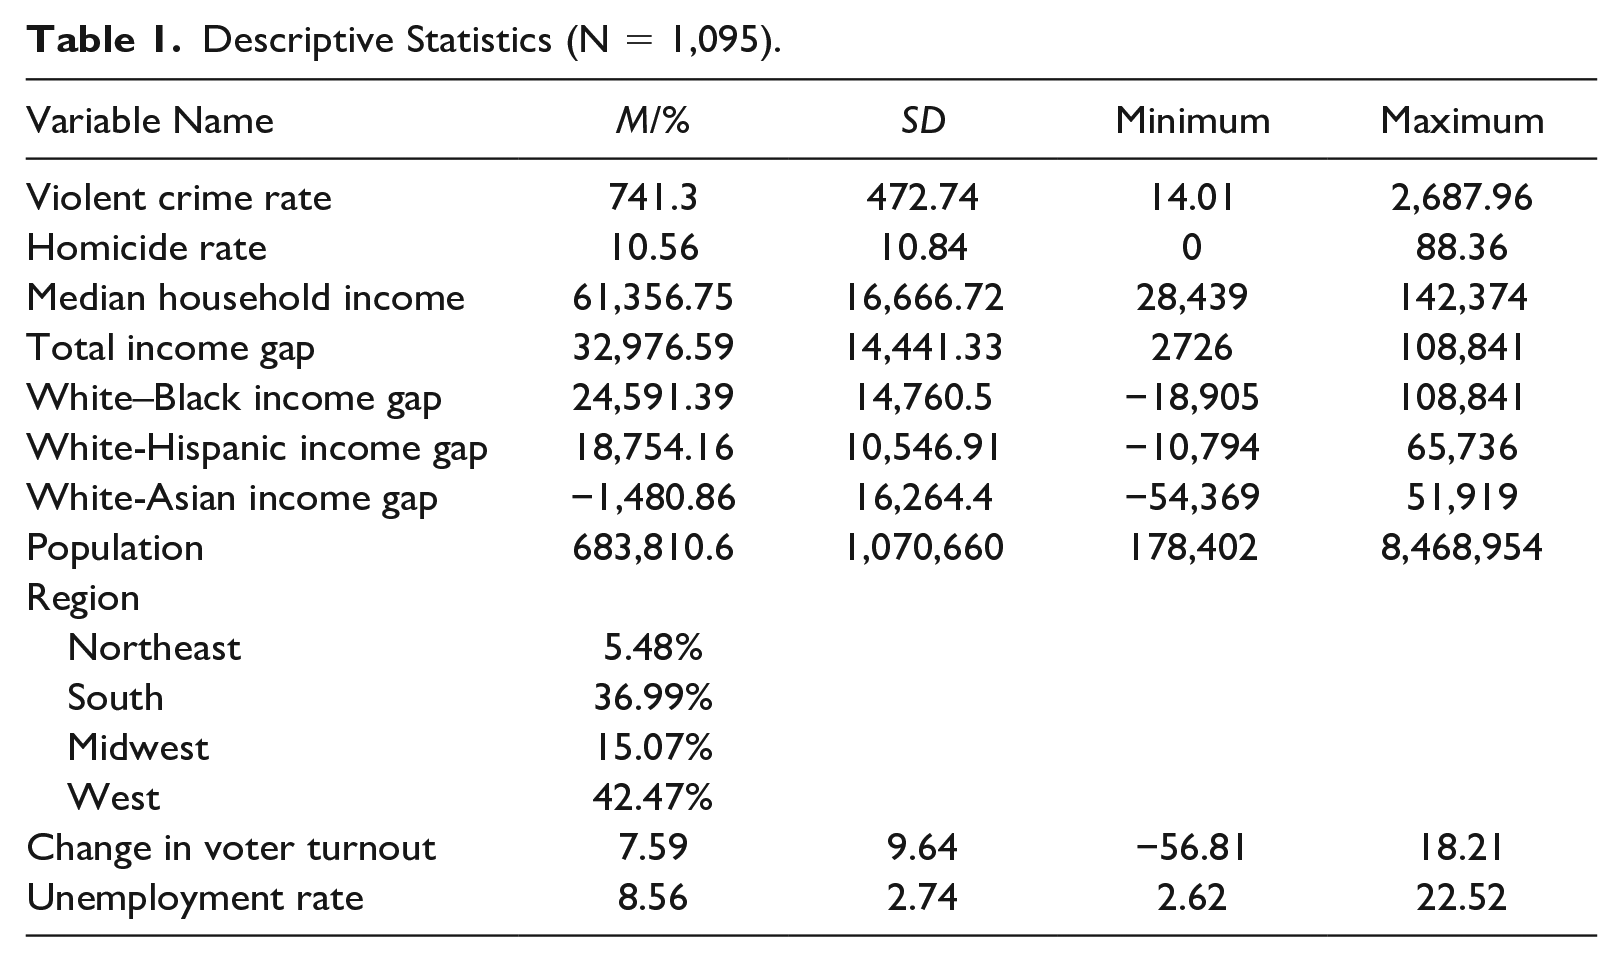
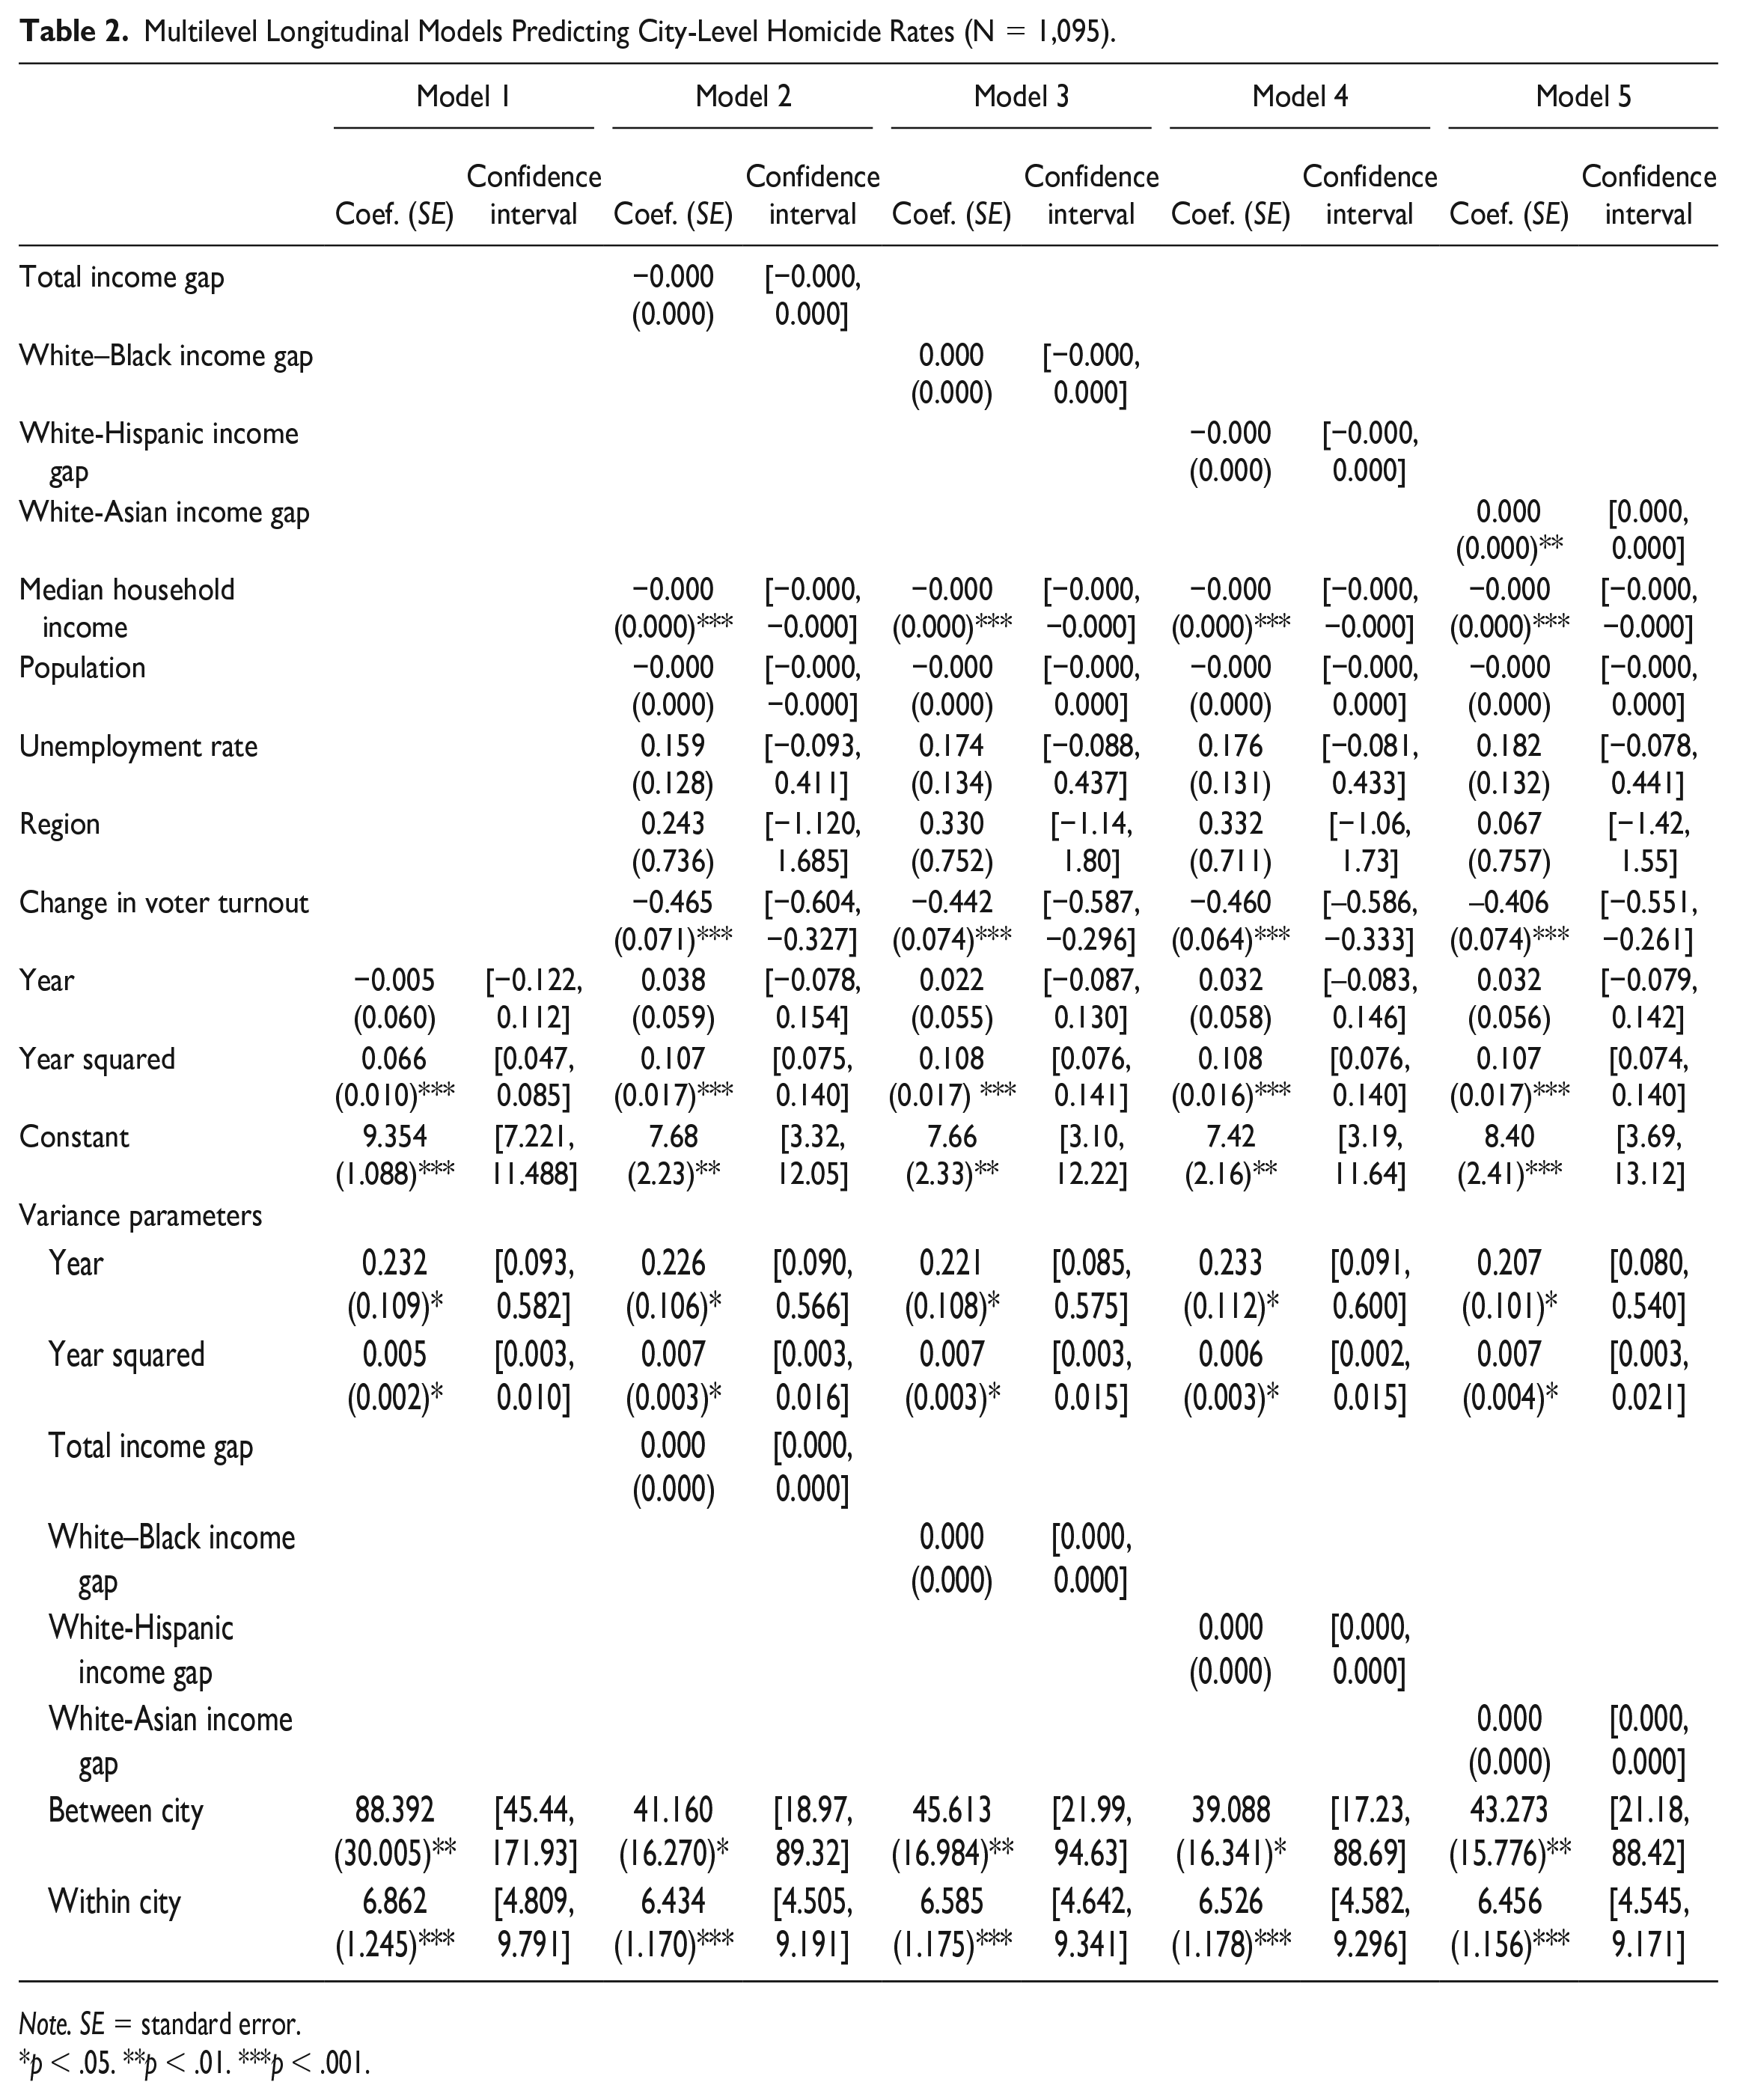
Table 2 presents the results of the models predicting homicide rate. Model 1 uses just the indicator for year to determine a baseline effect of time on homicide rate as well as a measure of the variation both within and between cities in homicide rate. The variance parameters for this model show significant variation at both the within-city (6.86, p < .001) and between-city (88.39, p < .001) levels, with the majority of the variance in homicide rate happening between cities, rather than within cities. Model 2 is a full model with all controls included and focused on total income gap as the predictor. Results from this model show that changes in the total income gap are not significantly related to within-city changes in homicide rate. Changes in median household income are significantly related to homicide, where every US$100 increase in median household income is associated with a 0.02 decrease in the homicide rate (p < .001). Only the change in voter turnout is significant among the control variables, with a unit increase in the change of turnout associated with a 0.47 (p < .001) decrease in homicide rate across cities.
Multilevel Longitudinal Models Predicting City-Level Homicide Rates (N = 1,095).
Note. SE = standard error.
p < .05. **p < .01. ***p < .001.
Examining the random slope measures, while the random slopes for the time variables are significant and indicate differences across cities, the random slope for total income gap does not seem to vary between cities in a meaningful way. This indicates that the effect of total income gap does not meaningfully vary across cities included in the analysis. The Level 1 (within-city) variance is slightly reduced in this model to 6.43 (p < .001), whereas the Level 2 (between-city) variance is substantially lowered to 41.16 (p < .05). Thus, Model 2 is able to explain about 53% of the between-city variance in homicide rates.
Model 3 switches the total income gap variable for the White–Black income gap variable to examine whether race-specific comparisons are more meaningful than a more generalized measure of the gap. Results show that White–Black income gap is also not a significant predictor of within-city changes in homicide rate. The rest of the variables in Model 3 show similar results to Model 2, with median household income and change in voter turnout showing the only significant associations. The random slope for the White–Black income gap is again similar to that of the total income gap random slope. While the confidence interval output would suggest a significant relationship, the values are far too small to have any interpretable meaning. Model 4 shows the results for the White-Hispanic income gap variable. The White-Hispanic income gap variable did not have a significant association with changes in homicide within a city, but its inclusion in the model did result in the most variance reduction of all four income gap variables. When the White-Hispanic income gap is accounted for, the between-city variance is reduced by 56%, slightly more than what was accounted for by the total income gap variable. As with the previous models, the random slope for the White-Hispanic income gap is technically significant, but not interpretable. When the White-Asian gap is introduced into Model 5, it does show a significant association with changes within a city in homicide rate, with a US$100 increase in the gap associated with about a 0.01 increase in the homicide rate (p < .01). The random slope for the White-Asian gap operates similarly to the other income gap variables.
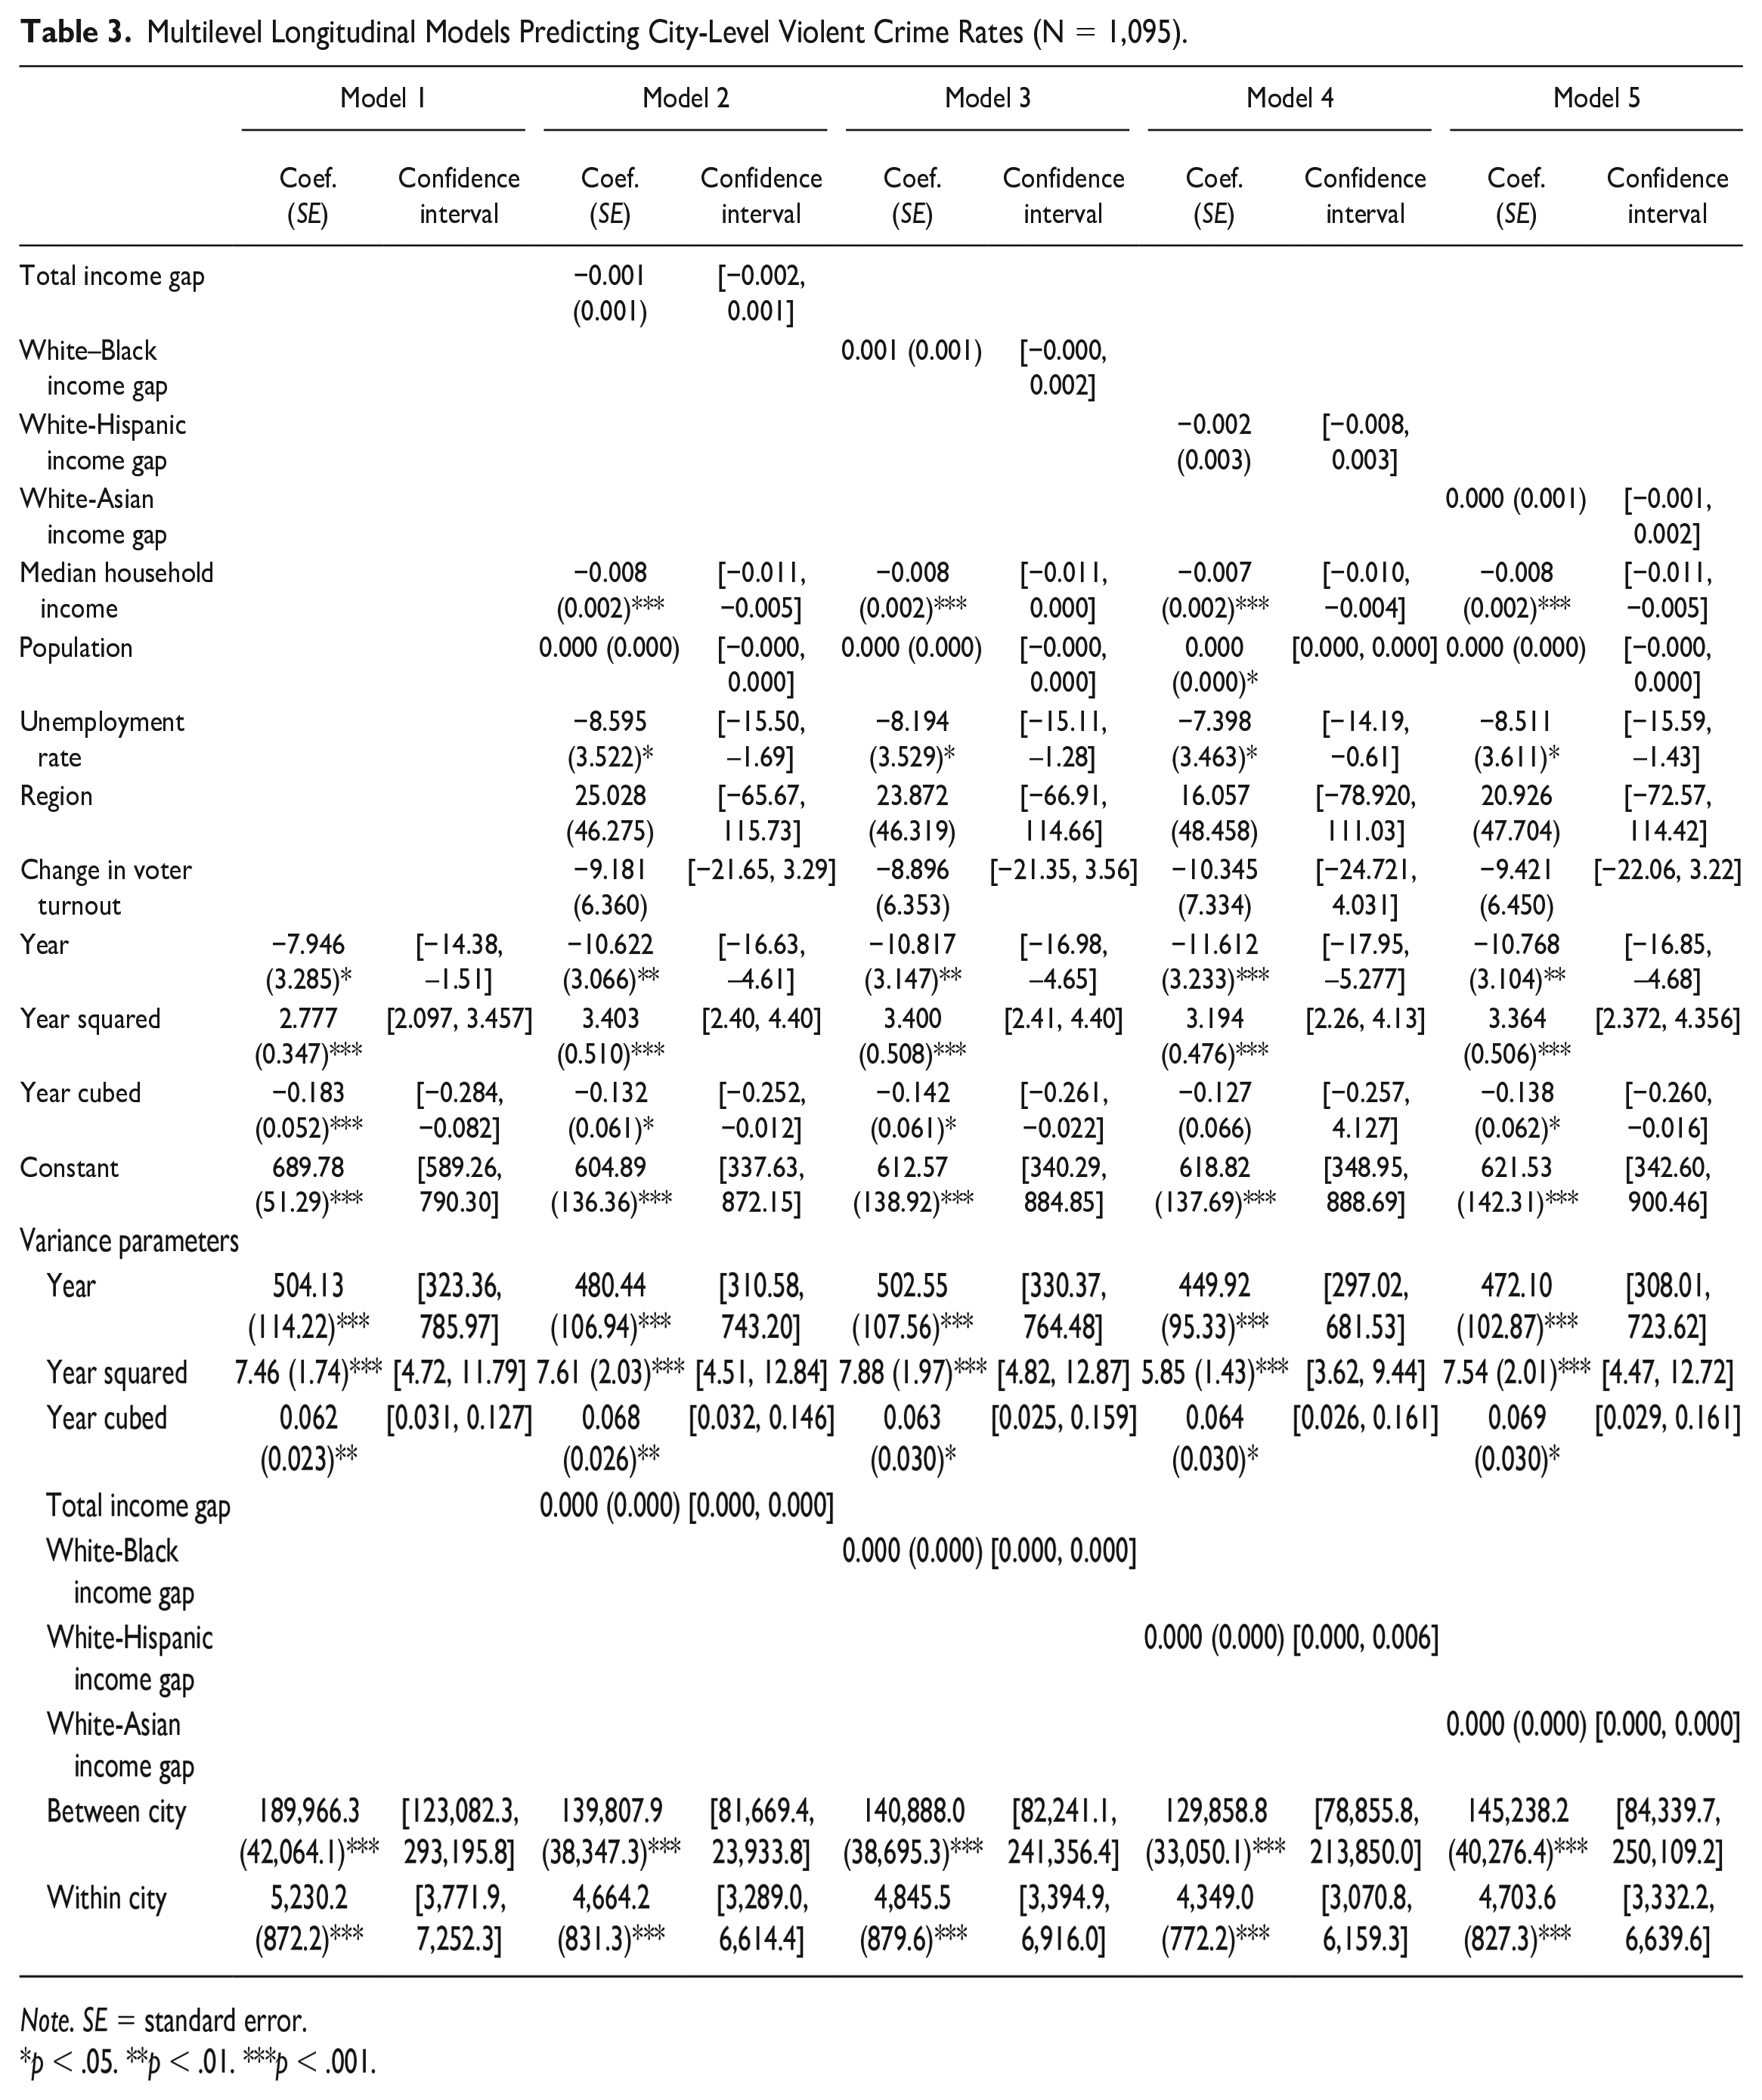
Moving to violent crime rate, Table 3 presents the results of the same three models. Model 1 presents just the variables for the year to get a sense of the overall trend. In the models for violent crime, a cubic term was found to be the best fit to the trend line. The random slope estimates for the time variables are all significant, suggesting significant differences between cities in the effect of year on homicide rate. The variance parameters show sizable and significant variation at both levels, with the within-city variance at 5,230 (p < .001) and the between-city variance at 189,966 (p < .001).
Multilevel Longitudinal Models Predicting City-Level Violent Crime Rates (N = 1,095).
Note. SE = standard error.
p < .05. **p < .01. ***p < .001.
Model 2 presents the results after total income and all other control variables are added. Total income gap is not significantly related to within-city changes in the rate of violent crime. Median household income as a small effect, with a US$100 increase in median household income reducing the violent crime rate 0.8 (p < .001). Unemployment rate is significantly related to violent crime; however, the direction of the effect is in the opposite direction than would be anticipated. This model shows that increases in the unemployment rate are associated with a decrease in violent crime. Unlike the models predicting homicide rate, change in voter turnout is not significantly related to changes in the violent crime rate. Like the Model 2 of Table 2, the random slope for total income gap does not have a meaningful interpretation. The full model reduces the between-city variance by about 26% and reduces the within-city variance by about 11%.
The third model again replaces the total income gap variable with the White–Black income gap variable. Results are similar to that of Model 2. The White–Black income gap variable is not significantly related to within-city changes in the rate of violent crime. Only median household income and unemployment show significant associations. The random slope for the White–Black income gap variable is again too small to be interpretable. Model 4 includes the White-Hispanic income gap variable, and like the models for homicide, this model again did the best at accounting for the overall variance in violent crime rates. Although it does not show a significant association with within-city levels of violent crime, it reduces the between-city variance by about 32% and the within-city variance by about 17%. In the models using the White-Asian variable, there was not a significant relationship predicting within-city levels of violent crime. While the model does explain some of the between- and within-city variance, it does not explain as much as the model using the White-Hispanic income gap measure.
Discussion
This research examines whether changes in racial and ethnic income gaps can account for within- and between-city changes in violence and homicide rates over a 15-year period. Results did not find an association between racial and ethnic income gaps and changes in crime within cities over time or between cities. While descriptive statistics showed large amounts of variation on racial and ethnic income gaps across cities, when these measures were significant (i.e., the White-Asian gap in the homicide models), the effects were modest. While prior work has shown that contact with the criminal justice system contributes to the racial wealth gap, this research did not find evidence that the existence of an income gap contributes to levels of crime. Models were able to explain sizable portions of the variation in homicide and violent crime rates both between and within cities; specifically, accounting for the White-Hispanic income gap was able to explain 56% of the variance between cities in homicide and 32% of the variance between cities and 17% of the variance within cities in violent crime. This finding may be driven by the distribution of the cities included in the data. As shown in the descriptive statistics, a little over 40% of the sample consisted of Western cities, many of which have higher Hispanic populations relative to other cities in the model. The importance of the White-Hispanic gap for explaining within-city violent crime may reflect demographic shifts in cities over time relating to immigration trends. A closer look at the changing racial and ethnic composition of city populations could be informative in further explaining these findings.
This study only examined income, which is only one part of wealth. Much of the prior research on the racial wealth gap notes that it is other factors, such as homeownership, inheritance, and other assets, that explain large amounts of the racial wealth gap. Had the current study been able to better capture wealth, rather than just income, it is possible that more significant results would have been found. In addition, it may be that the analysis was unable to capture important variation happening at the neighborhood level. Even after examining income gaps between different racial and ethnic groups, the measures included in the analysis cannot account for what that gap represents. While the gap may be widening or shrinking, it is likely important to account for what may produce that change—that is, does a change in the gap happen because one group’s income is increasing more than the other, or is it because one group experiences an actual decline in income? Accounting for these underlying factors could produce important results.
As noted, this study is limited in its measure of inequality and the wealth gap. Future research should look to include additional measures of wealth and more comprehensive calculations of inequality. It may also be useful to analyze a smaller sample of cities. Regional social and cultural differences could result in different outcomes. In addition, better understanding the racial-ethnic population changes could also prove useful, rather than just including an overall measure capturing population change. Finally, examining property and economically motivated crime rates could also provide different results than the analyses of violence. Results suggest that if relative deprivation or anomie is occurring as a result of racial inequality in cities, it does not seem to be producing more violence. However, this article is limited in that it cannot capture precisely who individuals may be comparing their income with. While large gaps in income exist across these cities, individuals may be more likely to compare themselves with their immediate neighbors, and be less aware of the financial standing of those with which they do not often interact. Here, knowing the geographic spread of income in a city could prove fruitful for future analyses.
In conclusion, racial-ethnic income gaps do not appear to be significantly related to changes in violence and homicide between and within cities. While inequality has been linked to differing levels of crime in prior research, this specific measure of income inequality was not found to be related to trends in violent crime and homicide. However, the White-Hispanic income gap was able to explain sizable portions of the between-city variation in both homicide and violence as well as the within-city differences in violent crime. This study does not lend support to the idea that the mere existence of a racial wealth gap can produce higher levels of crime; however, more comprehensive measures of wealth should be analyzed in future research.
Footnotes
Declaration of Conflicting Interests
The author(s) declared no potential conflicts of interest with respect to the research, authorship, and/or publication of this article.
Funding
The author(s) received no financial support for the research, authorship, and/or publication of this article.