
Abstract
Homicide trend research has relied heavily on the same two data systems for decades. The current article highlights the research utility of a newer database—the National Violent Death Reporting System (NVDRS)—for examining the contours of homicide change. First, we describe the history, design, and availability of the NVDRS, and review past homicide and longitudinal studies using these data. Second, we discuss two features of the data system that researchers should consider when conducting homicide trend analyses: (a) data availability and representativeness and (b) data completeness. Third, we demonstrate a strong degree of correspondence between NVDRS homicide victimization trends and trends from other data systems. Fourth, we illustrate the ways in which the NVDRS can enrich our understanding of homicide trends by examining how homicide characteristics changed during the two recent homicide spikes from 2014 to 2016 and 2019 to 2020.
Criminologists have devoted extensive empirical attention to contemporary homicide trends. Considerable insights about the contours of homicide have been provided by studies describing the prolonged boom during the 1960s and 1970s (LaFree, 1998, 1999), the concentrated surge during the crack cocaine era (Blumstein et al., 2000; Cook & Laub, 1998), and the long-run downward trajectory in the 1990s (Blumstein & Wallman, 2000; Zimring, 2007). Scholarly interest in trend analyses has once again been reignited by recent unexpected homicide spikes (Rosenfeld, 2018). The abrupt 20% increase in homicide victimization rates from 2014 to 2016, for instance, motivated a special issue on its descriptive dimensions and potential sources (Rosenfeld, 2019). The approximate 30% increase in homicide victimization from 2019 to 2020 has garnered even greater attention (Gramlich, 2021; Kegler, 2022; Rosenfeld, Boxerman, et al., 2023). Meaningful documentation of such homicide trends is a foundational first step toward evaluating explanations for emerging patterns and developing short-term forecasts of future change (Baumer et al., 2018).
Descriptive inquiries into homicide trends, however, are limited by gaps in the current national-level data infrastructure (Baumer et al., 2018; Tostlebe et al., 2021). The vast majority of studies have relied on two sources of aggregate-level data to study homicide change in the United States: (a) the National Center for Health Statistics’s (NCHS) National Vital Statistics System (NVSS) and (b) the Federal Bureau of Investigation’s (FBI) Supplementary Homicide Reports (SHR) (Regoeczi & Banks, 2014). Although the NVSS and SHR have yielded tremendous knowledge about homicide trends, their limited number of variables leave much to be understood about homicide over time and across groups (Baumer et al., 2018). Descriptive questions of homicide change have been largely restricted to examinations of victim and suspect demographics (e.g., sex, race, and age) and firearm use (Berg, 2019; Rosenfeld & Fox, 2019). Identifying data collection systems that improve our capacity to document changes in the nature of homicide should be a priority of homicide trend researchers.
The National Violent Death Reporting System (NVDRS) offers opportunities for more rigorous inquiries into homicide trends. The NVDRS is a state-based surveillance system that collects information on all violent deaths, including homicide. Drawing from law enforcement and medical examiner reports, death certificates, and toxicology reports, abstractors collect extensive information about homicide victims, their suspects, and the circumstances that precipitated the incidents. Yet, to date, this database has been underutilized by criminologists (Sanchez et al., 2022, p. 72). While NVDRS research has increased markedly in the past decade, just a quarter of these studies have focused on homicide (Nazarov et al., 2019). Even fewer studies—we could find just three—have studied homicide trends.
In the current article, we discuss the research utility of the NVDRS for understanding homicide trends. First, we review the background of the NVDRS. We provide a brief history of the data system and summarize past research using these data for homicide and longitudinal analyses. Second, we highlight two important considerations when using the database for trend analyses: (a) data availability and representativeness and (b) data completeness. Third, we examine the extent to which NVDRS homicide victimization trends correspond with NVSS and SHR trends. We compare rates over time, as well as examine recent homicide spikes across victim demographic groups. Fourth, we illustrate how the NVDRS enriches our understanding of homicide trends beyond what we learn from other data sources. To do so, we examine how the characteristics of homicide victims, locations, suspects, weapons, and circumstances have changed during the two most recent homicide spikes. We end with a brief discussion about our findings and highlight areas for future homicide trend research.
Background
History, Design, and Availability of the NVDRS
In the late 1980s and 1990s, public health researchers and policymakers cautioned that violence prevention efforts were hindered by a lack of surveillance data that monitor the circumstances surrounding lethal violence (Steenkamp et al., 2006). In response, after years of planning and pilot work, Congress approved funding in 2002 for the implementation of the NVDRS (Blair et al., 2016; Paulozzi et al., 2004). The primary goal was to provide timely high-quality data that described the victims, perpetrators, and incidents of lethal violence (Paulozzi et al., 2004). The first six states awarded funding were Maryland, Massachusetts, New Jersey, Oregon, South Carolina, and Virginia. By 2018, all 50 states, the District of Columbia, and Puerto Rico received funding from Congress to implement Violent Death Reporting Systems.
NVDRS definitions and design are described in extensive detail in multiple published reports (Blair et al., 2016; Paulozzi et al., 2004; Steenkamp et al., 2006). Briefly, the NVDRS is coordinated and funded at the federal level, but each individual state system is responsible for collecting, linking, and storing case data (Blair et al., 2016). Cases include homicides, as well as suicides, deaths from legal intervention, deaths of undetermined intent and unintentional firearm fatalities. Once a violent death is identified, data abstractors record information about the incident following standards outlined in the NVDRS coding manual (Centers for Disease Control and Prevention [CDC], 2021). Abstractors draw from multiple sources, including death certificates, coroner or medical examiner records, and police reports. Optional data sources can also include the SHR, emergency department and hospital data, and child fatality review team data (Steenkamp et al., 2006).
Through the use of a variety of data sources, the NVDRS provides “rich circumstantial information on firearm and other violent deaths” (Hemenway & Nelson, 2020, p. 30). Indeed, for a single death, the system has the capability to record data on more than 600 variables (Blair et al., 2016). The incident-based system collects information on victims, alleged or suspected perpetrators, and case circumstances that far exceed the level of detail provided in other leading data systems. For instance, victim characteristics in the NVSS and SHR are restricted to basic demographics, such as sex, race, and age. The NVDRS also includes the victim’s marital status, relationship status, sexual orientation, gender identity, pregnancy status, military status, education level, occupation, and homeless status. Similarly, while the SHR provides demographic information on suspected perpetrators and the relationship between victim and perpetrator, the NVDRS variables are far more comprehensive and contain fewer missing values (Shields & Ward, 2008). Furthermore, the NVDRS includes detailed information about the specific circumstances that are perceived as being related to the death, including mental health and substance use problems, criminal activity, and relationship problems (e.g., intimate partner violence). Weapon variables include weapon number and type; firearm type, caliber, gauge, make, and model; and firearm ownership. Also recorded are victim toxicology reports indicating the number and type of substances detected.
Researchers interested in the NVDRS can access these data via two primary routes. Aggregated NVDRS data by year and state are publicly available through the online WISQARS tool: https://wisqars.cdc.gov/nvdrs/. These data can be disaggregated by cause or mechanism; victim age, sex, race, and ethnicity; place of injury; relationship of victim to suspect; and victims’ pregnancy, homeless, and military status. If additional detail and circumstance information is required, eligible researchers can request the Restricted Access Data (RAD) by submitting a proposal package to the CDC (for eligibility and proposal instructions, see https://www.cdc.gov/violenceprevention/datasources/nvdrs/dataaccess.html).
NVDRS Homicide and Longitudinal Research
In the past several years, there has been a considerable growth in the use of the NVDRS for homicide research (Nazarov et al., 2019). Epidemiological analyses illustrate how this new database can build an understanding of homicide that is unavailable in other homicide data sets (Sheats, 2022). Findings reveal detailed patterns in the methods, suspect information, and precipitating factors of homicide victimizations among children (Hunter et al., 2023; Wilson et al., 2022); individuals aged 60 years and older (Shawon et al., 2021); American Indians and Alaska Natives (Petrosky, 2021); and victims born outside the United States (Abolarin et al., 2023). Other epidemiological works provide comprehensive descriptions of suspected perpetrators. Using 2005–2012 data, Hemenway and Solnick (2017) classified the common events surrounding homicide perpetration by children. Frankenfeld and Leslie (2021) described the most common circumstances in which suspected perpetrators’ race and ethnicity are discordant with their victims. Researchers have also given thorough accounts of specific forms of homicide, including intimate partner homicide (Smith et al., 2014), homicide-suicide incidents (Jordan & McNiel, 2021), mass victim homicide (Fowler et al., 2021), and gang homicide (Frazier et al., 2017). Cross-sectional policy research has also used the NVDRS to examine the associations between homicide rates and policy environments, such as restrictive alcohol policies (Lira et al., 2019), availability of rental housing (Austin et al., 2022), and firearm access (Rochford et al., 2022; Stansfield & Semenza, 2019).
While cross-sectional NVDRS research has increased rapidly, there are currently only a handful of longitudinal studies investigating change in violent deaths over time. Of the 150 NVDRS studies published between 2003 and 2018, less than 5% included trend analyses (Nazarov et al., 2019). Most of these trend studies have focused on suicide, such as changes in the method of suicide (Hanlon et al., 2019; Yau & Paschall, 2018) and changes in suicide circumstances (Fowler et al., 2015; Lange et al., 2022). In fact, we could identify just three studies that used NVDRS data to investigate homicides over time. Using data from 2005 to 2017, Lemke and colleagues (2022) examined trends in homicide victimization rates by victim gender, victim age, and the rural–urban classification of the county of injury. Consistent with prior research (Rogers et al., 2023; Rosenfeld & Fox, 2019), the authors found that increases in homicide victimization rates in the mid-2010s were more pronounced in rural and large metropolitan areas than small metropolitan and micropolitan areas. Nazarov and Li (2020) used toxicology data to examine the trends in alcohol and marijuana detection in homicide victims. Among victims with toxicological testing, results showed a near doubling in the detection of marijuana from 2004 to 2016, whereas the presence of alcohol declined during that same period. Mowbray and Fatehi (2021) examined trends in opioid-related homicides using data from all 32 reporting states from 2003 to 2016. They found an increasing trend in the presence of opioids in homicide victims. Given the scant research to date, there are numerous opportunities for homicide trend analyses using the NVDRS. Researchers should be aware of several data considerations, however, before turning to such projects.
Data Considerations
Data Availability and Representativeness
U.S. states and jurisdictions were incrementally added to the NVDRS. As shown in Figure 1, just seven states provided data in 2003. An additional six states provided data in 2004 and three more in 2005. By 2015, 27 states were providing violent death data and, over the past 5 years, nearly all remaining states have been included. This incremental availability of data should be carefully considered, as tracking change over time requires a stable set of jurisdictions. Otherwise, identified trends may be a function of the addition of states rather than any real change over time. In other words, geographic differences in homicide rates and homicide circumstances might account for patterns that appear to be due to temporal changes. As such, researchers must be sure to select a sample of states that provide data for each year of the study period of interest. For instance, those interested in examining trends over multiple years often select the 16 states that provide data since 2005 (Lemke et al., 2022; Yau & Paschall, 2018). Alternatively, researchers interested in changes during a narrower, more recent timeframe may select a larger number of states. Researchers of the homicide spike from 2014 to 2016 might select the 18 states providing data during that time, while researchers of the 2019 to 2020 homicide spike could analyze lethal victimizations in 42 states and the District of Columbia.
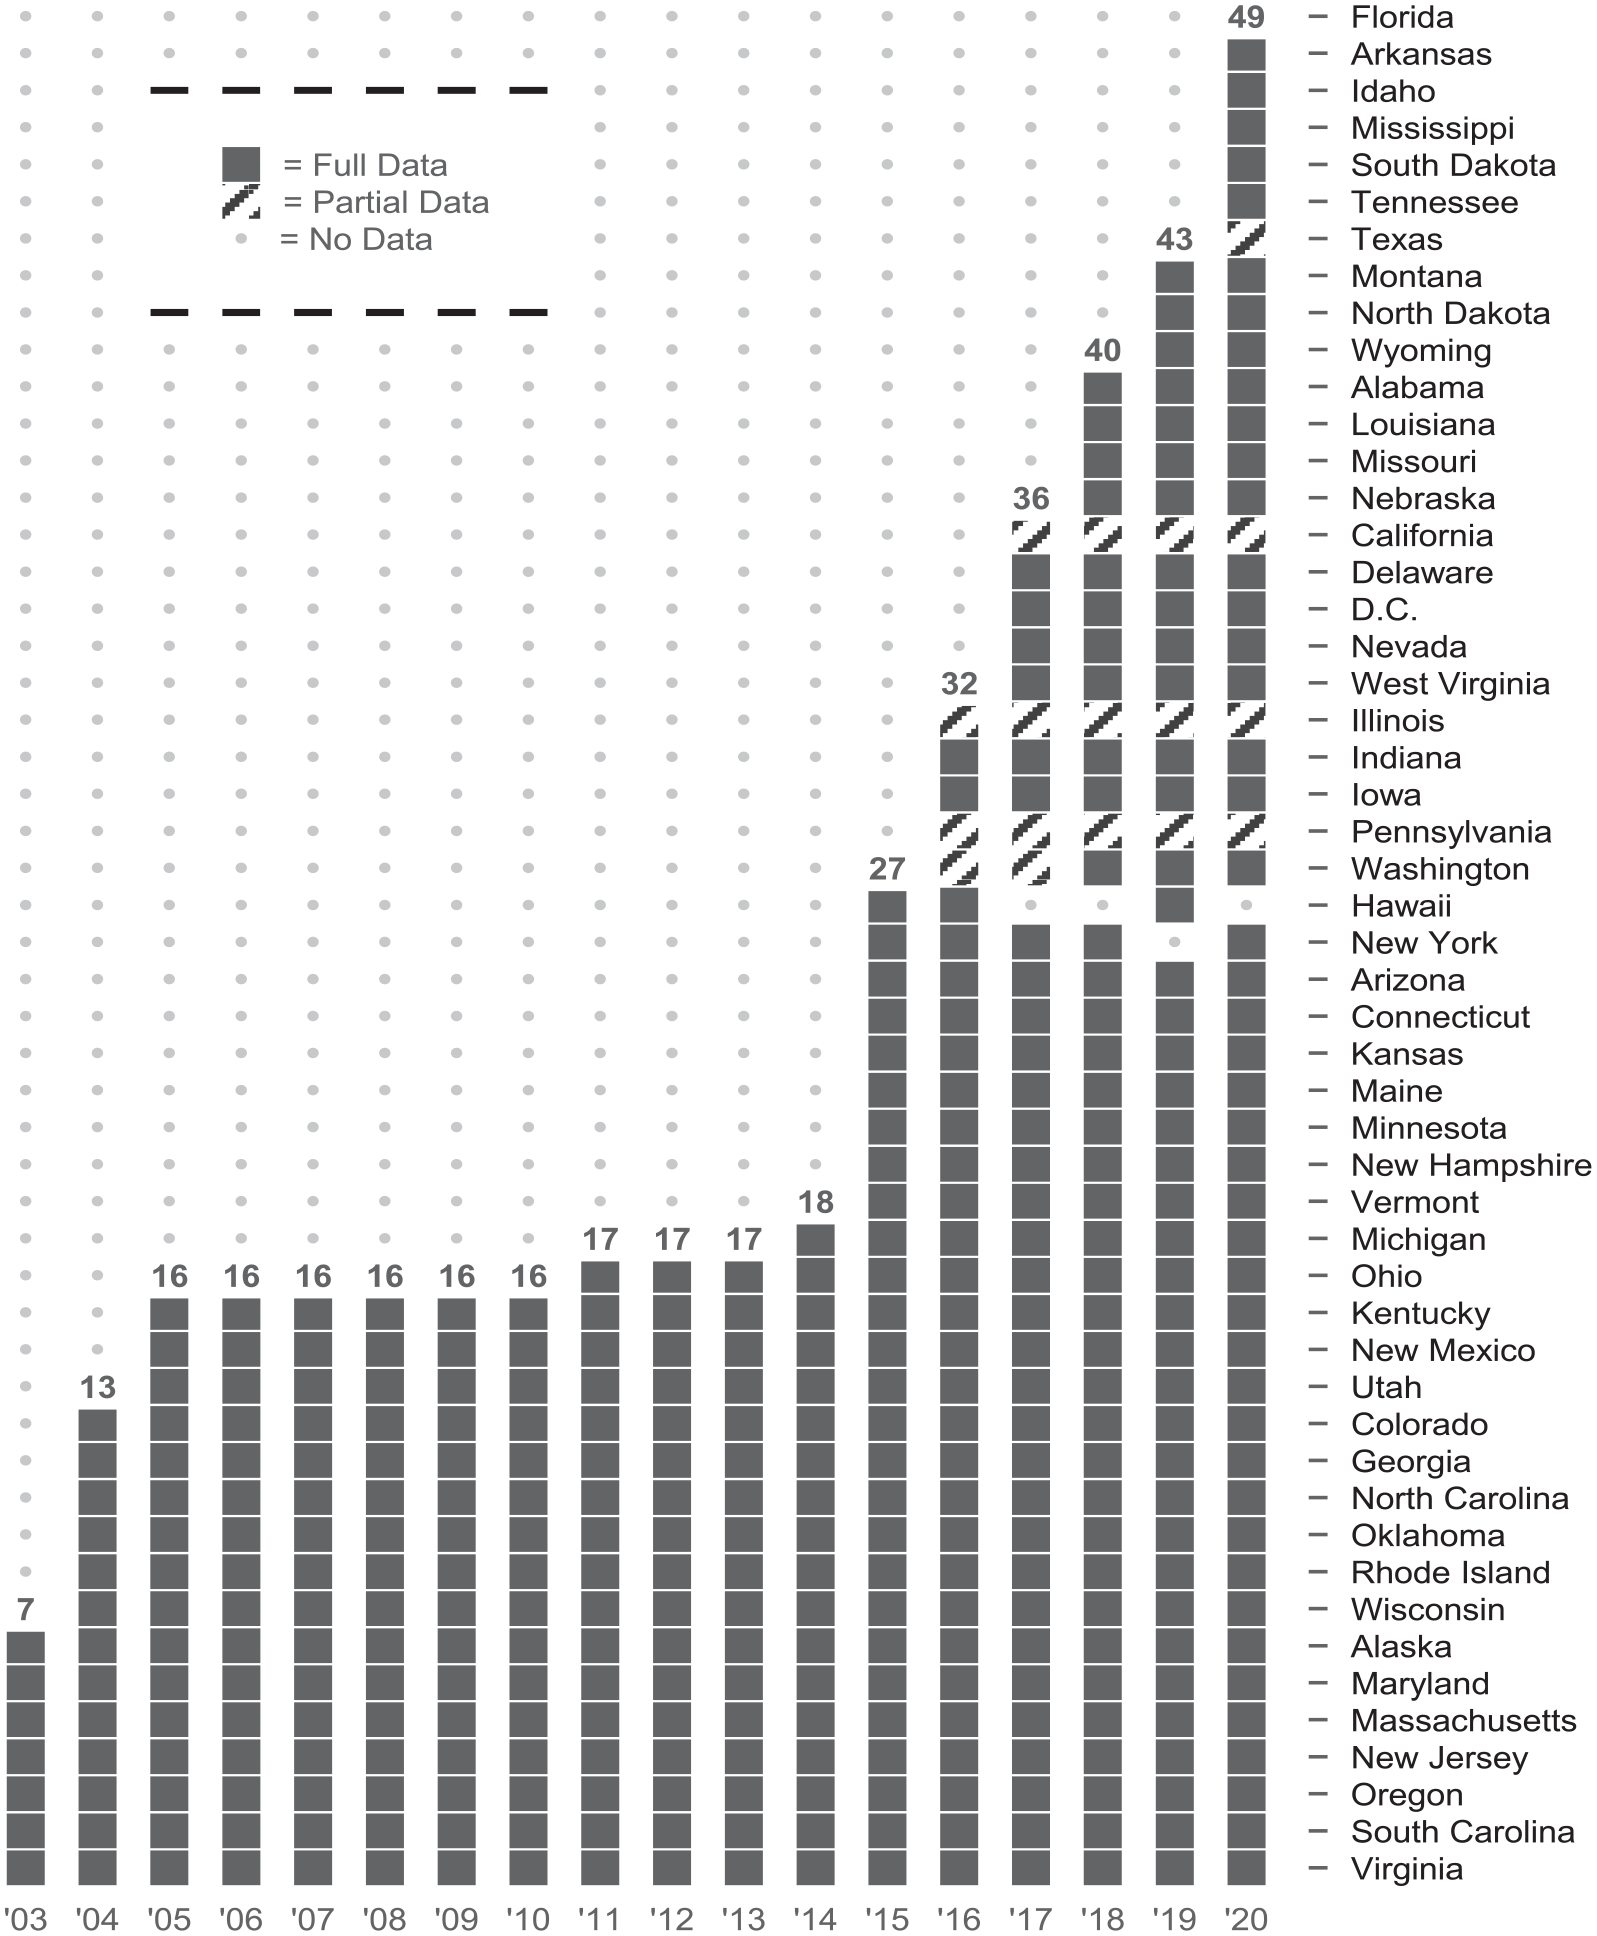
NVDRS Data Coverage by Jurisdiction (States and District of Columbia) and Year.
After selecting states for analyses, researchers should provide readers an understanding of the representativeness of the state sample. Studies using a small number of states may not be generalizable to the nation (Nazarov & Li, 2020). For instance, the initial seven states providing data in 2003 cover just 12% of the U.S. population and approximately one in 10 homicides reported by the NVSS in the same year. While generalizability of the NVDRS will be a concern for the foreseeable future, trend analyses using more recent years will be increasingly representative. The 16 states usable for 2005 to 2020 trend analyses represent over a quarter of the U.S. population; the 18 states usable for 2014 to 2020 analyses represent a third of the U.S. population; and the 43 jurisdictions usable for 2019 to 2020 analyses represent roughly two thirds of the U.S. population.
Data Completeness
Data completeness should also be carefully considered before beginning an NVDRS homicide trend analysis. The NVDRS reduces missing data through its use of multiple data sources (Shields & Ward, 2008); however, concerns about data completeness remain. First, some variables have a particularly large amount of missing data, including firearm characteristics and victim sexual orientation and gender identity (CDC, 2021; Mays & Cochran, 2019). For instance, our own analyses of the data suggest that firearm ownership and storage characteristics are missing in more than 90% of firearm-related homicides. Second, suspect characteristics are often missing in part due to low clearance rates (AbiNader et al., 2023). Third, for toxicology reports, not all coroner or medical examiner offices routinely test homicide victims (Blair et al., 2016). This limitation is particularly notable for trend analyses—changes in the frequency and accuracy of testing over time may in part explain changes in detection (Nazarov & Li, 2020). Fourth, the circumstance variables are coded as either “present” or “not present/not available/unknown” (CDC, 2021). As such, researchers cannot disentangle system missing and unknowns from true negatives. Increases in the presence of circumstances therefore may be in part due to improvements in the thoroughness of data abstraction over time. To address this issue, the CDC recommends that research on homicide circumstances limit the sample to only deaths that include at least one known circumstance (CDC, 2021). Together, these limitations in part undercut the potential contributions of the NVDRS for improving our understanding of homicide and homicide change. Still, the added detail surrounding homicide incidents offers considerable promise for trend analyses. We review that promise in the remainder of this article.
Homicide Trend Comparisons
In this section, we examine the extent to which NVDRS homicide victimization trends correspond with trends from other databases. If NVDRS trends closely correspond with other data systems, then researchers can be more confident that NVDRS findings are generalizable to the national level. We begin with a graphical depiction of homicide victimization trends using four state samples from the NVDRS (see Figure 2): (a) all states available from 2003 to 2020 regardless of entry year, (b) seven states providing data each year from 2003 to 2020, (c) 16 states providing data each year from 2005 to 2020, and (d) 18 states providing data each year from 2014 to 2020. We computed homicide victimization counts from the NVDRS RAD file and converted the counts to rates using census population denominators provided by the NVDRS online tool. For comparison, in each panel, we display homicide victimization trends using data from the NVSS (dashed gray line) and SHR (solid gray line). NVSS homicide victimization counts were collected from the online WISQARS Fatal and Nonfatal Injury Reports and SHR homicide victimization counts were collected from the online Easy Access to the FBI’s SHR: 1980–2020 (Puzzanchera et al., 2023). To convert the NVSS and SHR counts to rates, we used census population estimates provided by the online WISQARS Fatal and Nonfatal Injury Reports. In Table 1, we report bivariate detrended correlations to identify the correspondence between the NVDRS, NVSS, and SHR homicide victimization trends. We converted each series to first differences to remove the common time trend and then estimated the bivariate correlations (see Berg, 2019).
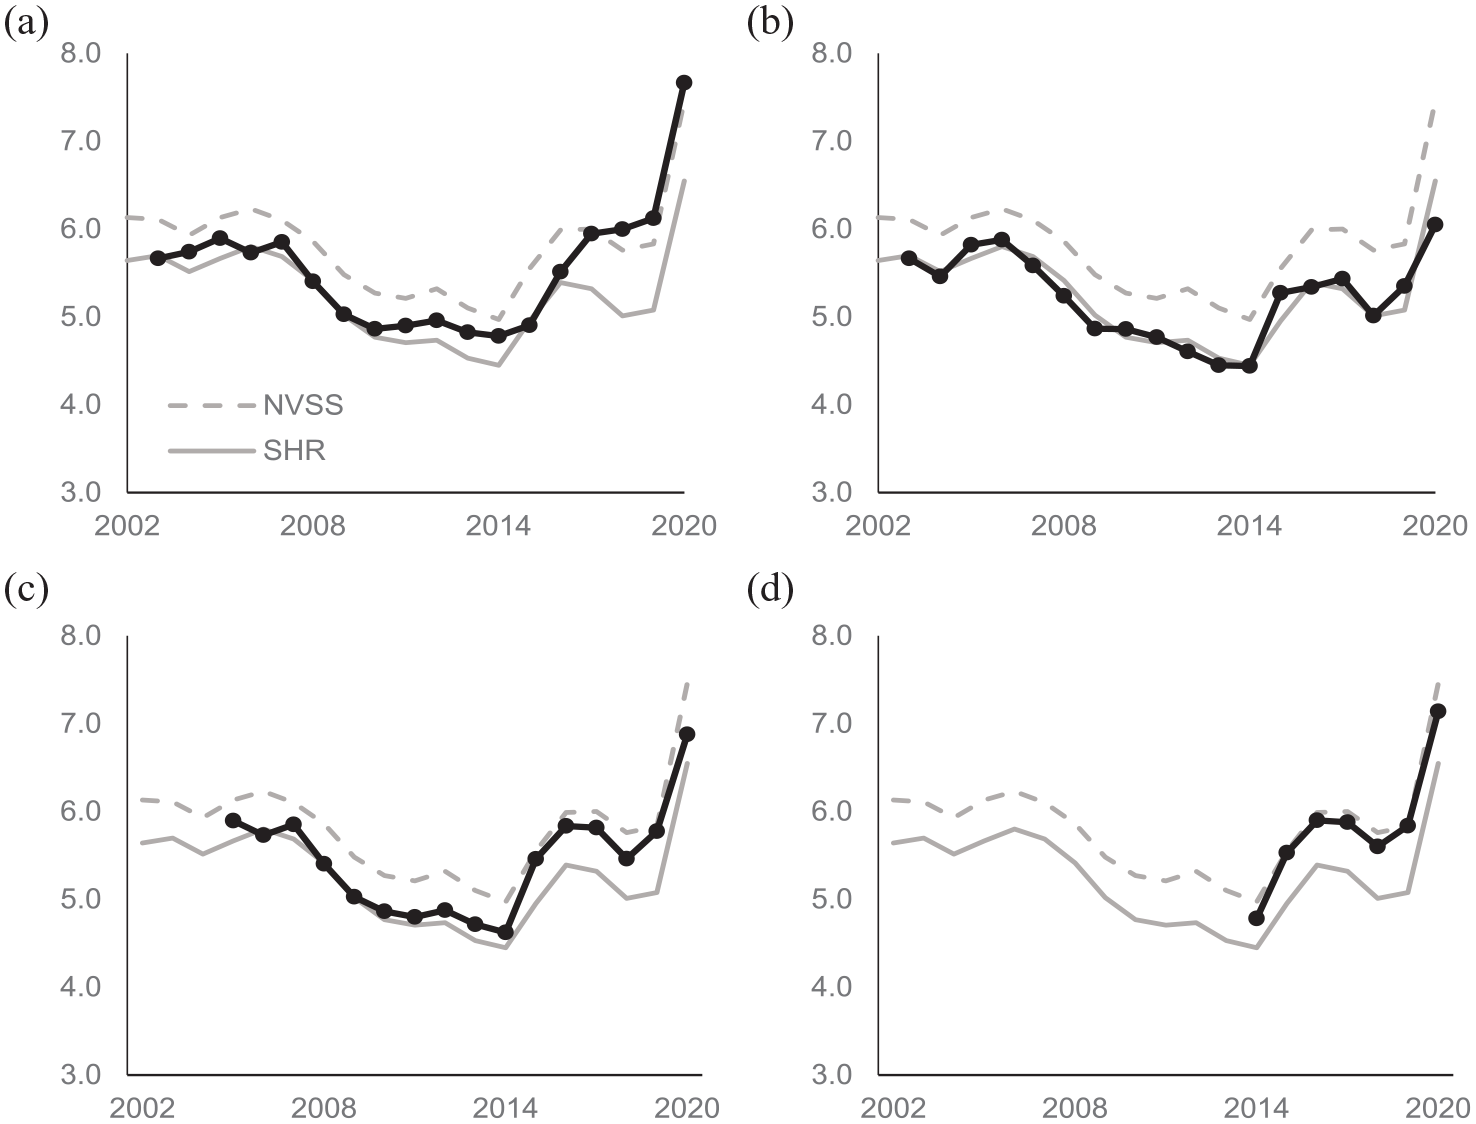
Homicide Victimization Rates per 100,000 by NVDRS Sample.
First-Differenced (Detrended) Correlations Between Homicide Victimization Rates.
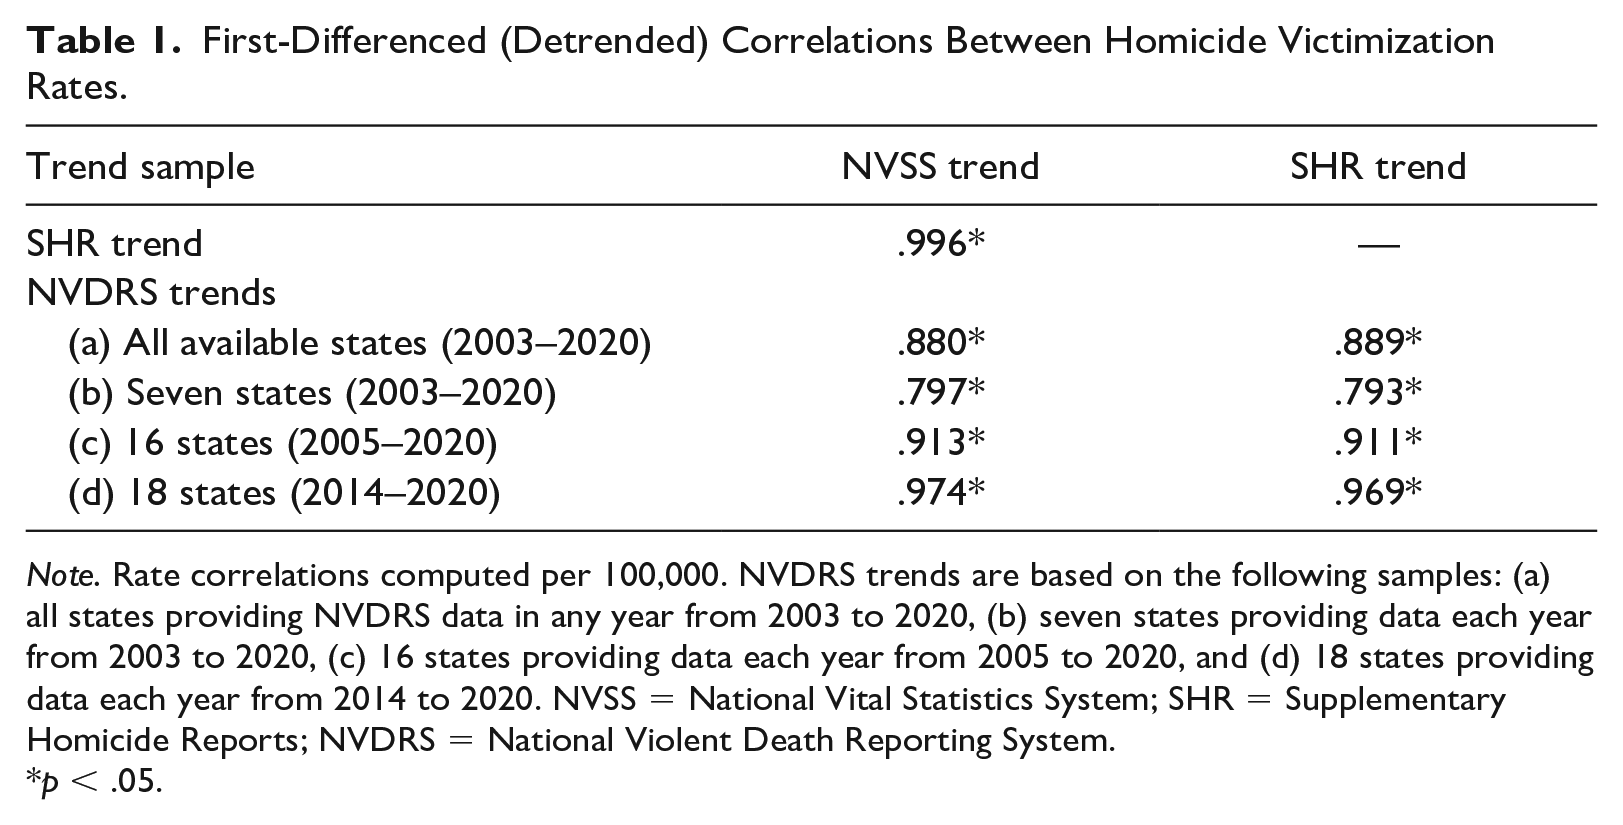
Note. Rate correlations computed per 100,000. NVDRS trends are based on the following samples: (a) all states providing NVDRS data in any year from 2003 to 2020, (b) seven states providing data each year from 2003 to 2020, (c) 16 states providing data each year from 2005 to 2020, and (d) 18 states providing data each year from 2014 to 2020. NVSS = National Vital Statistics System; SHR = Supplementary Homicide Reports; NVDRS = National Violent Death Reporting System.
p < .05.
Figure 2 illustrates why researchers should select a stable set of jurisdictions when conducting trend analyses (see “Data Considerations”). When using all states available (Panel a), homicide victimization rates steadily increase from 2014 to 2020, while the NVSS and SHR trends show a clear decrease or stabilization in homicide victimization rates from 2016 to 2019. The exaggerated increase in homicide victimization rates in Panel a is likely due to the addition of states with higher victimization rates during this period. For instance, Louisiana, Alabama, and Missouri began providing data in 2018. At that time, these three states had the second, third, and fourth highest homicide victimization rates, respectively. The first-differenced correlations in Table 1 indicate that the trend using all available states is correlated with NVSS and SHR trends at .880 and .889, respectively. For comparison, the NVSS and SHR trends are correlated with each other at .996 (p < .05). The trend using the initial seven states (Panel b) is correlated with NVSS and SHR trends at .797 (p < .05). As such, we caution against both the use of the entire sample of NVDRS states as well as the initial seven states when conducting homicide victimization trend analyses. Instead, we recommend using the sample of 16 states providing data from 2005 to 2020 (Panel c of Figure 2). When compared with NVSS and SHR trends, the trend in homicide victimization rates more closely follows the gradual decline from 2006, the spike from 2014 to 2016, and the spike from 2019 to 2020. In addition, the first-differenced correlations between the NVDRS 16 state trend and the NVSS and SHR trends are strong (.913 and .911, respectively). Researchers interested in analyzing the recent spikes in homicide victimization could use the 18 states providing data from 2014 to 2020 (panel d of Figure 2), as these trends are strongly correlated with the NVSS and SHR trends (.974 and .969, respectively).
Next, we compare the magnitude of recent homicide spikes when using NVDRS and NVSS homicide victimization rates. We disaggregate by victim demographics to identify whether conclusions about changes in homicide burden are consistent across data sets. For the NVDRS homicide victimization rates, we include only states that reported deaths in both years of the two spikes: (a) 18 states reported 5,094 homicide victimizations in 2014 and 6,363 deaths in 2016, and (b) 41 states and DC reported 12,948 and 16,882 victimizations in 2019 and 2020, respectively. The results suggest that spikes in homicide victimization rates are similar across databases (see Figure 3). From 2014 to 2016, the total homicide victimization rate increased by 23.4% when using the NVDRS (Panel a) and 20.7% when using the NVSS (Panel b). The rate increased from 2019 to 2020 by 25.0% and 27.9%, respectively (Panels c and d). In addition, with few exceptions, the NVDRS and NVSS homicide victimization spikes are similar across victim sex, victim race, and victim age. For instance, from 2019 to 2020, NVDRS and NVSS Black, non-Hispanic homicide victimization rates increased by 32.8% and 34.6%, respectively. Together, our results suggest that if researchers select a stable set of jurisdictions, the NVDRS homicide victimization trends from 2005 to 2020 closely correspond with nationally representative data sets. Moreover, the NVDRS data reveal similar patterns in recent homicide spikes across victim demographics.
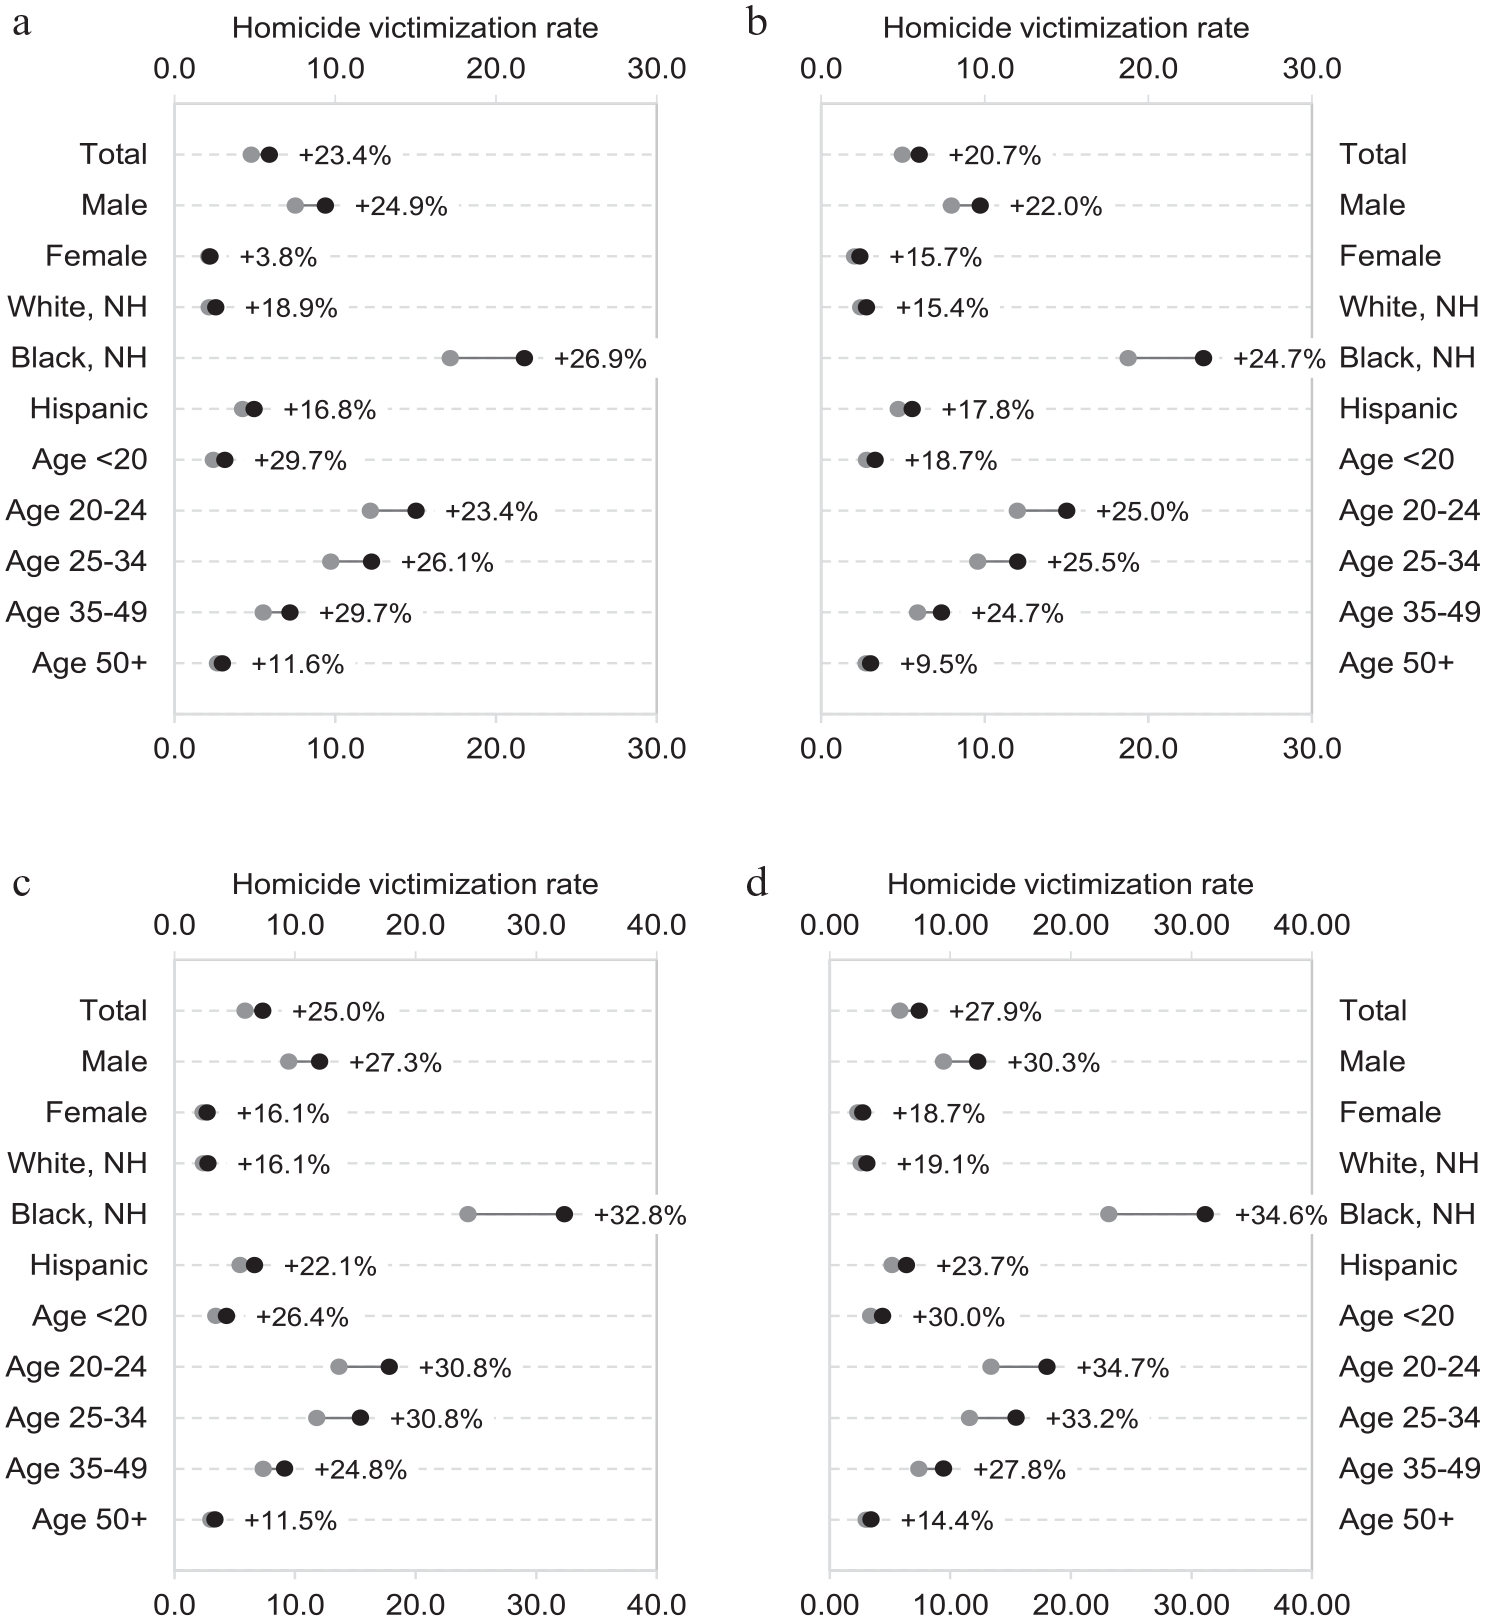
Percent Increases in Homicide Victimization Rates per 100,000 From 2014 to 2016 (Panels a and b) and From 2019 to 2020 (Panels c and d), by Victim Demographics.
Detailed Description of Homicide Spikes
Given that the NVDRS provides a nationally representative picture of recent homicide spikes, we can now turn to a more detailed investigation. Using variables that are either unavailable or limited in other data systems, we examine how homicide characteristics change during the two recent homicide spikes: 2014 to 2016 and 2019 to 2020. In Table 2, we describe the proportion of deaths in the four study years across victims’ educational level, marital status, military status, and homeless status; injury location; number, sex, and age of suspects; and primary weapon and firearm types. Chi-square tests were used to compare characteristics across the included study years, and missing values were listwise deleted from the analyses. In Table 3, we compare homicide circumstances in the domains of (a) mental health and substance use, (b) crime and community violence, and (c) interpersonal and relationship problems. Logistic regression was used to calculate odds ratios with 95% confidence intervals (CIs) and compare circumstances in the high homicide rate years and preceding reference period. As recommended by the NVDRS user manual, only records for which at least one circumstance was known were included in the analysis. Data analysis was generated using SAS software. Copyright © 2016 SAS Institute Inc. SAS and all other SAS Institute Inc. product or service names are registered trademarks or trademarks of SAS Institute Inc. Cary, NC, USA.
Victim, Location, Suspect, and Weapon Characteristics by Year.
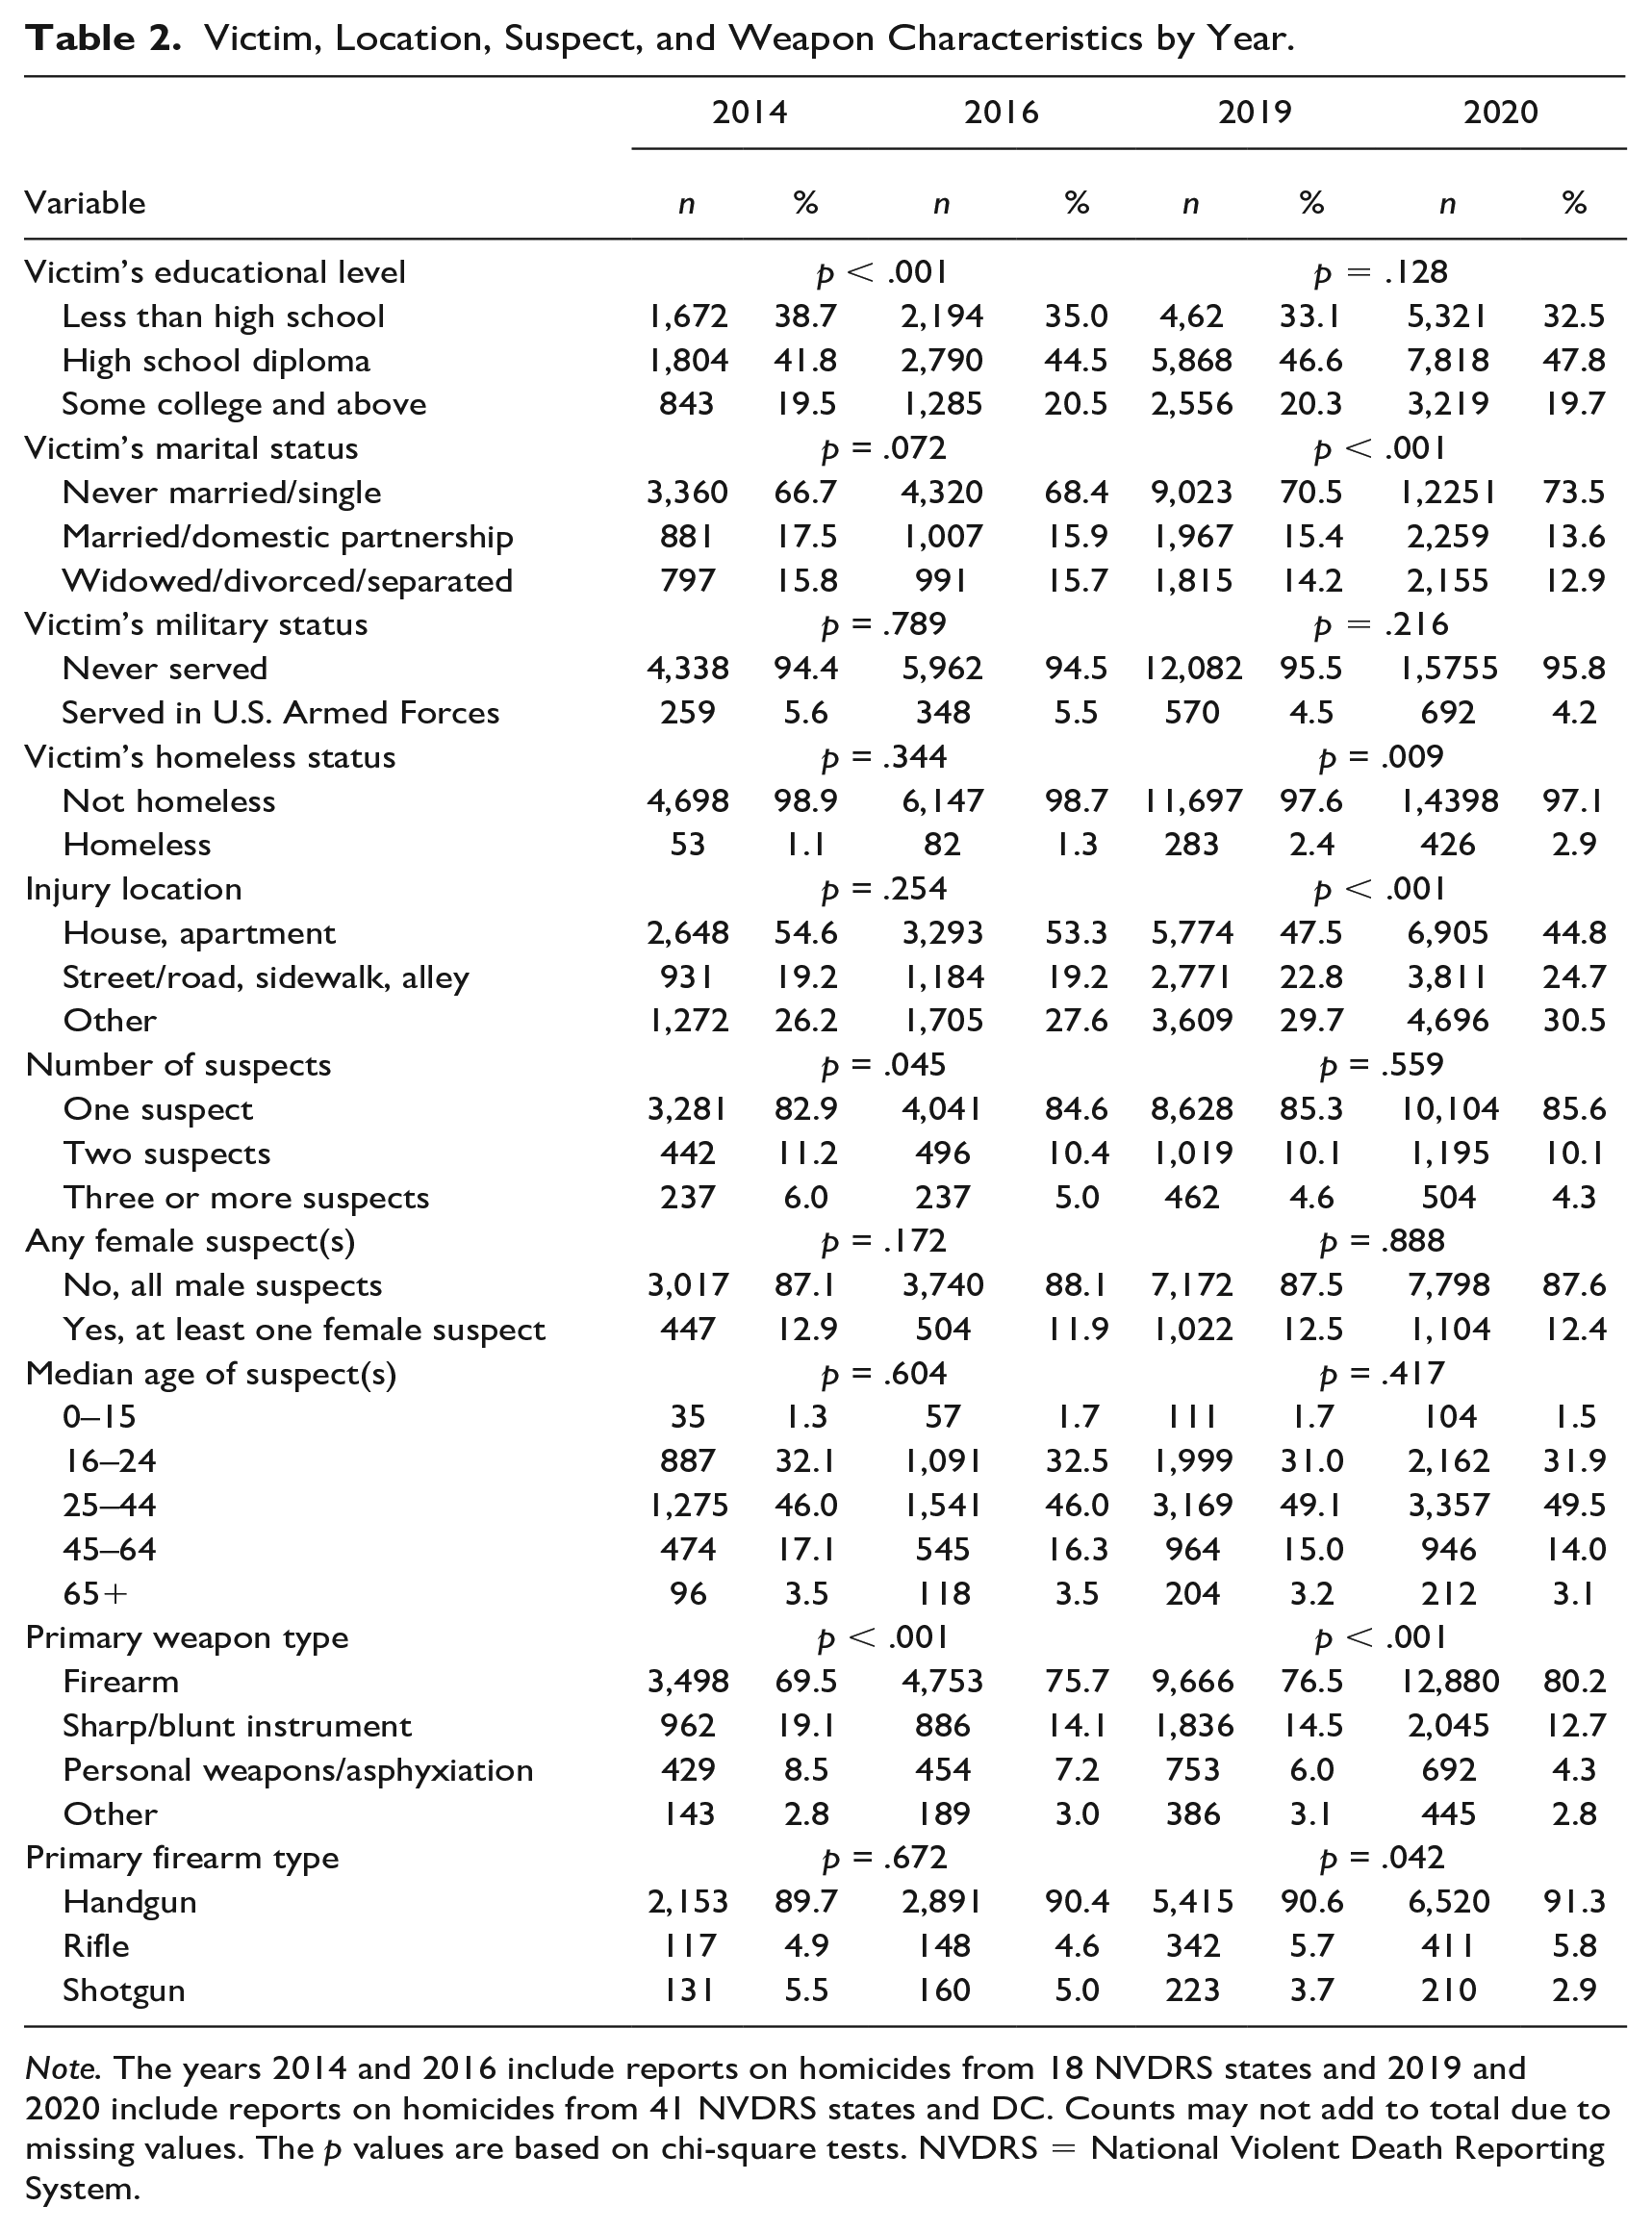
Note. The years 2014 and 2016 include reports on homicides from 18 NVDRS states and 2019 and 2020 include reports on homicides from 41 NVDRS states and DC. Counts may not add to total due to missing values. The p values are based on chi-square tests. NVDRS = National Violent Death Reporting System.
Circumstances Preceding Homicide Victimizations by Year.
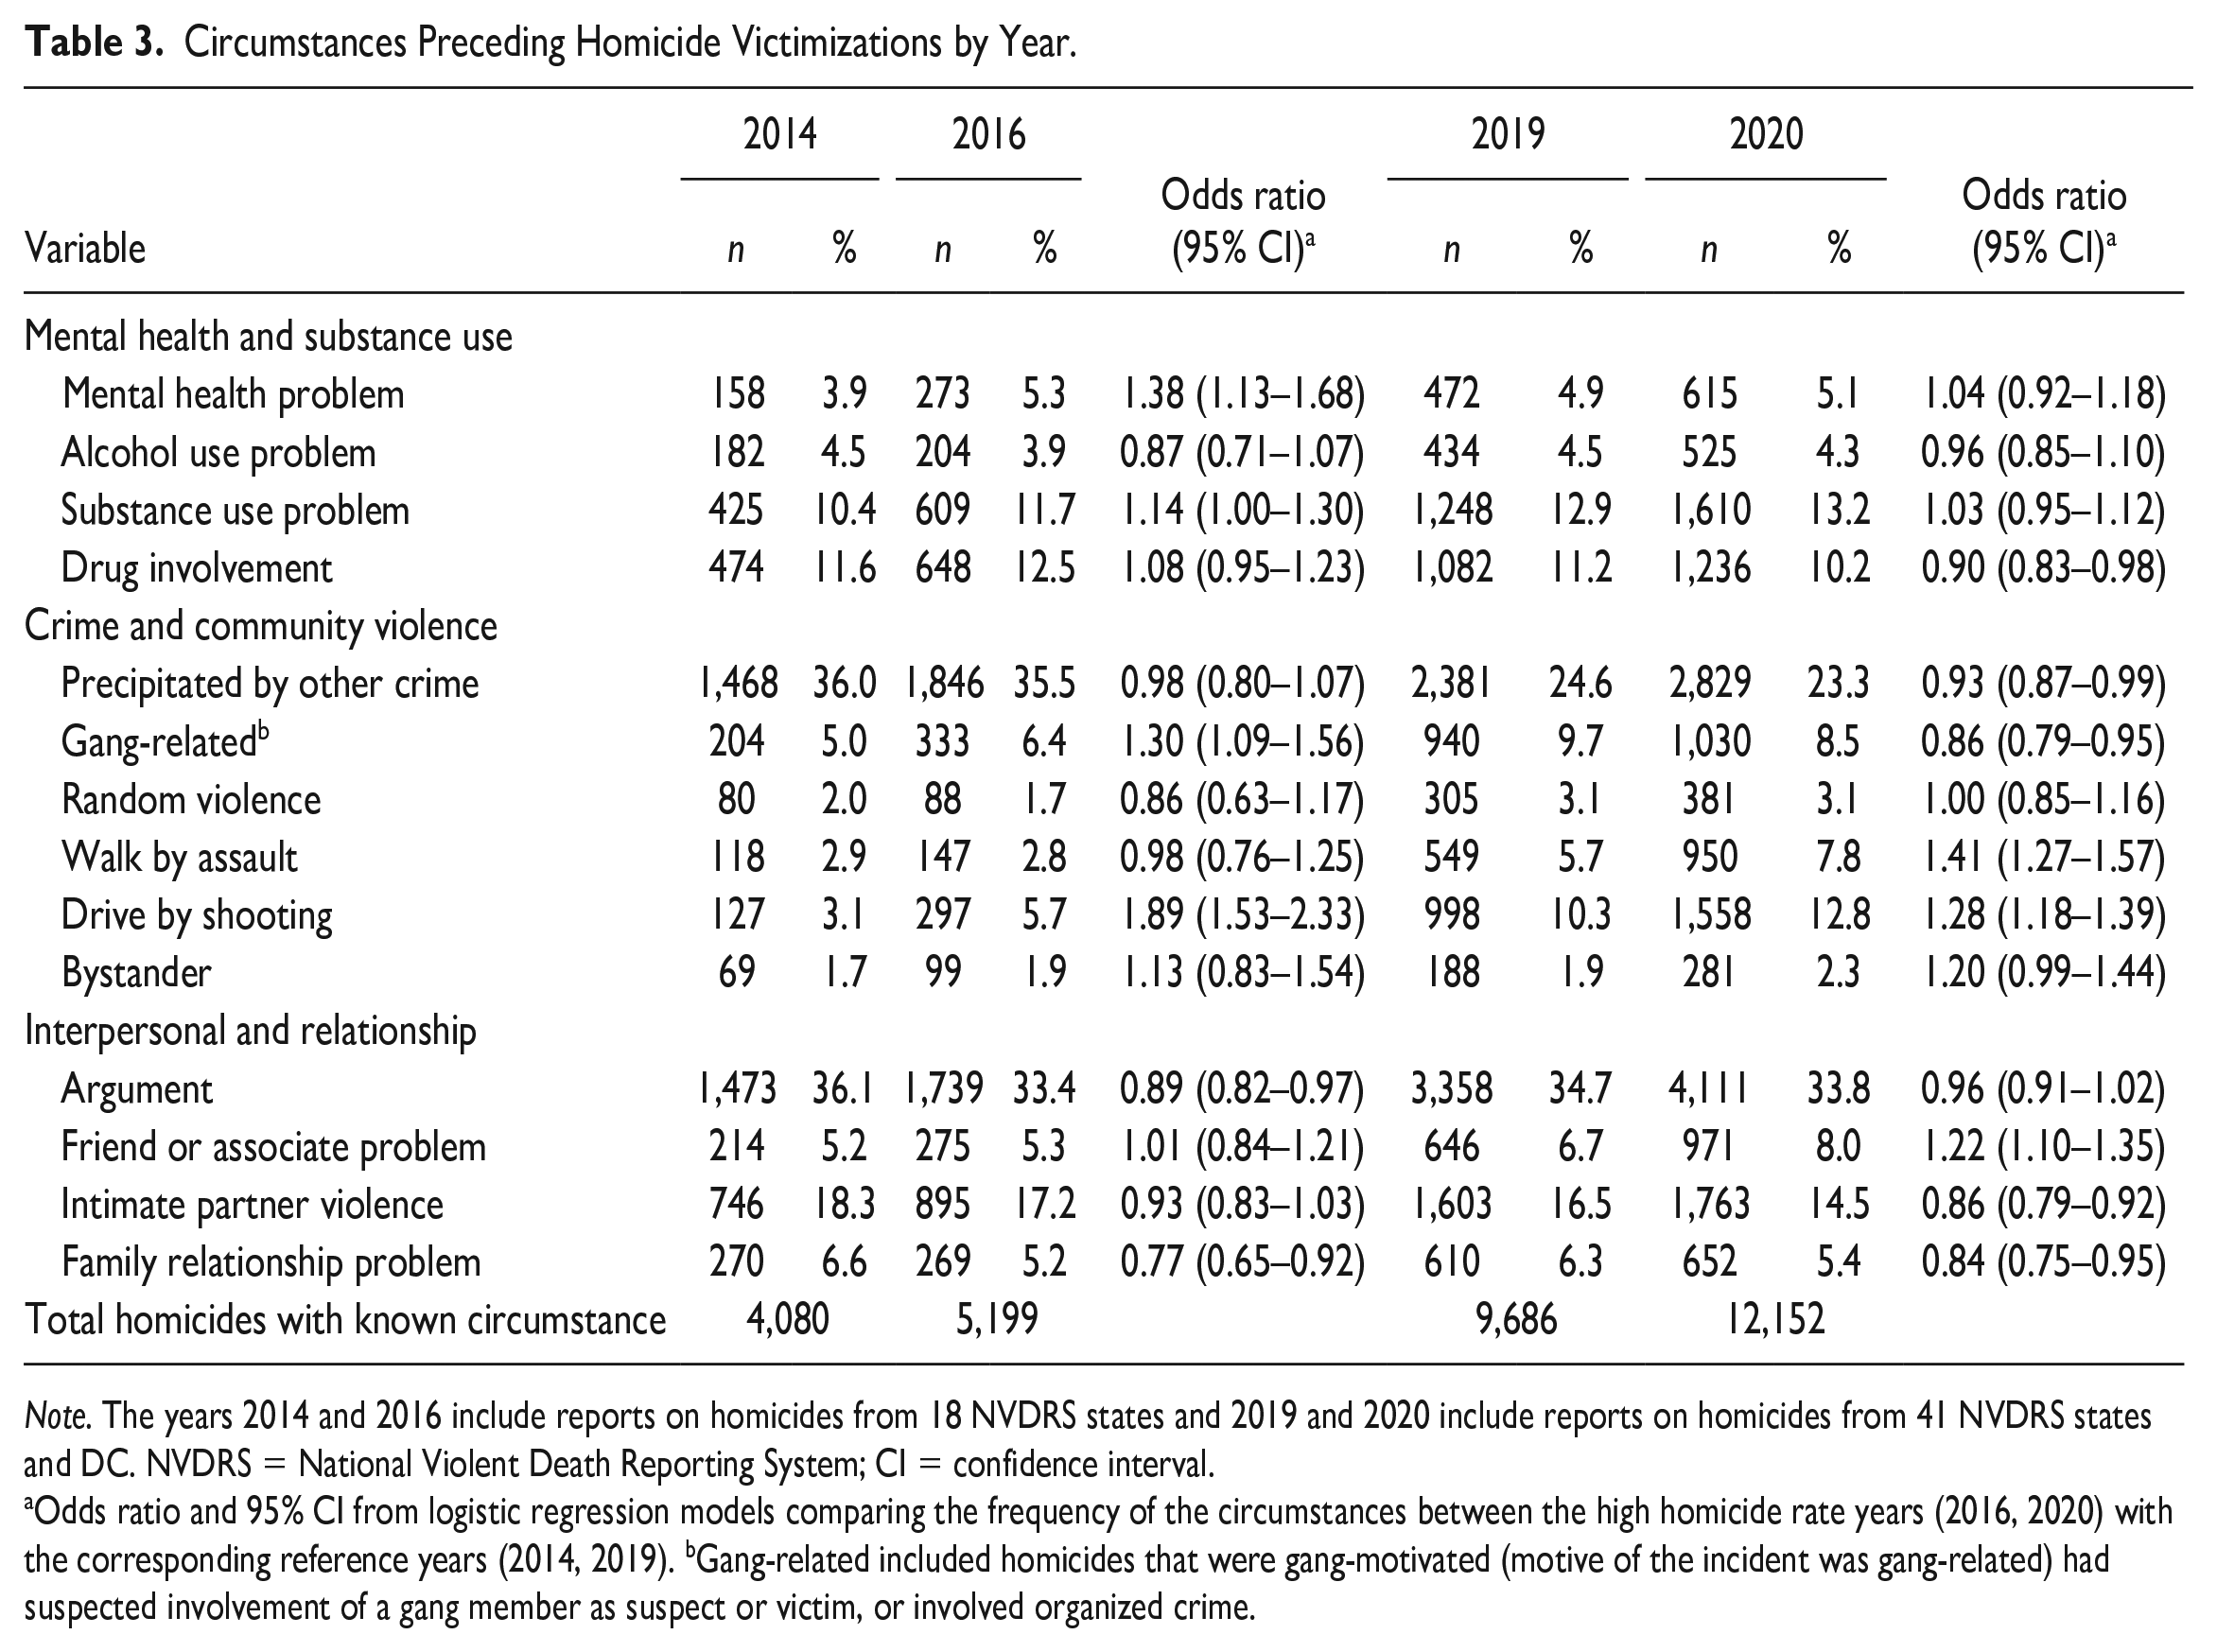
Note. The years 2014 and 2016 include reports on homicides from 18 NVDRS states and 2019 and 2020 include reports on homicides from 41 NVDRS states and DC. NVDRS = National Violent Death Reporting System; CI = confidence interval.
Odds ratio and 95% CI from logistic regression models comparing the frequency of the circumstances between the high homicide rate years (2016, 2020) with the corresponding reference years (2014, 2019). bGang-related included homicides that were gang-motivated (motive of the incident was gang-related) had suspected involvement of a gang member as suspect or victim, or involved organized crime.
Victim, location, suspect, and weapon characteristics across study years are presented in Table 2. The 2014 to 2016 and 2019 to 2020 homicide spikes differed regarding change in victim and location characteristics. From 2014 to 2016, the homicide increase was similar across groups, with one exception. A larger proportion of homicide victims had a high school diploma in 2016 compared with 2014 (44.5% vs. 41.8%, p < .001). In the 2020 homicide spike, there were a few notable changes in victim and location characteristics. In 2020, compared with 2019, there were larger proportions of homicide victims that were (a) never married or single (73.5% vs. 70.5%, p < .001), (b) homeless (2.9% vs. 2.4%, p = .009), and (c) killed outside of houses and apartments (55.2% vs. 52.5%, p < .001). Secondarily, among those who were killed inside of houses and apartments, a larger proportion of victims were killed outside their own homes (39.2% in 2020 vs. 34.3% in 2019, p < .05; not shown in tabular form).
Across both homicide spikes, the results suggest little change in suspect characteristics. For instance, the percentage of homicide victimizations involving at least one female suspect was 12.5% in 2019 and 12.4% in 2020 (p = .888). Note again, however, that suspect characteristics contain a considerable amount of missingness. More than 20% of homicide victimizations were missing information on the number of suspected perpetrators. In addition, the percent missing for suspect characteristics increased proportionally from 2019 to 2020. Another consistent finding across both homicide spikes was a higher proportion of firearm-related deaths in the spike years relative to the comparison years. In 2016, 75.7% of homicide victimizations involved a firearm compared with 69.5% in 2014. Similarly, 80.2% and 76.5% of deaths involved a firearm in 2020 and 2019, respectively. Among firearm deaths in 2014 and 2016, the difference in firearm type was not statistically significant. However, the proportion of firearm deaths involving handguns was higher in 2020 (91.3%) compared with 2019 (90.6%, p = .042).
Odds ratios from the comparison of circumstances across high-rate and reference years are presented in Table 3. In 2016, compared with 2014, victimizations were more likely to be precipitated by mental health problems (5.3% vs. 3.9%) and substance use problems (11.7% vs. 10.4%). There was also a higher proportion of homicides that were precipitated by drug involvement (e.g., drug dealing, drug trade, or drug use); however, the change was not statistically significant. While most crime and community violence variables did not change from 2014 to 2016, gang-related homicides (6.4% vs. 5.0%) and drive by shootings (5.7% vs. 3.1%) were more prevalent in 2016. Generally, interpersonal and relationship problems were precipitating factors in 2016 as often or less often than 2014. For instance, an argument was identified as a precipitating circumstance in 33.4% of 2016 homicide victimizations compared with 36.1% of 2014 victimizations.
Different patterns are revealed when examining 2019 and 2020 homicide victimizations. Unlike 2014 to 2016, there were no changes in identified mental health, alcohol use, or substance use problems from 2019 to 2020. When examining crime and community violence–related variables, the data suggest that homicide victimizations were precipitated by other crimes and gang-related activity less often in 2020 than 2019. Victims, however, were more often killed in walk by assaults (7.8% vs. 5.7%) and drive by shootings (12.8% vs. 10.3%). Homicide victimizations were also more often precipitated by relationship problems with friends and associates (8.0% vs. 6.7%), whereas victimizations were less often precipitated by intimate partner violence (14.5% vs. 16.5%) and family relationship problems (5.4% vs. 6.3%).
Discussion
Research on U.S. homicide trends has largely relied on the same two national-level data sets: the NVSS and SHR. Descriptive insights, however, are limited by the breadth and depth of the variables in these databases. Researchers should look to the NVDRS as a potential source of rich circumstantial information about homicide incidents. In this article, we first demonstrated that the NVDRS has been widely used for cross-sectional homicide research, but homicide trend research lags. Second, we emphasized two key considerations when conducting NVDRS homicide trend studies: (a) data availability and representativeness and (b) data completeness. When conducting trend analyses, researchers should only use a sample of states that provide data for the entire period of interest to ensure that temporal changes are not an artifact of geographic differences. Furthermore, researchers should carefully assess the extent of missingness in the data and consider the implications of NVDRS coding strategies. Third, we examined the degree to which the NVDRS homicide victimization trends correspond with NVSS and SHR trends. We found that the NVDRS data—especially when using more recent data—strongly correspond with these commonly used databases. When selecting the appropriate sample of states, NVDRS homicide victimization trends converge with NVSS and SHR trends. In addition, when examining the demographic burden of recent homicide victimization spikes, the NVDRS leads to similar conclusions as the NVSS. Fourth, we found that the additional descriptive information contained within the NVDRS enriches our understanding of recent homicide victimization spikes. We highlight these contributions while recommending a few potential paths for further investigation.
First, our results add to the growing evidence regarding the role of substance use and drug markets during the 2014 to 2016 homicide spike. Some scholars suggest the expanding opioid market may have contributed to the 2014 to 2016 homicide spike given the sizable growth in homicides related to drugs relative to other circumstances (Rosenfeld & Fox, 2019) and the strong association between fatal drug overdoses and homicide increases during that time (Gaston et al., 2019). Consistent with these arguments, our estimates indicate a growth from 2014 to 2016 in the proportion of homicide victimizations precipitated by substance use problems. There were also marginal increases in the proportion of homicides that were precipitated by involvement in drug dealing, drug trade, or drug use. Other NVDRS research using toxicology reports suggests an increasing presence of opioids in homicide victims from 2003 to 2016 (Mowbray & Fatehi, 2021). These findings align with prior research indicating an association between the opioid epidemic and homicide rates in the United States (Rosenfeld, Roth, et al., 2023). Future NVDRS research should continue to examine changes in substance-related circumstances, as well as drug detection in toxicology reports. Past work suggests that the opioid epidemic may have been a particularly significant contributor to the growth in White homicide victimizations in rural areas (Rosenfeld, 2017; Rosenfeld & Fox, 2019). Analyses using the NVDRS data could further investigate this possibility by disaggregating homicide circumstances and toxicology reports across racial and ethnic groups and rurality.
Second, our study contributes descriptive findings that should be considered when developing comprehensive explanations of the 2019 to 2020 homicide spike. The stressors generated by the COVID-19 pandemic and stay-at-home orders have been offered as a potential explanation for the surge in lethal victimizations during this time (Nix, 2021; Rosenfeld, Boxerman, et al., 2023). Indeed, evidence suggests the pandemic had a considerable mental health burden, with research indicating increases in depression and anxiety (Vahratian et al., 2021), and alcohol and substance use (Pollard et al., 2020). Our results, however, suggest that mental health and substance use problems may not have been key drivers of the homicide spike. We found no differences in the identification of mental health, alcohol use, or substance use problems as precipitating circumstances in 2020 homicide victimizations relative to 2019. Similarly, while the pandemic year brought widespread increases in domestic violence (see Piquero et al., 2021), those increases do not appear to have driven the spike in lethal victimizations. In 2020, victims were less often married or previously married, and their victimizations were less often precipitated by intimate partner violence or family relationship problems. Instead, our results suggest that the burden of the 2020 homicide increase was especially large in public, rather than private, settings. Compared with 2019, 2020 homicide victims were more often killed outside their homes and killed in walk by assaults and drive by shootings. In addition, relationship problems with friends and associates were more often a precipitating circumstance. Overall, these findings are consistent with claims that community violence, characterized by retaliation in public settings, was a significant driver of the 2020 homicide spike (Friedrich, 2022; Hughes, 2023). Once again, however, future research would benefit from expanding the description of the 2019 to 2020 homicide spike by key victim characteristics. For instance, empirical work should explore how the change in precipitating circumstances varies by race and ethnicity. Doing so may offer additional insights into the alternative explanation that homicide increased in 2020 in part due to the response to police killings of Black Americans and the corresponding public doubts about police legitimacy (Cassell, 2020; Rosenfeld, 2020).
Third, the primary weapon type in homicide victimizations revealed a pattern consistent with past work (Berg, 2019; Rosenfeld & Fox, 2019). Not only do most deaths involve firearms, but homicide increases are almost exclusively confined to firearm-related victimizations. For instance, the proportion of homicide victimizations involving a firearm increased from 76.5% in 2019 to 80.2% in 2020. Estimates from the NVDRS data also revealed a large growth in the proportion of homicide victimizations that are drive by shootings, which have been a growing concern in cities devastated by gun violence (Hughes, 2023). Researchers should continue to use the NVDRS and other databases to examine whether the growing availability, deployment, and lethality of firearms have contributed to recent increases in homicide victimizations (Berg, 2019; Donohue, 2022; Lauritsen & Lentz, 2019). Moreover, the NVDRS offers opportunities to explore changes in where and when firearms are used during interpersonal lethal violence.
Of course, the NVDRS data are not without limitations for homicide trend research, as exemplified by the limitations in our current study. Long-term trend analyses must currently rely on only a small sample of states that may not be representative of the United States. As noted, the 16 states providing data from 2005 to 2020 account for just over a quarter of the U.S. population. However, the homicide victimization trends from these 16 states do correlate strongly with NVSS and SHR trends, which adds confidence to the use of these data. The NVDRS is also limited by incompleteness in the data. Some measures contain so much missingness that they may not be reliable for study (CDC, 2021). We also found large amounts of missing data in suspect characteristics, which was exacerbated in 2020, possibly in part due to low and declining homicide clearance rates (AbiNader et al., 2023; Li & Lartey, 2022). Furthermore, circumstance measures are indicators of detection and, therefore, do not specify whether the absence of a circumstance is simply unknown or a true negative. As such, there is a limited ability to determine the reason for change in homicide circumstances. For instance, our estimates indicated an increase from 2014 to 2016 in the proportion of victimizations that were precipitated by mental health problems. This could be due to more access to mental health treatment, more frequent diagnoses, better abstraction, or an increased targeting of individuals with mental health conditions. We also recognize that, owing to our large sample, some of the statistically significant differences identified in our analyses may have little substantive significance. Finally, the NVDRS—much like other available national-level data systems—does not currently offer timely information on homicide. Timely data are critical for combatting speculation about homicide spikes and premature policy responses (Baumer et al., 2018). Yet, as of May 2023, the 2021 data from the NVDRS remain unavailable.
Conclusion
There is considerable value in the study of homicide trends (Rosenfeld, 2018). While criminology has not historically been well positioned to offer thorough in-depth descriptions of the changing nature of homicide, we have introduced a newer data system that may provide that capacity. The NVDRS gives researchers an opportunity to shed new light on old questions about the contours of homicide, including recent spikes in lethal violence. Its rich detail regarding homicide victims, their suspects, incident locations, and precipitating circumstances has the potential to enrich our efforts for both empirical verification and discovery.
Footnotes
Acknowledgements
The authors would like to acknowledge participating Violent Death Reporting System programs based in U.S. states, territories, and jurisdictions; participating state/territory/jurisdiction agencies, including state/territory/jurisdiction health departments, vital registrars’ offices, coroners’/medical examiners’ offices, crime laboratories, and local and state/territory/jurisdiction law enforcement agencies and the NVDRS partner organizations: the Safe States Alliance, American Public Health Association, International Association of Chiefs of Police, National Association of Medical Examiners, National Association for Public Health Statistics and Information Systems, National Violence Prevention Network, Council of State and Territorial Epidemiologists, and Association of State and Territorial Health Officials; federal agencies, including the U.S. Department of Justice, Bureau of Justice Statistics; other stakeholders, researchers, and foundations, including Harvard University Injury Control Research Center and the Joyce Foundation; the National Institute for Occupational Safety and Health and National Center for Health Statistics, CDC.
Authors’ Note
This research uses data from NVDRS, a surveillance system designed by the Centers for Disease Control and Prevention’s (CDC) National Center for Injury Prevention and Control. The findings are based, in part, on the contributions of the funded states/territories/jurisdictions that collected violent death data and the contributions of their partners, including personnel from law enforcement, vital records, medical examiners/coroners, and crime laboratories. The analyses, results, and conclusions presented here represent those of the authors and not necessarily reflect those of CDC. Persons interested in obtaining data files from NVDRS should contact CDC’s National Center for Injury Prevention and Control, 4770 Buford Hwy, NE, MS F-64, Atlanta, GA 30341-3717, (800) CDC-INFO (232-4636).
Declaration of Conflicting Interests
The author(s) declared no potential conflicts of interest with respect to the research, authorship, and/or publication of this article.
Funding
The author(s) received no financial support for the research, authorship, and/or publication of this article.