
Abstract
If welfare stigma depends upon social attitudes, only the neediest apply for welfare when they can more easily be seen to do so. Using GoogleMaps' ‘StreetView' feature, this article finds that the approval rate of applications for social assistance is higher in welfare offices with building characteristics that enhance the visibility of entry. A fitting explanation for this finding is that persons looking for social assistance dislike being thought of as ‘welfare cases', and apply more conservatively when others can see it. The effects decline in the rate of poverty, suggesting that the self-reliance norm weakens as poverty increases.
“They all need buildings to help them along” - David Byrne, The Talking Heads
Introduction
A strong norm that an individual be self-reliant and get by on his own efforts induces applicants for social assistance (‘welfare’) to feel shame for failing to do so. Known as ‘welfare stigma’, this sort of opprobrium has long been thought to explain why the number of persons eligible for welfare substantially eclipses the number of claims to it (Rainwater, 1982; Moffitt, 1983; Besley and Coate, 1992; Lindbeck et al, 1999; Andrade, 2002; Currie, 2006). Despite this pervasive suspicion, empirical evidence of welfare stigma is very hard to come by. For instance, it is hard to disentangle welfare stigma from a reluctance to learn about potentially complex application procedures.
Combining data on acceptance rates for Temporary Assistance for Needy Families (TANF) with observations of characteristics of buildings housing welfare offices obtained from GoogleMaps’ ‘StreetView’ feature, this study documents a higher acceptance-to-applications ratio in offices into which entry is more readily seen, as judged by the prevalence of visibility-enhancing features such as elevated entrances or more space to traverse between a building and its street. This result is substantially weaker when information about applicants’ chances of approval is made more accessible online through upgrades of the welfare authorities’ websites, which reduce the need for an in-person appearance at the welfare office. The result is stronger in more affluent areas.
An interpretation of these findings, which is consistent with the literature on welfare stigma, is that people are more reluctant to apply for dole money when others can more easily observe it, and that those whose poverty is most severe (and whose applications therefore most likely to result in approval) are the most likely to apply. This is true if stigma is a normal bad: the better-off the individual, the less stigma he is willing to countenance. This point is discussed again in the discussion section below.
As it pertains to welfare payments, peer influence in its various forms has been a burgeoning topic in recent times, but it remains difficult to study it in the field. Friedrichsen et al. (2018) contribute results from a laboratory experiment, testing the general knowledge of their subjects, finding a thirty percentage-point reduction in take-up rates of transfers to poor performers when a quiz is public rather than private. In an extensive interview study, Stuber and Schlesinger (2006) document both the anticipation of negative treatment, and self-identity, as causes of welfare stigma, finding several covariates. The ever-present concerns with contextual variation and external validity create a pressing need for field studies on welfare stigma.
Moreover, social recognition and peer effects are increasingly important in explaining various other aspects of society, spanning fighter pilots’ efforts (Ager et al., 2021), voting (e.g. Funk, 2010; Dellavigna et al., 2017), littering (Dur and Vollaard, 2015), fairness and charitable giving (Dana et al., 2007; Lazear et al., 2012; Krupka and Weber, 2013; Butera and Horn, 2017), and going back to Thorstein Veblen’s (1899) seminal treatment of conspicuous consumption (see also, e.g., Frank, 1985; Samuelson, 2004). In addition, Bursztyn et al. (2018) find that platinum credit card holders are more likely to use their cards in social situations, as well as higher demand for such cards compared to nondescript cards with identical instrumental benefits. The impact of social incentives is also thought to depend negatively on ‘price’; norms are mutable and if it exogenously became much harder to fulfil social expectations, the norms would weaken (Bernheim, 1994; Akerlof, 1997; Becker and Murphy, 2000; Akerlof and Kranton, 2000; Clark, 2003; Hopkins and Kornienko, 2004; Austen-Smith and Fryer, 2005; Bicchieri, 2005; Shields et al, 2009; Rege et al, 2012; and Hetschko et al, 2014).
Norms may be internalized or may come from outside the individual. In the former case, man is said to be ‘socialized’, whereas the latter case is more in tune with methodological individualism, as norms are then more akin to others’ expectations of an individual, which he can choose to disregard (Wrong, 1961; Bursztyn et al, 2020; cf. Elster, 1989). Along with internalized norms (e.g., López-Pérez, 2008, 2010; Kimbrough and Vostroknutov, 2016), reputational or self-respect concerns (e.g., Bénabou and Tirole, 2006; Malmendier et al., 2014) and caring about others’ material payoffs (e.g. Becker, 1974; Fehr and Schmidt, 1999) are common approaches to social interaction. Models in psychological game theory in which players receive disutility (“guilt”) from failing to live up to others’ expectations of them, may also be thought of as internalized norms (e.g. Geanakoplos et al., 1989; Rabin, 1993; Baumeister et al., 1994; Dufwenberg, 2002; Battigalli and Dufwenberg, 2007).
If social norms are not (perfectly) internalized, the utility loss due to breaking them is a function of the likelihood that a ‘welfare case’ be seen to enter a welfare office; socialized individuals would plainly abide by a norm whether watched or no. Anonymity allows unsocialized individuals to disregard self- reliance norms with impunity. While social assistance administrations invariably protect applicants’ anonymity very strictly, protection is necessarily incomplete when in-person applications must be made at welfare offices so that others can see who goes in. Although the results of the present study cannot rule out any socialization of norms, they suggest the presence of unsocialized norms.
In addition, this paper accomplishes two main things. Firstly, it contributes a novel method of indirectly observing norms and social interaction effects based on differences in visibility (or anonymity), provided that visibility differences are not correlated with relevant socio-economic features or that felicitous circumstances enable the socio-economic features to be controlled for by apposite empirical design. Although visibility is integral to the presentation of self, there appear to be no prior studies which utilize visibility-affecting variations in physical structures to examine differences in behaviour.
Secondly, the results of this paper are consistent with theories of welfare stigma, suggesting that building characteristics influence welfare-seeking decisions, and additionally that welfare stigma is lower where poverty is higher. Therefore, norms do appear to respond to prices, consistent with the aforementioned research on the mutability of norms. If the loss of status from being seen to enter a welfare office diminishes with increased poverty in this way, a local welfare office could come to act as a way for individuals of connecting with one another at sufficiently high levels of poverty, in effect turning aversion into attraction and thereby ‘normalizing’ a ‘welfare culture’ (e.g. Coleman, 1988, Bertrand et al., 2000; cf. Carvalho et al., 2017).
The potential policy relevance of this paper is especially linked to the literature on ‘welfare ordeals’ (e.g. Besley and Coate, 1995; Blumkin et al, 2015), which is concerned with ways of gaining access to welfare payments that are less costly for the ‘truly needy’ than for the merely indolent. Shame is a nonpecuniary cost that is plausibly incurred more willingly by those with fewest resources, whose welfare applications are more likely to be approved than those in less dire straits. Visibility-enhancing building characteristics could therefore economize on social workers’ time. Whether this is socially efficient depends on how much public resources are saved in this fashion and how severe are the costs of stigma of ‘deserving’ applicants.
Data and Methods
Measurement: The mechanism which the present paper proposes should now be clear; because of a widespread unwillingness to be considered a ‘welfare case’, people apply for welfare more conservatively when others are likelier to see it, driving up the acceptance ratio as those most certain of approval are least likely not to apply, ceteris paribus. The relevant visibility variables are the seven ones described below. Each such characteristic of buildings housing welfare offices is assigned a value of one if it increases the visibility of entry and nought otherwise, as determined by their pictures obtained from the ‘StreetView’ feature of GoogleMaps (N=536).
The building characteristics are the following (only these characteristics have ever been considered), all in binary form: Elevated entrance: An elevated entrance, such as a set of steps or a natural slope leading to the door, makes entry more visible by raising entrants above their peers on the street as they walk in. One is more easily seen and may therefore be more reluctant to go in. Corner entrance: An entrance on a corner can reduce the social stigma that entrants face since fewer peers may observe those who enter. It is relatively easy to ‘sneak in’ unsuspectingly, as potential onlookers will believe that one has simply rounded the corner. Busy street: A well-trafficked street naturally discourages people to enter any building that lowers one’s status, since more people can see where one goes. Beyond some population level, however, a crowded street may have an anonymizing effect due to the high number of individuals, which will be evidenced below. Space between building and street: The greater the distance one must traverse between the street and the building, the more one is discouraged from entry, since there is more time during which one may be observed. Many clear windows: The more clear windows a building has, the more people can see who is inside it. Entrants pondering this fact may be reluctant to enter many-windowed buildings. Shared building: If the building which houses a welfare office is also home to other functions, pedestrians cannot infer that an entrant is a welfare applicant, which should tend to increase applications. Large sign: While large signs may theoretically increase the number of welfare applications by letting welfare-seekers know where to apply, online resources, phone books and the like make this effect unlikely (indeed, the fact that offices have been located online for this study is evidence that finding them is not too difficult, even without local presence). Instead, a large sign is apt to inform on-lookers that the entrant is out to apply for welfare payments.
For ease of interpretation of the results, these variables (except for busy street, for the reasons given above) are summed into a visibility index in the analysis. The results are qualitatively the same as if the variables were used individually (which is shown in the Supplementary material).
To estimate the effect on welfare applications of visibility-enhancing building characteristics, an ideal dataset would randomly assign building characteristics to neighbourhoods and not rely on ocular inspection to determine the presence or not of visibility-enhancing building characteristics. Unfortunately, the present study can have neither of these features. Except for Shared building and Corner entrance, these characteristics are continuous, and coding them in binary form necessarily involves grey areas. Unfortunately, there is no feasible way in which GoogleMaps can be used to determine, for instance, the difference in altitude between a door and a street to measure elevation, or the exact distance between the street and the building to determine space. Furthermore, the number and size of windows and the size of signs are necessarily individual judgement calls and so subject to error. However, there is no reason to suspect systematic errors of mistaking more strongly present characteristics (such as unusually large and plentiful windows on a building) for absent or insignificantly present characteristics, or vice versa. Moreover, the coding was done before adding the applications data and control variables.
Random assignment of building characteristics is desirable because buildings might be given features that in some way reflect the socioeconomic environment in which they are erected, or building characteristics may be correlated with different work atmospheres which affects how applications are handled. In an effort to account for this possibility, this paper utilizes a change in welfare application regimes which affected a part of the sample, whereby it became possible to apply for food stamps entirely online. Food stamps are a much bigger programme than is TANF, so being rejected for food stamps is indicative of ineligibility for TANF. However, this approach is sensitive to the possibility that application behaviour changes over time.
Combinations of these building characteristics may complicate outcomes. For instance, an entrance may be located on a corner, but still be elevated, in which case the elevation ruins the corner effect, since nobody who rounds a corner in a normal fashion would simultaneously appear to be on an ascending trajectory, although if the elevation is reachable from both sides of the corner one might, since it may then be a shortcut round the corner.
A related case is the location of a corner. If a street bends in a corner, sans contact with another street, that is the optimal corner entrance for a welfare applicant who wants to avoid stigma. This propitious corner situation would remove the street fractions A and B in Figure 1; in which the welfare applicant is approaching the welfare office (arrow), marked X. If A and B came back, the corner advantage would lessen; although views of the welfare applicant from street fractions C and D remain obscured by the corner, the views from street fractions A and B are not. However, since the entrant appears but briefly to persons on fraction A, a corner entrance is sure to give some reduction in visibility. A possible corner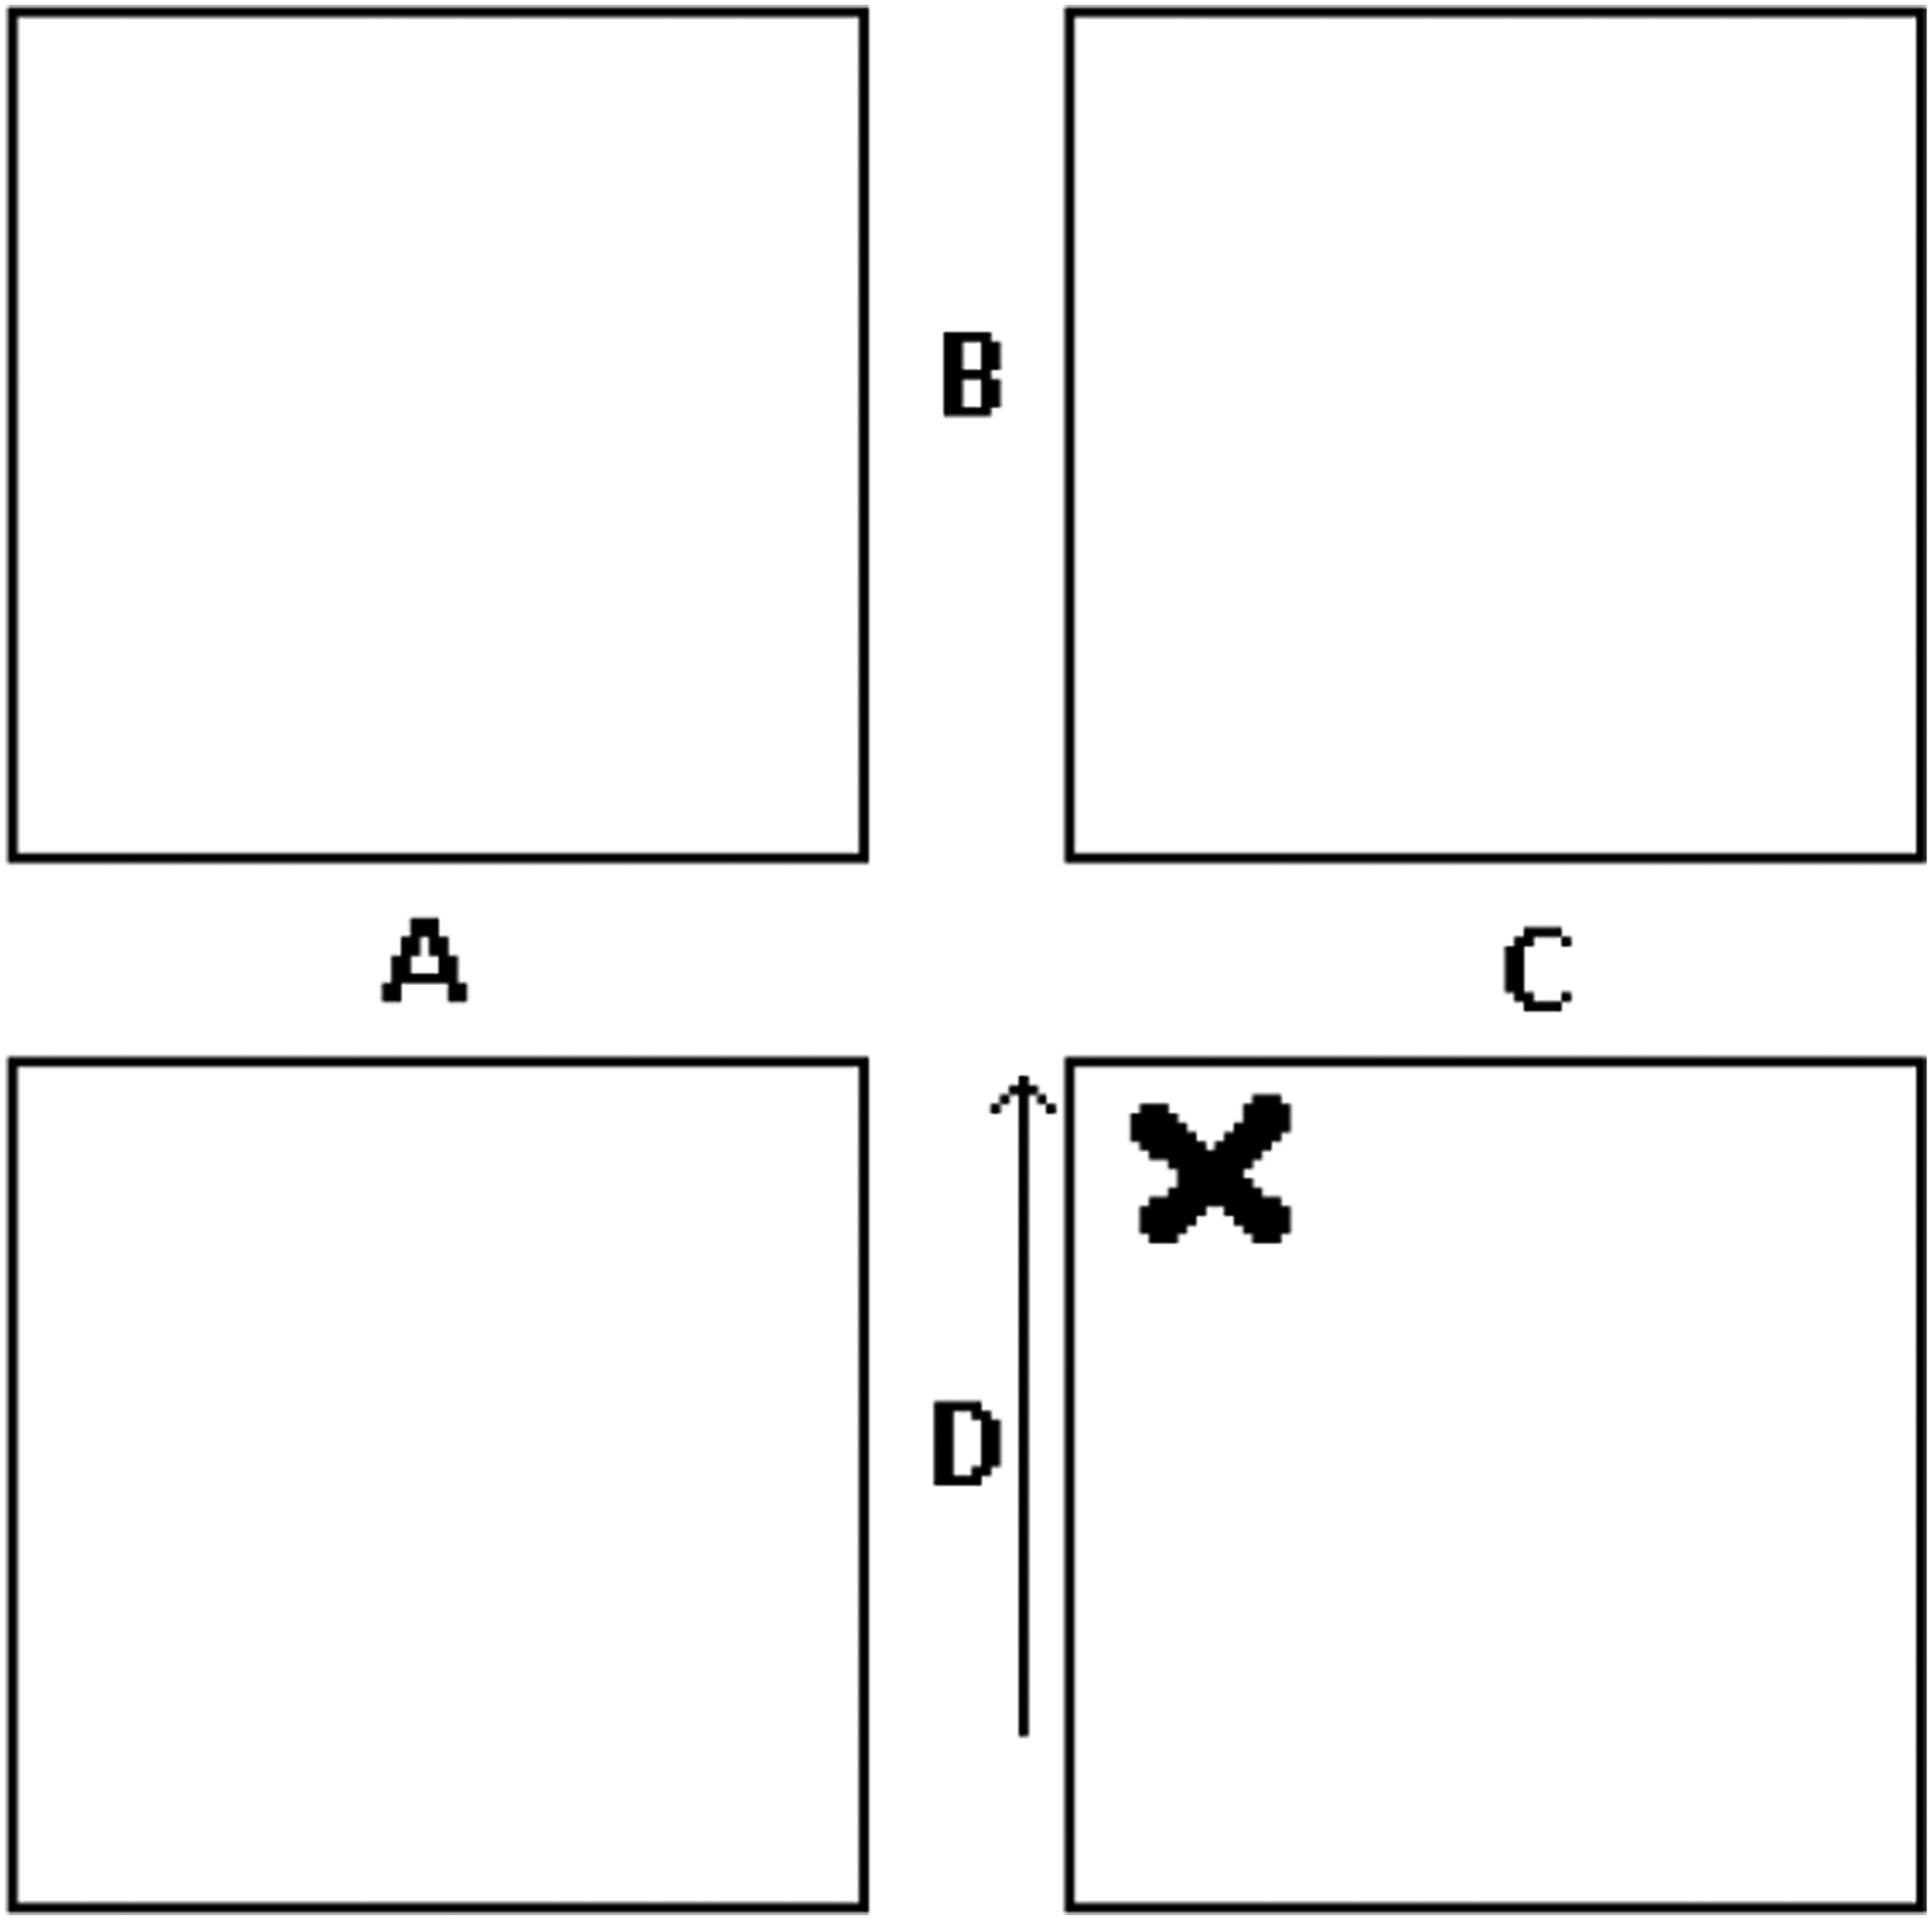
Complications like these only happen six times in the sample and have no impact on the results. A final complicating factor is that the presence of many clear windows is not visibility-enhancing when there is much space between the street and the building, simply due to the added distance. The windows variable in the sample thus essentially means ability to look inside from the street.
Sources: Six states contribute data: Alabama (65), Georgia (148), Missouri (101), North Carolina (92), Oklahoma (71), and Oregon (59). In all of these states bar Oregon, welfare authorities pool application data by county. This necessitates the exclusion of some of the bigger cities, which occupy one county but run several welfare offices whose applicants consequently cannot be tied to a particular building. However, cities like Savannah, GA, Birmingham, AL, and of course all the big cities of Oregon remain in the sample. All data concern applications during the 2010’s, mainly the first few years of the decade.
A total of 48 service areas are not in the sample because of the issue of multiple offices, or because GoogleMaps could not find the offices (usually because the area had not been visited by the Google Car). Data on applications for Temporary Assistance for Needy Families (TANF), as well as approved applications, are available for the remaining 536 welfare offices. The North Carolinian data come via the Jordan Institute for Families at the School of Social Work of the University of North Carolina (Duncan et al., 2013), Chapel Hill; otherwise all data are direct from state Departments of Human Services.
According to the official guiding principles that Departments of Human Services use when selecting a building to house a welfare office (usually available upon request), offices are chosen to be within easy reach for people in their service areas, to offer adequate and clean office space, and bathroom facilities, as well as attractive rent. There is no indication that offices ever be chosen for their visibility- impacting building characteristics.
The Center on Budget and Policy Priorities (2015) reports that the share of families under the poverty line receiving TANF payments varies from approximately forty per cent in Oregon, to seven in Georgia. In-between are Missouri (29), Alabama (17), Oklahoma (10), and North Carolina (9). The US average for the period studied is about 25. The details of TANF provision also vary between states, but for the purposes of the present paper it suffices to note that the programme is aimed at providing cash for indigent families with dependants under the age of eighteen (or nineteen if still in high school), and that the shame of being seen to apply for it is concentrated to the actual application (unlike, say, food stamps, where there may be stigma each time they are used). Lifetime limits on the number of months these payments may be made to the applicant (often 60 months), and conditions on (eventually) finding employment for receiving aid, also vary, though not within states.
Summary Statistics.
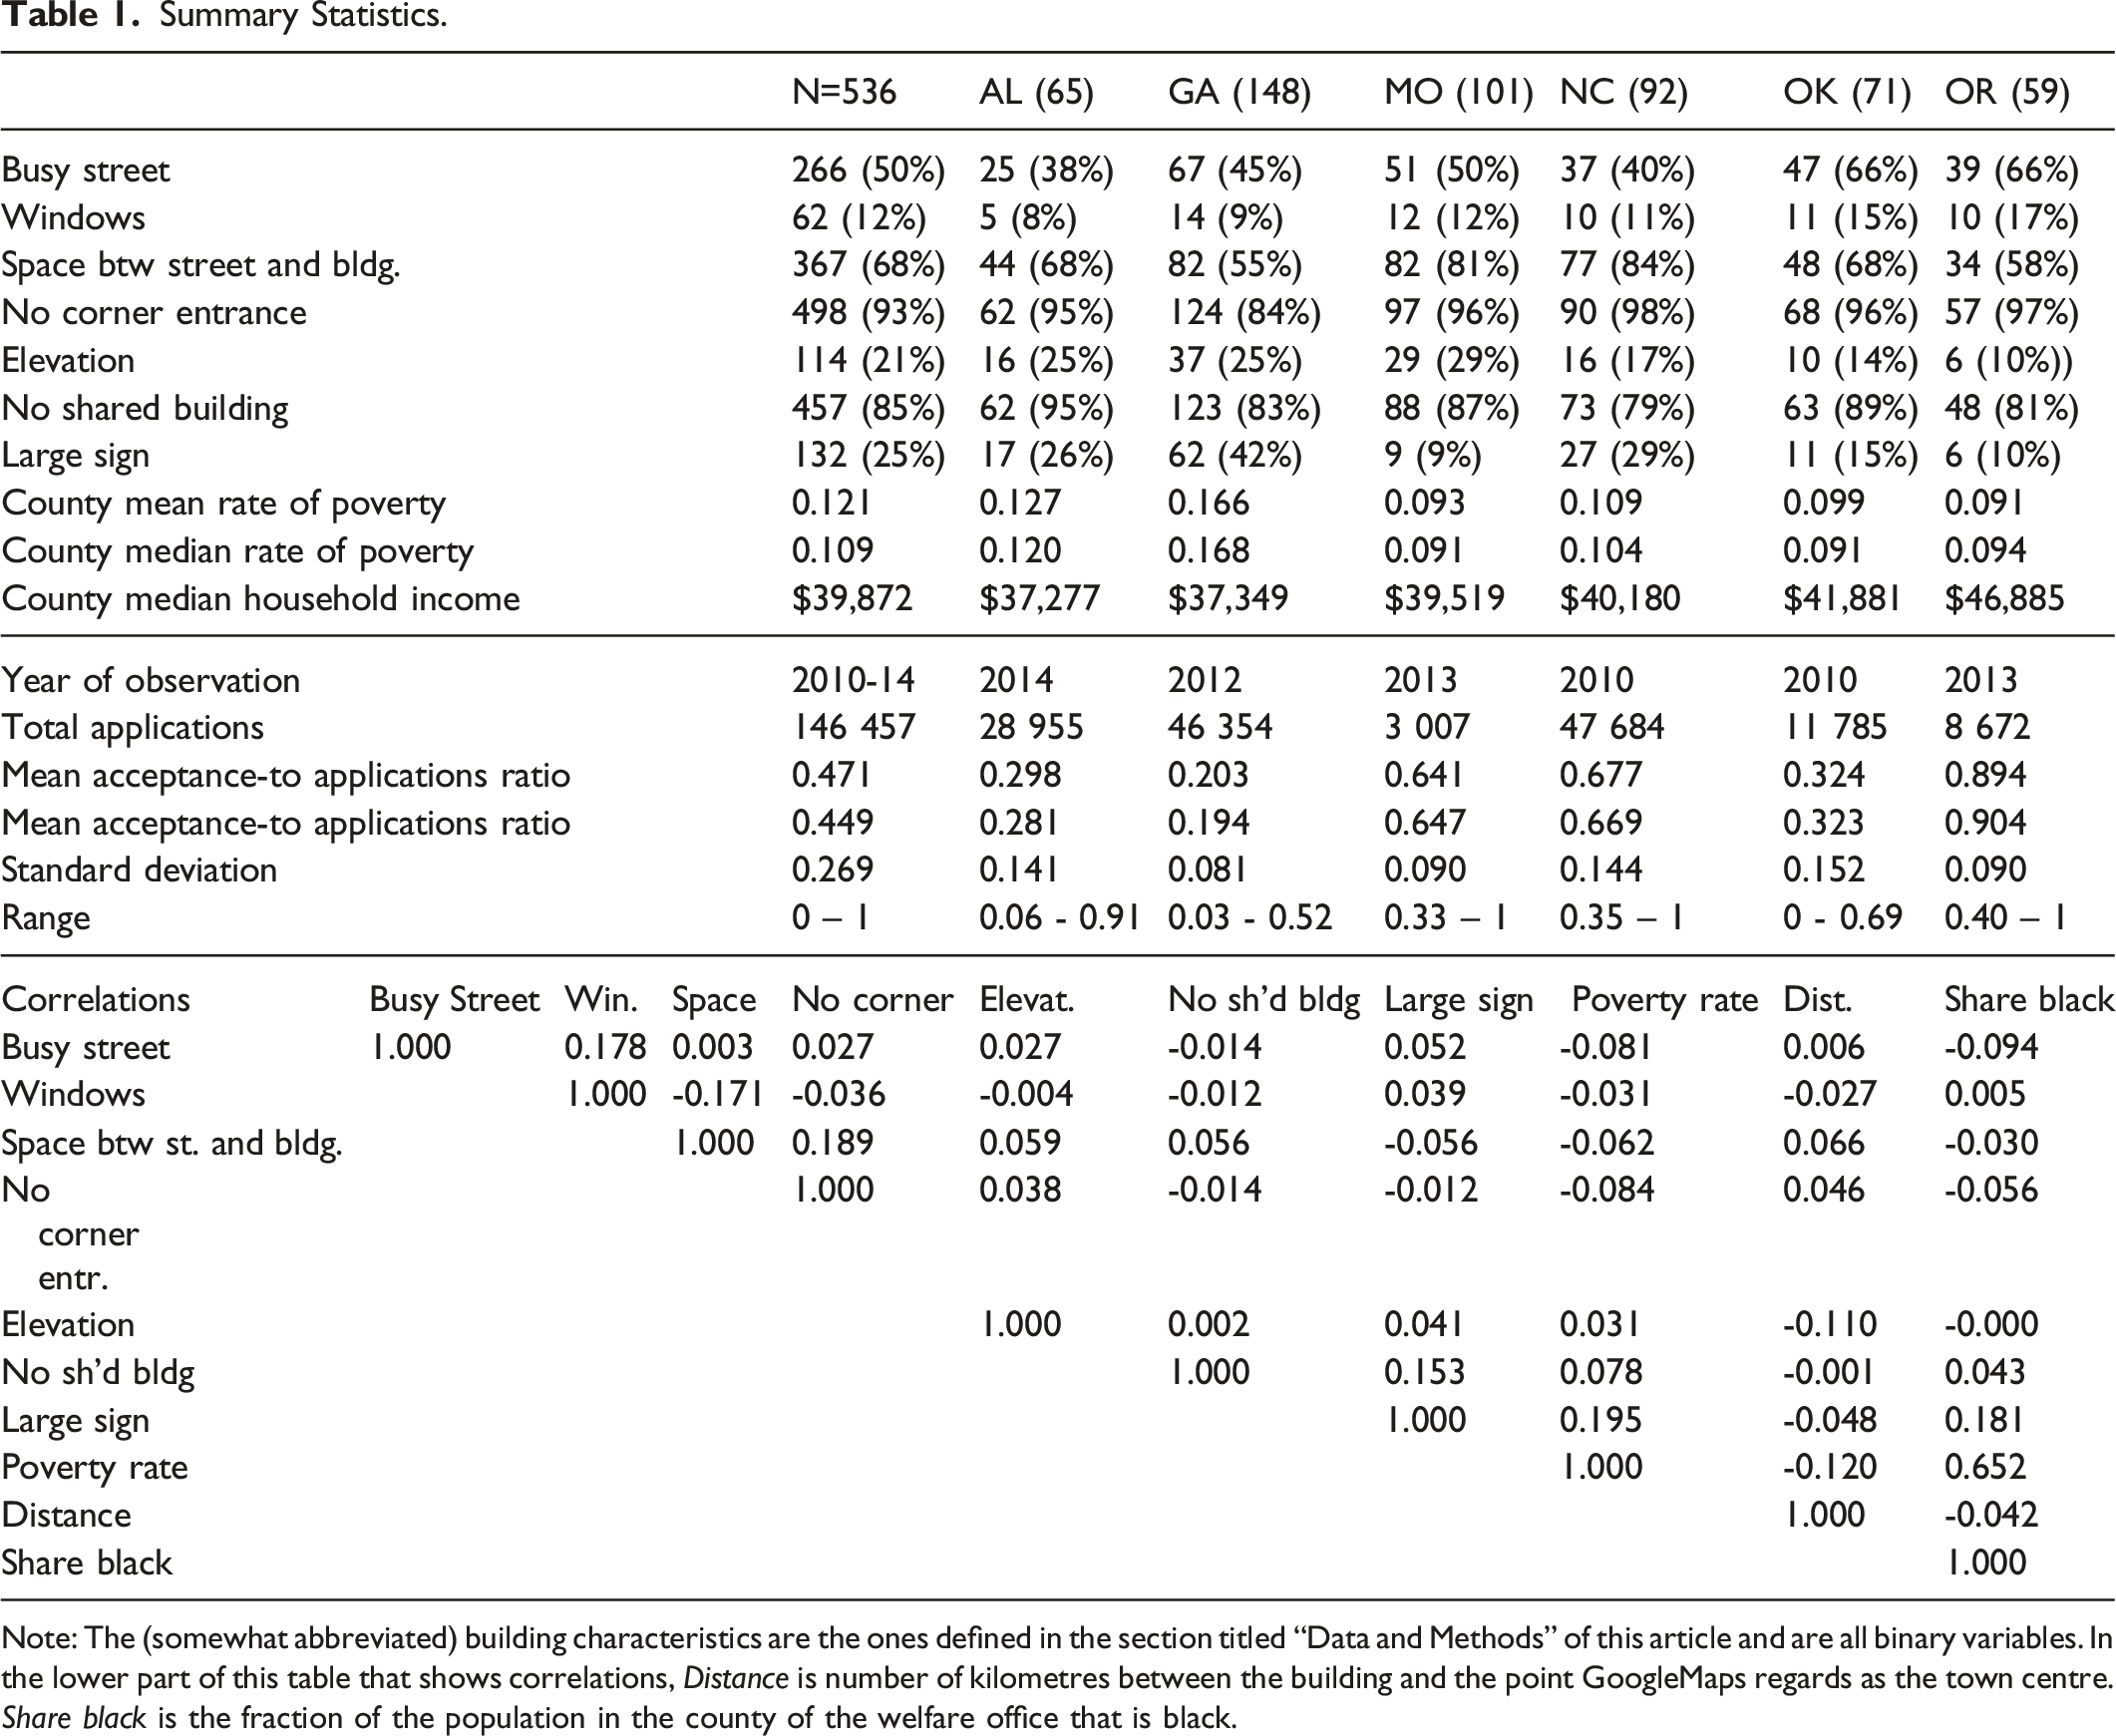
Note: The (somewhat abbreviated) building characteristics are the ones defined in the section titled “Data and Methods” of this article and are all binary variables. In the lower part of this table that shows correlations, Distance is number of kilometres between the building and the point GoogleMaps regards as the town centre. Share black is the fraction of the population in the county of the welfare office that is black.
The sampled states differ from other states in that they do not allow TANF applications to be made online, or in other easy ways that side-step the applicant having to enter the welfare office in person. Several states have introduced such possibilities during the early parts of the 21st century, which may mean that visibility-enhancing building characteristics become irrelevant for applicants concerned with the presentation of self, if they disvalue the cumbersomeness of navigating online applications more than they disvalue stigma.
Variables other than Building Characteristics: The dependent variable is the ratio between the number of accepted TANF applications, and the total number of TANF applications made to a welfare office. The rationale for using this construction is that, if visibility-enhancing building characteristics reduce the propensity to apply for welfare benefits, mainly those individuals most likely to have their applications accepted will risk being seen to apply, causing the ratio to increase through a reduction in its denominator.
This choice of dependent variable allows easier comparisons between large- and small-population service areas and limits problems due to the aforementioned relative rarity of TANF families (which makes the poverty rate and population very blunt controls), and to the possibility of caseworker heterogeneity across offices and outliers in high-application service areas.
The control variable distance from centre is constructed by asking GoogleMaps for the directions from the town’s centre to the address of the welfare office. It was mentioned above how welfare offices try to locate to ease access and the median distance from the town centre indicated by this measure is 0.9 miles (1.44 kilometres). Since this method treats the centre as a single point, one may say that the median office is located centrally. Another control, fraction in town, is the share of the population in a service area living in the town of the welfare office (mean 26 per cent). Since welfare offices are commonly located centrally, fraction in town captures proximity to welfare offices for applicants who do not reside in the same town.
Other control variables include the percentage of families with dependants whom the Census Bureau deems poor, county population, and median household income, all available from the Census Bureau. Neighbourhood income data (i.e. narrower than income measures at the county level – often as close as just the nearest few blocks) are obtained for the state of Georgia from the online resource City-Data (www.city-data.com).
Results and Interpretation
OLS Results of TANF Ratio Regressed on a Visibility Index. Rate Distance fr.
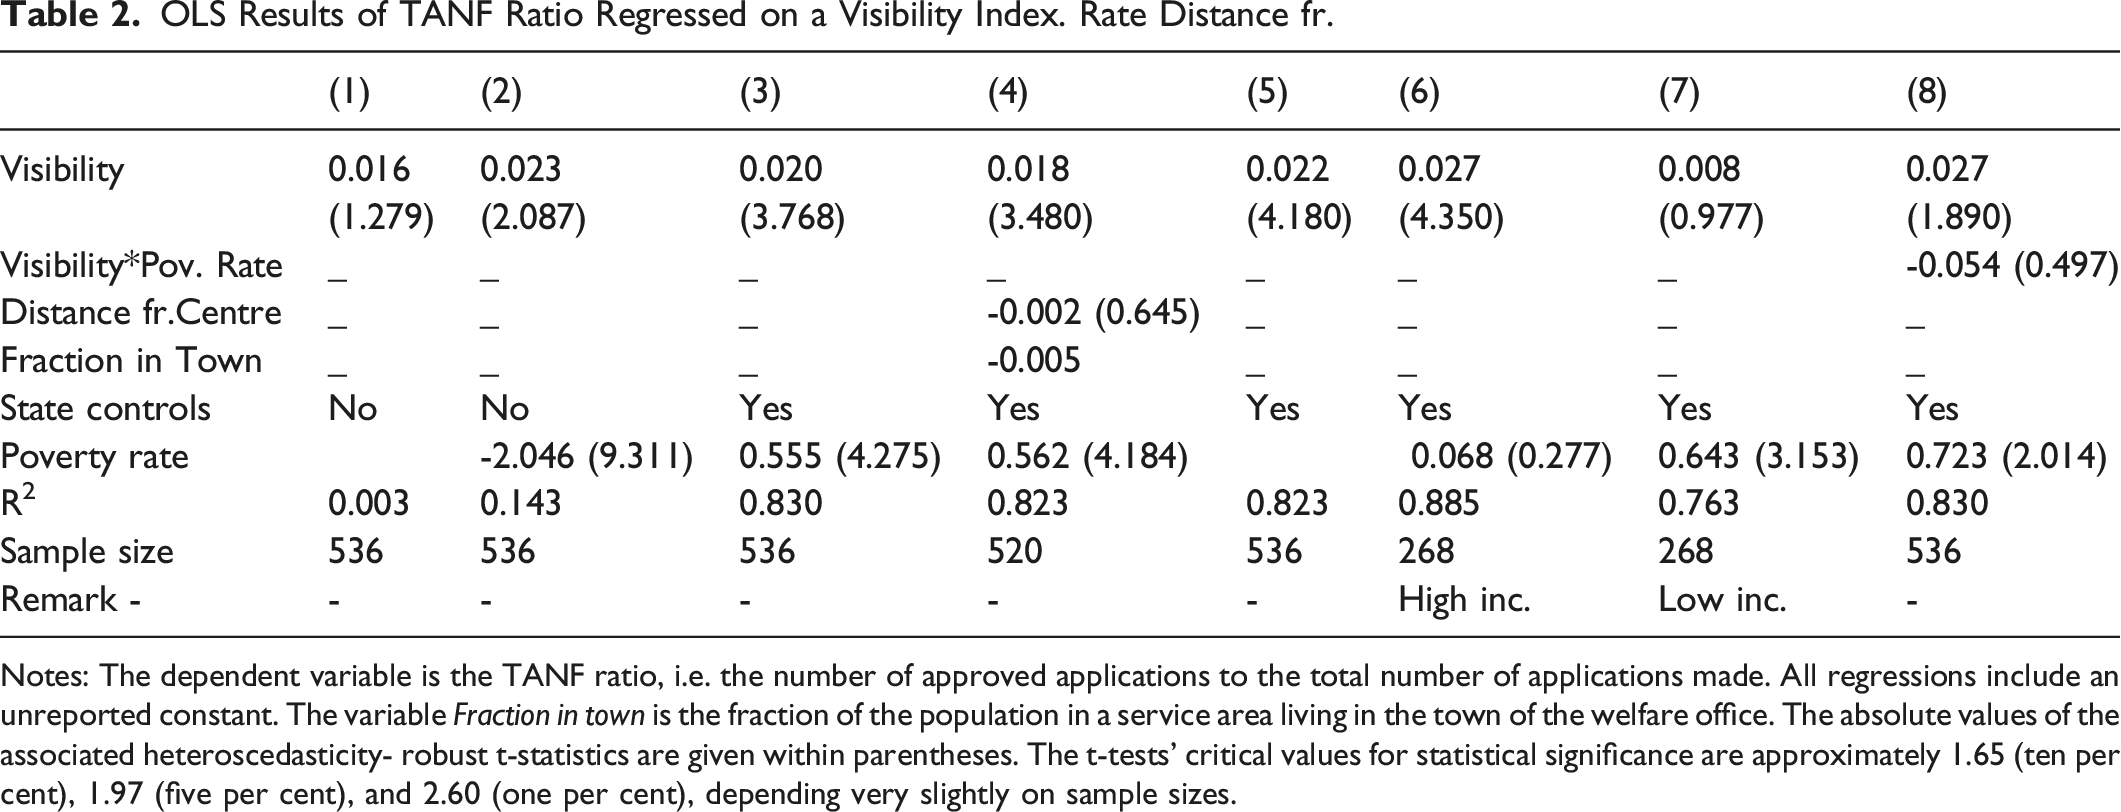
Notes: The dependent variable is the TANF ratio, i.e. the number of approved applications to the total number of applications made. All regressions include an unreported constant. The variable Fraction in town is the fraction of the population in a service area living in the town of the welfare office. The absolute values of the associated heteroscedasticity- robust t-statistics are given within parentheses. The t-tests’ critical values for statistical significance are approximately 1.65 (ten per cent), 1.97 (five per cent), and 2.60 (one per cent), depending very slightly on sample sizes.
Most economic norm theory predicts that the reluctance to be seen to apply for welfare benefits is reduced and perhaps eventually overturned when sufficiently few people are self-reliant. Such predictions are consistent with the present data if the coefficient of visibility is lower in comparatively low-income areas. Columns (6) and (7) of Table 2 present coefficients on visibility when only analysing the high-income and low-income subsamples, respectively, with the median county income ($39,872) serving as cut-off point. The much stronger association of visibility and conservative application behaviour in the higher-income subsample is consistent with the idea that the social disapproval of being thought of as a ‘welfare case’ is lessened the closer are one’s peers to be in the same position themselves (cf. Keizer et al., 2008; Celhay et al., 2022). The median approval rate in the poor half is 0.4, and 0.53 in the rich half.
Column (8) complements the subsample analysis by interacting the visibility index with the poverty rate. The county rate of poverty at which visibility-enhancing building characteristics go from repelling to attracting applicants is predicted to be around forty-two per cent, which is substantially higher than the 35.8 percent poverty rate found in the poorest sampled county. However, notice the low t- statistic on the interaction term. In the Supplementary material, Table IIIA reports additional results, consistent with Table 2, for the individual building characteristics.
Additionally, variables measuring the population of the county and town of the welfare office, the town’s population density, and the county’s racial composition are used in further regressions. Uniformly, including these variables fail to change the effect of the visibility variable, and their own coefficients are similarly less than noteworthy. When neighbourhood income, a geographically narrower measure of affluence, is included in regressions on only the Georgia subsample (N=148), the effect of visibility also stays the same. To conserve space, these results are not reported.
These are happenstance data and so it is possible that the observed association between visibility- enhancing building characteristics and conservative application behaviour is in reality caused by something else. If one can hold welfare offices constant while allowing applications to be made without physically appearing at a welfare office, the case for a causal effect would be stronger.
While the data do not allow such an ideal test to be made, application reforms in North Carolina and Oklahoma around 2010 at least go some way towards such an ideal. Between 2010 and 2013, North Carolinians could gradually complete certain welfare applications, and obtain information concerning all the state’s programmes, with the click of a mouse button using the online facility ePASS. Most notably, they could make entire SNAP applications (food stamps). Oklahomans could do the same during this period (make SNAP but not TANF applications), though there the reform was introduced all at once. According to the Oklahoman Department of Human Services, roughly 50-65 per cent of applications are made online on aggregate (these data are not available in disaggregated form).
The Effect on the TANF Ratio of Increased Online Application Possibilities.
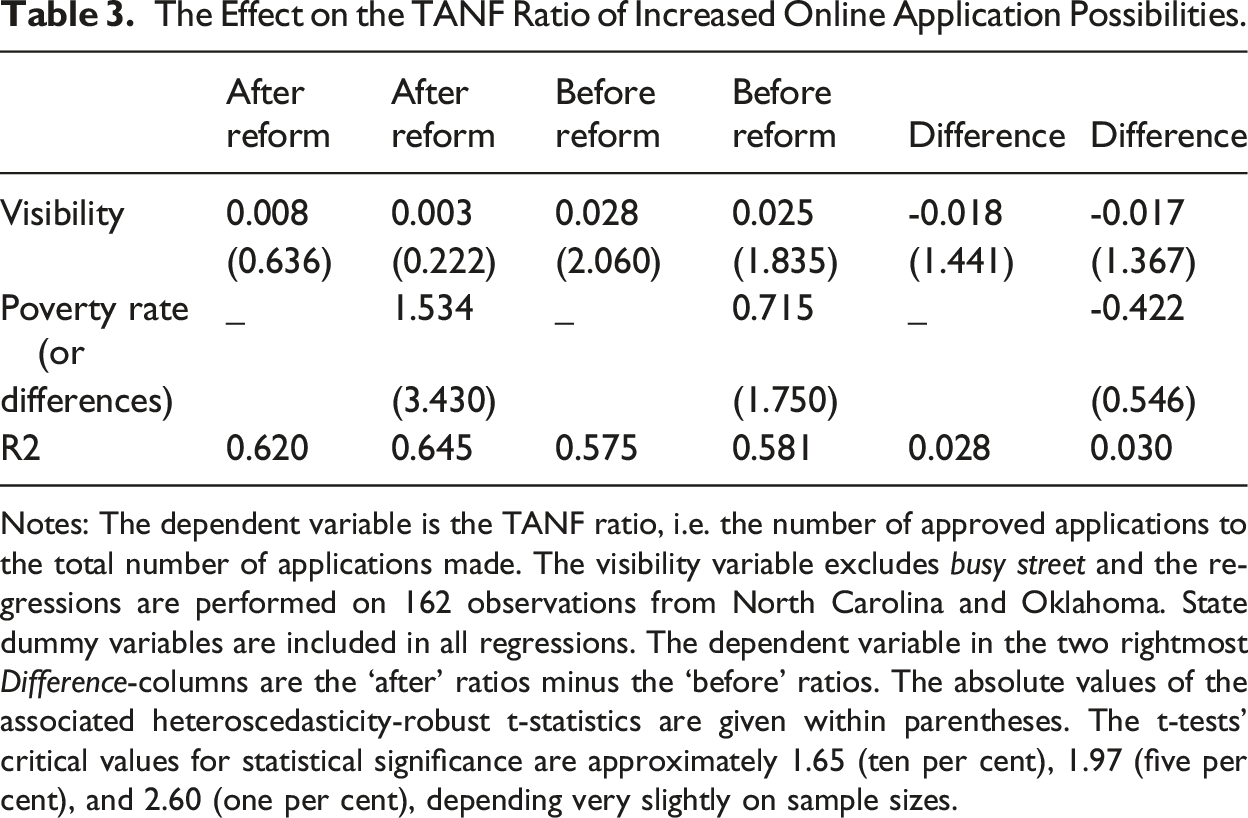
Notes: The dependent variable is the TANF ratio, i.e. the number of approved applications to the total number of applications made. The visibility variable excludes busy street and the regressions are performed on 162 observations from North Carolina and Oklahoma. State dummy variables are included in all regressions. The dependent variable in the two rightmost Difference-columns are the ‘after’ ratios minus the ‘before’ ratios. The absolute values of the associated heteroscedasticity-robust t-statistics are given within parentheses. The t-tests’ critical values for statistical significance are approximately 1.65 (ten per cent), 1.97 (five per cent), and 2.60 (one per cent), depending very slightly on sample sizes.
These developments need not make visibility-enhancing building characteristics unimportant, however, as people may find it less costly to incur social opprobrium than to navigate websites. Theoretically, there may be coefficient reductions or not, but there is no reason for the coefficients to increase. Table 3 shows before-and-after comparisons of the approval ratio for TANF payments in North Carolina (NC) and Oklahoma (OK), where ‘before’ means that the ratio is from 2011 (OK) or 2010 (NC), and ‘after’ means 2014 (OK), or July 2013-June 2014, with the exception of five counties instead sampled in 2013 (Jan.-Dec.) due to lack of available data for later months (NC).
The visibility variable is essentially zero after the introduction of ePASS or OKDHS Live and uniformly positive before. Subtracting the 2010 ratios from the ’13-’14 ones, as in the two rightmost columns of Table 3, reveals that the effect of visibility-enhancing building characteristics is reduced when online application facilities are made more readily available.
The results in Tables 2 and 3 are consistent with the literature on social influences on individuals’ behaviour. Additionally, the Supplementary material presents data broken down by visibility-enhancing building characteristic, in lieu of the above index (Tables IA-IIIA). Given that the individual building variables are all binary while the actual characteristics lie on a continuum, none of the dummies is likely to have a constant effect and the signs are more important than the exact magnitudes. Nevertheless, all the coefficients on the variables clearly tend to go in the hypothesized direction, and F-tests on their joint significance show statistical significance at the conventional levels.
Discussion
While very much consistent with established theories of social influences on individuals’ behaviour, these results are first and foremost correlations. Unfortunately, many good methods that strengthen identification are not available. Such methods might include looking at application behaviour in areas straddling service-area borders to determine whether similar neighbours who have to frequent different-looking welfare offices apply with different degrees of conservatism, or finding suitable instrumental variables. With data on application days, unusually foggy periods may exogenously impact visibility.
One potential source of bias is that TANF applicants may choose to move where welfare offices allow for least conspicuous entries. If those who are most certain of having their applications accepted are also most inclined to move, this force would lower the approval rate in sending service areas with many visibility-enhancing building characteristics. Since visibility is hypothesized to be associated with a high approval rate, this force would make welfare shame harder to detect in the present paper and so the results are likely an underestimate.
Another possible source of bias is that, contrary to official guidelines, certain service areas may be less well funded and thereby see an automatic decrease in the approval rate. While the funding a welfare office receives is implausibly reduced simply because it has few visibility-enhancing building characteristics, any chance tendency in that direction will cause the results to be overstated. This paper’s utilization of the move towards online welfare services withstands this potential source of bias to the extent that Internet-given anonymity eliminates the need for persons to physically appear at their welfare offices.
A potential problem with the dependent variable is that, if those who are least likely to be approved were also most susceptible to stigma, the mechanism would fail. Unfortunately, there appears to be only rather crude evidence on this issue. Celhay et al. (2022) find that welfare recipients report non-participation in welfare programmes at higher rates, but that the point estimate is halved upon controlling for household income, similar to findings by Bollinger and David (1997). Together, these findings suggest that feelings of shame do not decrease with the income of the welfare applicant. To the extent that unwillingness to report welfare programme participation indicates shame, the relationship is, if anything, the opposite.
Since some of the building characteristics are necessarily judgement calls, a further shortcoming with the present study is the difficulty of reproducing it. Doing so is in principle possible, but necessitates further judgement calls on building characteristics, 3 and searching for welfare office addresses on the websites of the relevant authorities.
The present study goes well with the established literature on peer effects. For instance, under the complementarities approach to peer effects (e.g. Becker and Murphy, 2000), one may think of two ways of gaining utility from consumption: with money obtained through social assistance, 𝑤, or work, 𝑒. To incorporate a social aspect to this setting, surviving on welfare can be considered a complement to a non-choice variable 𝑑 that captures average reliance on social assistance among one’s peers (as in Lindbeck et al, 1999), and v, which captures the visibility of making a welfare application. In the present analysis, visibility-enhancing building characteristics essentially shift the utility of relying on welfare payments. For low rates of welfare seeking (i.e. under a strong norm of self-reliance), the shift is to lower utility when inconspicuous entry is hard, and to higher utility when easy. The estimates from Section III suggest that the effect of visibility may be reversed in areas of particularly high poverty.
The utility equivalent of consumption with earned dollars may differ from that of dollars obtained from welfare payments. If an individual gains utility in this manner, his utility function is of the form
Similarly, the ‘demand’ function for living on welfare is affected by changes in visibility by
An exogenous increase in visibility lowers demand for welfare by more the more it raises the price- adjusted marginal utility of earning income relative to that of living on welfare. Ceteris paribus, this effect is greater for applicants whose chances of approval are relatively low, than it is for applicants with high chances of approval. The former’s substitution of time spent working for time spent seeking welfare (talking to caseworkers, meeting requirements for payments, etc.) proves their relative self- reliance and thereby their lesser need for assistance. Consequently, a rise in visibility will be accompanied by an increase in the acceptance-to-applications ratio.
Conclusion
It is not uncommon for famous individuals from poor backgrounds to tell stories from their childhood of how they would alight at bus stops adjacent to their nearest ones because they felt ashamed of where they lived. Similarly, popular culture will often depict establishments catering to prurient interests as located in sparsely-lit alleys where entry would be difficult to spot. Although the evidence in the present article comes from a different source of shame, it proposes that the picture painted by anecdotes like these is well-founded.
The present analysis also suggests analogous treatments of yet other activities which indicate, or are associated with, social stigma. Several avenues for further investigations suggest themselves. For instance, might the same effects be found in testing centres for social diseases, and do such clinics receive more clients if they are part of a general-practice surgery? Have self-service check-outs at supermarkets contributed to purchases of less salutary victuals? In the instances mentioned, visibility can plainly vary a great deal and status considerations are present, so these issues could have significant impacts on public health. The present article, too, is policy relevant in its relation to welfare ordeals.
Utilization of control variables, background information, and application reforms all yield results consistent with social influences on behaviour (see the Supplementary material for additional results); many individuals seem to be sufficiently sensitive to welfare stigma to affect the TANF approval rate. Minor architectural traits like corner entrances, a few steps leading up to the door, or an entrance located farther away from the street, are associated with more conservative applicant behaviour.
Also noteworthy is the result that a higher poverty rate is in line with weakly ‘normalizing’ welfare applications. These results are qualitatively less strong and statistically less significant than are the main ones. However, the overall thrust of the results suggests that the level of poverty is a complicating factor in individuals’ responses to welfare stigma. At any rate, buildings seem to be important also for reasons altogether different from giving shelter.
Supplemental Material
Supplemental Material - Buildings and welfare
Supplemental Material for Buildings and welfare by Mats Ekman in Rationality and Society
Footnotes
Acknowledgements
Special thanks to several administrators at welfare authorities across the US, as well as to Alexandra Stanczyk for practical advice on the workings of welfare offices while this project was at an early stage. Professors Ola Andersson, Fredrik Carlsson, John List, Topi Miettinen, Elias Oikarinen, Matti Sarvimäki, Rune Stenbacka, Barbara Wolfe, and two anonymous reviewers have also given very useful comments on this paper. The usual disclaimer applies.
Declaration of Conflicting Interests
The author declares no potential conflicts of interest with respect to the research, authorship, and/or publication of this article.
Funding
The author disclosed receipt of the following financial support for the research, authorship, and/or publication of this article: Svenska Litteratursällskapet i Finland.
Supplemental Material
Supplemental material for this article is available online.
Notes
References
Supplementary Material
Please find the following supplemental material available below.
For Open Access articles published under a Creative Commons License, all supplemental material carries the same license as the article it is associated with.
For non-Open Access articles published, all supplemental material carries a non-exclusive license, and permission requests for re-use of supplemental material or any part of supplemental material shall be sent directly to the copyright owner as specified in the copyright notice associated with the article.