
Abstract
Data collected through the National Expert Survey (NES) of the Global Entrepreneurship Monitor (GEM) are widely used to benchmark and assess the quality and impact of national entrepreneurial ecosystems. Based on a comprehensive analysis of the publicly available NES data, we show that the construct validity of the survey is not sufficient and that the experts differ so greatly in their evaluations of the entrepreneurial framework conditions (EFCs) in a country that meaningful cross-country and within-country (longitudinal) analyses are precluded. We conclude that the currently available NES data are not suited for motivating policy decisions.
Introduction
Several organizations release country-level indices of institutional conditions for entrepreneurship. Of prominence in entrepreneurship research are the indices and index-based rankings released by the Global Entrepreneurship Monitor (GEM), the Global Enterprise and Development Institute (GEDI), and the World Bank (WB). 1 Entrepreneurship researchers employ such measures in empirical models to analyze, for instance, the impact of the institutional context and the availability of local resources on new business activity, innovation, or business sentiment (De Clercq et al., 2013; De Jong et al., 2020), institutional drivers of gender inequality in entrepreneurship (Hechavarría et al., 2018; Thébaud, 2015), or the influence of business dynamics on hiring intentions (Haltiwanger et al., 2012).
The use of these indices of entrepreneurship conditions—and the rankings derived from the indices—is not limited to academic research. Financial institutions incorporate these indices in models quantifying country risk and in their investment decisions (Arnold & Jones, 2021; Høyland et al., 2012). Moreover, policymakers consider these rankings and year-to-year changes in them as important inputs for their policy- and decision-making (Amorós et al., 2013; Coote, 2011). For instance, the Jordanian Minister of Industry, Trade, and Supply recently noted: “Today, the government of Jordan recognizes the importance of the national GEM report as a leading global study aimed at improving the understanding of entrepreneurship and promoting evidence-based policy. Jordan in year 2019, had achieved the 34th rank globally in the early-stage entrepreneurship activity index, about (9.1%), while this index reached about (8.2%) and ranked 46th globally in year 2017. Accordingly, we look forward to the results of the GEM National Report and we are confident that its recommendations will help in designing and implementing new policy interventions that will eventually help achieve more growth and development in the small and medium enterprise (SME) sector in Jordan.” (Jordan Enterprise Development Corporation, 2020, p. 2). Policymakers often consider high rankings to be prestigious achievements: due to the suspicion of direct and indirect pressure to change the methodology of the Doing Business reports to boost China’s ranking, in September 2021, the World Bank Group even decided to discontinue these well-known reports (World Bank, 2021).
In this methodological note, we assess the psychometric validity of the National Expert Survey (NES) data of GEM to analyze the development of conditions for entrepreneurship across and within countries. Supplemental Appendix A1 reviews how the NES data are currently used by academic researchers and policymakers: academic researchers increasingly employ these data in empirical models, and there is abundant evidence that NES-based findings are used as important benchmarking and discussion tools by policymakers and journalists. However, using publicly available cross-sectional and longitudinal NES data, we show that the subjective nature of the survey responses precludes meaningful cross-country analyses and cross-country rankings. That is, while the responses of experts are internally consistent, the construct validity of the NES survey is not sufficient and the interrater reliability is inadequately low. While these shortcomings already preclude the meaningful aggregation of responses of experts at the country-level, the relatively low number of consulted experts also leads to considerably imprecise country-level measurements.
By applying a recently developed methodology (Mogstad et al., 2022) to the NES data, we further find that confidence sets for individual country ranks are very wide, and therefore, largely uninformative in separating countries by rankings. For example, in our 2018 analysis sample of 54 countries, the confidence set for the highest-ranking country (Indonesia) ranges from rank 1 to rank 22 for the composite National Entrepreneurship Context Index (NECI) while it ranges from rank 44 to rank 54 for the lowest-ranking country (Mozambique). Moreover, we show that the imprecision of NES data severely constrains the longitudinal assessment of within-country trends: for the vast majority of years, NECI scores for a particular country are not statistically distinguishable from the country’s long-term average.
Based on our assessment of the psychometric validity of the NES data, we conclude that these data are not suited for motivating policy decisions. In the Discussion section, we provide recommendations for redesigning the NES and future NES data collections.
Data
The GEM collects data through its Adult Population Survey (APS) and its NES. The APS focuses on information about the characteristics, motivations, and ambitions of individuals starting businesses, as well as social attitudes toward entrepreneurship, while the NES focuses on the context in which individuals start businesses. Most GEM-based academic studies draw on data from the APS (Álvarez et al., 2014). Here, we use the most recent publicly available data from the NES of the GEM (GEM Consortium, 2020b) as our main data source; these data have been gathered in 2018. 2 For the longitudinal analyses, we use publicly available NES data from 2007 to 2018. 3
Every year, each national team of GEM recruits at least 36 experts who rate nine Entrepreneurial Framework Conditions (EFCs) in their country (at least four experts evaluate each EFC). Three of these EFCs have two sub-conditions, resulting in 12 EFCs in total. An overview of these conditions is available in Supplemental Table A1 in the Appendix. In total, the national experts respond to 54 questions, using a 9-point anchored Likert scale ranging from “Completely false” (1) to “Completely true” (9), regarding the sufficiency of aspects of the 12 EFCs in their country. 4 The first survey item, for instance, reads “In my country, there is sufficient equity funding available for new and growing firms.” So, the respondents are asked to evaluate the sufficiency of a condition for entrepreneurship within a particular country. Thus, although the Likert scales are anchored, their anchoring is ambiguous due to the absence of a clear definition of “sufficiency” and their country-specificity: “National experts in a particular developed economy, for example, may have a very different view of sufficiency from national experts in a much less-developed economy” (Bosma et al., 2021, p. 77). We address this issue in more detail in Section “Discussion.”
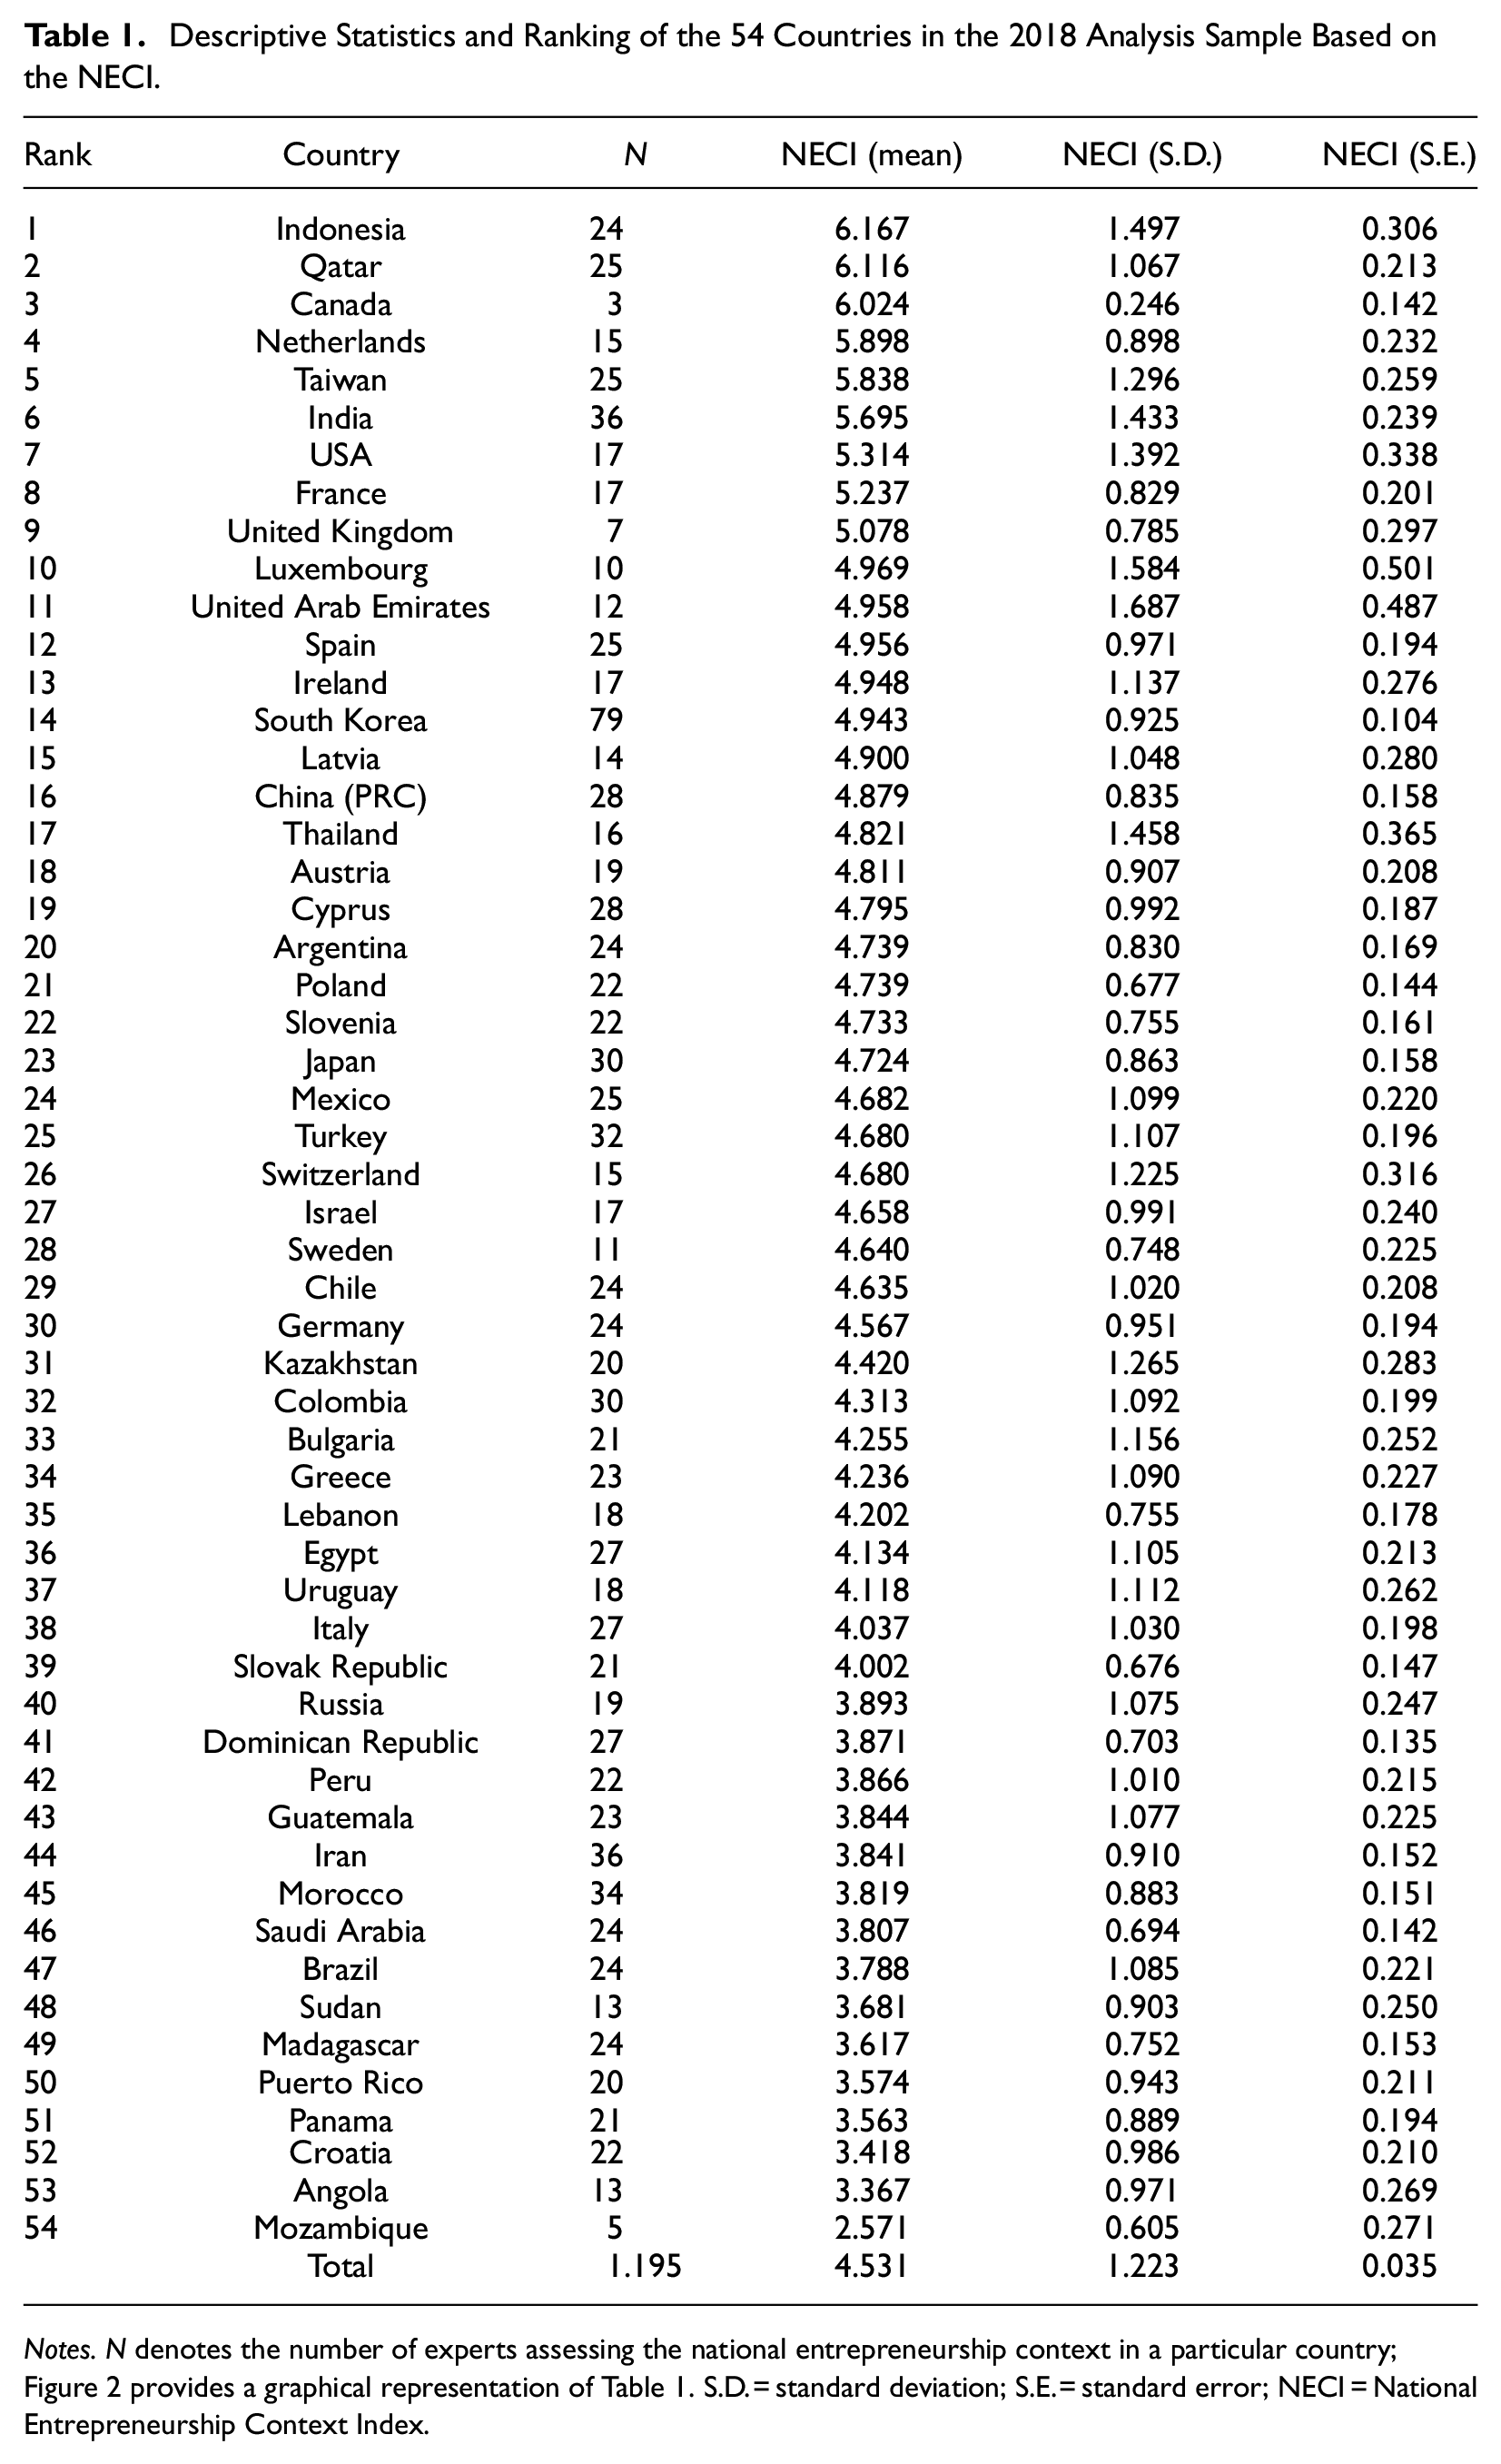
GEM calculates an expert’s score for a particular EFC as the first principal component of the responses given to the relevant survey items. These scores are directly available in the public releases of the GEM data, and we use these principal components in our analyses. Recently, in the 2020/2021 report, GEM introduced the NECI as a composite indicator that represents the average state of the entrepreneurial environment; it is calculated as the arithmetic mean of the 12 EFC scores (GEM Consortium, 2020a). 5 We follow this procedure to construct NECI in the earlier NES data releases used in this study. Table 1 contains the descriptive statistics of the 2018 analysis sample (Supplemental Table A2 in the Appendix contains the descriptive statistics for all 12 EFCs). In total, there are responses from 54 countries in the data. Due to missing responses on one or more survey items, there are 1,195 observations for the NECI measure. Thus, on average there are approximately 22 responses from experts per country that can be used to construct NECI. In Table 1, a country’s ranking reflects the mean score for NECI. While finding Mozambique at the bottom of the ranking may not be so surprising, we think it is somewhat surprising to find Indonesia at the top (cf. its rank in the 2018 Global Entrepreneurship Index [GEI] from GEDI [Acs et al., 2017] is 946). In Section “Precision” we will look specifically at the precision of this ranking.
Descriptive Statistics and Ranking of the 54 Countries in the 2018 Analysis Sample Based on the NECI.
Empirical Results
To psychometrically assess the NES data, we look at the construct validity of the survey (Section “Construct Validity”), the internal reliability and interrater reliability of the responses (Section “Internal Reliability and Interrater Reliability”), and the precision of the country-level aggregates both from a cross-country and longitudinal (within-country) perspective (Section “Precision”).
Construct Validity
GEM’s national experts evaluate 54 survey items about the sufficiency or otherwise of an aspect of the entrepreneurial ecosystem. The survey items in the NES are organized by EFC (Supplemental Table A1), and together the respective items are supposed to reflect a specific underlying construct. For example, the eight survey items for entrepreneurial finance (EFC A) should capture the variance in the availability of financial resources—equity and debt—for SMEs (including grants and subsidies).
Confirmatory Factor Analysis (CFA) can be used to test the factor structure of the survey items and whether they indeed reflect the EFCs and NECI as underlying constructs. CFA in the 2018 data using the 54 survey items as reflecting the 12 EFCs shows that the fit between the measurement model and the data is borderline acceptable (χ2(1,311) = 5599.175, p < .05, CFI = 0.898, RMSEA = 0.052, SRMR = 0.051). Of the 54 survey items, 10 have a standardized factor loading below 0.70. When we add NECI as latent construct reflecting the 12 EFCs to the measurement model, we find a poor fit between the model and the data (χ2(1,431) = 43340.349, p < .05, CFI = 0.822, RMSEA = 0.068, SRMR = 0.130). 7 A measurement model for NECI based on only the 54 survey items (without the 12 EFCs as latent variables) also yields a poor fit (χ2(1,311) = 21457.745, p < .05, CFI = 0.521, RMSEA = 0.111, SRMR = 0.090). Therefore, while the construct validity of the EFCs seems borderline acceptable, that of NECI is insufficient 8 and it, therefore, seems psychometrically unwarranted to use NECI as a unidimensional construct reflecting the overall conditions for entrepreneurship in a country.
Internal Reliability and Interrater Reliability
The experts’ responses to the survey items for a particular EFC should be intercorrelated as together the survey items are supposed to reflect a specific underlying condition for entrepreneurship. This so-called internal consistency of the responses can be assessed using Cronbach’s alpha. In the 2018 data, Cronbach’s alpha ranges between .79 (EFC B2) and .93 (EFC G1) for the 12 EFCs, evidencing that the internal reliability of the measurements is (sufficiently) high. With GEM (GEM Consortium, 2020a) we, therefore, conclude that the experts responding to the NES rate the items internally consistent. Cronbach’s alpha can also be calculated for NECI, either based on the 54 survey items directly (.96) or based on the 12 EFC (principal component) scores (.88). Both calculations suggest that the internal consistency of NECI is high and that the items can be used to construct an adequate measure of an underlying construct.
However, the construction of the EFCs and NECI involves the aggregation of responses. Interrater reliability is the extent to which different experts are consistent in their judgments and therefore captures the extent to which the evaluations reflect the same underlying constructs. Some earlier studies have already suggested that cognitive divergence among the various types (e.g., entrepreneurs, policymakers, and investors) of experts may lead to different ratings (Correia et al., 2016; Lee & Wong, 2004; Pfeifer et al., 2021). Similarly, using a linear regression controlling for country fixed effects, we also find that in the 2018 data the NECI scores of entrepreneurs are significantly lower (.30) and those of policymakers are significantly higher (.18) than the average score.
Given the continuous nature of the EFCs and NECI, we computed the interrater reliability as the intraclass correlation coefficient (ICC) from a one-way random-effects model. Strikingly, the ICC ranges from .16 (EFC D2) to .33 (EFC A) for the EFCs; For NECI, it equals 0.30. To verify that these estimates are not driven by the relatively low number of experts in some countries, we duplicated the data 10 times. In this expanded data set, the interrater reliabilities are only marginally higher (e.g., 0.33 for NECI), suggesting that the main estimates mostly reflect disagreements across raters. When we focus on the countries with the highest rank (Indonesia) and the largest number of experts (South Korea), it is evident that evaluations indeed vary greatly among experts (Figure 1). While the mean rating is 6.17 in Indonesia, the scores range from 2.81 to 7.92. In South Korea, the mean rating is 4.94 and the minimum and maximum scores are respectively 2.72 and 7.97. We, therefore, conclude that the interrater reliability of the NES survey is too low and that the responses of experts are too inconsistent to be considered meaningful representations of underlying constructs.
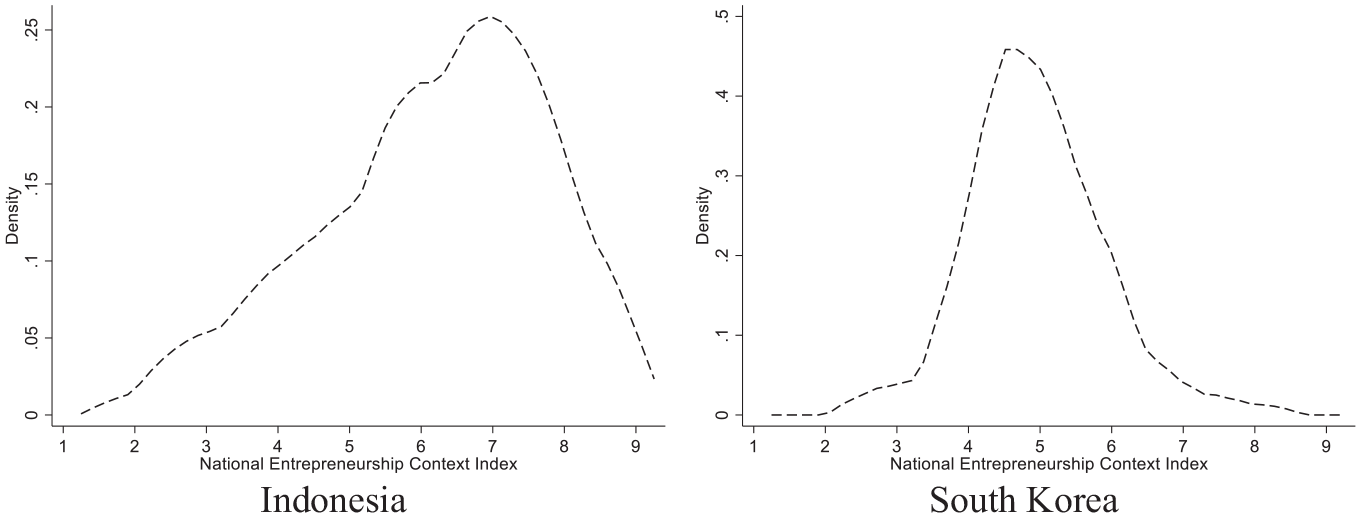
Kernel density plots of the distribution of expert evaluations of the 2018 national entrepreneurship context in Indonesia (#1, 24 experts) and South Korea (#14, 79 experts).
Precision
In line with the low interrater reliability, it is evident from the standard deviation and standard error of the country-level means that the country-level EFC and NECI scores are imprecise. For example, Table 1 shows that for the country with the highest rank (1), Indonesia, the mean score of 6.167 is based on the responses of 24 experts. As a result, the standard error of the mean score is relatively large, that is, 0.306. Thus, the 95% confidence interval of Indonesia’s NECI score overlaps with the mean scores of the countries ranking 2 to 6 (Qatar, Canada, the Netherlands, Taiwan, and India). Figure 2 visualizes the same 95% confidence intervals for all countries in the 2018 data and shows that for all countries the means are relatively imprecisely estimated. It is, therefore, not very surprising that in 2018 the correlation between the NECI score and the Doing Business score of the WB is only 0.53 (p < .001). The correlation with GEDI’s GEI is .60 (p < .001). While these measures may also not perfectly capture conditions for entrepreneurship in a country, the imperfect correlations are likely to be partially driven by the impreciseness of NECI.
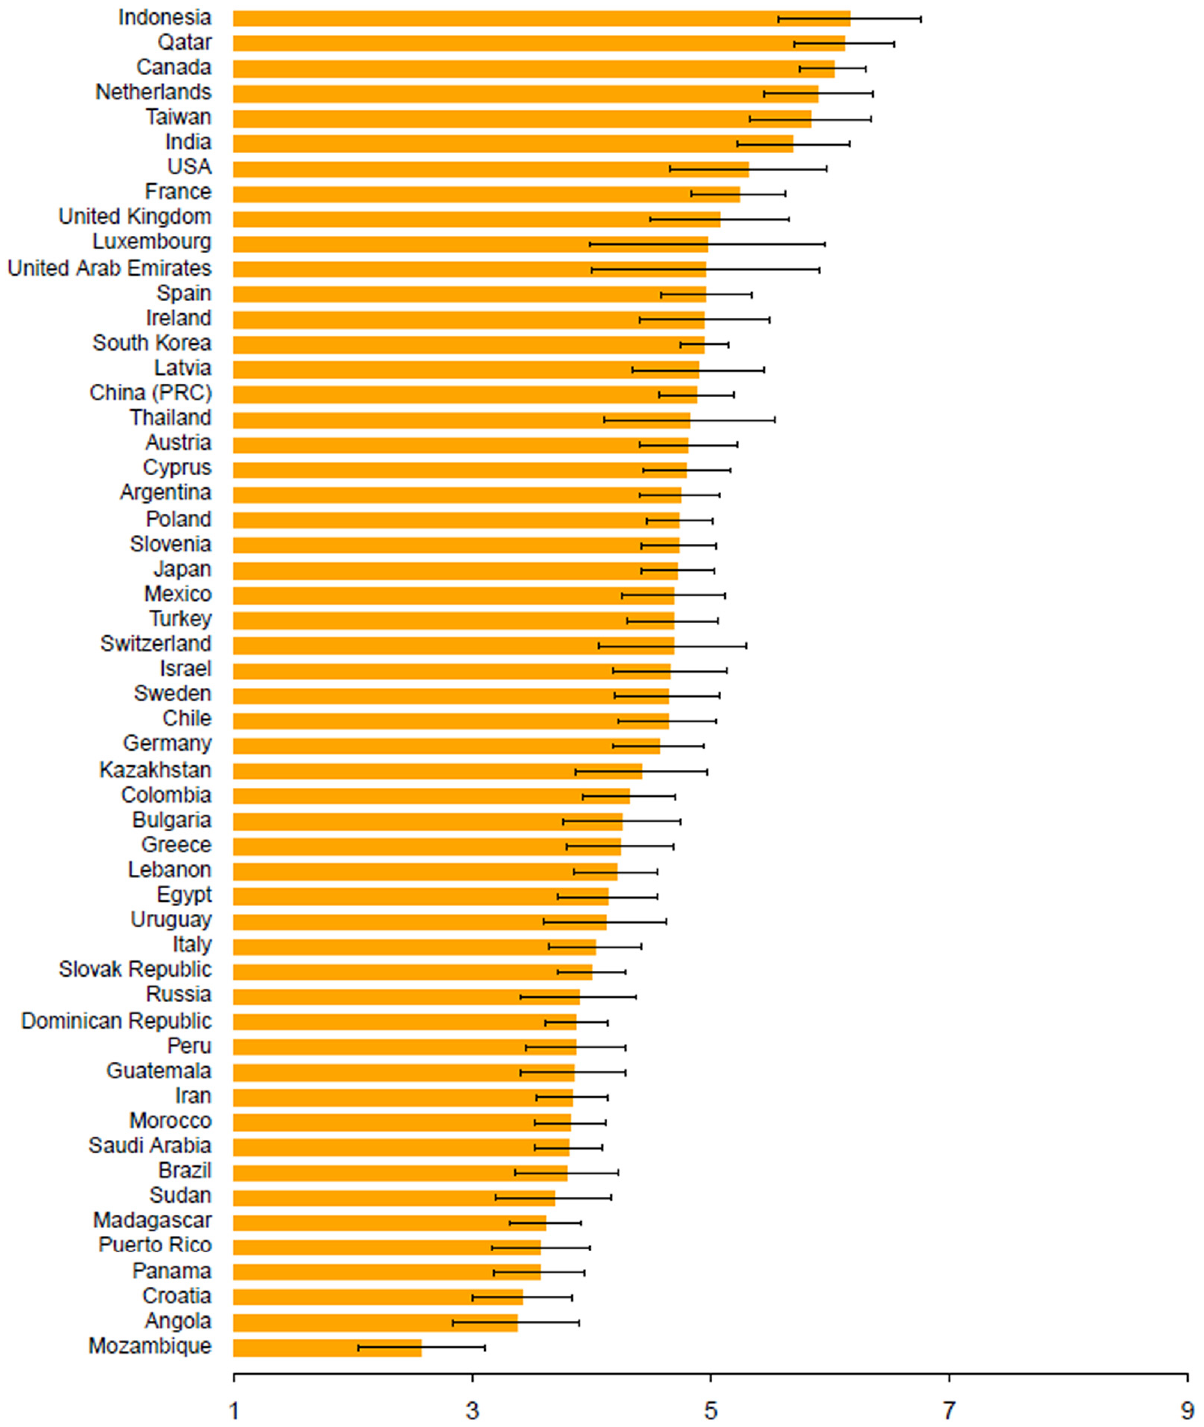
Mean score (with 95% confidence interval) of the NECI for the 54 countries in the 2018 analysis sample.
In Table 1, we ranked countries based on their mean score for NECI. Such a ranking is an important part of the yearly GEM reports but ignores the imprecision of the mean scores. Recently, Mogstad et al. (2022) developed a methodology to derive confidence sets for rankings that account for the uncertainty surrounding the estimated mean scores. The goal of this methodology is to construct confidence sets that contain the ranks of all countries with a probability approximately not less than some pre-specified level (e.g., 95%). To construct simultaneous confidence sets for the ranking of all 54 countries, one first needs to compute the difference in mean NECI estimates for all pairwise combinations of countries. The confidence set for a country (e.g., Indonesia) is the product of these (54 minus 1=) 53 differences such that the probability of it simultaneously covering all differences is at least 95%. The bounds for the simultaneous confidence sets depend on quantiles from the distribution over the maximum of the estimated differences and can be obtained using bootstrap. 9 Then, given the simultaneous confidence sets, the ranking is determined by how many confidence sets for a particular country lie above and below zero (because a difference of zero would indicate no difference in mean score). For a detailed description of the methodology, we refer readers to Mogstad et al. (2022).
Figure 3 visualizes the results of this procedure for the countries in the NES data of GEM 2018. While Indonesia ranks 1, its confidence set indicates that Indonesia ranks with 95% certainty between ranks 1 and 22. When we look at the bottom of the ranking, we see that the rank of Mozambique is between 44 and 54 with 95% certainty. While this is clearly at the lower end of the distribution, Mozambique is only 1 of the 11 countries with rank 54 in its confidence set. Similar plots for each of the 12 individual EFCs are available in the Supplemental Appendix (Figures A1–A12). Also, for each EFC, we find large imprecision of individual country rankings.
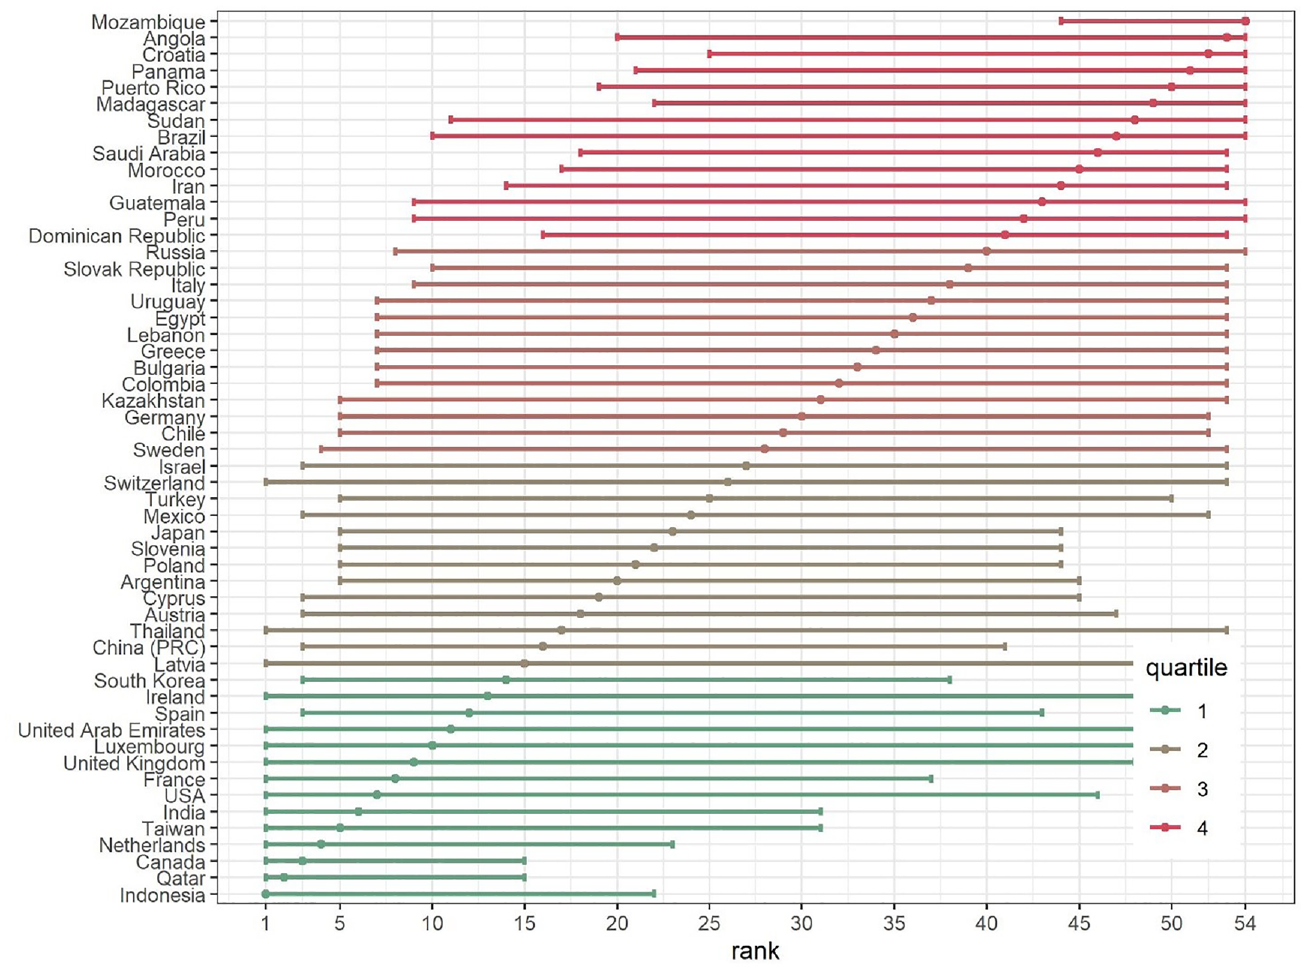
Ranking of the 54 countries participating in the GEM 2018 based on the NECI (with 95% confidence sets).
As a final step, we analyze the implications of the impreciseness of the country-level scores for assessing the development of NES-based measures within a country over time. Importantly, a longitudinal analysis within a single country is not hampered by possible different perceptions of “sufficiency” across countries (Bosma et al., 2021). Figure 4 shows the development of NECI in the seven countries that have complete information on it for the years 2007 until 2018.
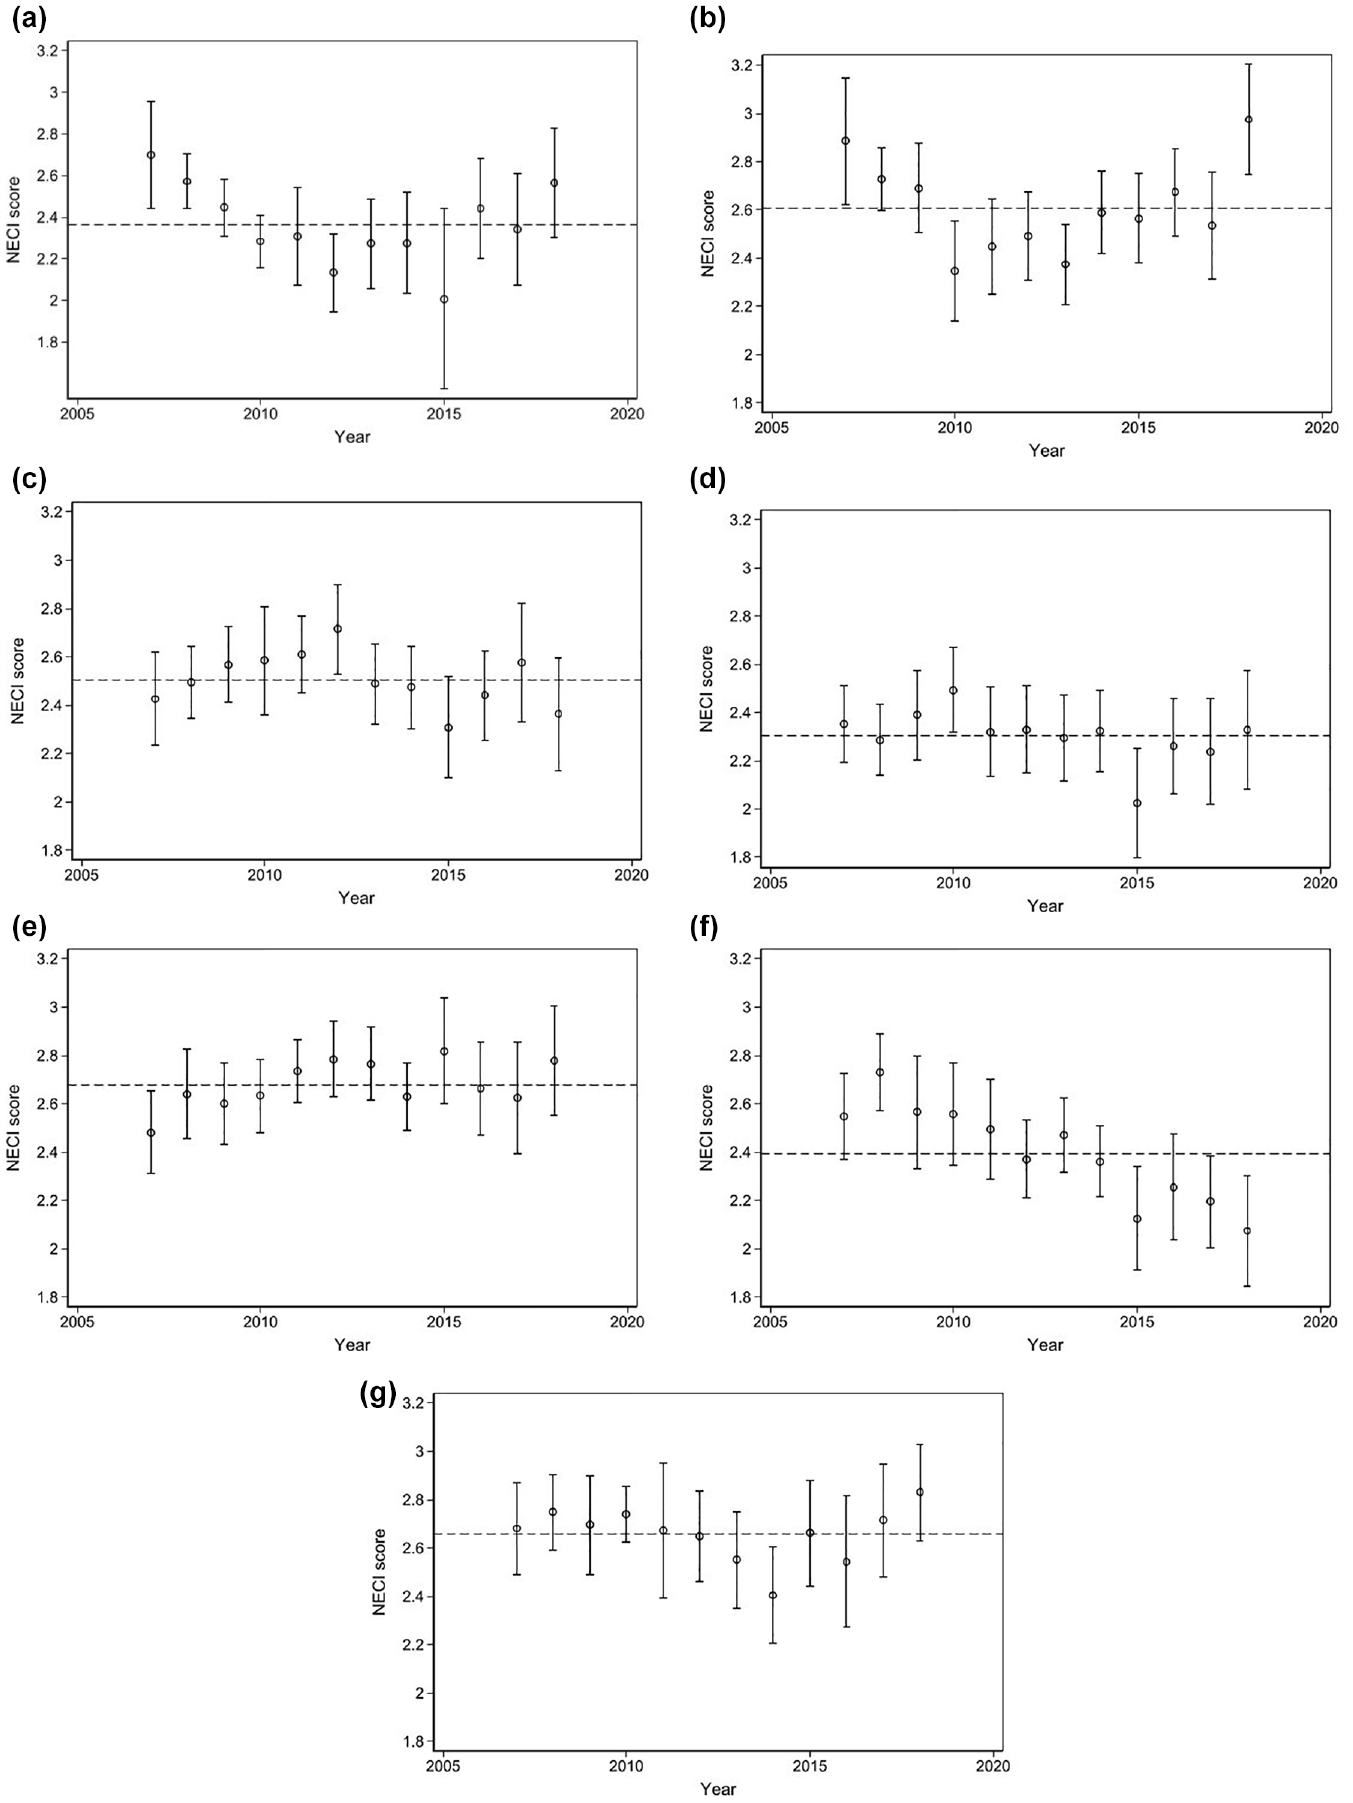
The development of the NECI (5-point scale, with 95% confidence intervals) in the period 2007 to 2018 for the seven countries with complete information (the dashed line represents the mean NECI score in the analyzed period): (a) Greece, (b) Spain, (c) Peru, (d) Brazil, (e) Chile, (f) Croatia, and (g) Slovenia.
It is noteworthy that from the (7 × 12 =) 84 data points in Figure 4, only 16 are significantly different from their respective country mean at the 95% confidence level. The deviation of these data points from the country means is usually very small. Importantly, in none of the countries the NECI score in a particular year can be statistically distinguished from the NECI score in the subsequent year, clearly showing that there is limited value in interpreting year-to-year changes in the NECI scores when properly accounting for uncertainty. 10
Discussion
For over 20 years, the NES of the GEM provides data to benchmark and assess the quality and impact of national entrepreneurial ecosystems. The empirical analyses in this study indicate, however, that the construct validity of the EFCs in the NES is questionable while that of the NECI is insufficient. Although the internal reliability of the measurements is high, the evaluations of the national experts differ greatly (poor interrater reliability). The evaluations of the experts are sufficiently inconsistent to question that they are meaningful representations of underlying constructs.
On top of that, the imprecision of the country-level NES data severely prohibits meaningful cross-country comparisons. Country-level studies currently use the country-level NES data while implicitly assuming the reliability of the underlying EFC or NECI constructs and the precision of their measurements (e.g., De Clercq et al., 2013; Hechavarría et al., 2018). As a result, the inferences from these studies are overprecise. Moreover, the imprecision (measurement error) of the variable of interest (the EFC or NECI) is most likely correlated with the true value of the construct, with the true values of other variables in the regression model, or with the errors in measuring those values. Such endogeneity will lead to bias in the estimation of the coefficient, and the bias will be downward or upward depending on the association between the measurement error in the variable of interest variables and the other variables included in the model (Bound et al., 2001; Hausman, 2001). With a varying number of experts per country who probably differ in how they perceive a condition for entrepreneurship to be sufficient or insufficient in their country (Bosma et al., 2021), it does not seem justified to continue with regression-based cross-country analyses using the currently available NES data.
The nature of expert evaluations will always be subjective, but the low level of interrater reliability suggests that the current NES questionnaire needs to be redesigned to serve its purpose. Experts may have diverging views of what “sufficiency” means, even within a country. Therefore, we recommend GEM to adopt less ambiguous, more tangible, and globally applicable vignettes (Alexander & Becker, 1978) in the questionnaire. Currently, the national experts respond to survey items about the sufficiency of conditions for entrepreneurship in their country using a 9-point anchored Likert scale ranging from “Completely false” (1) to “Completely true” (9). The anchoring of end-points on this response scale is ambiguous due to the absence of a clear definition of “sufficiency” and the country-specificity. Resolving this ambiguity will be an important step toward improving the psychometric validity of the NES data. We further recommend GEM to be more transparent about the imprecision of NES-based estimates, for example, by including standard errors of country-level aggregates in the public data releases and by including confidence intervals in data visualizations. This will help researchers and policymakers to present and consider cross-country comparisons and within-country longitudinal trends with a more adequate level of precision.
Rankings are currently an important part of the yearly GEM reports, but these are bound to be misinterpreted when not taking into account the psychometric validity of the measured constructs and the uncertainty in these rankings. This is particularly problematic, because the “tyranny of international index rankings” (Høyland et al., 2012) may lead to the misallocation of resources. For example, high rankings may suggest efficacious country-specific resources and activities around entrepreneurship, and therefore, policymakers in higher-ranked countries may expect high returns from investments in entrepreneurship programs. As a consequence, policymakers in countries or regions in the upper ranks may decide to turn their attention to other high-priority non-entrepreneurship areas, leaving large policy blind spots in entrepreneurship-related policymaking. When accounting for ranking uncertainty using the methodology recently developed by Mogstad et al. (2022), the ranking of countries based on the NES of the GEM appears to be largely illusory: the confidence sets are wide and tend to span many ranks for each specific country. As such, year-to-year changes in the ranking of a particular country based on NES data cannot be interpreted as structural changes. 11 Therefore, if GEM wants to maintain country rankings in their future reports, it is advised to adopt Mogstad et al. (2022)’s methodology or similar methodologies to report rankings with an adequate level of precision. The confidence sets may reduce the plausible “arms race” based on differences in rankings that may not be statistically different.
Conclusion
The widespread release of indices and rankings to quantify entrepreneurial activity and conditions for entrepreneurship facilitates straightforward cross-country and longitudinal comparisons for policymakers and the general public. Among the various indices, the EFCs and the NECI as developed by the GEM and assessed through its NES are of prime importance for researchers and policymakers. Based on psychometric analysis of the NES data, we, however, show that the quality of the NES data currently precludes meaningful cross-country analyses and cross-country rankings. The limited precision of the data also hampers the longitudinal assessment of within-country trends. While it may be worthwhile to assess the opinions of experts about conditions for entrepreneurship in a country to quantify the environment in which individuals start their businesses, the NES questionnaire needs modifications before it can be used again to collect meaningful data.
Supplemental Material
sj-docx-1-etp-10.1177_10422587221134928 – Supplemental material for A Critical Assessment of the National Expert Survey Data of the Global Entrepreneurship Monitor
Supplemental material, sj-docx-1-etp-10.1177_10422587221134928 for A Critical Assessment of the National Expert Survey Data of the Global Entrepreneurship Monitor by Cornelius A. Rietveld and Pankaj C. Patel in Entrepreneurship Theory and Practice
Footnotes
Acknowledgements
The authors thank Paul Reynolds for his constructive feedback on the rationale and results of this study.
Declaration of Conflicting Interests
The author(s) declared no potential conflicts of interest with respect to the research, authorship, and/or publication of this article.
Funding
The author(s) received no financial support for the research, authorship, and/or publication of this article.
Supplemental Material
Supplemental material for this article is available online.
Notes
Author Biographies
References
Supplementary Material
Please find the following supplemental material available below.
For Open Access articles published under a Creative Commons License, all supplemental material carries the same license as the article it is associated with.
For non-Open Access articles published, all supplemental material carries a non-exclusive license, and permission requests for re-use of supplemental material or any part of supplemental material shall be sent directly to the copyright owner as specified in the copyright notice associated with the article.