
Abstract
The vCell 5 (scil Animal Care), a point-of-care hematology analyzer (POCA), was recently introduced to veterinary laboratories. This laser- and impedance-based analyzer is capable of providing a CBC with 5-part WBC differential count (Diff) along with WBC cytograms and flags serving as interpretation aids for numerical results. We compared the scil POCA-Diff to reference methods (i.e., manual differential count, Advia 2120 hematology analyzer [Siemens]) for canine and feline blood samples and considered WBC cytograms and flags. Total observed error (TEo), calculated from CV and bias%, was compared to total allowable error (TEa). Data were analyzed before and after a review process (exclusion of flagged and samples with invalid cytograms). For both species, correlation was good-to-excellent (rs = 0.81–0.97) between both analyzers for all variables, except for feline monocytes (rs = 0.21–0.63) and canine monocyte% (rs = 0.50). Smallest biases were seen for neutrophils (dog: −5.7 to 0.8%; cat: 1.5–9.4%) with both reference methods. Quality requirements (TEo < TEa) were fulfilled for canine and feline neutrophils (TEo = 5.3–10.6%, TEa = 15%) and eosinophils (TEo = 67.1–83%, TEa = (90)–50%) considering at least one reference method. Our review process led to mildly higher rs-values for most variables. Although not completely satisfactory, the scil POCA provides reliable results in compliance with ASVCP quality goals for canine and feline neutrophils and eosinophils. Analyzer flag and cytogram analysis served as useful tools for QA, indicating the necessity for manual review of blood smears, and contributed to improvement of scil POCA performance.
The laser-based point-of-care hematology analyzers (POCAs) on the veterinary market are capable of performing 5-part WBC differential counts (Diffs) and displaying the results numerically and graphically as analyzer-specific cytograms. The Diff, as part of the CBC, provides helpful and relevant information about a patient’s state of health and can indicate the need for further diagnostic or therapeutic measures if there is evidence of inflammatory, infectious, immune-mediated, neoplastic, or endocrine disease.36,55 Thereby, the Diff not only serves as a diagnostic procedure but is part of disease monitoring and might help to predict patient outcome.13,24 The automated Diff enables the analysis of thousands of cells per sample, thus overcoming the inherent imprecision of the manual Diff. Generally, the automated Diff is considered reliable for counting frequently occurring cell populations and is performed not only by large benchtop hematology analyzers but also by in-house analyzers.16,17,52
Given that the Diffs from veterinary hematology analyzers provide only limited information about cell morphology and are often unable to reliably classify abnormal or immature cells, the examination of a high-quality blood smear by well-trained examiners is often indispensable to verify automated results.11,54 The indications for manual review of blood smears are variable. First, microscopic evaluation of a blood smear is required to verify unexpected, highly abnormal results obtained with the automated analyzer, such as extreme increases or decreases of individual WBC populations. Second, evaluation of a blood smear is indicated if the analyzer’s cytograms suggest misclassification of cells or morphologic flags are present.1,11,12,15 Importantly, to save resources (time, costs, personnel) and increase the productivity and quality of the veterinary laboratory workload, manual review of blood smears and differential counting should be used as a validation tool rather than a substitute for automated results of the Diff.37,54 Further improvement of productivity could be achieved by automated image analysis systems recently introduced to veterinary markets, considered to be a valuable alternative to the traditional manual method of blood smear examination and differential counting.2,11,57
Given that the microscopic examination of blood smears is labor-intensive and time-consuming, the challenge in veterinary and human laboratories is to reduce the number of films examined without missing important diagnostic information by critical review of cytograms and analyzer flags. 11 Cytograms, routinely provided by laser-based hematology analyzers, are considered an important screening tool to detect abnormal or immature cell populations as well as abnormal distribution or indistinct separation of WBC populations, which can lead to misclassification of cells and discrepancies with numerical results.25,26,54 However, the review of automated cytograms requires in-depth expertise in clinical pathology and analyzer measuring technique; morphologic analyzer flags based on software algorithms can help decide whether a manual review of a blood smear is necessary.37,54 Unfortunately, information is limited about the diagnostic performance of automated flagging to detect abnormal or immature cells or abnormal WBC distribution in cytograms in veterinary medicine.8,21,27,56 Some studies have concluded that, compared to manual review of cytograms, WBC flagging was insufficient for the detection of abnormal WBC distribution in cytograms.
The POCA hematology system iVet 5 (Norma Instruments), distributed in Europe as scil vCell 5 (hereafter, scil POCA; scil Animal Care), was introduced as a laser-based, cost-effective alternative to the laser-based in-house analyzers currently available and commonly used in veterinary practice. We have compared standard hematologic parameters of the CBC (i.e., WBC count, RBC count, RBC parameters, and platelet [PLT] count) obtained by the scil POCA with results obtained by manual and automated reference methods. 62 Except for calculated variables, the scil POCA fulfilled quality requirements recommended by the American Society for Veterinary Clinical Pathology (ASVCP). 44
Limited information is available on the accuracy of the scil POCA Diff (POCA-Diff; i.e., neutrophils [NEU], lymphocytes [LYM], monocytes [MON], eosinophils [EOS], and basophils [BASO]). 62 Therefore, we evaluated the scil POCA-Diff in dogs and cats including 1) a method comparison study assessing correlation, agreement, and acceptability by comparing the POCA-Diff with the Advia 2120 hematology analyzer (Siemens) Diff (Advia-Diff) and a manual 200-cell Diff (M-Diff), serving as reference methods, and 2) the assessment of software adaptations, and the analyzer’s WBC cytograms and flagging options regarding their clinical usefulness as quality assurance (QA) tools. The accuracy of the Advia-Diff has been reported for dogs and cats, thus justifying its use as a reference method in our study.7,16,57 The M-Diff was performed utilizing a digital microscope with digital image analysis technology (DM1200; CellaVision), which has been demonstrated to be a suitable alternative to manual microscopy. 57 For further technical details of the CellaVision DM systems, the reader is referred to the relevant literature.11,14
We hypothesized that the scil POCA fulfills recommended quality requirements 44 for most variables of the Diff, especially for common WBC populations, and that cytograms and automated flagging by the analyzer serve as a QA tool and interpretation aid for Diff results.
Material and methods
Study design
Our study design was in accordance with the recommended guidelines for assessing agreement between methods, 33 and included samples from the population of interest (dogs and cats with a wide spectrum of hematologic alterations) with an appropriate sample size, as commonly chosen by authors of instrument validation studies in veterinary hematology. 26
We performed our prospective study between December 2018 and October 2019. We included fresh anticoagulated (K3-EDTA) blood samples from 192 healthy and diseased dogs and 159 cats submitted to the central laboratory, Department of Veterinary Clinical Sciences, Clinical Pathology and Clinical Pathophysiology, Justus-Liebig-University (Giessen, Germany). The study population included diseased animals that had been presented to the medical and surgical service of the small animal clinic of Justus-Liebig-University with various disease conditions, associated with specific hematologic alterations, especially concerning the Diff (significant leukocytosis; neutrophilia with or without left shift; lymphocytosis with or without reactive lymphocytes or circulating immature lymphocytes, monocytosis, and eosinophilia). The percentage of samples obtained from healthy animals (i.e., blood donors or routine health checks) was limited to a maximum of 25%. Inclusion criteria were the availability of a Diff performed with the Advia 2120 analyzer and the scil POCA, as well as a high-quality blood smear for each sample. Samples with macroscopic clots and incomplete datasets were excluded.
Our study was approved by the competent authority (Regierungspräsidium Giessen, Dezernat 54, Wetzlar, Germany; file V 54-19 c 20-15 [1] GI18/17). Given that we analyzed residual blood samples of canine and feline patients, our study was not classified as an animal experiment according to the German Animal Welfare Act (§7).
Our study consisted of 2 parts: 1) a method comparison study, assessing correlation and agreement of the Diff obtained with the scil POCA compared to reference methods and evaluating the acceptability of results with respect to the recommended quality goals (analysis I; Fig. 1); 2) a review (analyses II, III; Fig. 1) and re-analysis process (analysis IV; Fig. 1), assessing the impact of excluding samples flagged by the analyzer, indicating invalid Diff (analysis II), excluding samples considered to have a potentially invalid Diff based on manual review of WBC cytograms (analysis III), and re-analysis of data with a revised software version provided by the manufacturer (analysis IV) on statistical variables.
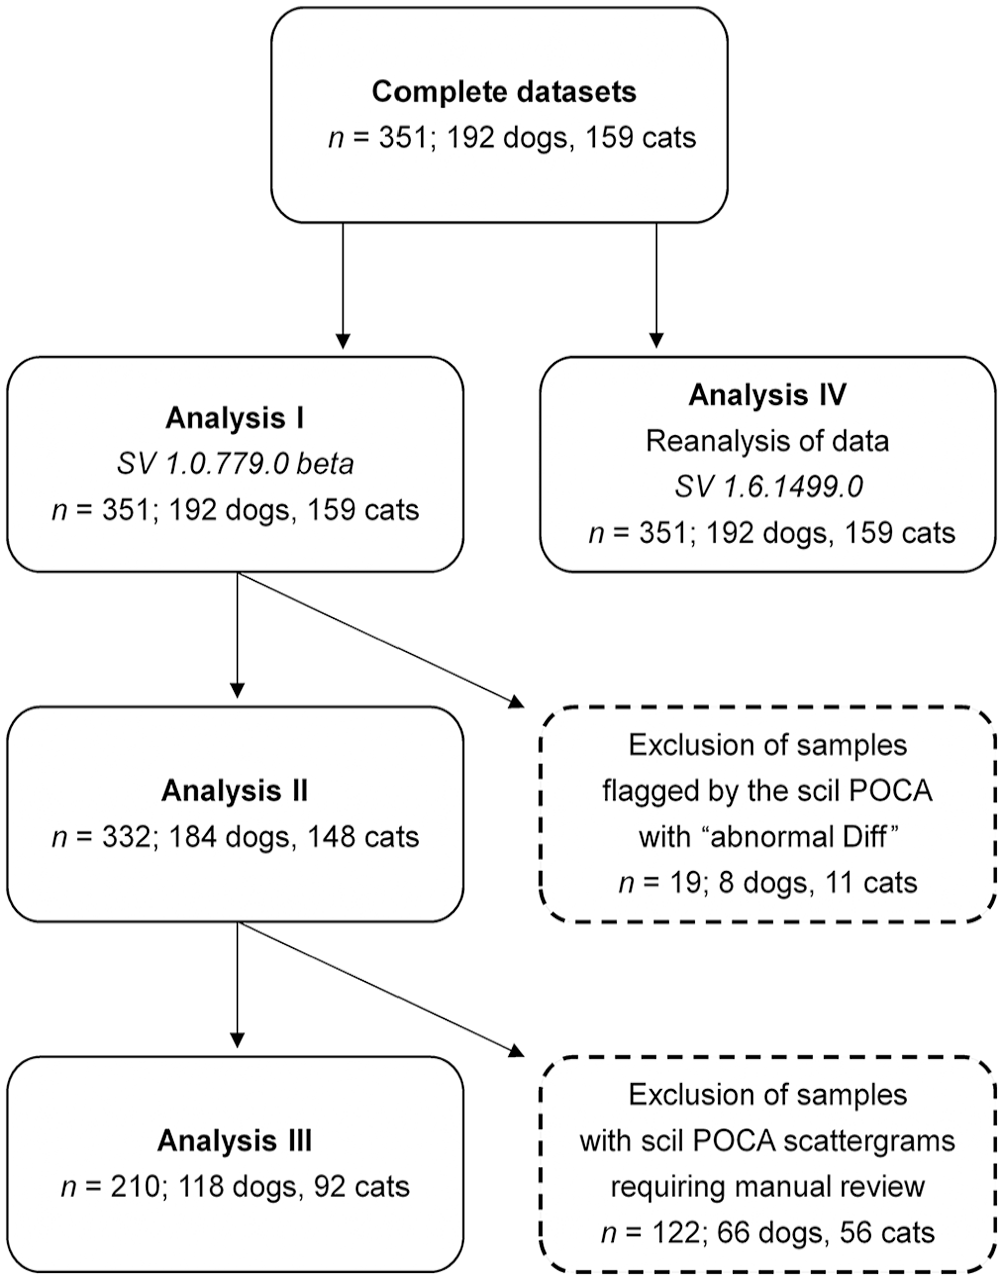
Flowchart of the statistical analyses and review process n = number of samples included; POCA = point-of-care analyzer; SV = software version.
We prioritized the comparison of the scil POCA to the Advia 2120. The performance of the Advia-Diff has been evaluated for dogs and cats with favorable results and in accordance with recommended quality requirements, resulting in Advia systems being used frequently as the reference method in several validation studies for in-house analyzers.7,8,17,26,57,59 Although still recommended as a reference method for the automated Diff, the M-Diff is known to be associated with inherent imprecision based on intra- and inter-observer variability and because of comparably low cells counted (up to 400 cells).53,57 Being aware of the limitations, we used the M-Diff as an additional reference method for practical reasons because veterinary hematology analyzers are not able to reliably identify specific morphologic WBC changes.51,54
The general recommendation is to combine reliable and accurate automated Diff results with manual assessment of blood smears, and critical review of cytograms and analyzer flagging, to identify misclassifications of WBCs and minimize clinically relevant misinterpretation of automated results.10,17,26,44 We used a DM1200 (CellaVision) digital microscope with digital image analysis technology whose favorable suitability as an alternative to manual generation of Diffs has been demonstrated for human and veterinary medicine.11,47,57 Although underestimation of NEU and overestimation of LYM by the DM1200 have been reported, we considered these issues to be negligible because all automated DM1200 counts were reviewed and corrected if needed by one of the authors (Zelmer).
Method comparison study (analysis I)
For the method comparison study, blood samples were stored at room temperature and processed with both analyzers within 6 h after collection. Before processing, the tubes were inverted several times to ensure good mixing of the samples. Analysis with the Advia 2120 was performed (time from sampling to processing: mean 0.5 h, range 0.25–2 h), followed by immediate preparation of blood smears and subsequent analysis with the scil POCA (time from sampling to processing: mean 2 h, range 0.25–6 h).
All samples with complete datasets provided by the scil POCA and analyzed with the Norma veterinary software v.1.0.779.0 beta were compared to both reference methods (analysis I: n = 351, 192 dogs, 159 cats; Fig. 1). We focused on the results of analysis I because the results most likely reflect the information available to the user of the scil POCA, who might not have experience in dealing with the analyzer’s flags and reviewing of cytograms and blood smears as QA tools.
Manual WBC differential count
For all specimens, a 200-cell M-Diff of May-Grünwald/Giemsa–stained blood film was performed serving as the reference method for the Diff obtained with the scil POCA. We used a DM1200 digital morphology analyzer for manual differential counting, which was run with the Cellavision DM veterinary software v.Vet 3.1.2 build 4. As an automated digital microscopy system, the DM1200 is able to scan blood smears on microscopic slides, localize an appropriate analysis area (monolayer), and capture images of WBCs at 100× magnification.34,35 WBCs are automatically pre-classified by the integrated software based on morphologic features such as geometry, color, and texture to provide an automated Diff. 42 Before accepting results for statistical analysis, the pre-classification was reviewed and validated by one of the authors (Zelmer), including reclassification of WBCs in case of incorrect pre-classification and categorization of unidentified cells. WBCs were classified into 5 categories (NEU, LYM, MON, EOS, BASO). Additionally, band neutrophils and lymphocyte precursors were differentiated to be used later for cytogram and flag analysis. Bands > 0.5 × 10⁹/L based on the 200-cell M-Diff were considered a left shift. 54 Samples were included in the study if a differential count of 200 nucleated cells (minimum 195 cells) was available. For samples in which the DM1200 analyzer was unable to count the required number of cells, a conventional microscopic M-Diff was performed (6 of 192 canine and 12 of 159 feline samples).
Advia 2120
The Advia-Diff served as an additional reference method and was run with the Advia veterinary software v.5.3.1-MS. It was operated by one of the authors (Zelmer) and medical technologists, who were trained in the use of the analyzer. As a flow cytometer, the Advia 2120 is laser-based and provides a 5-part Diff utilizing reagent-mediated cell lysis and cytochemical staining (myeloperoxidase and oxazine 750) to differentiate cell populations. 28 WBCs are analyzed with 2 methods in separate channels (peroxidase [PEROX] and basophil/lobularity [BASO] channel). In the PEROX channel, WBC populations are differentiated based on intensity of peroxidase staining (NEU, canine EOS, MON: peroxidase positive; LYM, rubricytes, large unstained cells [LUC; i.e., large peroxidase-negative cells, including immature, or atypical lymphocytes, plasma cells, myeloid precursor cells, hematopoietic stem cells]) and size by forward light scatter. In the BASO channel, providing the reported WBC and BASO counts, WBCs are classified as mononuclear or polymorphonuclear cells according to their lobularity and/or nuclear density and size after lysis of cell membranes. The results of both channels are displayed as characteristic cytograms. Feline eosinophils are counted using the Advia 2120 reticulocyte channel after staining with oxazine 750 because they lack peroxidase staining activity, and differentiation of neutrophils and eosinophils in the PEROX channel is therefore not possible.43,49 Detailed technical aspects of the measurement principle of the Advia 2120 have been published.6,7,28 Daily internal quality control (QC) measurements were performed using human QC material (QCM) at 3 concentrations (Siemens), applying national QC rules. 50 Calibration of the hematology instrument was performed annually by the manufacturer.
scil POCA
The scil POCA was run with the Norma veterinary software v.1.0.779.0 beta and was operated by one of the authors (Zelmer), who was trained in the use of the analyzer. In addition to the impedance measuring principle for RBC and PLT counts, the scil POCA uses laser light flow cytometry for WBC differentiation providing a 5-part Diff. 62 Results of the Diff are presented both numerically in relative and absolute numbers, as well as graphically as a cytogram (dotplot) with cell size (low-angle scattered-light signals) shown on the y-axis and cell internal complexity (high-angle scattered-light signals) on the x-axis. The WBC populations visualized in the cytogram are NEU, LYM, MON, EOS, and BASO. An additional cell population is visible, extending upward from the NEU population, which was classified as immature granulocytes based on case studies on human samples performed by the manufacturer. 4
The scil POCA is able to provide 2 types of analyzer alerts (flags): 1) sample-specific (technical) flags, and 2) parameter-specific (technical or morphologic) flags. Sample-specific flags occur in the case of erroneous sample handling or sample aspiration and include alerts such as “high pressure” (high pressure during measuring process) and “low sample volume” (low sample volume or block in sampling unit). Parameter-specific flags mark the WBC (or RBC) parameter group and indicate irregularities during the measuring process (technical flags), such as “unintelligible histogram” (inhomogeneous sample flow in the flow cell) or “WBC noise” (air bubbles in the optical unit), or in the report (morphologic flag), such as “abnormal diff” (atypical WBC distribution in the scattergram). Such parameter-specific flags are labeled with numbers (#3–#9) rising with increasing significance.
In the case of error messages (flags) displayed by the scil POCA, troubleshooting was performed according to the instructions given in the user manual (including re-analysis and flushing cycles). 3 If flags were present after troubleshooting, we excluded results with persistently incomplete datasets, concerning the RBC, PLT, or WBC counts. We did not exclude results with complete datasets, even if they were flagged after troubleshooting. In this case, measurement results after troubleshooting (i.e., the most reliable results) were included in our method comparison study. According to the user manual, conditions that cause flags do not have a major impact on results as long as results are displayed by the analyzer. 3 The manufacturer states that once the severity of a condition causing flags affects the interpretation of the results, they will not be reported.
We evaluated the diagnostic utility of the “abnormal diff” flag, indicating an abnormal WBC scatter plot and potentially invalid results. Data were analyzed statistically before and after exclusion of results flagged with “abnormal diff” as part of the review process (analysis II; Fig. 1, see below).
We performed analyzer maintenance procedures regularly as recommended by the manufacturer (i.e., when recommended by the analyzer’s alerts and as part of troubleshooting procedures). Internal QC measurements were performed daily using the QCM provided by the manufacturer (Norma Instruments) at 3 concentration levels (low: WBC ~3 × 10⁹/L; normal: WBC ~8 × 10⁹/L; high: WBC ~20 × 109/L), allowing divergences of 20% for low, and 10% for normal and high WBC. We considered the results of the QC measurements acceptable if they were within the maximum allowable limits.
Review and re-analysis process (analyses II–IV)
The initial dataset of analysis I (n = 351, 192 dogs, 159 cats; analyzer software v.1.0.779.0 beta), was statistically analyzed 3 additional times (analyses II–IV) by comparing the results of the scil POCA with both reference methods (Fig. 1).
Analysis II
Statistical analysis was performed a second time, with results obtained with the same analyzer software version, after excluding samples that were labeled with the flag “abnormal diff” by the scil POCA indicating an abnormal scatter plot and potentially invalid results (n = 332, 184 dogs, 148 cats; Fig. 1). We evaluated the diagnostic utility of the “abnormal diff” flag, given that it is the only flag considered a morphologic flag of the scil POCA, marking results with atypical WBC distribution in the scattergram and necessitating verification of automated results by manual methods.
Analysis III
Given that the scil POCA is not able to flag results with cytogram abnormalities associated with specific morphologic WBC changes, statistical analysis of results obtained with software v.1.0.779.0 beta was performed a third time, after reviewing WBC cytograms from the scil POCA by one of the authors (Zelmer) anonymized to numerical data, and, in addition to samples already excluded in analysis II, excluding samples with dotplots indicative of 1) left shift or the presence of immature granulocytes, 2) indistinct separation of cellular populations, 3) suspicion of atypical (i.e., reactive or immature) LYMs, and 4) suspicion of immature LYMs requiring a manual review of blood smear and Diff according to current literature (n = 210, 118 dogs, 92 cats; Figs. 1–3, Table 1). 54
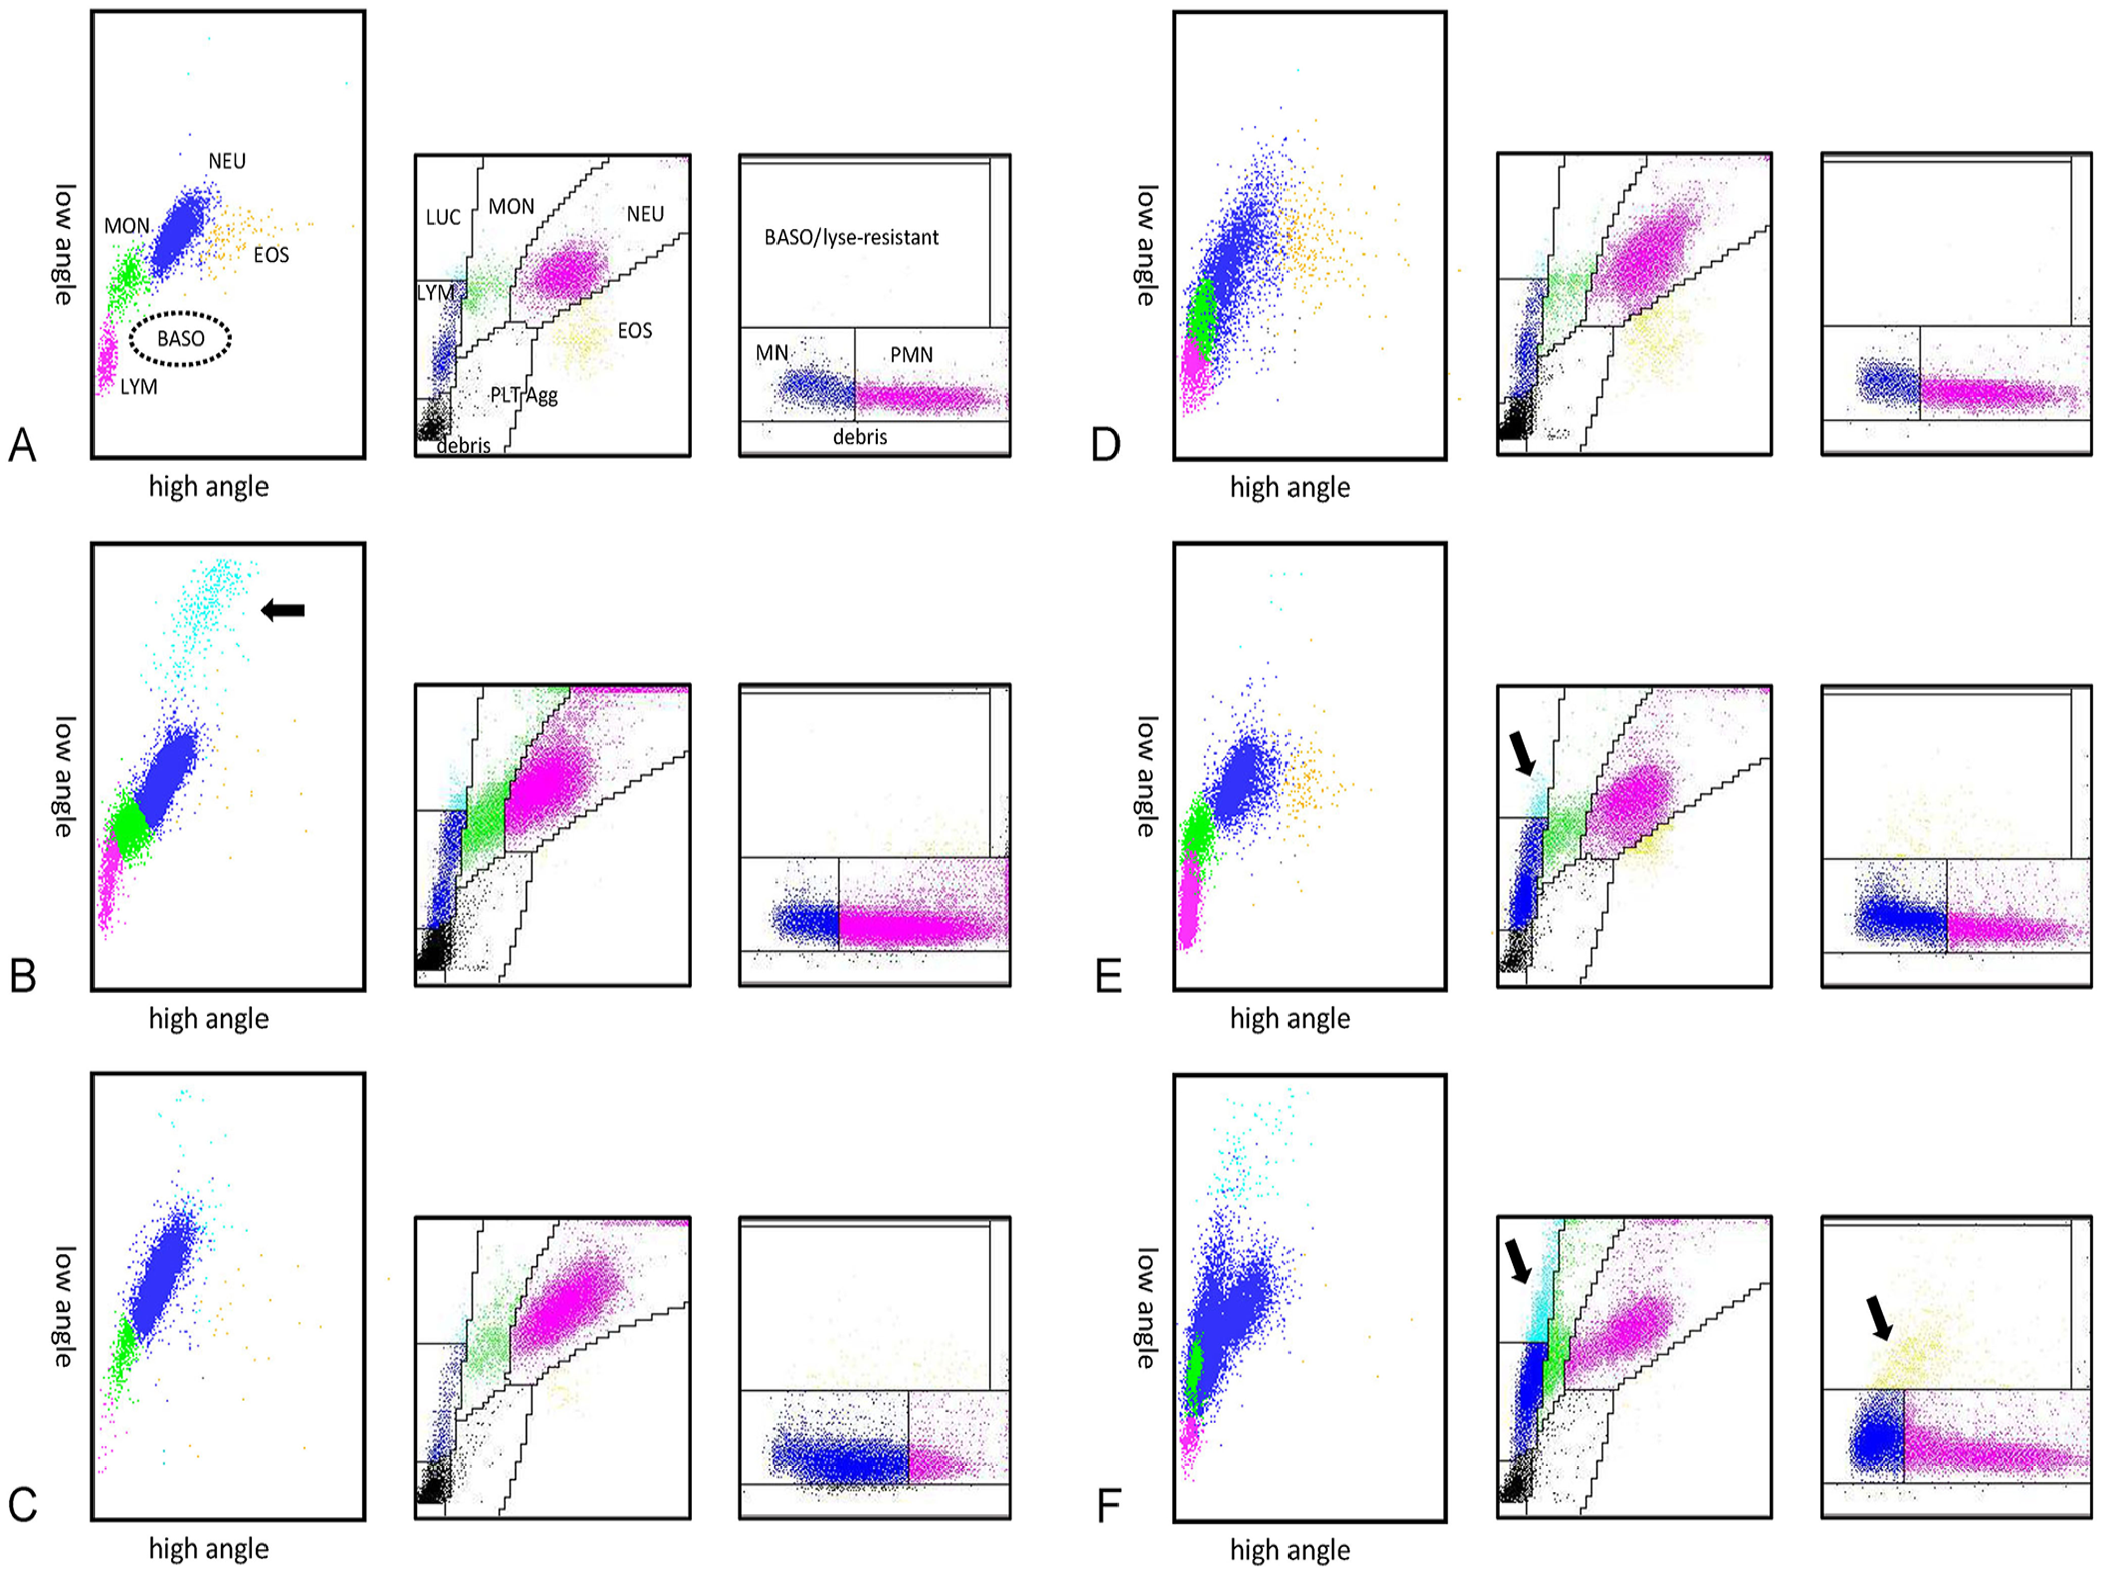
Examples of cytogram changes in canine samples: left, the scil point-of-care analyzer (POCA) cytogram (cell size on the y-axis; cell internal complexity on the x-axis); middle, the Advia 2120 PEROX channel cytogram (cell size on the y-axis; myeloperoxidase activity on the x-axis); right, the Advia 2120 BASO channel cytogram (cell size on the y-axis; lobularity/nuclear density on the x-axis). EOS = eosinophils; LUC = large unstained cells; lyse-resistant = lyse-resistant cells; LYM = lymphocytes; MN = mononucleated cells; MON = monocytes; NEU = neutrophils; PLT = platelets; PLT-Agg = platelet aggregates; PMN = polymorphonucleated cells.
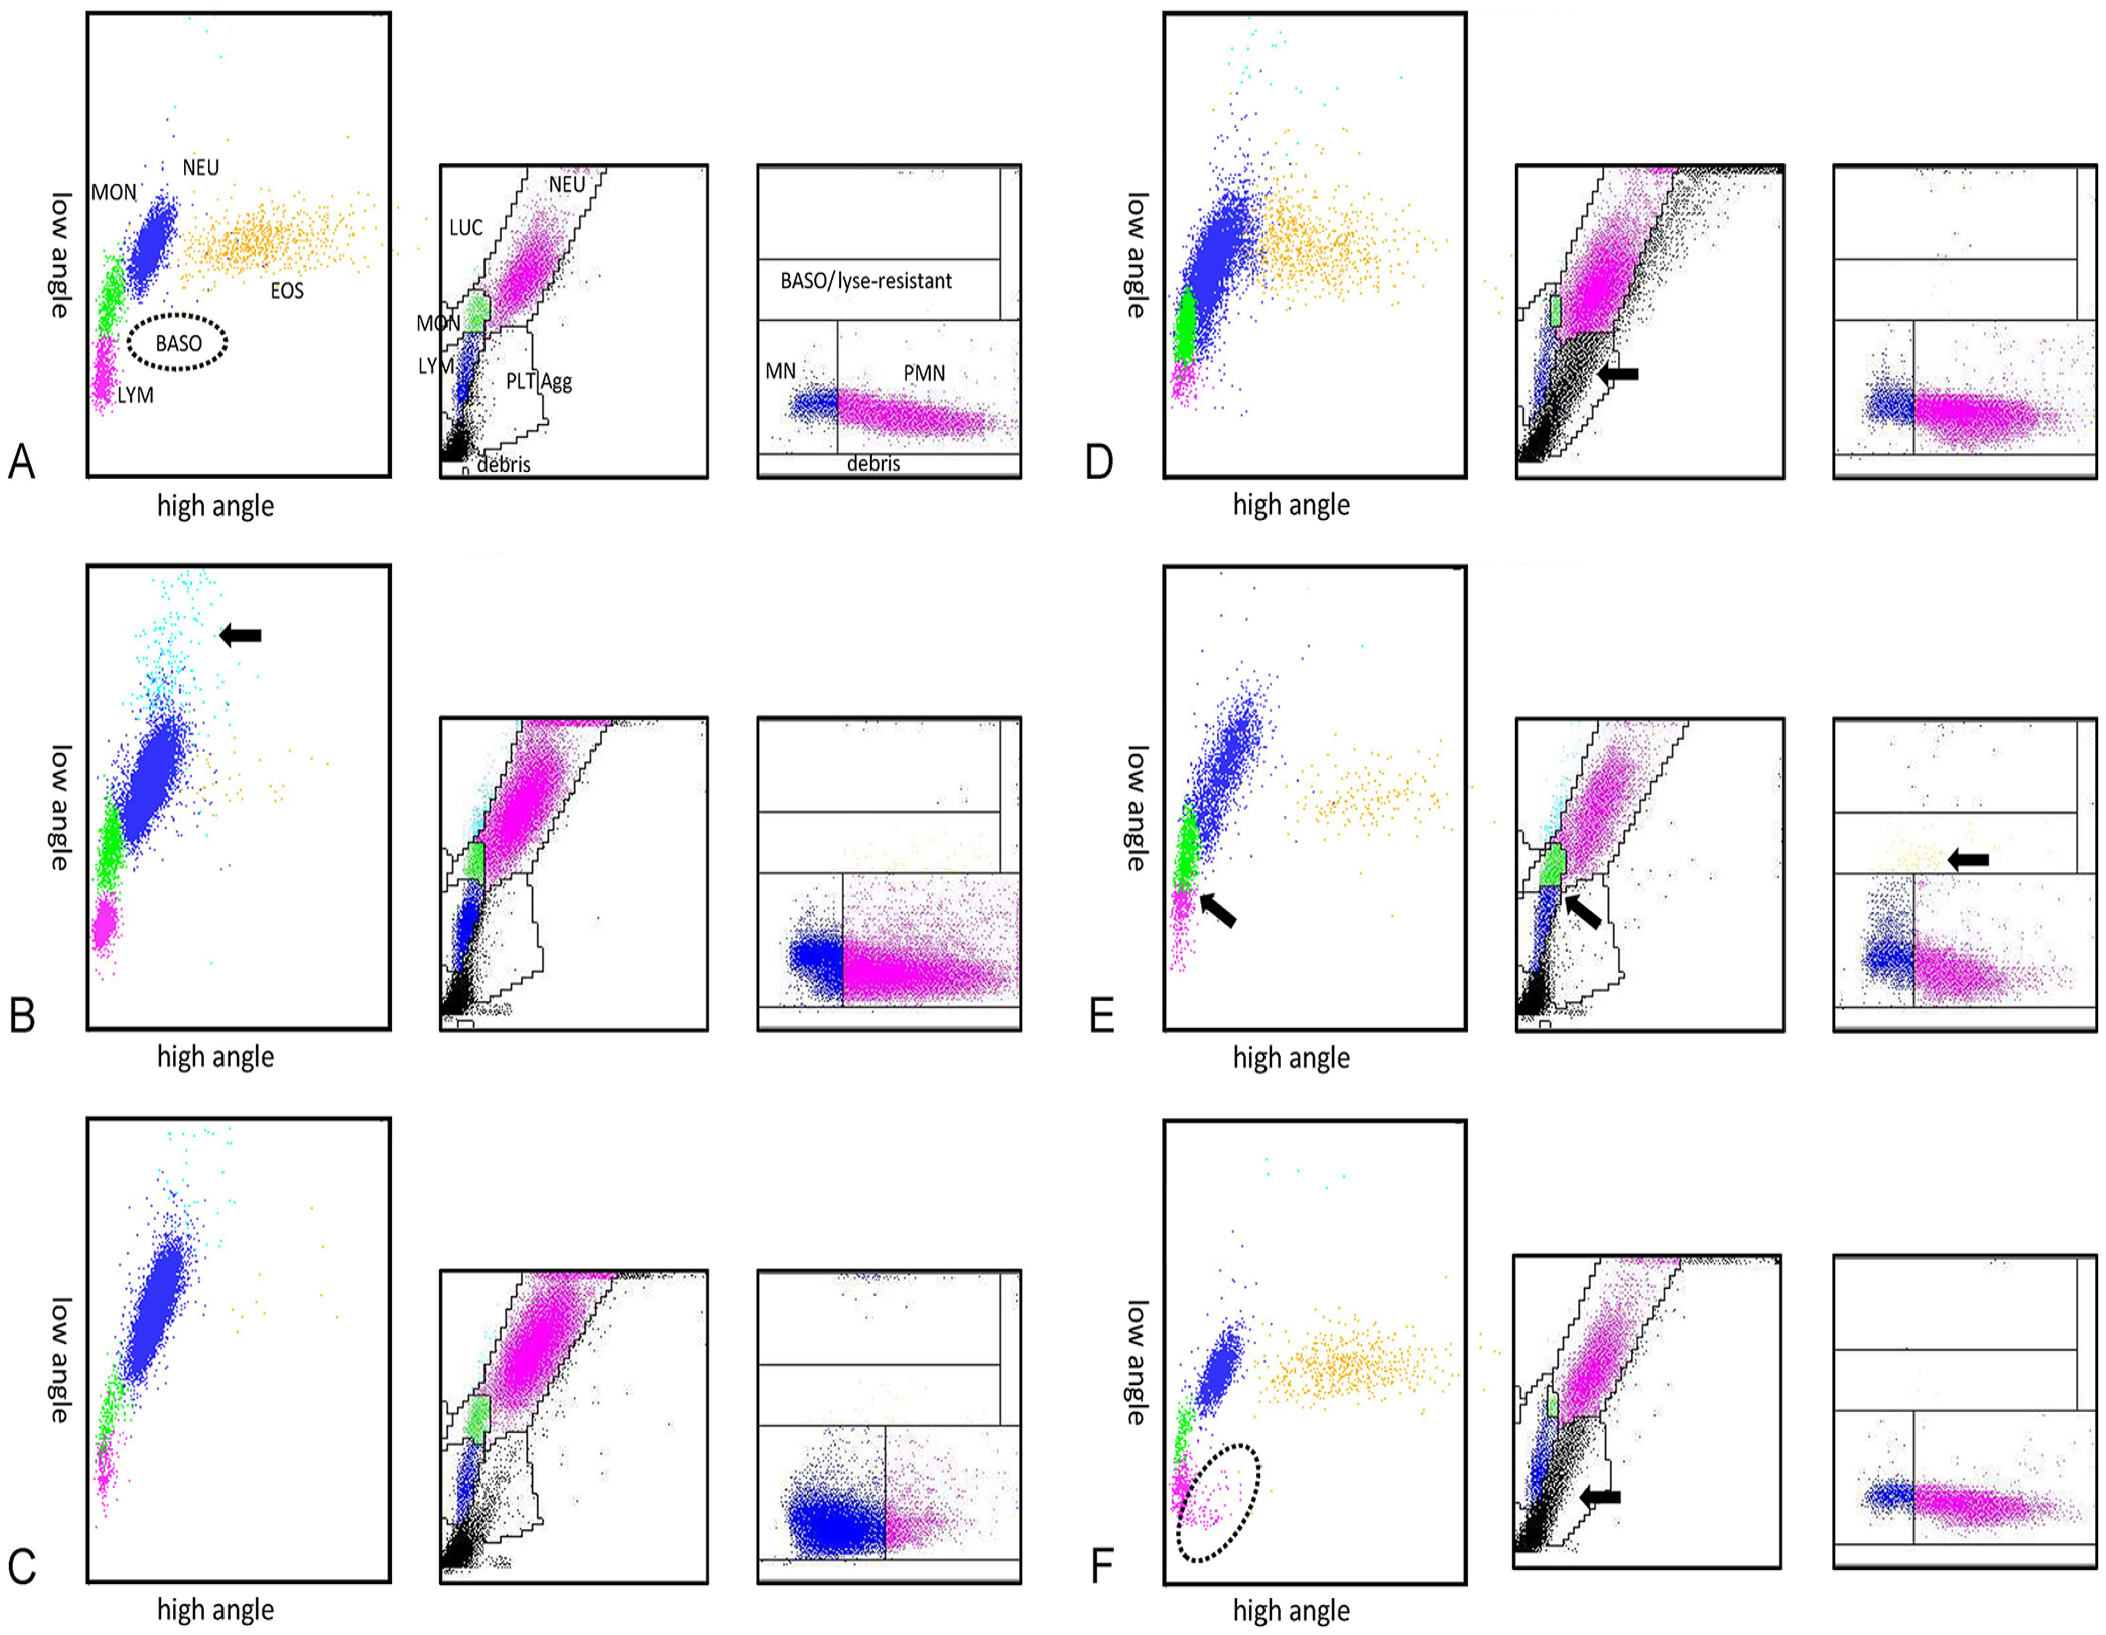
Examples of cytogram changes in feline samples: left, the scil POCA cytogram (cell size on the y-axis; cell internal complexity on the x-axis); middle, the Advia 2120 PEROX channel cytogram (cell size on the y-axis; myeloperoxidase activity on the x-axis); right, the Advia 2120 BASO channel cytogram (cell size on the y-axis; lobularity/nuclear density on the x-axis). For abbreviations, see Fig. 2.
Classification of causes for requesting manual leukocyte differentiation after review of cytograms obtained with the scil point-of-care analyzer.
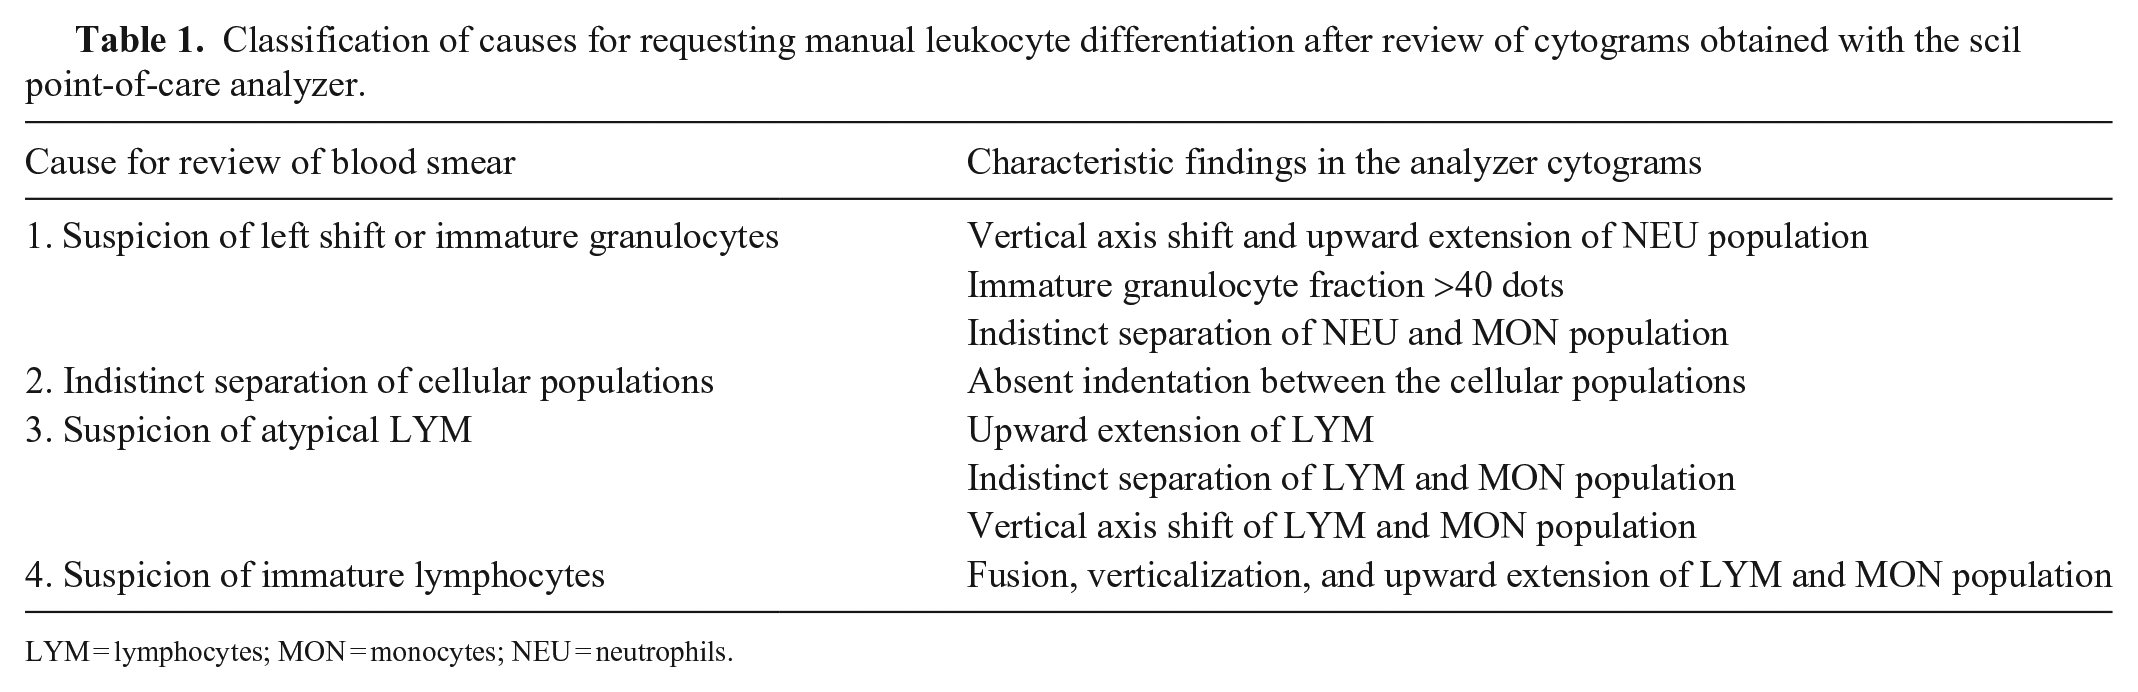
LYM = lymphocytes; MON = monocytes; NEU = neutrophils.
Analysis IV
The initial dataset of the scil POCA was re-analyzed with an updated version of the analyzer’s software (v.1.6.1499.0) provided by the manufacturer and statistically compared to the reference methods (n = 351, 192 dogs, 159 cats; Fig. 1).
Statistical analysis
Statistical analysis was done using MedCalc v.17.8.6 and Excel (Microsoft). The Spearman rank correlation coefficient (rs, rho) was used to quantify correlation between results and was interpreted as excellent (rs = 0.93–0.99), good (rs = 0.80–0.92), fair (rs = 0.59–0.79), or poor (rs < 0.59). 45 Passing–Bablok regression was used to determine regression equations with y-axis intercept, slope, and 95% CIs.
Systematic errors (i.e., absolute bias and %bias with 95% limits of agreement) were determined by Bland–Altman analysis. Percent bias was calculated as follows: %bias = (meantarget – meanmeasured)/meanall × 100%. The statistical methods were chosen because they allow the inclusion of extreme values (outliers) and do not assume a normal distribution of data. 31 We had determined intra-assay CV by 20 consecutive measurements performed from feline and canine K3-EDTA–anticoagulated blood samples with low, normal, and high WBC counts. 62 Briefly, the following CVs were obtained for a canine and feline sample with normal total WBC count and Diff (dog: NEU 2.43%, LYM 6.98%, MON 10.5%, EOS 11.2%; cat: NEU 1.9%, LYM 12.5%, MON 20.8%, EOS 31.0%).
We determined the total observed error (TEo) for Diffs according to the current ASVCP guidelines for hematology, which allowed an objective assessment of the results of the method validation results and comparability of the methods used. 44 TEo was calculated for absolute numbers of leukocyte populations, utilizing CVs published for the scil POCA, 62 and %bias applying the following formula: TEo = absolute bias% + 2CV. To fulfill quality requirements, TEo should be less than the total allowable error (TEa; i.e., TEo < TEa).
The quality goal index (QGI) was determined in cases of TEo > TEa to assess whether the observed analytical error was caused by unacceptably high imprecision, bias, or both. QGI was calculated based on the following formula: QGI = %bias/CV, wherein values < 0.8 indicate the predominant influence of imprecision, and values > 1.2 indicate the predominant influence of bias. For a QGI of 0.8–1.2, both imprecision and bias contribute to the observed analytical performance.44,48
Given the low number of samples with high basophil counts confirmed by the M-Diff, statistical analysis of basophils was not possible. However, we recorded the sensitivity, specificity, and positive and negative predictive values for the automated basophil counts provided by the scil POCA to detect basophilia. Basophilia was considered to be basophil counts > 0.1 × 10⁹/L based on the results of the M-Diff.
Results
Range
Ranges of absolute and percent counts of different WBC populations obtained with the Advia 2120 and the scil POCA were generally comparable between the analyzers; however, upper ranges differed markedly between the analyzers for LYM and MON (Table 2).
Range of leukocyte differential counts and percentages obtained from the scil point-of-care and Advia 2120 analyzers for canine and feline specimens (analyses I–IV, see Fig. 1).
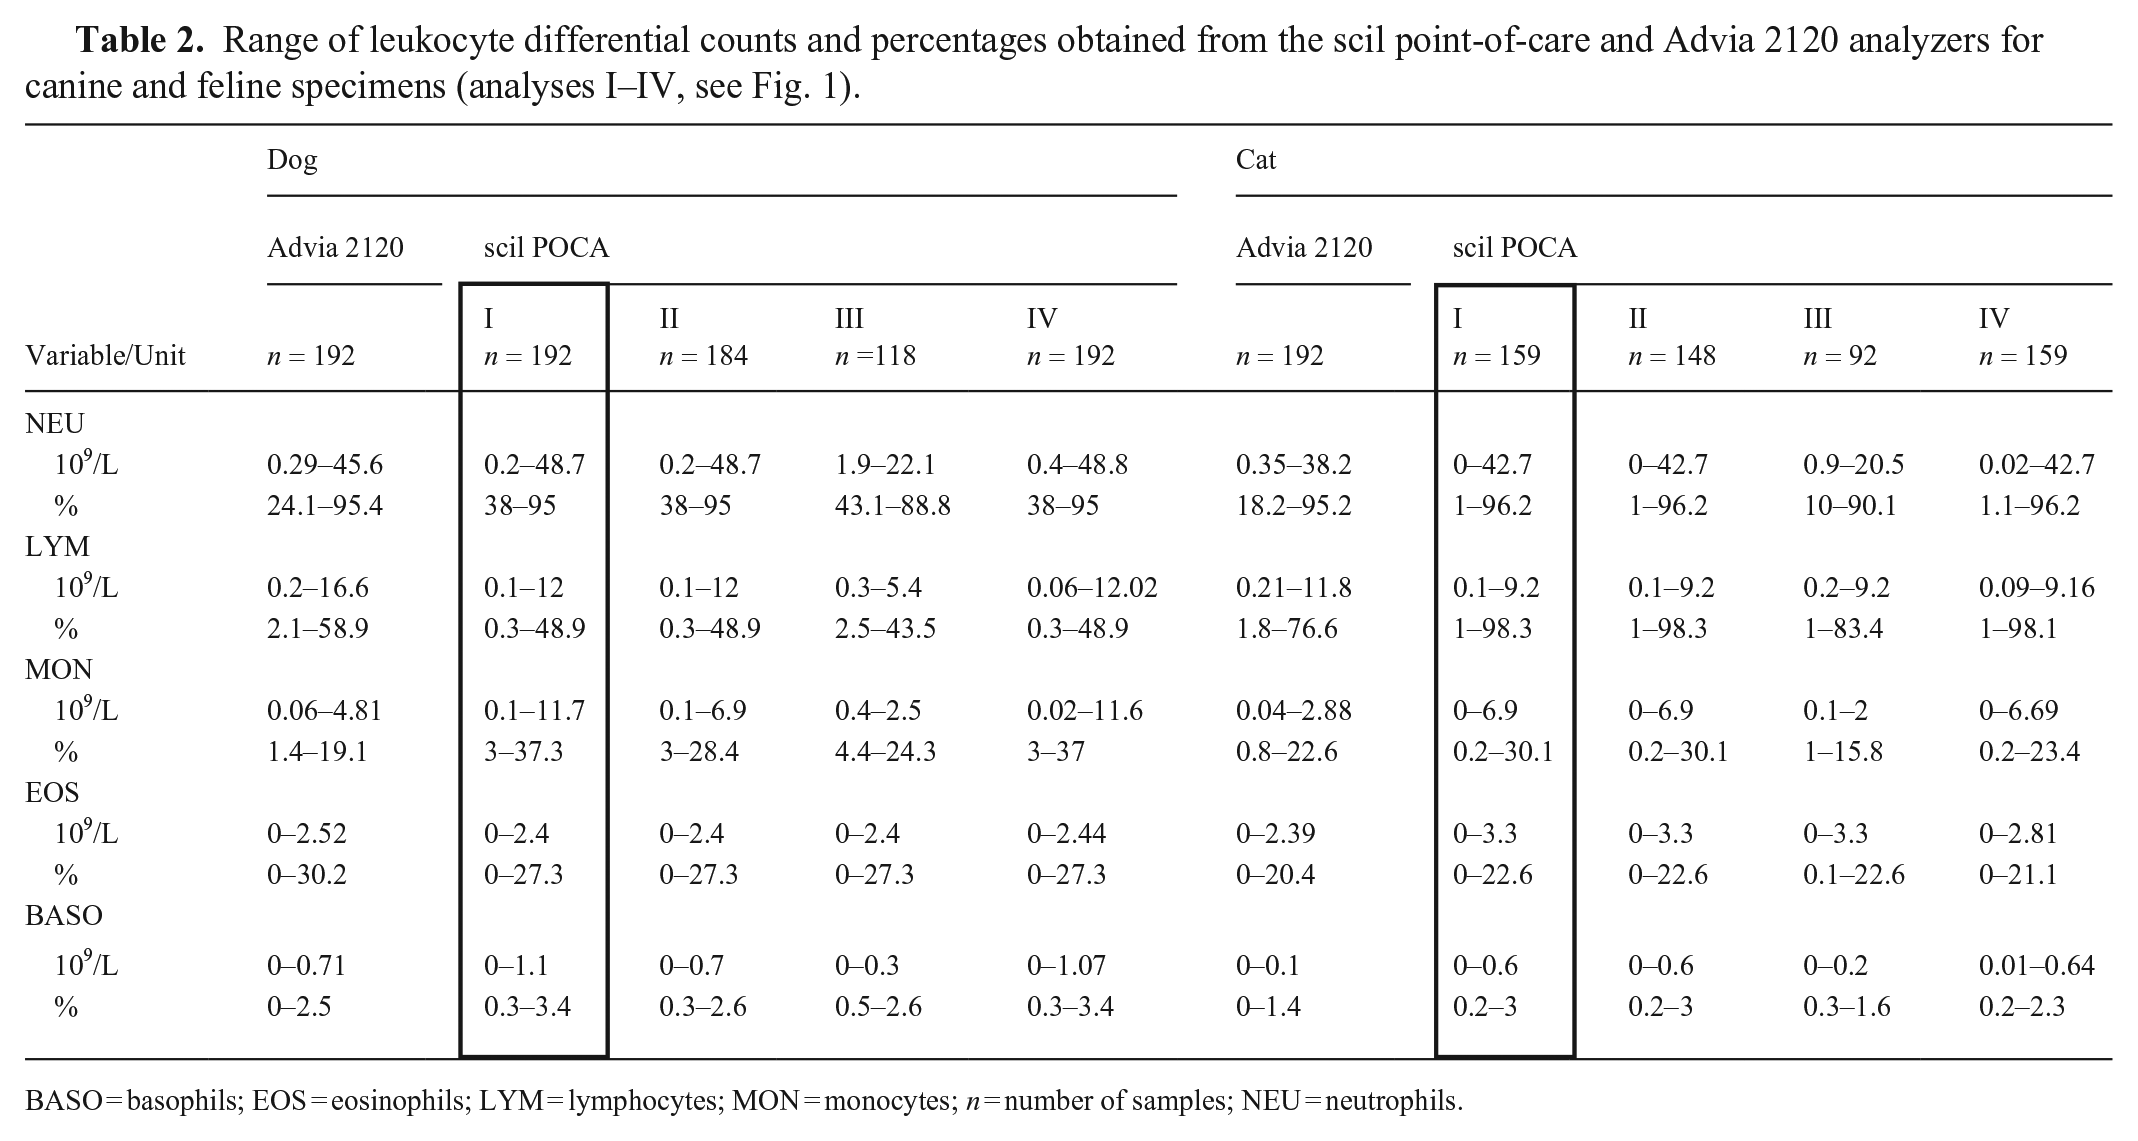
BASO = basophils; EOS = eosinophils; LYM = lymphocytes; MON = monocytes; n = number of samples; NEU = neutrophils.
Method comparison study (analysis I)
Of the initial 363 samples (201 dogs, 162 cats) considered for inclusion, 12 samples (9 dogs, 3 cats) were excluded because of incomplete datasets. Of these 12 samples, 4 results (all canine samples) were marked with parameter-specific flags. One of the 4 flagged results, obtained from a healthy blood donor, was marked with “WBC noise #9”; for this sample, no WBC count and Diff were displayed by the scil POCA. There was no evidence of interference or hematologic abnormalities detected with the Advia 2120 or in the peripheral blood smear in this sample. Three of the 4 flagged samples had distinct autoagglutination and hyperbilirubinemia, and were flagged with “RBC slice, unstable HGB #6” and thus were excluded to prevent interference of microagglutination with the Diff. The remaining 8 of 12 results (5 dogs, 3 cats) were excluded because they contained results that exceeded (PLTs > 1,000 × 109/L, 3 of 8 samples) or fell below the reportable range of the analyzer (MCV < 30 fL, 3 of 8 samples; PLTs < 12 × 109/L, 2 of 8 samples) and thus interfered with the display of the calculated parameters (HCT, MCH, MCHC, PLT indices). All specimens with sample-specific flags (n = 6 of 363 samples), including 4 feline samples marked with “high pressure,” 1 feline and 1 canine sample marked with “low sample volume,” resolved after troubleshooting, and the results were included.
We finally considered 351 samples (192 dogs, 159 cats) for statistical analysis after troubleshooting and exclusion of incomplete datasets and included those results in analyses I and IV. The percentage of healthy animal samples included was 14 of 192 (7.3%) for canine and 14 of 159 (8.8%) for feline samples. As described previously, 11 of 192 (5.7%) canine samples were affected by potential interferents (hemolysis in 3 of 11, icteric interference in 6 of 11, lipemia in 1 of 11 samples) and 2 of 159 (1.3%) in feline samples (1 of 2 icteric, 1 of 2 lipemic samples). 62
Correlation
POCA-Diff compared to M-Diff
In canine samples, good-to-excellent correlation between the POCA-Diff and M-Diff was seen for NEU (absolute and %) and LYM%; correlation for absolute LYM, absolute MON, and EOS (absolute and %) was fair; the correlation of MON% was poor (Table 3). In feline samples, good-to-excellent correlation between the POCA-Diff and M-Diff was seen for NEU, LYM, and EOS (all in absolute numbers and %); correlation of MON was fair (absolute numbers) to poor (MON%).
Correlation and agreement of the leukocyte differential percentages obtained from the scil point-of-care (POCA) and Advia 2120 analyzers and the manual differential count (M-Diff) for canine specimens (analyses I–IV, see Fig. 1).
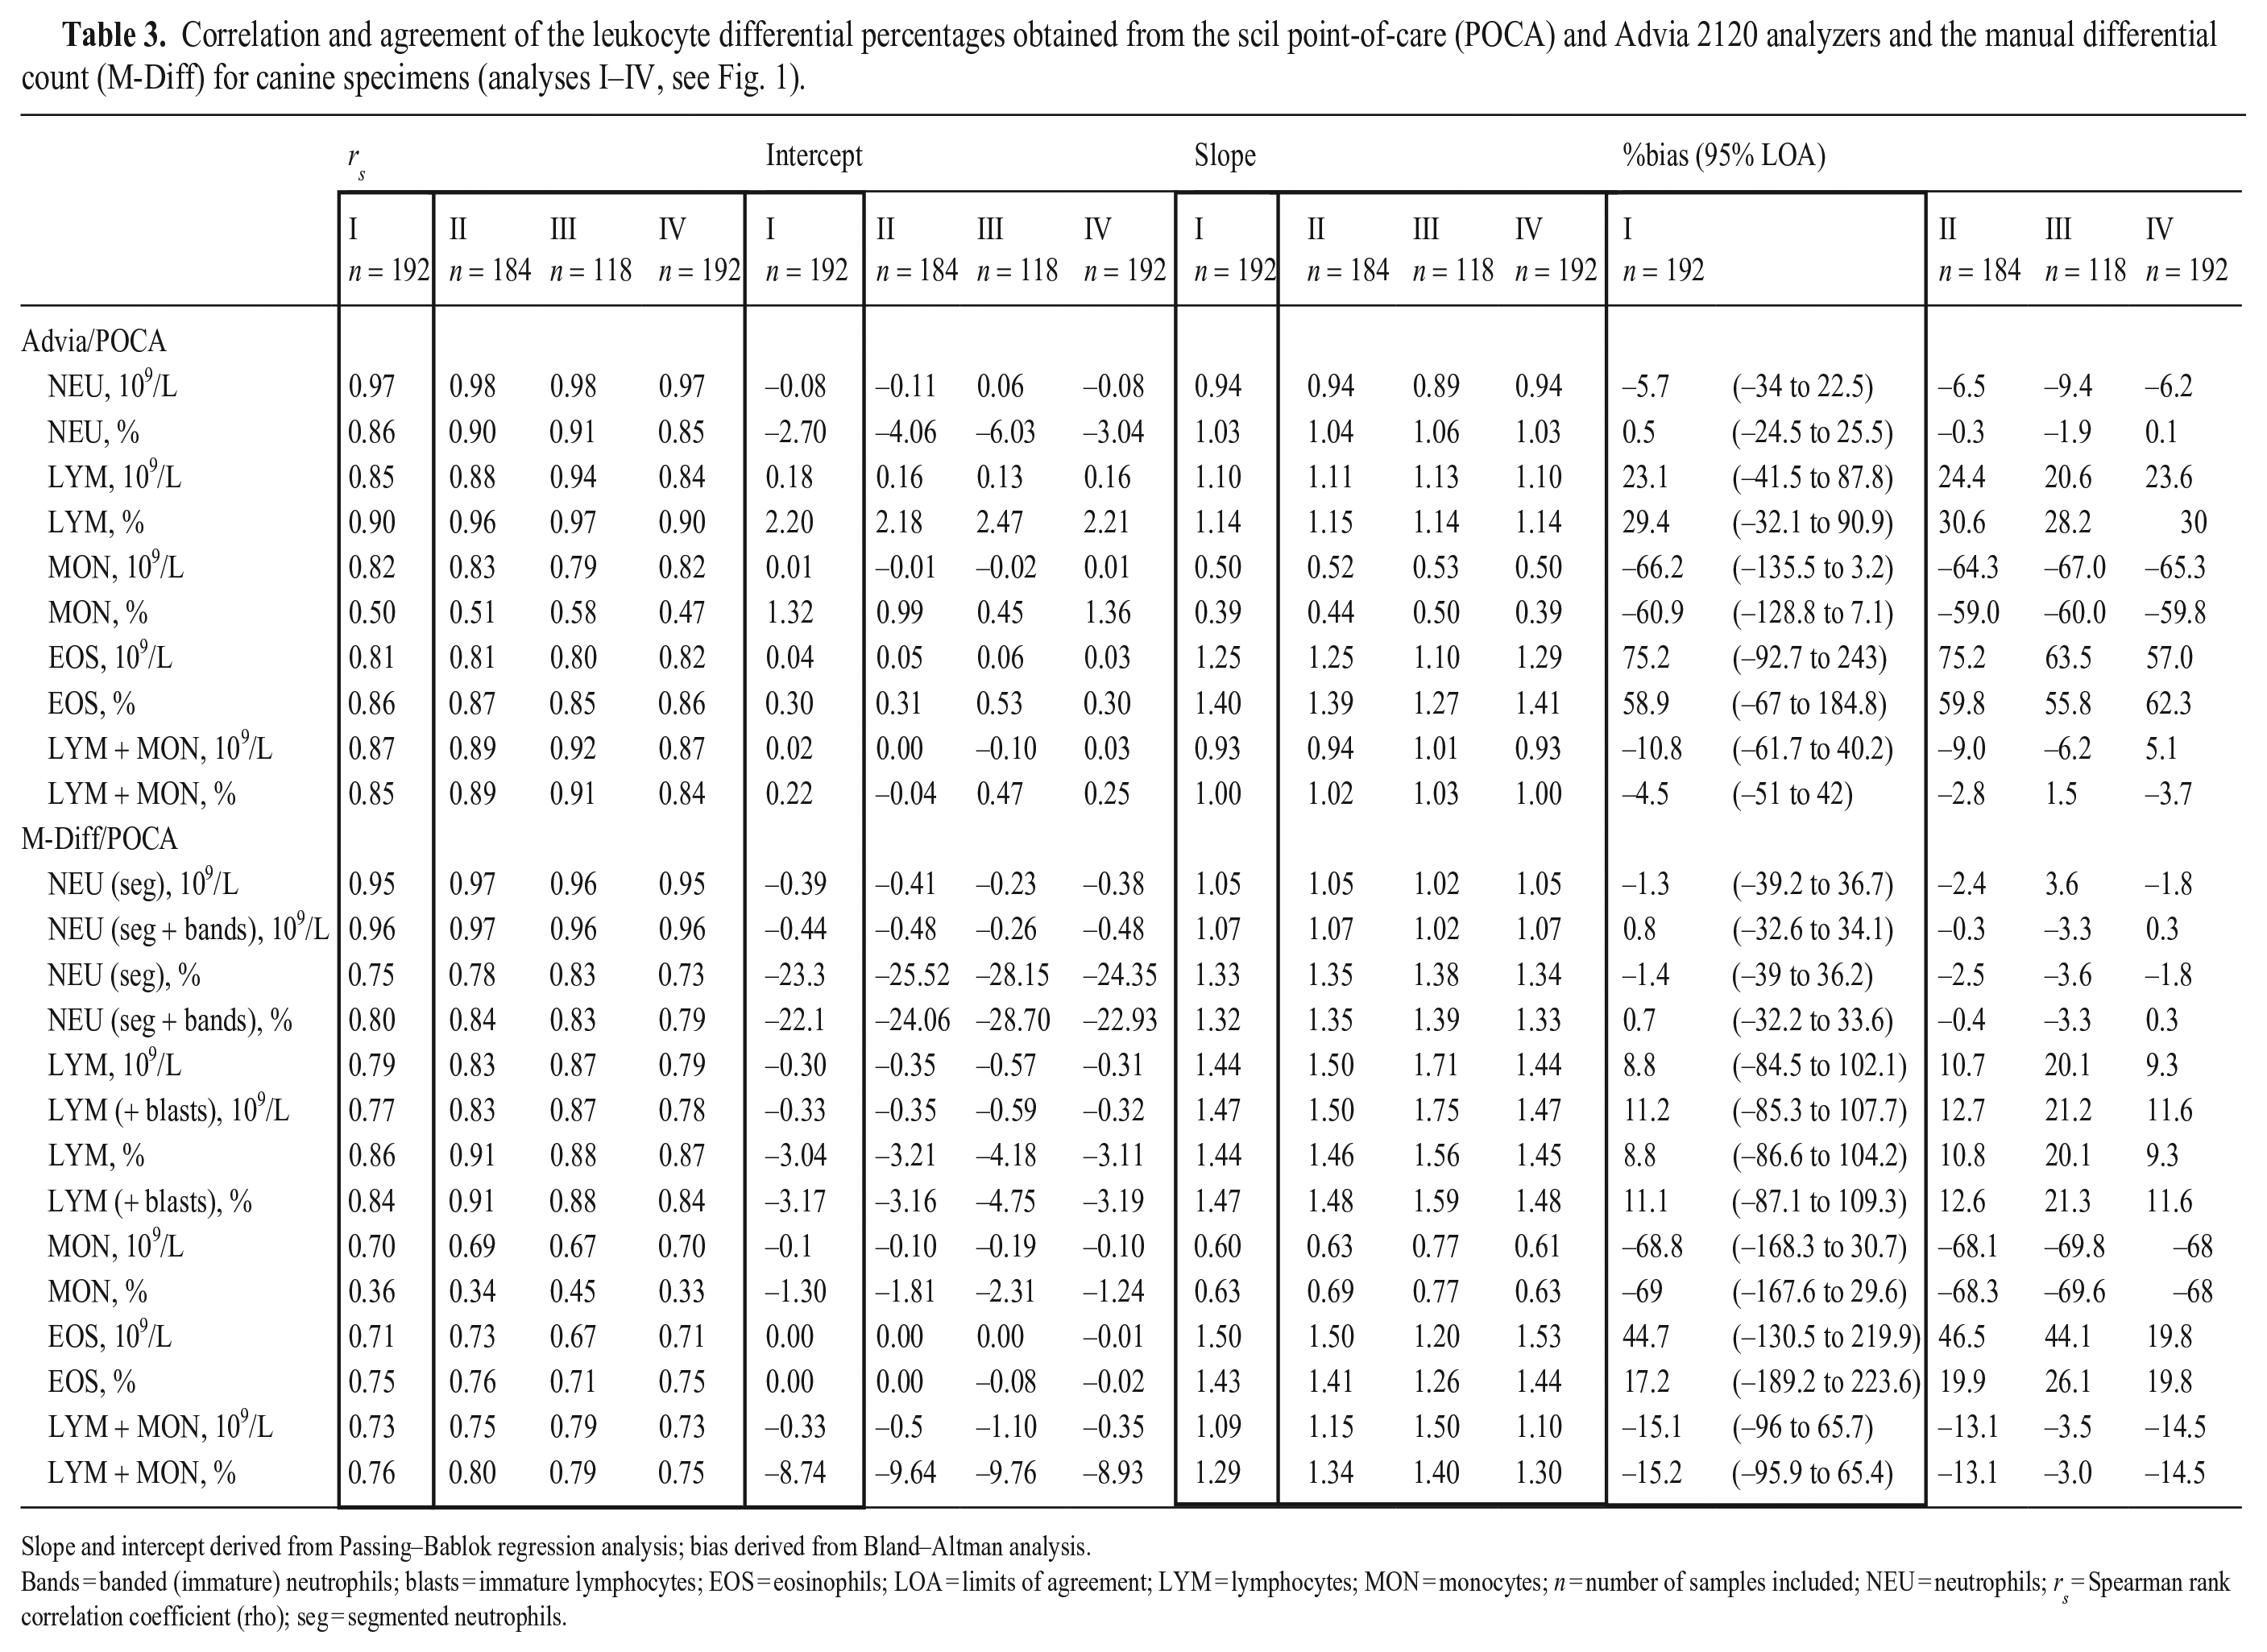
Slope and intercept derived from Passing–Bablok regression analysis; bias derived from Bland–Altman analysis.
Bands = banded (immature) neutrophils; blasts = immature lymphocytes; EOS = eosinophils; LOA = limits of agreement; LYM = lymphocytes; MON = monocytes; n = number of samples included; NEU = neutrophils; rs = Spearman rank correlation coefficient (rho); seg = segmented neutrophils.
POCA-Diff compared to Advia-Diff
In canine samples, there was good-to-excellent correlation for all WBC populations in absolute numbers and percentages (NEU, LYM, MON, EOS) except for MON%, which were poorly correlated between the analyzers (Table 3; Fig. 4). In feline samples, good-to-excellent correlation between the POCA-Diff and Advia-Diff was seen for NEU, LYM, and EOS (all in absolute numbers and %); correlation of MON was fair (absolute numbers) to poor (%; Table 4, Fig. 5).
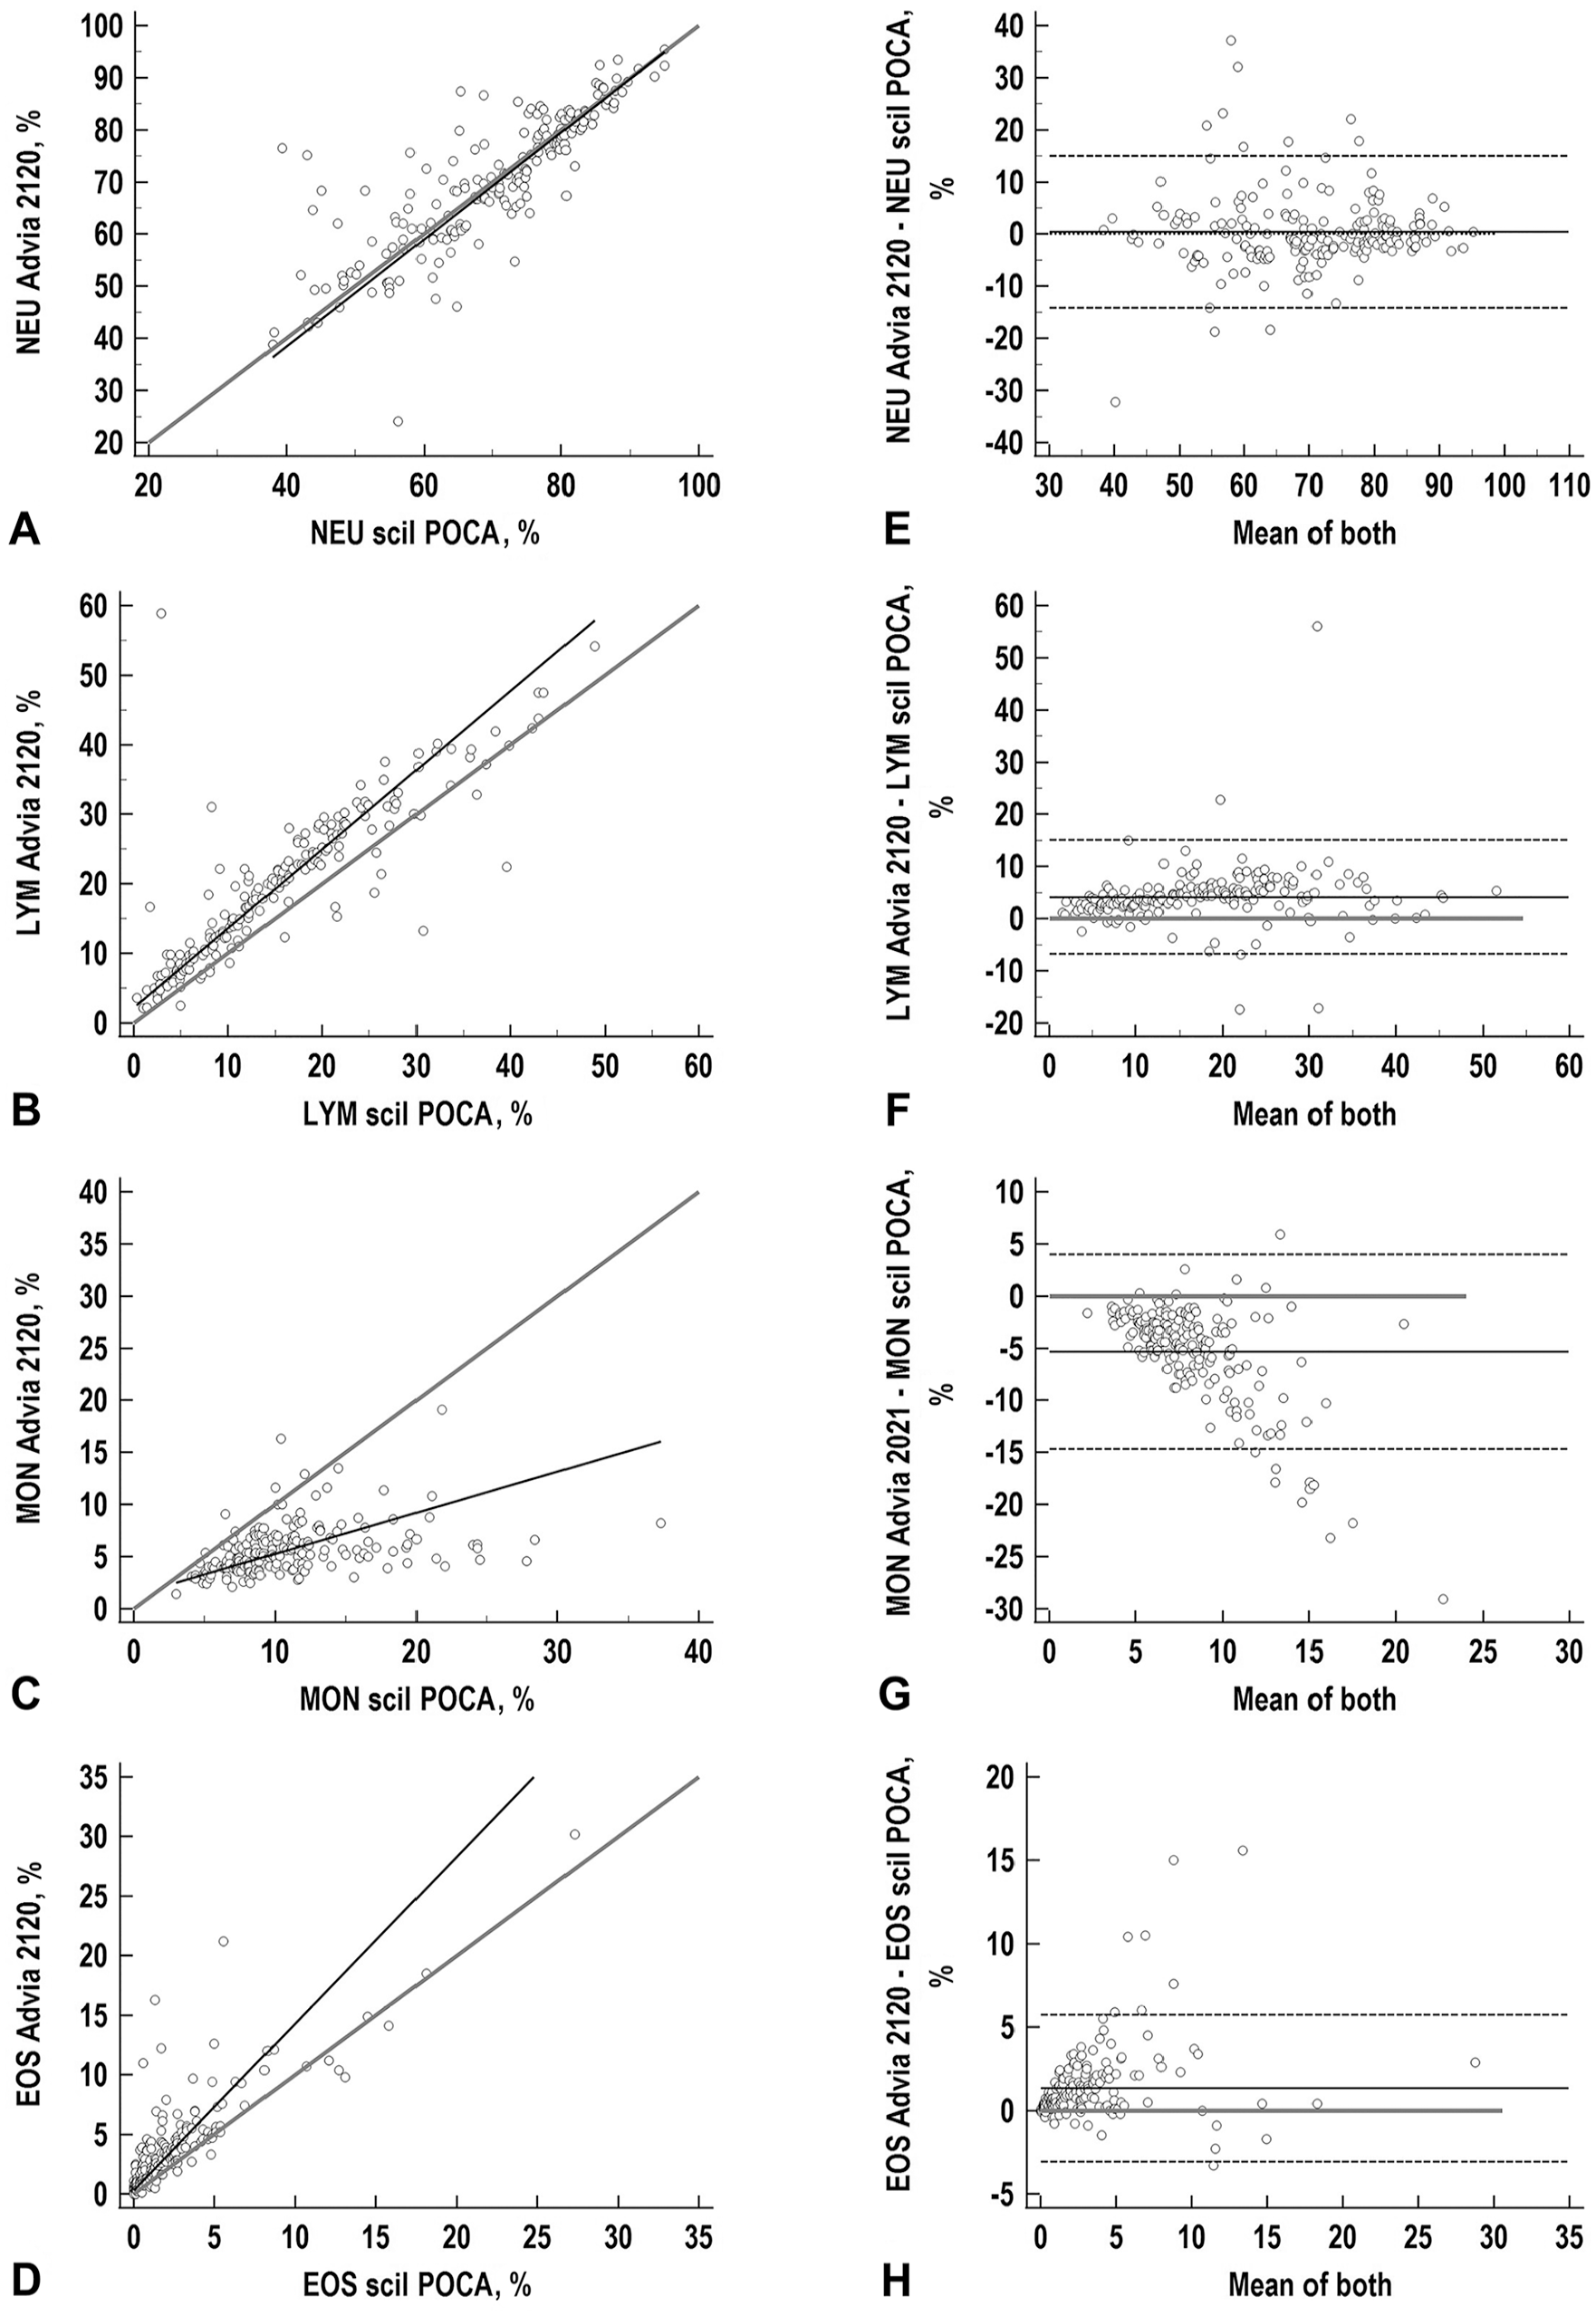
Correlation and agreement of NEU, LYM, MON, and EOS obtained with the scil point-of-care (POCA) and Advia 2120 analyzers for 192 canine samples (analysis I). For abbreviations, see Fig. 2.
Correlation and agreement of the leukocyte differential percentages obtained from the scil point-of-care (POCA) and Advia 2120 analyzers and the manual differential count (M-Diff) for feline specimens (analyses I–IV, see Fig. 1).
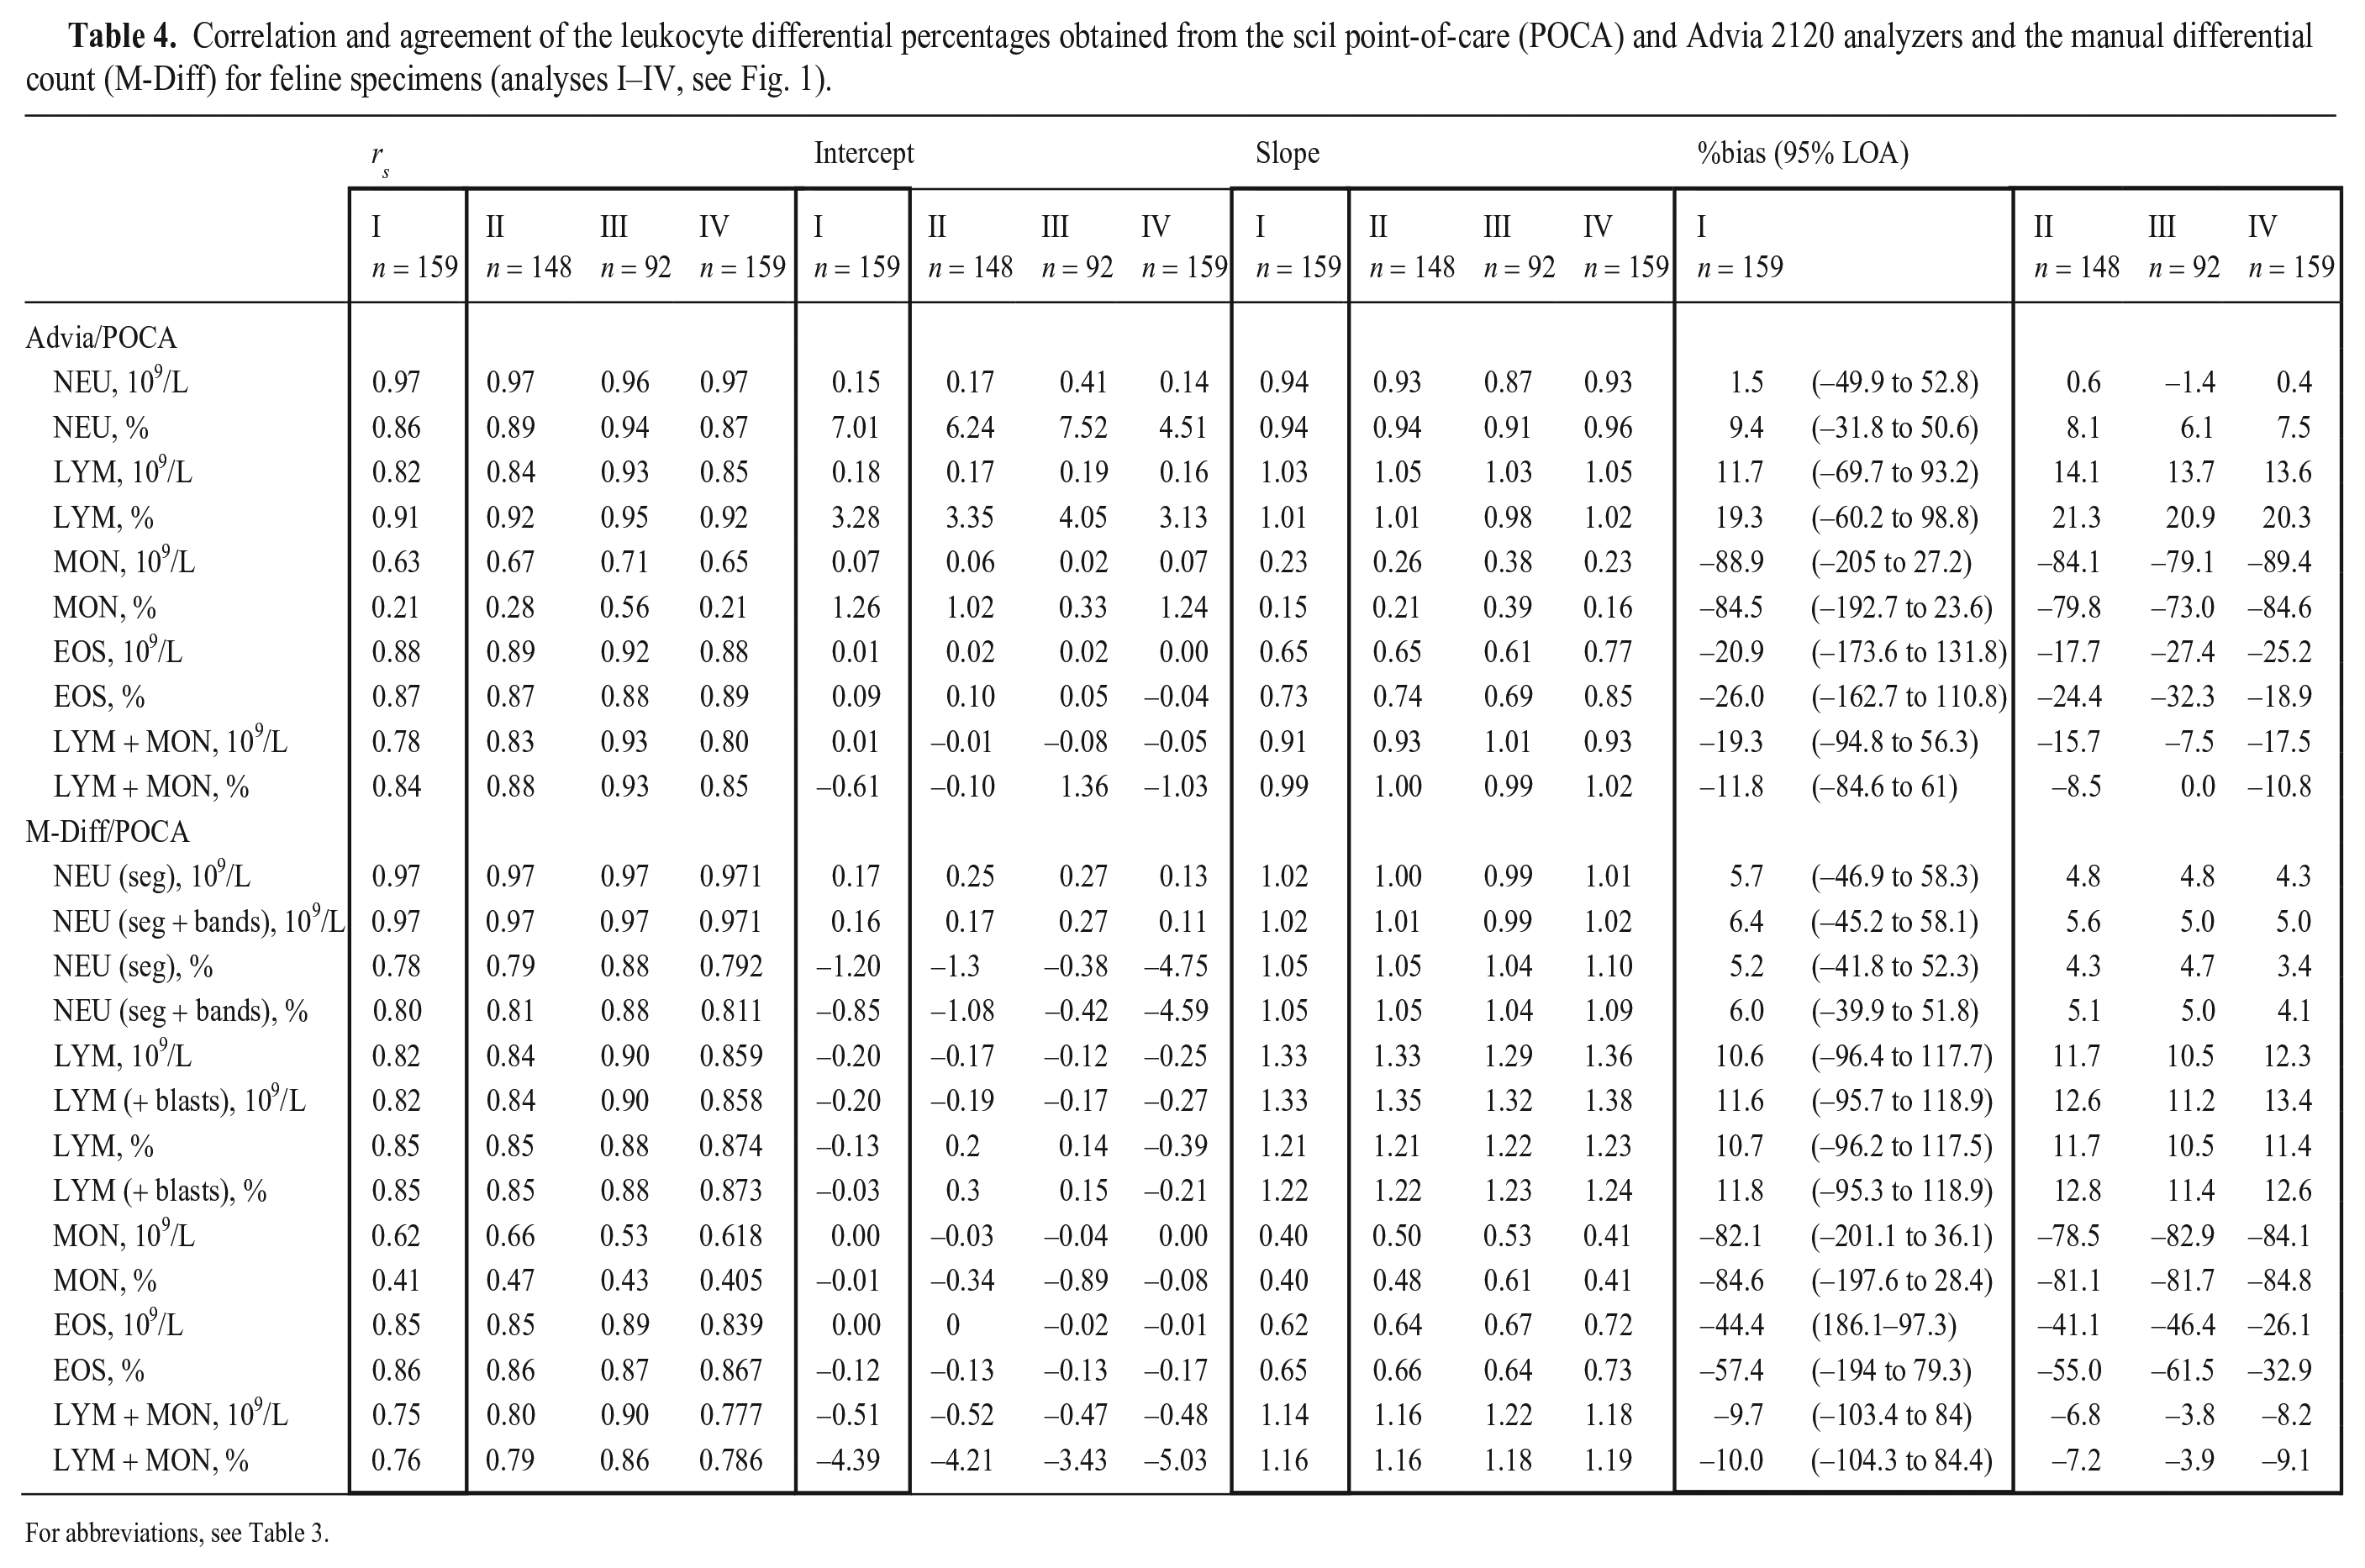
For abbreviations, see Table 3.
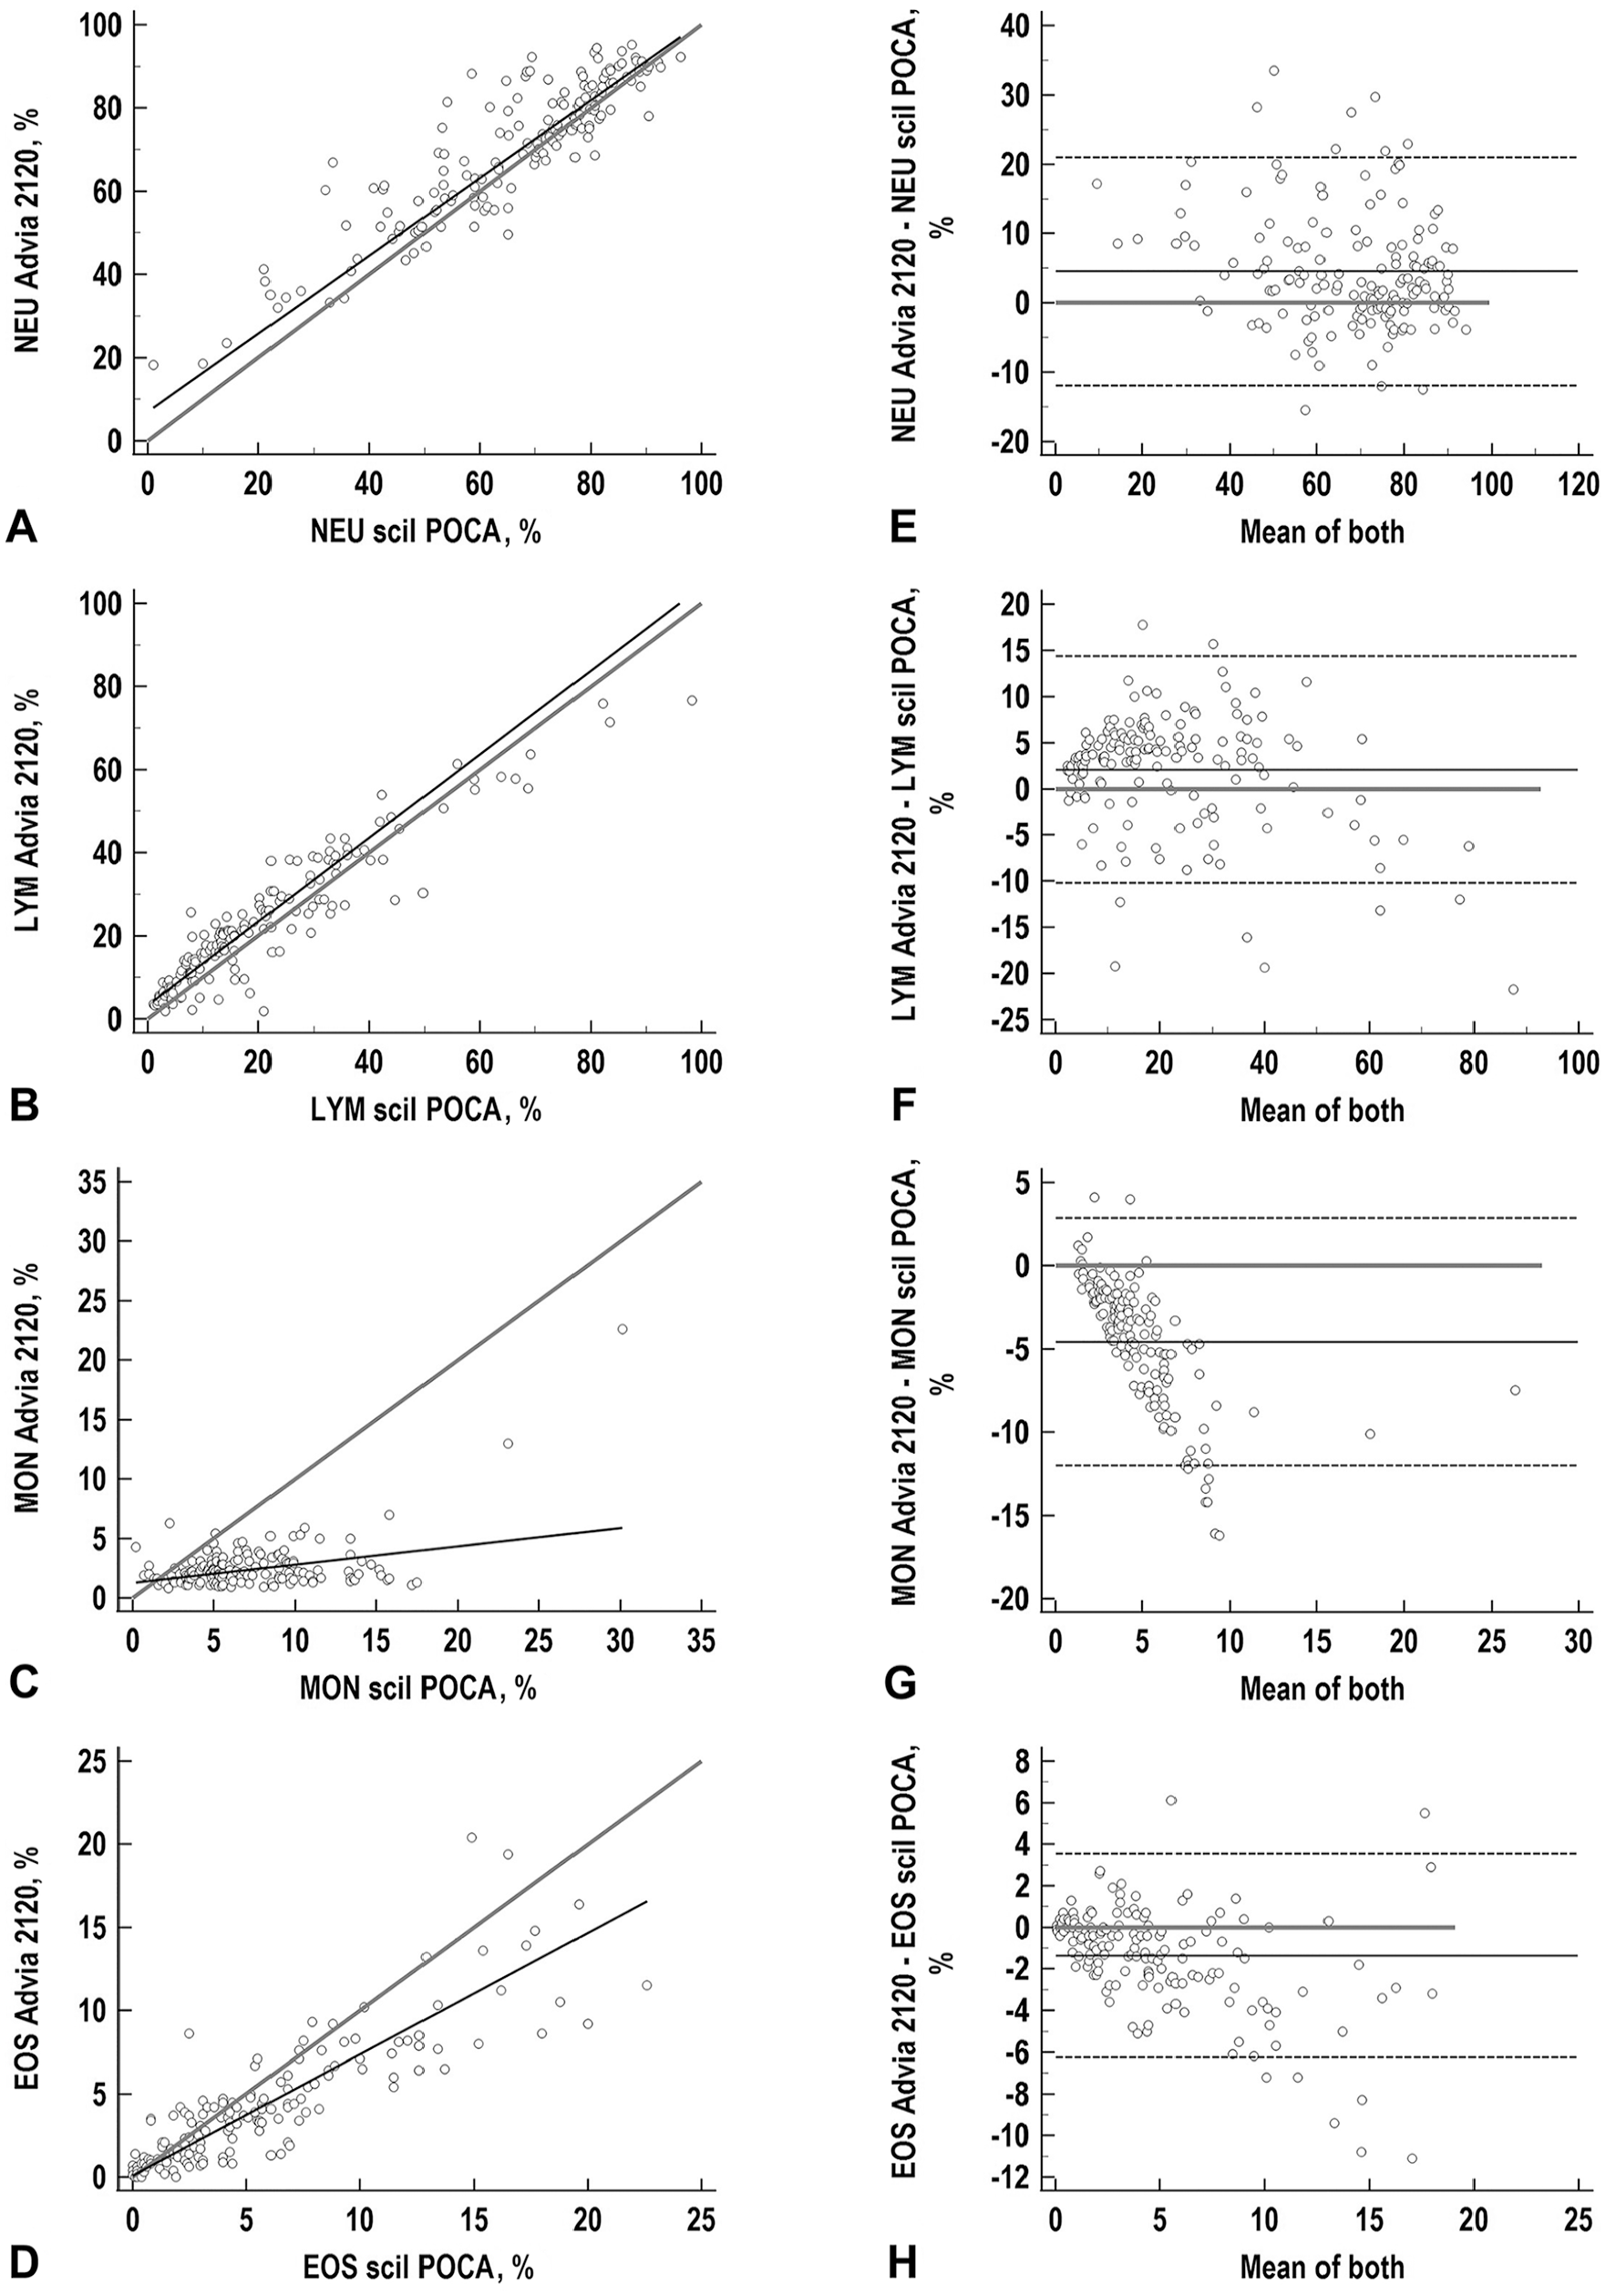
Correlation and agreement of NEU, LYM, MON, and EOS obtained with the scil point-of-care (POCA) and Advia 2120 analyzers for 159 feline samples (analysis I). For abbreviations, see Fig. 2.
Agreement
POCA-Diff compared to M-Diff
In canine samples, biases were minimal (< 2%) for NEU (absolute and %). For LYM (absolute and %), positive biases of 8.8–11.2% were seen, with a proportional bias, especially in higher concentrations. For canine MON and EOS high-negative (MON, −69%) and high-positive (EOS, 17–44%) biases were seen when comparing automated and manual methods. Biases of −15% were determined when LYM and MON were combined and statistically analyzed as one population (Table 3).
In cats, biases of up to 6% were seen for NEU (Table 4). A positive bias of up to 11.8% was seen for feline LYM. High-negative biases were seen for feline MON (−82 to −85%) and feline EOS (−57 to −44%) biases comparing automated and manual methods. Biases of –10% were determined when LYM and MON were combined and statistically analyzed as one population (Table 4).
POCA-Diff compared to Advia-Diff
For canine specimens, small biases of 0.5 to −5.7% were seen for NEU comparing the analyzers. High-negative proportional biases were shown for canine MON (−66.2 to −60.9%). High-positive constant biases were observed for LYM (23.1–29.4%), and high-positive proportional bias for EOS (58.9–75.2%). After combination of LYM and MON, moderate negative biases of −4.5 to −10.8% were demonstrated (Table 3; Fig. 4).
In feline samples, lowest biases were noted for NEU of 1.5–9.4%. For LYM, positive constant biases of 11.7–19.3% were seen when comparing the analyzers. High-negative proportional biases were demonstrated for MON and EOS. Statistical analysis of the combined LYM and MON counts revealed biases of −11 to 19.3% (Table 4; Fig. 5) between the analyzers.
Acceptability/quality specifications
Quality requirements (TEo < TEa) were fulfilled for canine and feline absolute NEU comparing the POCA-Diff with the reference methods (Table 5). For EOS, TEo < TEa was demonstrated for feline absolute EOS comparing the analyzers and canine absolute EOS comparing the POCA-Diff and the M-Diff. For LYM and MON, TEo exceeded TEa, which was primarily attributed to high biases (MON, canine LYM) or high imprecision in combination with high biases (feline LYM; Table 5).
Total observed error (TEo) compared to total allowable error (TEa) of the leukocyte differential count obtained with the scil point-of-care analyzer (POCA) for canine and feline specimens with either the Advia 2120 analyzer or the manual differential count (M-Diff) as reference method (analyses I–IV, see Fig. 1).
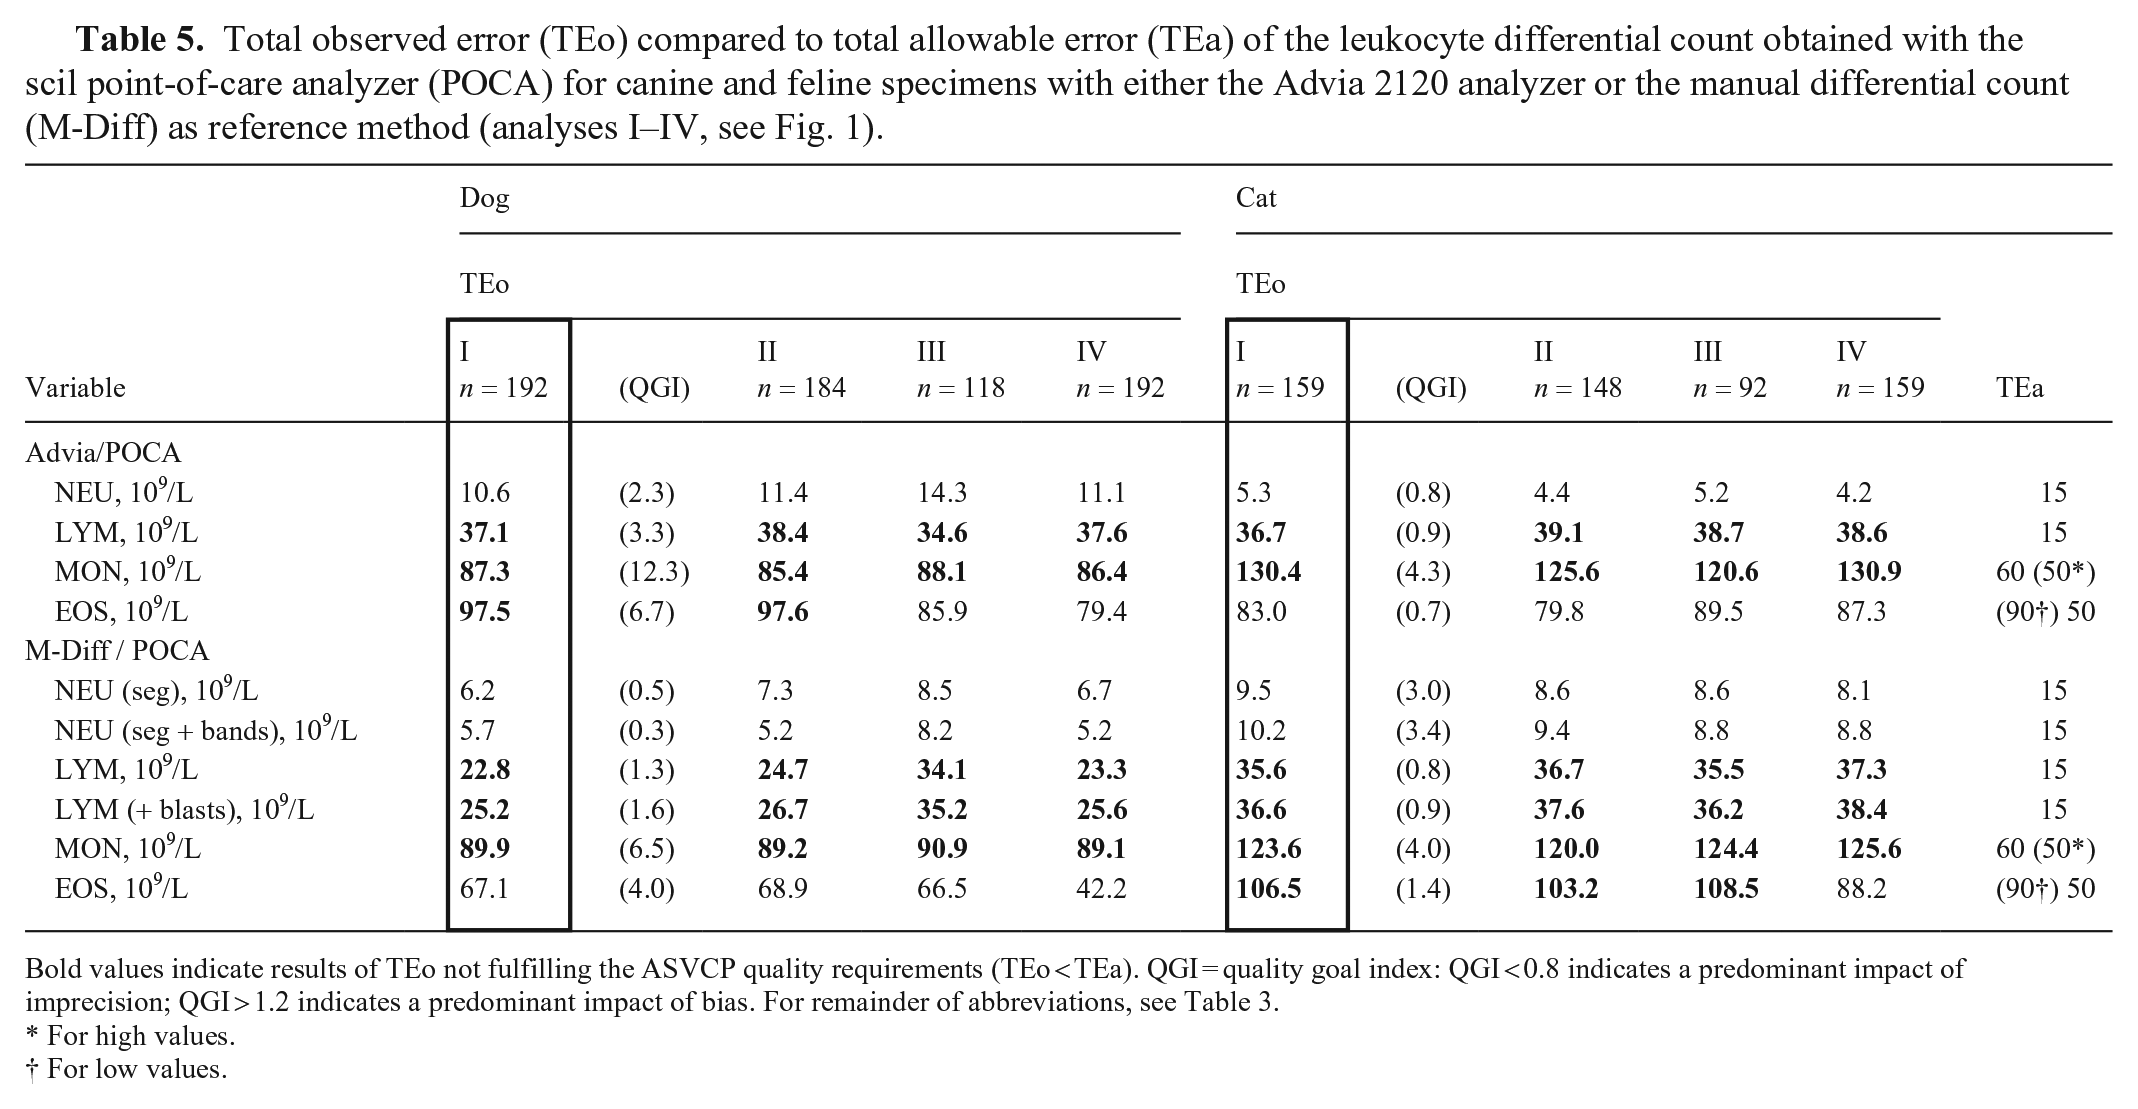
Bold values indicate results of TEo not fulfilling the ASVCP quality requirements (TEo < TEa). QGI = quality goal index: QGI < 0.8 indicates a predominant impact of imprecision; QGI > 1.2 indicates a predominant impact of bias. For remainder of abbreviations, see Table 3.
For high values.
For low values.
Basophil granulocytes
In dogs, the M-Diff revealed basophilia with BASO > 0.1 × 10⁹/L (range: 0.2–0.3 × 10⁹/L; median: 0.2 × 10⁹/L) in 3 of 192 samples, corresponding to BASO of 0.1–0.7 × 10⁹/L (median: 0.1 × 10⁹/L) obtained with the POCA-Diff. In 1 of 3 samples with basophilia in the M-Diff, basophilia was also detected with the POCA-Diff (basophils 0.7 × 10⁹/L). In the remaining 189 samples without basophilia in the M-Diff, basophilia was seen in 71 cases (37%; range: 0.1–1.1 × 10⁹/L, median: 0.2 × 10⁹/L) with the POCA-Diff. Overall, basophilia was seen with the POCA-Diff (range: 0.2–1.1 × 10⁹/L; median: 0.2 × 10⁹/L) in 72 of 192 (37.5%) canine specimens, which was confirmed with the M-Diff in 1 case (0.3 × 10⁹/L). Sensitivity and specificity to detect basophilia with the POCA-Diff, considering the M-Diff as reference, were 33% and 62%, respectively. Given the prevalence of basophilia in canine specimens (1.6%), the negative predictive value was 98.3%, and the positive predictive value was 1.4% for predicting basophilia with the POCA-Diff.
In 14 of 159 feline samples, manual BASO counts of > 0.1 × 10⁹/L (range: 0.2–0.4 × 10⁹/L; median: 0.2 × 10⁹/L) were detected, corresponding to absolute BASO counts of 0.1–0.4 × 10⁹/L (median: 0.1 × 10⁹/L) obtained with the POCA-Diff. In 6 of 14 samples with basophilia in the M-Diff, basophilia was also found with the POCA-Diff (range: 0.3–0.4 × 10⁹/L; median: 0.3 × 10⁹/L). Of the remaining 145 feline samples without basophilia in the M-Diff, 32 cases (22%; range: 0.2–0.6 × 10⁹/L; median: 0.2 × 10⁹/L) had basophilia according to the results of the POCA-Diff. In 38 of 159 (23.9%) cats, basophilia (median BASO count: 0.2 × 10⁹/L; range: 0.2–0.6 × 10⁹/L) was detected with the POCA-Diff, which was confirmed with the M-Diff in 6 cases (range: 0.2–0.4 × 10⁹/L; median: 0.2 × 10⁹/L). Sensitivity and specificity to detect basophilia with the POCA-Diff, considering the M-Diff as reference, were 43% and 78%, respectively. Given the prevalence of basophilia in feline specimens (8.8%), the negative predictive value was 93.4%, and the positive predictive value was 15.8% for predicting basophilia with the POCA-Diff.
Review (analyses II, III) and re-analysis process (analysis IV)
Of the 351 samples (192 dogs, 159 cats) finally considered for statistical analysis and included in analysis I, 19 samples, including 8 of 192 (4.2%) canine samples and 11 of 159 (6.9%) feline samples, were marked with the morphologic flag “abnormal diff.” They were labeled either with “abnormal diff #3” (1 of 8 dogs, 5 of 11 cats) or with “abnormal diff #6” (7 of 8 dogs, 6 of 11 cats). All flagged samples had been classified as correctly flagged based on manual review of cytograms and were excluded from analysis I; thus, analysis II consisted of 332 samples (184 dogs, 148 cats; Fig. 1).
After manual review of scattergrams, we excluded an additional 122 of 332 samples (66 dogs, 56 cats) from analysis II. This excluded 141 of 351 samples from the initial dataset, with 74 of 192 dogs (38.5%) and 67 of 159 cats (42.1%) because of scattergrams that required manual review of blood smears. Overall, 210 samples (118 dogs, 92 cats) were finally included in analysis III (Fig. 1).
Analysis IV included the initial dataset of 351 samples (192 dogs, 159 cats) after re-analysis with an updated software version (v.1.6.1499.0).
Analysis II
Compared to analysis I, exclusion of samples flagged with “abnormal diff” in the POCA-Diff led to increased rs in almost all variables (dog > cat) for the comparison with the reference methods, except for canine MON when comparing automated and manual methods (analysis II; Tables 3, 4). There was no significant reduction in %bias, leading to fulfillment of quality requirements for LYM and MON observed (analysis II; Tables 3–5).
Analysis III
Compared to analysis I, exclusion of samples requiring manual review of a blood smear led to increased rs for most canine WBC populations comparing the POCA-Diff to the reference methods, except for absolute MON and EOS (absolute and %). Compared to analysis II, further increase of rs was demonstrated for absolute LYM for the comparison with the reference methods (analysis III; Table 3).
Compared to analysis I, the rs increased in almost all feline WBC populations, except for absolute NEU comparing the POCA-Diff to the reference methods, and absolute MON (POCA-Diff vs. M-Diff). Compared to analysis II, further increase of rs was demonstrated for all variables between the POCA-Diff and both reference methods (analysis III; Table 4).
There was a reduction in %bias for canine EOS, leading to TEo < TEa. For both species, there was no reduction in %bias leading to fulfillment of quality requirements for LYM and MON (analysis III; Tables 3–5). For the combined statistical analysis of LYM and MON, exclusion of samples requiring review of manual blood smear revealed good-to-excellent correlation and small biases for both species (analysis III; Tables 3, 4).
Analysis IV
In canine samples, compared to analysis I, re-analysis of data with a revised software version did not result in significant increase or decrease of rs (analysis IV; Table 3). In feline samples, slightly increased correlation was observed compared to analysis I, predominantly for LYM (analysis IV; Table 4). Re-analysis after software adaptations resulted in a significant reduction of bias for EOS in both species (dog > cat) comparing the POCA-Diff and M-Diff (analysis IV; Tables 3, 4), which led to TEo < TEa for feline samples (analysis IV; Table 5). When comparing both analyzers, markedly decreased bias for EOS was only observed for canine samples (analysis IV; Tables 3, 4), which also resulted in fulfillment of quality requirements (analysis IV; Table 5). For both species, re-analysis of data did not result in significant decreases in bias associated with a shift towards fulfillment of quality requirements (TEo < TEa) for LYM and MON (analysis IV; Table 5).
Discussion
With the exception of feline MON and canine MON%, we found good-to-excellent correlation between the scil POCA and Advia 2120 for all WBC populations in canine and feline samples. Quality requirements (TEo < TEa) were fulfilled for canine and feline NEU and EOS. Exclusion of samples with potential invalid Diff, either flagged by the scil POCA or based on manual cytogram review, led to increased correlation for most of the variables, but had only minimal effects on bias, thus not resulting in fulfillment of quality goals for LYM and MON.
We found that specific characteristics of dotplots were useful to detect hematologic abnormalities, such as the presence of left shift or immature lymphocytes, although the diagnostic accuracy (e.g., the calculation of sensitivity and specificity) still needs to be determined with higher numbers of samples with specific hematologic abnormalities.
Considering that the scil POCA can be used by users with various degrees of expertise in clinical pathology and experience in the use of instrument flags and in the interpretation of cytograms as QA tools, we focused on analysis I for further discussion of the results of the method comparison study. Given that most of the published validation studies of hematology analyzers have focused on relative differential counts, the following discussion will be based on these percentages for the sake of comparability. However, when assessing the acceptability of Diff results in a clinical context (e.g., the fulfillment of quality goals), interpretation of absolute numbers of NEU, LYM, MON, and EOS is mandatory.16,17,44
For both species, good-to-excellent correlation was seen between analyzers for NEU, LYM, and EOS. For MON, correlation between the POCA-Diff and Advia-Diff was good for canine absolute MON and fair-to-poor for canine MON% and feline MON (absolute and %). Comparing the POCA-Diff with M-Diff, favorable correlation was demonstrated for NEU (absolute and %) and LYM% in dogs and for NEU, LYM, and EOS (absolute and %) in cats. The correlation coefficient serves as a measure of association rather than agreement and is influenced by the range of data and by the precision of results.20,60 Accordingly, given the high number of samples with low monocyte counts, we observed an uneven distribution of samples across the range. Additionally, a higher degree of imprecision is expected for low cell counts associated with scattering of data around the line of best fit in the regression analysis. 60 In our study, imprecision may have contributed to the poor correlation of MON counts between the analyzers for both species. Imprecision may also explain the relatively low correlation between the POCA-Diff and M-Diff for less common WBC populations, such as LYM and MON. For rare cell populations, not only automated results but especially the M-Diff used as a reference method is extremely prone to random error.32,53 Poor correlation of MON counts has been documented for other in-house hematology analyzers, both compared to the Advia-Diff and M-Diff, as well as for Advia-Diff compared to M-Diff, which is attributed to the variable cytomorphology of monocytes.7,25,26,46,59
Summarizing the results of the Passing–Bablok and Bland–Altmann analyses, we observed high-positive and -negative biases for all WBC differential counts except for NEU (dog < cat). For both species, there was a positive constant error for LYM, a negative proportional bias for MON, and a proportional bias for EOS (dog: positive; cat: negative) comparing the analyzers. Systematic error (bias), as part of the calculation of TEo, is relative and is influenced by the inherent performance of the reference methods chosen. 18 Accordingly, comparison of hematology analyzers with respect to bias is difficult given differences in the choice of reference methods and measurement techniques in validation studies. 19 Although highly variable, biases of > 20% were observed for LYM, MON, and EOS for several in-house analyzers and even for larger bench-top analyzers.16,17,52 Despite the knowledge of methodologic differences between laser-based hematology analyzers, overestimation of MON and underestimation of LYM is a well-known phenomenon.7,26 For example, in the ProCyte Dx, WBC are classified based on their DNA/RNA content and their cellular complexity, such that immature neutrophils might be misclassified as lymphocytes and especially as monocytes given their high RNA content. 26 Similarly, for reactive or immature lymphocytes, there might be an overlap with monocytes as well.7,26,39 Correct classification of monocytes is difficult not only for automated but also for manual methods because monocytes can have a highly pleomorphic appearance, and cytologic expertise is required when examining blood smears.1,29 In our study, a possible misclassification of mononuclear WBCs by the scil POCA was supported by the decrease in bias when LYM and MON were combined for statistical analysis, in particular after the review process. In previous studies, the Advia 2120 also tended to overestimate MON, especially in low concentrations, compared to other methods.7,57
We observed a positive proportional bias for canine EOS and a negative proportional bias for feline EOS compared with the reference methods, indicating underestimation of canine EOS and overestimation of feline EOS by the POCA. These results were in contrast to those obtained by the ProCyte Dx compared to the Advia 2120.26,56 Possible discrepancies of correct classification of EOS with automated and manual methods may be attributed to different cytomorphologic features of EOS, such as vacuolation and lack of clear granules (referred to as “gray eosinophils”).23,30,41 Given that gray eosinophils are rare in dogs and usually seen in sighthounds, the presence of gray eosinophils was considered an unlikely cause of error. 23 Additionally, a possible influence of underestimation of canine eosinophils and misclassification as toxic neutrophils by the Advia 2120 as a result of inconsistency in peroxidase staining and cell size, as reported, 57 would rather have positively impacted the accuracy of canine EOS in our study. Finally, the low number of samples with eosinophilia and monocytosis and the lack of assessment of bias at concentration levels of clinical interest should be mentioned as a limitation of our study and should be evaluated in future studies. 20
As previously reported, CVs for NEU, MON, and EOS in canine samples and NEU in feline samples were found to be acceptable for the scil POCA, with the lowest CVs (1–2%) detected for absolute NEU. Higher imprecision with CVs of 7–21% was detected for absolute LYM, MON, and EOS in dogs and 31% for EOS in cats, presumably as a result of low cell counts. 62 Compliance with ASVCP quality guidelines was demonstrated for NEU in both species and in canine EOS comparing both analyzers, and for feline EOS comparing automated and manual methods. Overall, review process and/or software adaptations led to decreased TEo for some parameters; however, a switch to fulfillment of quality goals was only seen for canine and feline EOS. The Diff is likely to demonstrate higher TEo than other hematologic variables, but TEa recommendation for NEU and LYM should be achievable for in-house analyzers. 44 However, highly variable TEo were demonstrated previously for other point-of-care and larger bench-top hematology analyzers for LYM, MON, EOS, and even NEU.16,17,27 In general, expert opinions on the TEa of MON and EOS diverged widely, ranging up to 200% tolerable error, with median values of 60% and 90%, respectively, as adapted by the ASVCP guidelines, thus questioning their clinical relevance, except for extremely high cell counts.16,44 Some authors considered the performance of in-house analyzers as unreliable for cell types other than the most prevalent WBC populations (typically neutrophils) or even generally unsuitable for clinical use, with more than half of analyzers not fulfilling recommended quality requirements for LYM, MON, EOS, and BASO.52,58
Sensitivity and specificity to detect basophilia by the POCA-Diff, considering the M-Diff as reference, were low (33–43% and 62–78%, respectively). This observation is in concordance with previous studies, reporting that the automated BASO count is unreliable and may be associated with a high rate of false-positive results.26,40,56,57 However, in our study, the negative predictive values were high in both species, suggesting that low BASO results are reliable in most cases. Again, the number of samples with basophilia was low in our study and the choice of reference method has an important impact on the results. Given that the M-Diff is known to be highly imprecise for low cell counts, it may be inappropriate to compare results of different methods with BASO counts < 5%.53,56 Also, the Advia 2120 does not reliably detect basophils. 40 Evaluation of a larger number of canine and feline samples with various degrees of basophilia is required to assess the ability of scil POCA to numerically detect basophils and visualize them in cytograms. A higher prevalence of basophilia in the study population could have led to higher positive predictive values for detecting basophilia with the scil POCA.
We assessed the utility of the scil POCA “abnormal diff” flag, a marker for indistinct separation of WBC populations, as a QA tool. Exclusion of flagged samples led to increased correlation between methods for almost all variables (dog > cat), except for canine MON, when comparing automated and manual methods. However, the positive effect on bias and TEo was minimal. The reason for this finding and a limitation of our study may be that the small number of flagged samples (5%) may have led to an underestimate of the positive effect of excluding flagged data.
Thus, we performed an additional review step to exclude samples with abnormal cytograms that were suspicious for possible misclassification. The criteria for the review of cytograms were based on our investigations during the study and our experience with Advia 120/2120 cytograms as published previously.7,43,54 All samples flagged by the scil POCA with “abnormal diff” were classified as correctly flagged based on the review of cytograms and were also excluded in analysis III as a result of the indistinct separation of WBC populations. Exclusion of samples with cytograms considered for review of a manual blood smear resulted in increased correlation between methods for most of the variables and in fulfillment of quality goals for canine EOS. However, fulfillment of the ASVCP quality objectives (TEo < TEa) could not be demonstrated for LYM and MON, even after review of the cytograms, given the failure to decrease bias. Note that our study population included patients from a university hospital with a high number of referrals and critically ill patients. The use of the scil POCA to evaluate specimens submitted primarily as part of screening procedures or health checks with a higher proportion of relatively normal hemograms, as is common in general practices, may have led to different results.
Finally, although there were trends toward decrease of bias% for some WBC populations after re-analysis of the data with software adjustments, particularly feline and canine EOS, quality requirements for LYM and MON could not be reached.
A limitation of our study is that scil POCA and Advia measurements were not performed at the same time after venipuncture. Measurement with the Advia 2120 was performed first, followed by the preparation of blood smears, and thereafter by analysis with the scil POCA. Although the time between measurements with both analyzers was kept as short as possible (< 6 h), it was variable. Dependent on storage time and temperature, as well as of analyzer and species under investigation, storage-related effects on measurands contributing to an inherent increased systematic error must be considered in our study.7,9,22,27,38 According to studies investigating storage-related changes in WBC differential counts, variables of the Diff remained generally stable for 24 h at room temperature. The only exception were monocytes that decreased significantly after 6–12 h of storage.7,9 Thus, a storage-induced effect on our results was considered to be small. A storage-induced decrease in MON would have resulted in a reduction of bias for MON in our study.
We did not assess the effect of interfering substances, which is a further limitation of our study. Even if the influence of hemolysis, lipemia, or hyperbilirubinemia on test results of RBC and related variables as well as on PLT is well-documented, veterinary studies assessing the effects on the Diff are sparse. 27 Hemolysis with moderate-to-high hemoglobin concentrations, the most commonly observed interference in veterinary laboratories, 61 was associated with minimal effects on canine Diffs performed with the Sysmex XN-V analyzer. 27 The same was true for the interference by triglycerides and by bilirubin, given that no significant interference was demonstrated. 27 In clinical practice, interference by hemolysis, lipemia, or icterus are not usually detected in samples referred for hematologic testing because parameters are measured immediately after collection without assessment of plasma color and turbidity after separation. Given that the proportion of samples with hemolysis, lipemia, and icterus was low in our study population, 62 a significant impact of potential interferences on Diffs was considered unlikely. Nevertheless, an interference study should be part of further investigations concerning the scil POCA. We excluded samples with macroscopic clots and samples with evidence of microagglutination flagged by the analyzer from our study given that clotting might lead to falsely decreased and unpredictable WBC counts as a result of WBC trapping within clots.5,22
A limitation of our study is that we used the intra-assay CV to calculate TEo, although published guidelines recommend using the inter-assay CV derived from QCM. 44 We chose to use the intra-assay CV derived from species-specific samples because standard QCM may not be interchangeable with veterinary patient samples and species-specific QCM was not available. 5 Another limitation is that we did not exclude outliers from the statistical analysis because the Passing–Bablok regression analysis allows the inclusion of extreme values. 31 Finally, the rules that we used for interpretation of the internal QC results of the scil POCA allowed higher variability of the WBC count (10–20%) than the national rules applied for the Advia 2120 (6.5%), 50 even if the allowed variation was within the limits of the recommended TEa for the WBC count. 44 Given that the scil POCA was used only temporarily for the method validation study in our laboratory, there was no connection to the laboratory information system and the software used for QC for cost reasons. A similar problem exists with many method validation studies, which is probably why QC rules are not generally given.7,26,39
Footnotes
Acknowledgements
We thank the medical technologists of the central laboratory, Faculty of Veterinary Medicine, Justus-Liebig-University Giessen, Germany for helping with the manual methods. The scil vCell5 analyzer used in our study was made available as a free loan by scil Animal Care (Viernheim, Germany).
Declaration of conflicting interests
The authors have received funding of the study by scil Animal Care (Viernheim, Germany); however, the company was not involved in the interpretation or publication of the results.
Funding
Our study was financially supported by scil Animal Care (Viernheim, Germany). Reagents and QCM were provided by scil Animal Care and Norma Instruments (Budapest, Hungary).