
Abstract
Heinz bodies (HBs) are known to interfere with automated hematology in cats, particularly with the white blood cell (WBC) count. We evaluated the influence of feline HBs on the complete blood count (CBC) results obtained using a flow cytometry–based analyzer. We retrospectively selected cats with circulating HBs and reviewed the results of their CBCs, including red blood cell (RBC) indices, basophil/lobularity (Baso) WBC count (WBCB), peroxidase (Perox) WBC count (WBCP), and cytograms. Based on the presence or absence of HB-related artifacts in their Baso cytogram, cats were grouped into Baso-HBs and HBs groups, respectively, for comparison. The WBCB and WBCP were compared to manual counts of WBCs carried out on blood smears at 400× (MC-WBC). We included 32 cats in our study: 9 of 32 were in the Baso-HBs group, and 23 of 32 were in the HBs group. Baso-HBs cats had a significantly increased HB percentage (p < 0.001), WBCB (p < 0.001), difference between WBCB and WBCP (p < 0.001), lymphocyte count (p < 0.001), mean corpuscular hemoglobin concentration (p < 0.001), and difference between calculated and measured erythrocyte hemoglobin concentrations (p < 0.001) compared to HBs cats. In Baso-HBs cats, the WBCB was significantly higher than the WBCP (p = 0.02); no significant difference was detected between the WBCP and the MC-WBC (p = 0.88). Evaluation of automated CBC results raised the suspicion of HB-related interference when using a hematology analyzer in cats; hence, blood smear examination remains essential in routine practice.
Introduction
Heinz bodies (HBs) are clumps of oxidized and precipitated hemoglobin on the inner surface of the erythrocyte membrane that can be detected frequently in circulating red blood cells (RBCs) in cats.5,10 Oxidative damage could arise from exposure to toxins, such as propylene glycol,7,27 onion-containing diets, 21 drugs (such as acetaminophen, methylene blue, and propofol), and other causes of methemoglobinemia.2,16,19 Increased formation of HBs may also occur in cats with spontaneous diseases, such as diabetes mellitus, 6 hyperthyroidism, and lymphoma. 5
Feline erythrocytes, given their peculiar hemoglobin structure, are particularly prone to hemoglobin oxidative damage and HB formation. Moreover, in cats, the spleen is generally unable to remove RBCs containing HBs. 8 For these reasons, clinically healthy and non-anemic cats might have up to 5% of circulating RBCs with HBs, and their presence may be >50% when disease is present. 5 HBs can be seen in blood smears routinely stained with Romanowsky staining; however, smears are best evaluated using a supravital dye, such as brilliant cresyl blue (BCB). 13 To our knowledge, although different thresholds have been proposed to enumerate HBs in feline blood smears, 5 there are no specific reference intervals.
HBs are known to interfere with automated hematology assays in humans9,12 and in cats.25,28 The presence of numerous HBs in 2 cats gave an erroneous total white blood cell (WBC) count of >100 WBCs × 109/L when using an automated impedance cell counter. 28 An erroneously increased leukocyte count of 69.8 WBC × 109/L, in a basophil reagent channel of a laser flow cytometry hematology analyzer (Technicon H1; Technicon Instruments, Tarrytown, NY), has been reported in the complete blood count (CBC) of a cat with HBs and hemolytic anemia. This finding was associated with peculiar WBC cytograms. 25
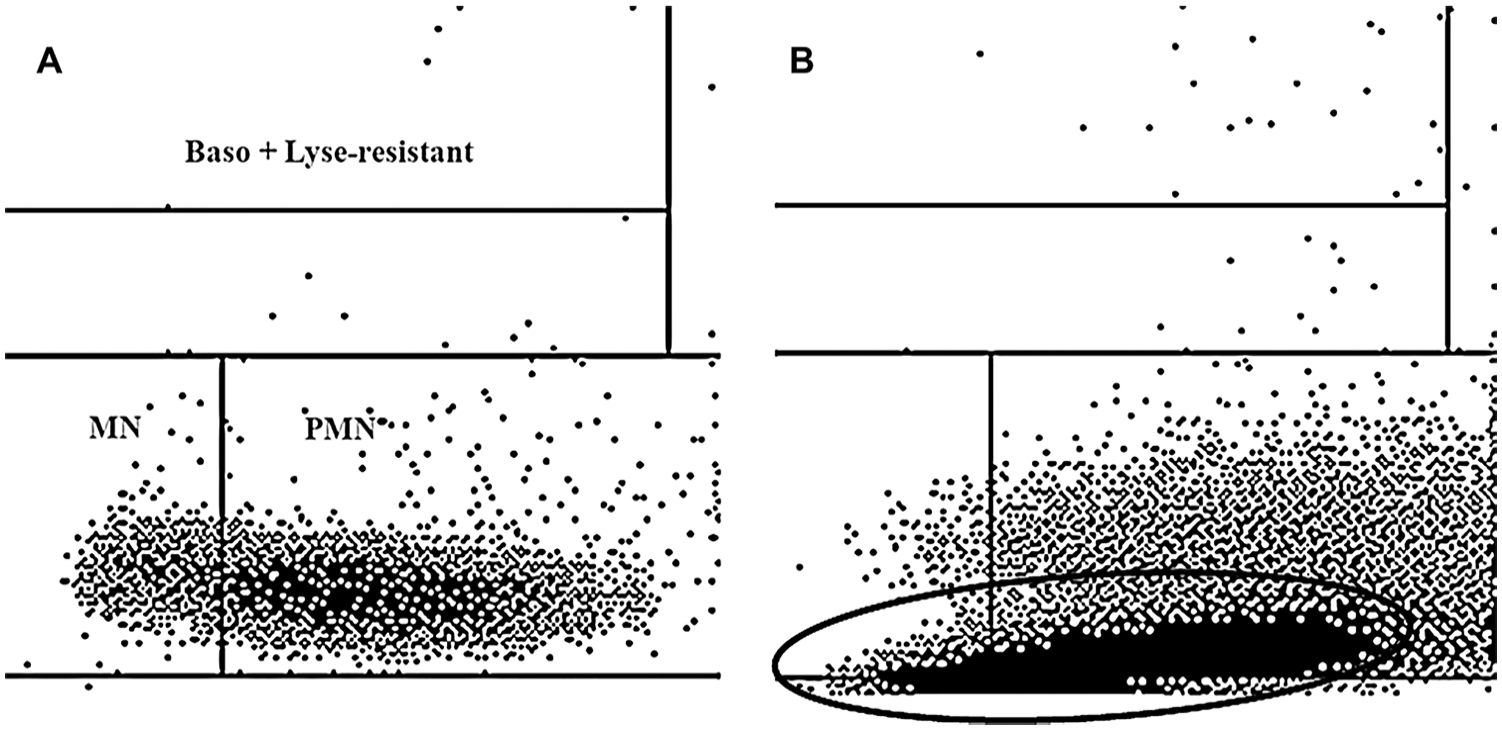
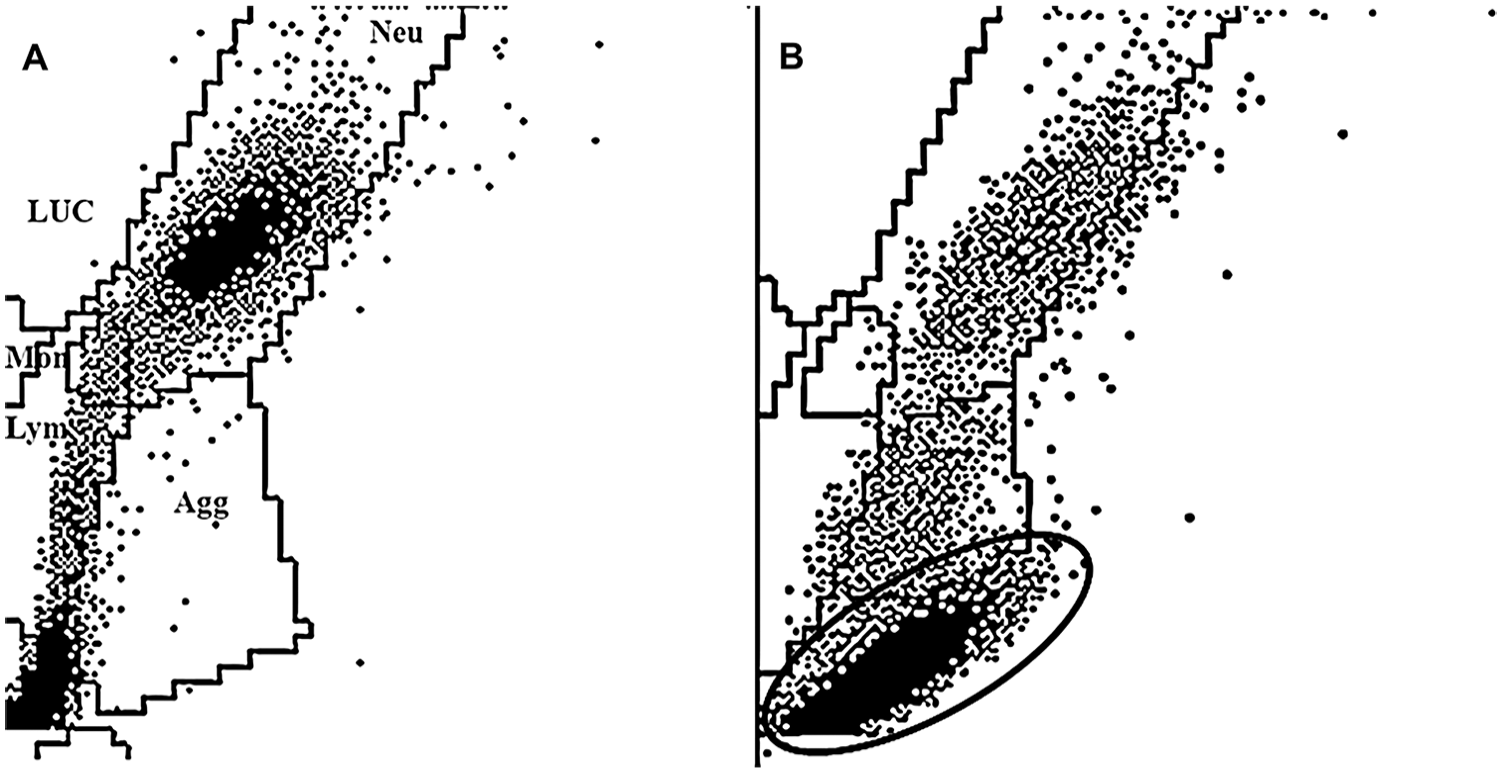
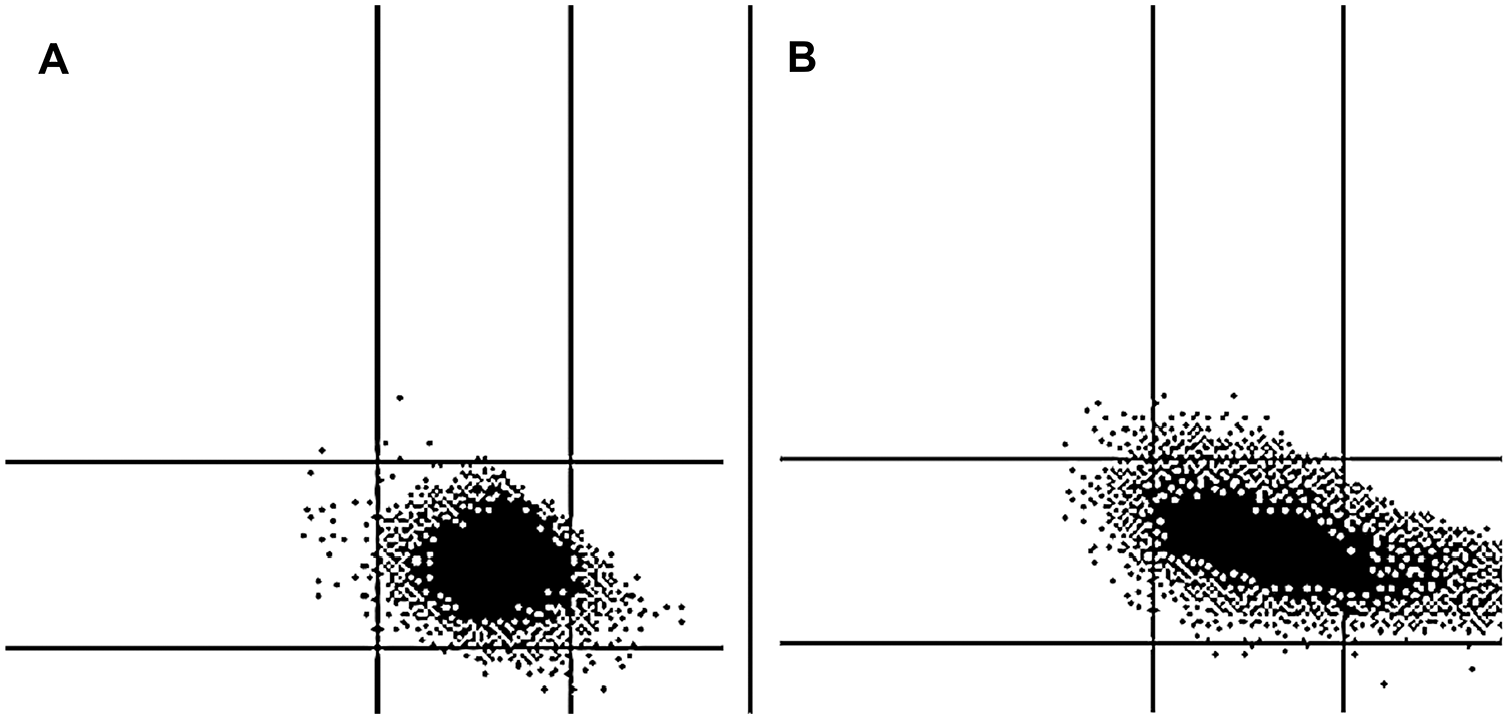
Some automated hematology systems have been validated for routine use in small animals.4,14,15,17,18 The ADVIA 2120 system (Siemens Healthcare Diagnostics, Tarrytown, NY) is an advanced flow cytometry–based blood analyzer with similarities to the instrumentation cited above (Technicon H1).17,25 The ADVIA system uses different channels for the quantification of hemoglobin, RBCs, platelets, WBCs (total and differential), and reticulocytes. For the total leukocyte count, this system utilizes the basophil/lobularity assay (Baso); in this channel, all WBCs except basophils are stripped of their cytoplasm, and are measured by nuclear shape and complexity. The results are also graphically displayed using a Baso cytogram (Fig. 1). 17 A differential leukocyte count is also obtained in another channel by the mean of a peroxidase cytochemical reaction (Perox); the results are reported numerically and displayed graphically in the Perox cytogram (Fig. 2). 17 In humans, the results generated by automated hematology analyzers are rarely questioned by clinical pathologists, and only in selected cases do they need to be confirmed by microscopic examination of blood smears. More often, the evaluation of cytograms and the interpretation of reported flags allow for a definitive diagnosis. In contrast, microscopic evaluation of blood smears is still considered mandatory in veterinary medicine because graphical and flag algorithm interpretation is not well established.17,22
Given the potential confounding effect of HBs on automated hematology results, we evaluated the influence of feline HBs obtained with an automated analyzer on the leukocyte count and other CBC results, including cytograms and indices. Our hypothesis was that HBs in elevated numbers could be suspected or even detected with the evaluation of automated CBC graphical and numerical results. Our secondary objective was the evaluation of any artifact related to HB presence at different times during the follow-up of selected cases.
Materials and methods
Case selection
We reviewed hematology data obtained by an automated hematology assay (ADVIA 2120) and the results of blood smear microscopic examination performed at a university veterinary hospital, between January 2015 and December 2017, in order to identify cats with HBs. Medical records of the cases included were additionally examined in order to retrieve clinical and clinicopathologic data including signalment, etiology of HB formation, and numerical and graphical CBC results.
Cats with artifactual changes related to HBs in the Baso scattergram, consisting of a cluster of dots lying at the bottom threshold of this cytogram, as described previously, 25 were included in the Baso-HBs group (Fig. 1). Cats with HBs in different percentages on blood smear evaluation and without any artifacts in their cytograms were included in the HBs group. The results of multiple CBCs from the same cat in the Baso-HBs group, when available, were categorized in different arbitrary times after inclusion in the study: T1 (1–3 d), T2 (4–7 d), and T3 (8–14 d).
Blood collection and analysis
Blood samples were obtained by venipuncture using a vacuum system (Vacutest Kima, Arzergrande, Italy), and K3-EDTA blood samples were processed and analyzed within 2 h after collection. The following automated CBC variables were reviewed: Baso total WBC count (WBCB); Perox total WBC count (WBCP); difference between WBCB and WBCP (ΔWBCB-WBCP); percentage of mononuclear cells (MNs) and polymorphonuclear cells (PMNs); percentage and absolute number of neutrophils, lymphocytes, monocytes, eosinophils, basophils, and large unstained cells (LUCs); RBC count; hematocrit value (Hct); mean corpuscular volume (MCV); red cell volume distribution width (RDW); measured hemoglobin (mHb); calculated Hb (cHb); Hb concentration distribution width (HDW); mean corpuscular Hb (MCH); mean corpuscular Hb concentration (MCHC); corpuscular Hb concentration mean (CHCM); difference between MCHC and CHCM (ΔMCHC-CHCM); reticulocyte percentage (RP) and concentration (RC); and platelet count and mean platelet volume (MPV). The Baso, Perox, and RBC cytograms were also reviewed by 2 of the authors (F Dondi, C Agnoli). Hematology system flags were retrieved from the automated analyzer database; in particular, the percentage of cases with Baso no valley (B-NV; no valid separation between the MN and PMN population in the Baso cytogram), Perox no valley (PX-NV; no valid separation between the noise and lymphocyte population in the Perox cytogram), and a comparison error MCHC-CHCM (CHCMCE) >19 g/L, following the manufacturer’s indications for humans (Bayer HealthCare, ADVIA 2120/2120i Operator’s guide, 2010), were compared between groups.
Blood smears were stained with May Grünwald–Giemsa (MGG; Merck KGaA, Darmstadt, Germany) and were evaluated microscopically. Manual total and differential leukocyte counts were carried out 11 ; in particular, the WBC differential count was determined by counting 100 consecutive leukocytes at 1,000×; nucleated red blood cells (NRBC) were also enumerated and recorded as NRBCs/100 WBCs, when present. 1 Erythrocyte and leukocyte morphology, and the estimation of platelet number were evaluated at 1,000×. The HB percentage on RBCs was estimated on 1,000 RBCs and reported as absolute values and percentage categories: + if <10% (occasional presence); ++ if 10–50% (moderate presence); +++ if >50% (marked presence), as suggested previously. 5 All manual counts were carried out in a monolayer area of the smears. In the Baso-HBs group, a WBC manual total estimation (MC-WBC) was determined by multiplying the average number of WBCs counted in 10 fields at 400× by 1.6 × 10⁹/L (Christopher MM. Evaluation of the blood smear. Proc 29th World Small Anim Vet Assoc World Congress; Oct 2004; Rhodes, Greece); The HBs were also evaluated and enumerated as a percentage of HBs on 1,000 RBCs, on a supravital BCB-stained blood smear (Fig. 3; Sarstedt, Nümbrecht, Germany).5,13
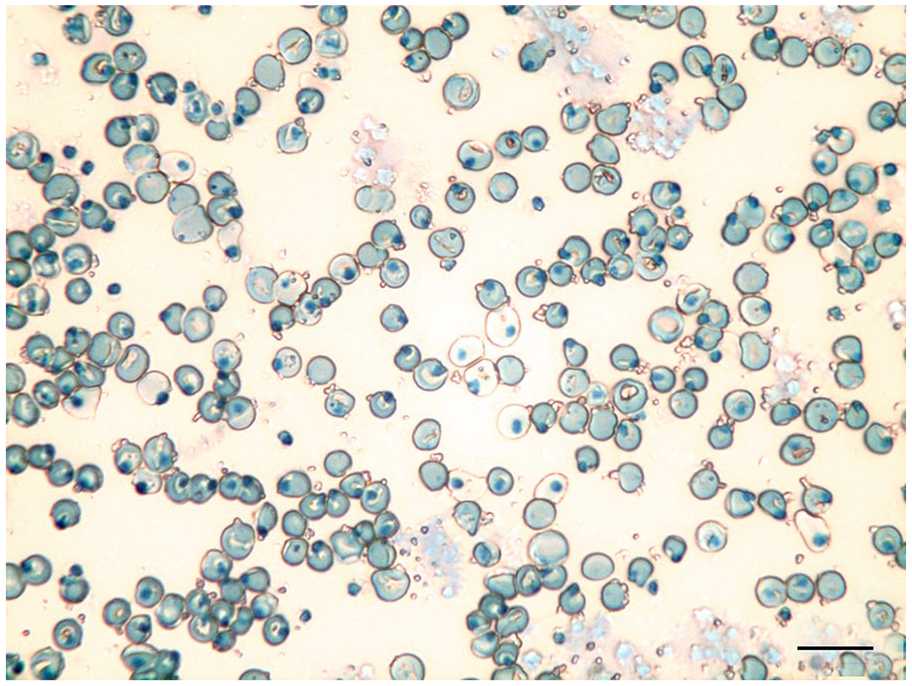
Peripheral blood smear of a cat showing numerous Heinz bodies projecting from the erythrocyte membrane. Brilliant cresyl blue, 600×. Bar = 10 µm.
Statistical analysis
All data were evaluated with descriptive statistics and reported as median and range (minimum–maximum) or as mean ± standard deviation, based on their distribution. Normality was checked graphically and using the Shapiro–Wilk test. Differences between groups were evaluated using independent sample t-test or Mann–Whitney U test for normally and non-normally distributed values, respectively. In the Baso-HBs group, results at different times were compared using Friedman analysis of variance (ANOVA). Categorical data were analyzed using the Fisher exact test or the chi-squared test. Receiver operating characteristic (ROC) curves were used to find the optimal cutoff values of ΔMCHC-CHCM, ΔWBCB-WBCP, and HB% with the maximal sum of sensitivity and specificity for prediction of the presence of the artifactual changes related to HBs in the Baso scattergram (as reported above). The area under the curve (AUC) was calculated. A p ≤0.05 was considered significant. Statistical analysis was carried out using MedCalc Statistical Software v.18.2.1 (MedCalc Software, Ostend, Belgium).
Results
Thirty-two cats with HBs were included in our study; 9 of 32 in the Baso-HBs group and 23 of 32 in the HBs group. The median age was 93 mo (3–192 mo) in the Baso-HBs group and 113 mo (4–312 mo) in the HBs group. In the Baso-HBs group, 5 of 9 cats were female (3 spayed), and 4 of 9 were male (3 neutered); in the HBs group, 9 of 23 were female (6 spayed), and 14 of 23 were male (13 neutered). The breeds in the Baso-HBs group included European domestic shorthair (8 of 9) and Maine Coon (1 of 9) cats; those in the HBs group included European domestic shorthair (19 of 23), Birman (2 of 23), Maine Coon (1 of 23), and Persian (1 of 23) cats.
In the Baso-HBs group, an association with diseases known to promote HB formation was identified in 6 of 9 cats: diabetic ketoacidosis (n = 3), chronic enteropathy or lymphoma (n = 2), and onion poisoning (n = 1); in 3 of 9 cats, the etiology of HB formation remained unknown; intoxication (n = 2) and trauma (n = 1) were suspected. In the HBs group, HB formation was associated with lymphoma (n = 4) and diabetic ketoacidosis (n = 3); in 16 of 23, the etiology of the HB remained unknown, and these cats were affected by acute or chronic enteropathy (n = 5), chronic kidney disease (n = 3), feline leukemia virus or feline immunodeficiency virus infection (n = 2), diaphragmatic hernia (n = 1), Cushing syndrome (n = 1), non-regenerative anemia (n = 1), allergic dermatitis (n = 1), neurologic disease (n = 1), and trauma (n = 1).
Complete hematology and ROC curve analysis results are reported in Tables 1–3. The number and percentage of HBs on RBCs were significantly increased in the Baso-HBs group as compared to the HBs group (Table 1). In particular, a marked presence of HBs was detected more frequently in the Baso-HBs group than in the HBs group (Table 1). The Baso-HBs group had significantly increased MCH, MCHC, ΔMCHC-CHCM, RP, and RC when compared to the HBs group (Table 1). The MCHC values were significantly higher compared with the CHCM in both the Baso-HBs and HBs groups (p < 0.001 and p = 0.01, respectively; Fig. 4).
Complete blood count and blood smear evaluation results regarding erythrocytes and platelets in Baso-HBs and HBs cats.
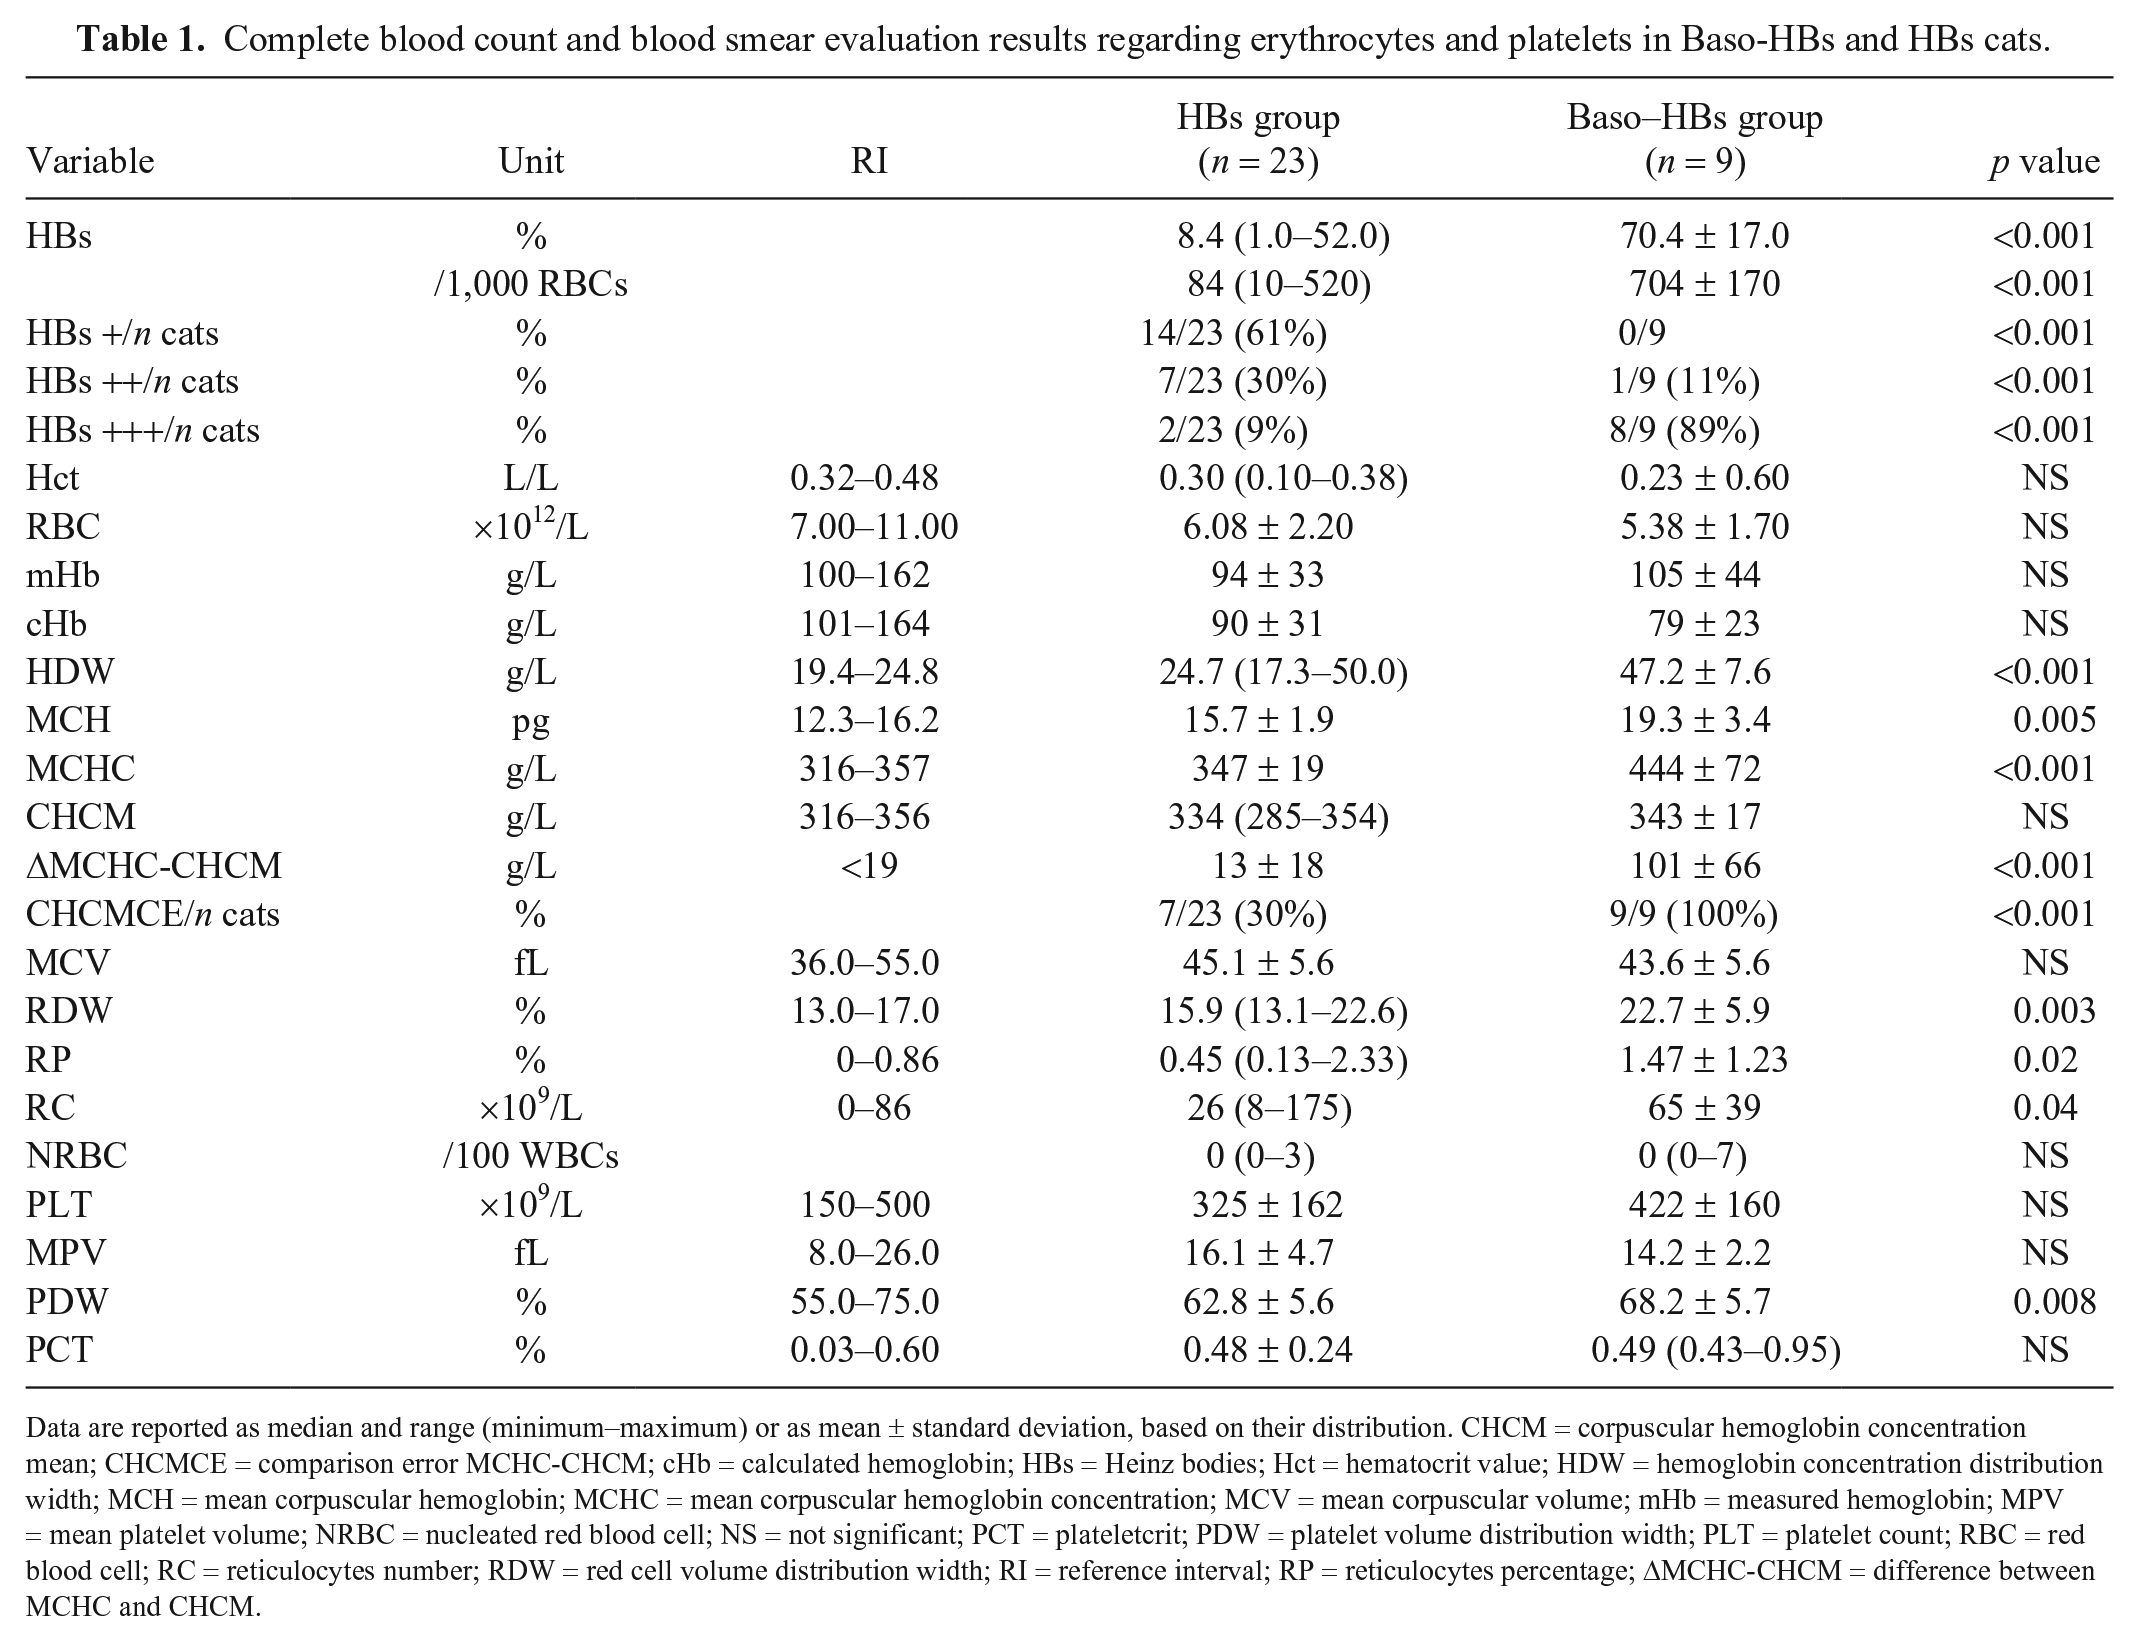
Data are reported as median and range (minimum–maximum) or as mean ± standard deviation, based on their distribution. CHCM = corpuscular hemoglobin concentration mean; CHCMCE = comparison error MCHC-CHCM; cHb = calculated hemoglobin; HBs = Heinz bodies; Hct = hematocrit value; HDW = hemoglobin concentration distribution width; MCH = mean corpuscular hemoglobin; MCHC = mean corpuscular hemoglobin concentration; MCV = mean corpuscular volume; mHb = measured hemoglobin; MPV = mean platelet volume; NRBC = nucleated red blood cell; NS = not significant; PCT = plateletcrit; PDW = platelet volume distribution width; PLT = platelet count; RBC = red blood cell; RC = reticulocytes number; RDW = red cell volume distribution width; RI = reference interval; RP = reticulocytes percentage; ΔMCHC-CHCM = difference between MCHC and CHCM.
Automated complete blood count and manual count results regarding the WBC in Baso-HBs and HBs cats.
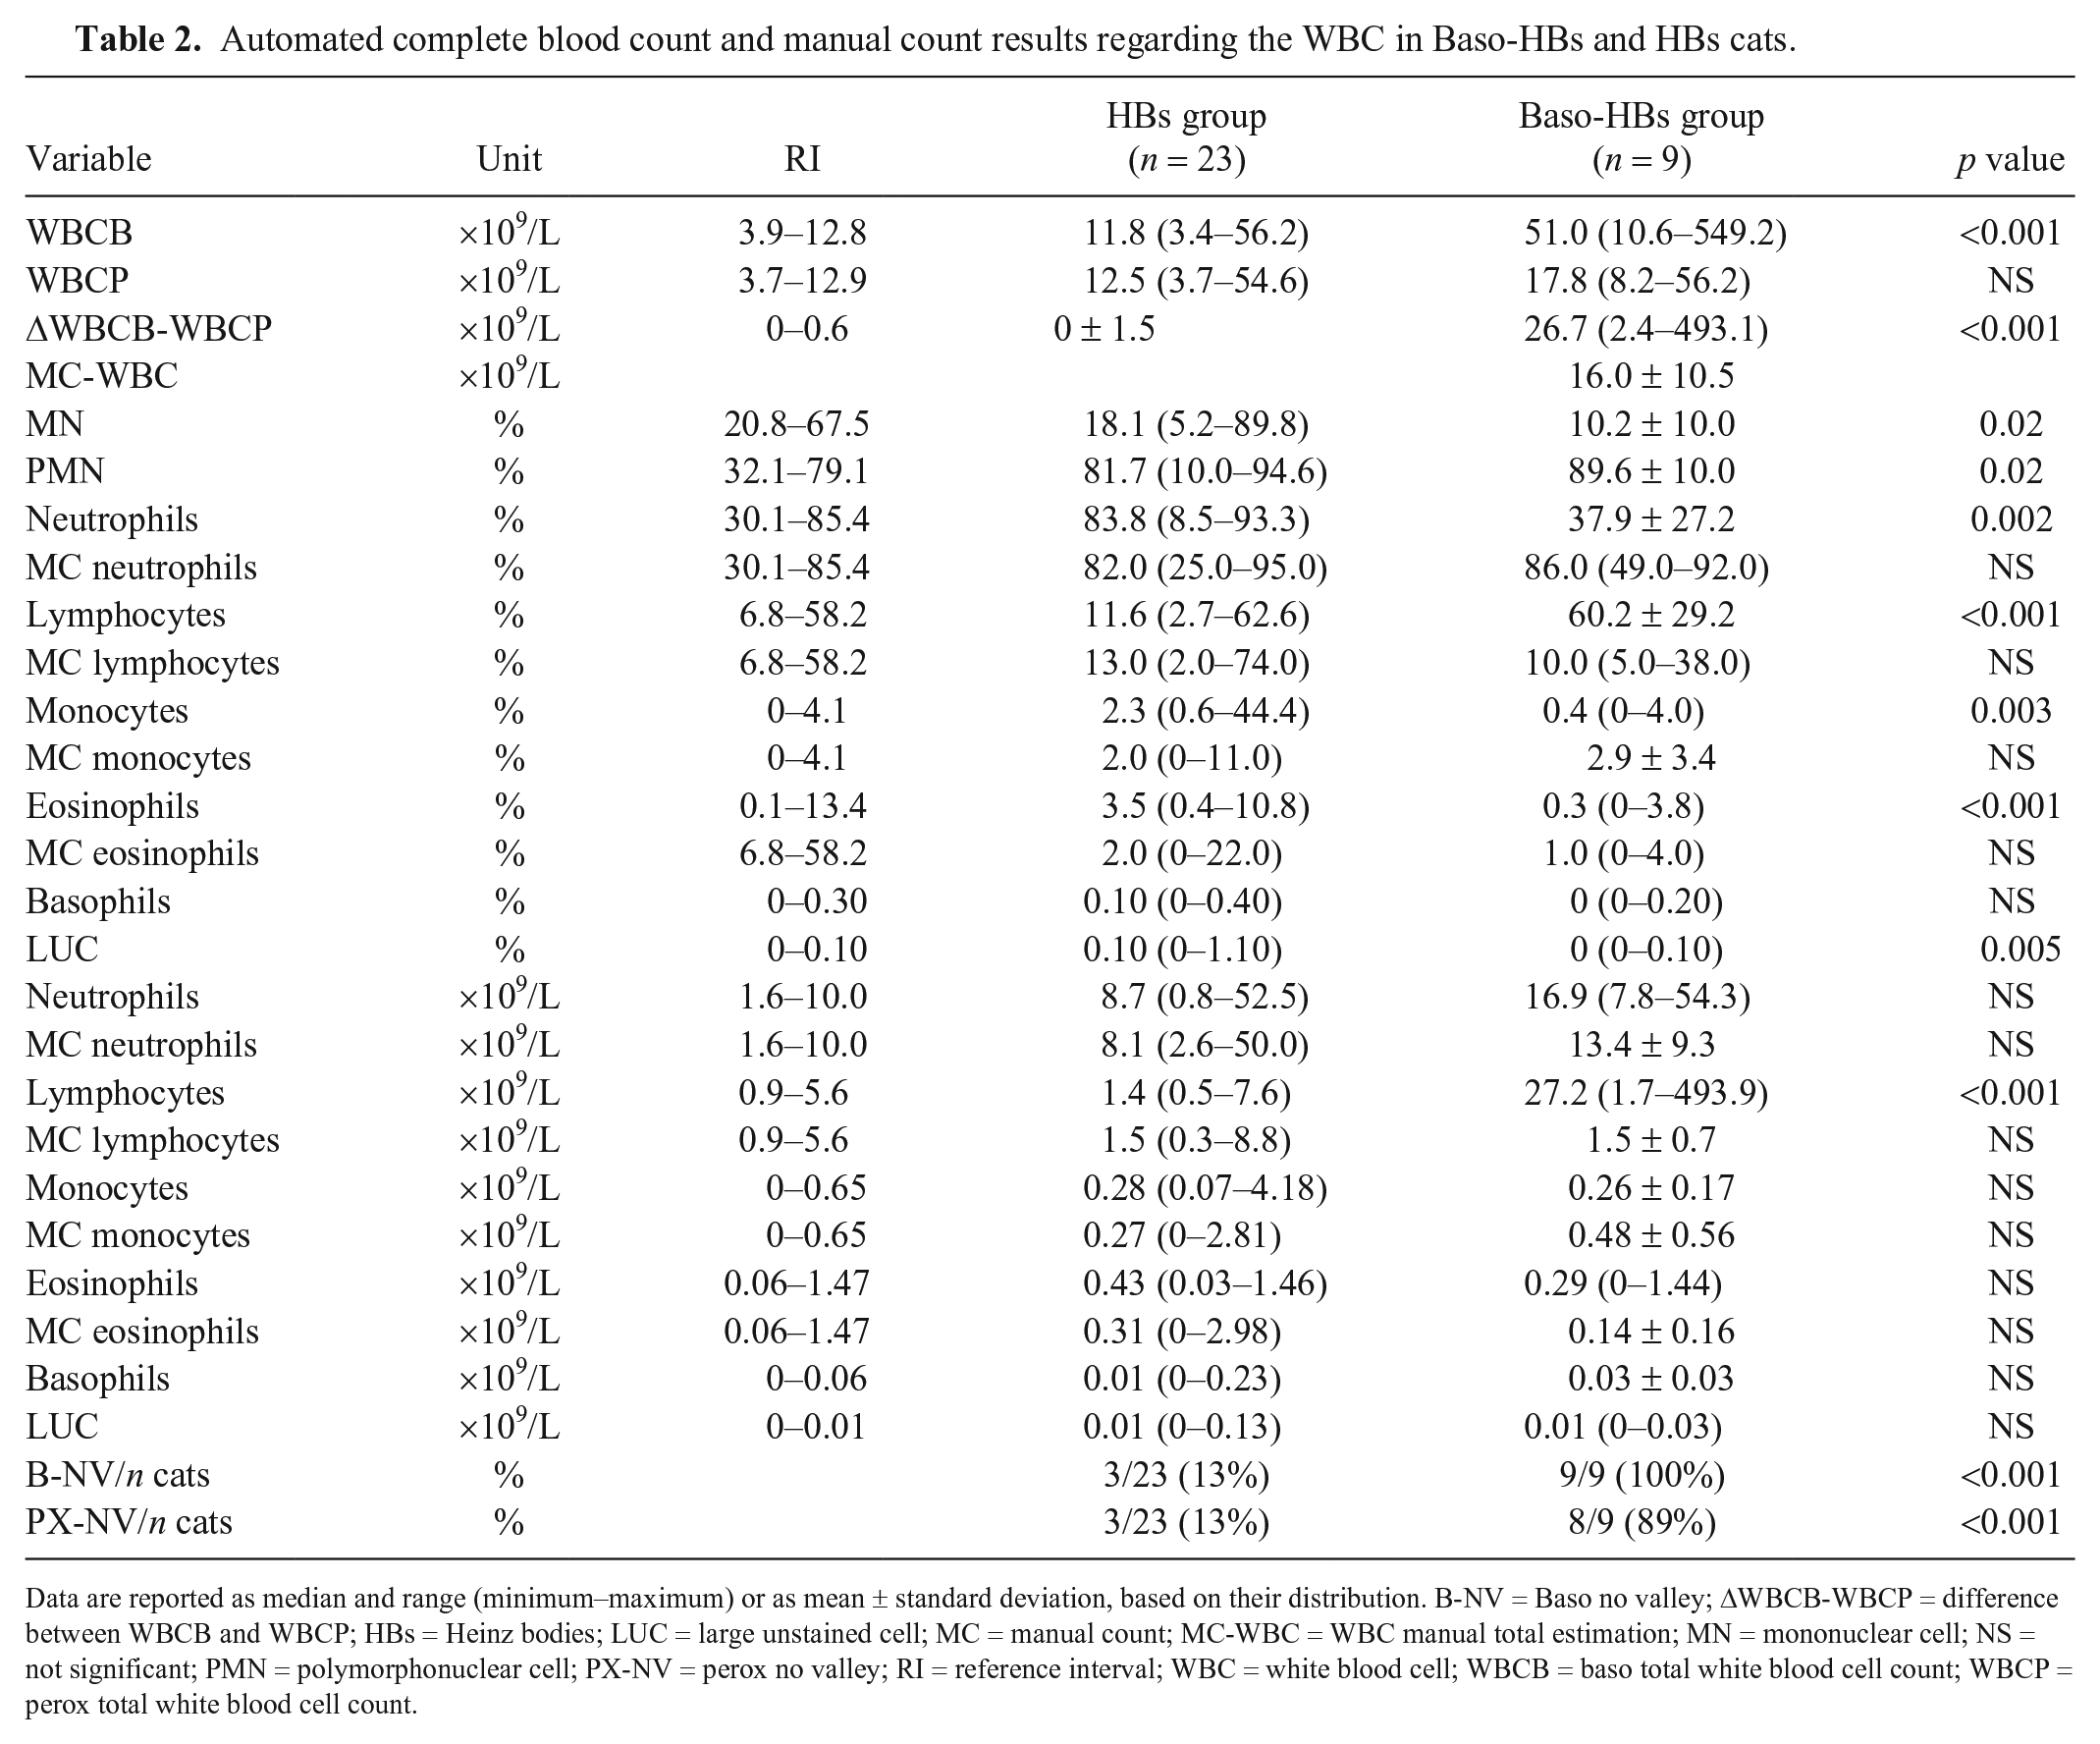
Data are reported as median and range (minimum–maximum) or as mean ± standard deviation, based on their distribution. B-NV = Baso no valley; ΔWBCB-WBCP = difference between WBCB and WBCP; HBs = Heinz bodies; LUC = large unstained cell; MC = manual count; MC-WBC = WBC manual total estimation; MN = mononuclear cell; NS = not significant; PMN = polymorphonuclear cell; PX-NV = perox no valley; RI = reference interval; WBC = white blood cell; WBCB = baso total white blood cell count; WBCP = perox total white blood cell count.
Results of the ROC curve analyses evaluating HB%, ΔMCHC-CHCM, and ΔWBCB-WBCP values for the differentiation between cats with or without HB-related artifacts in their Baso cytograms. Cutoff values with maximal sensitivity and specificity for the presence of the artifact are provided.
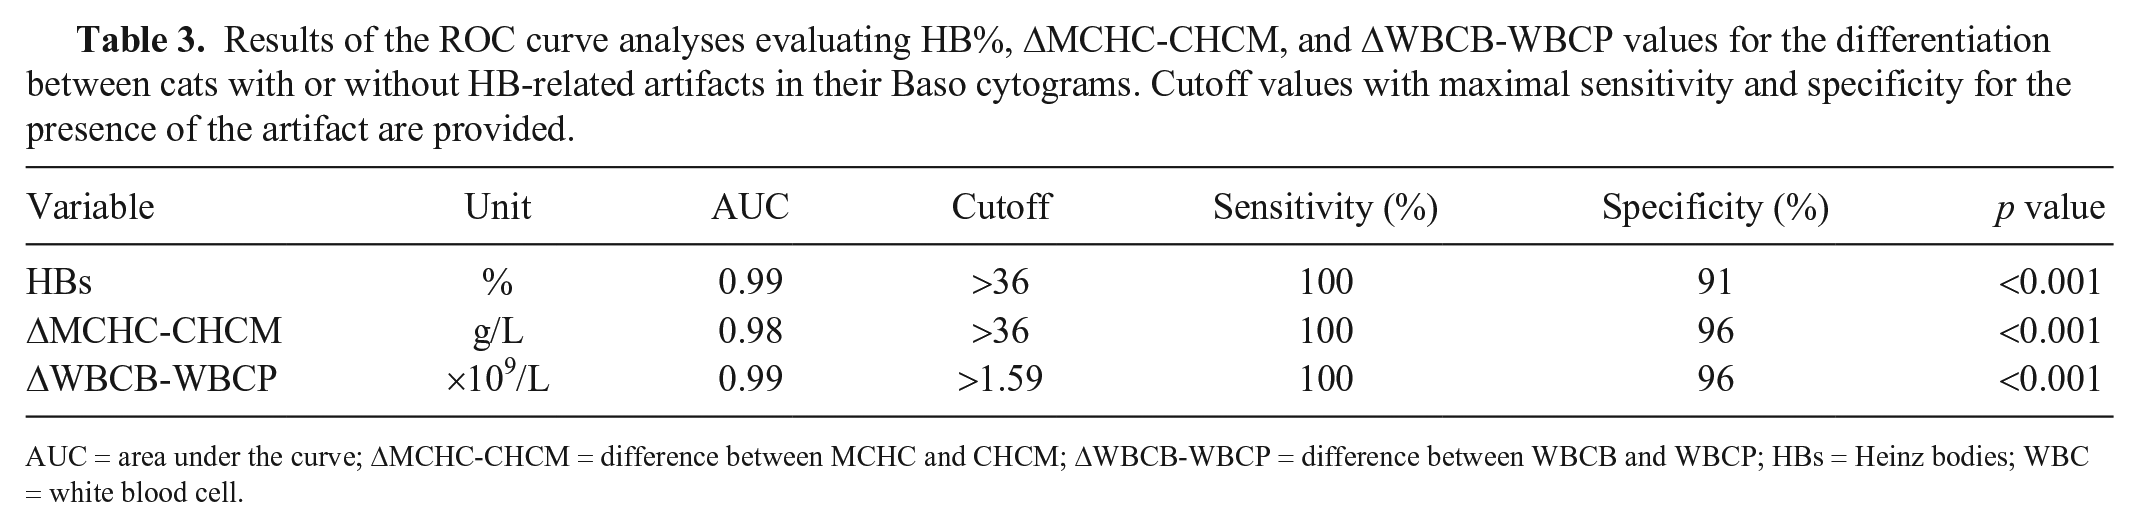
AUC = area under the curve; ΔMCHC-CHCM = difference between MCHC and CHCM; ΔWBCB-WBCP = difference between WBCB and WBCP; HBs = Heinz bodies; WBC = white blood cell.
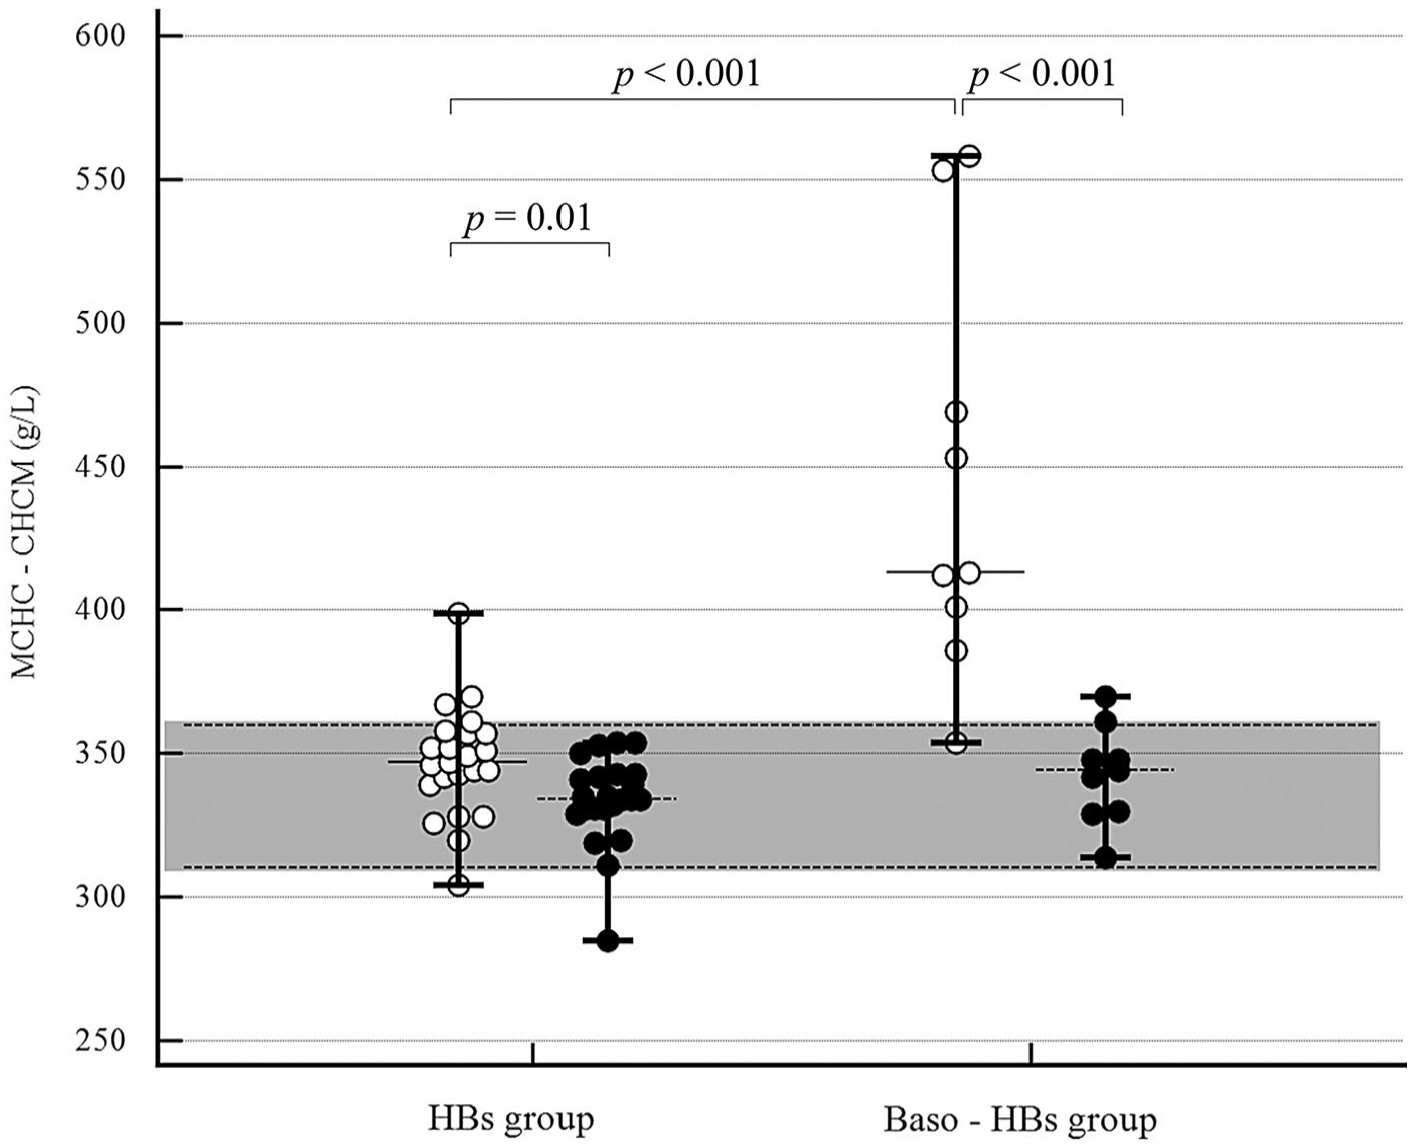
Dot plots of mean corpuscular hemoglobin concentration (MCHC g/L; white dots) and corpuscular hemoglobin concentration mean (CHCM g/L; black dots) values in Heinz bodies (HBs) cats (n = 23) and in Baso-HBs cats (n = 9). The horizontal bars represent the median (central bar) and the minimum and maximum values (peripheral bands); the gray area depicts the reference interval. Significant differences among the variables are indicated.
The cats in the Baso-HBs group had significantly increased WBCB, ΔWBCB-WBCP, PMNs, and absolute and percentage lymphocyte counts, and significantly decreased MNs and neutrophil percentages when compared to the HBs group (Table 2). In the Baso-HBs group, the WBCB was significantly greater than the WBCP (p = 0.02), whereas the WBCB and WBCP were not different in the HBs group (p = 0.88; Fig. 5). No significant difference was detected between WBCP and MC-WBC within the Baso-HBs group (p = 0.40).
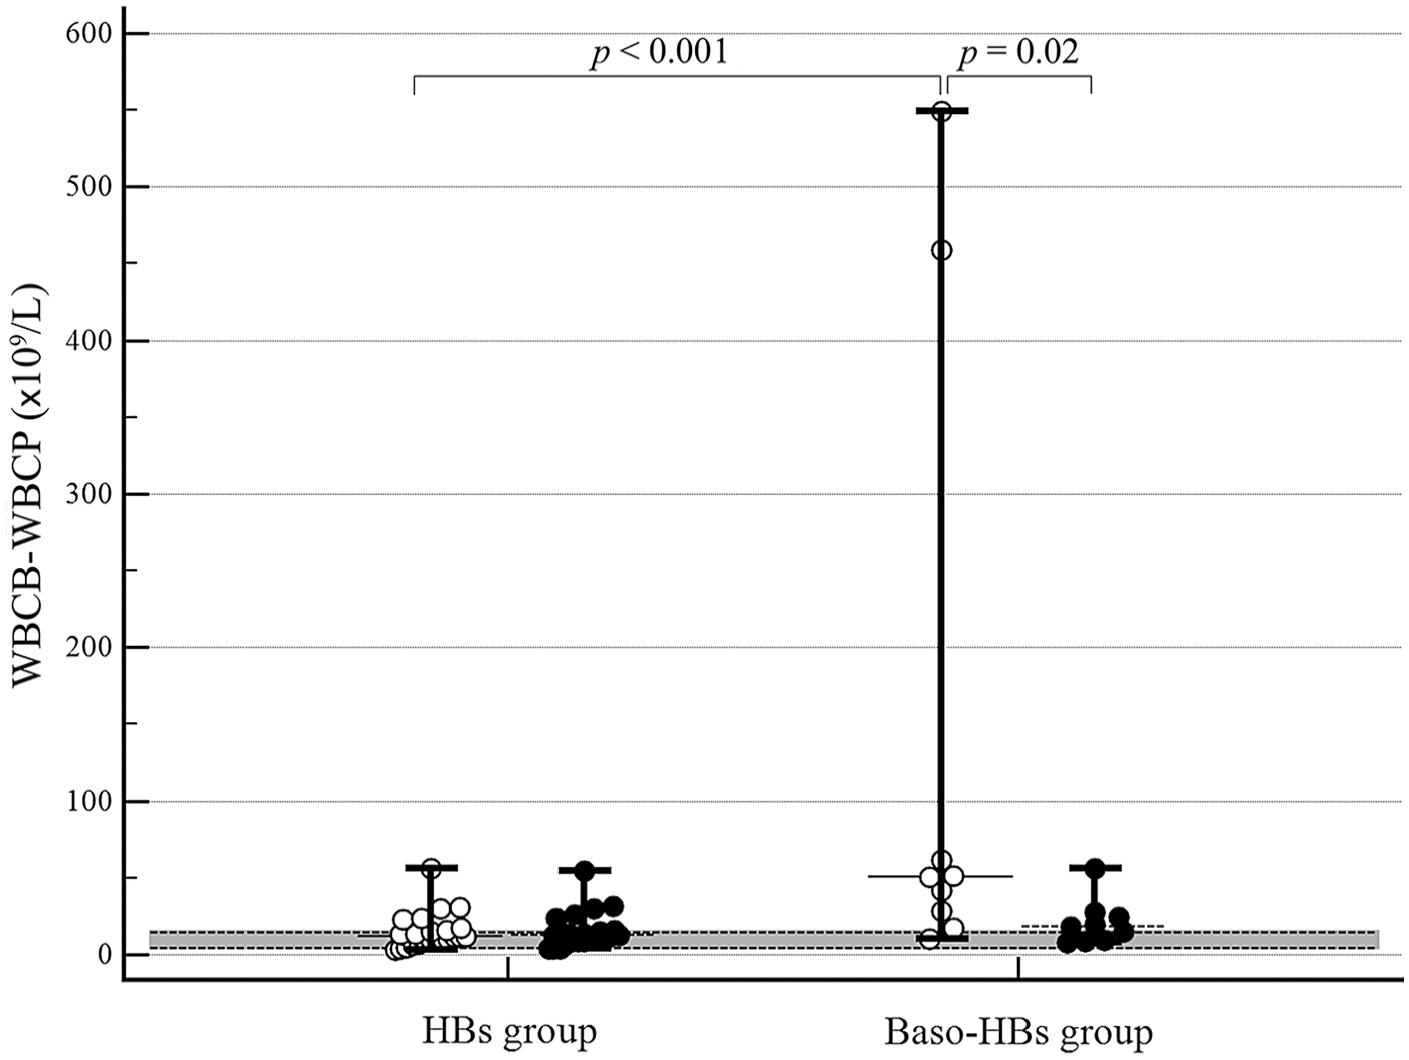
Dot plots of basophil/lobularity white blood cell count (WBCB ×109/L; white dots) and peroxidase white blood cell count (WBCP ×109/L; black dots) values in Heinz bodies (HBs) cats (n = 23) and in Baso-HBs cats (n = 9). The horizontal bars represent median (central bar) and minimum and maximum values (peripheral bands); the gray area depicts the reference interval. Significant differences among the variables are indicated.
In the Baso-HBs cats, automated percentage and absolute lymphocyte counts were higher than the manual lymphocyte count (p < 0.001 and p < 0.001, respectively), and the automated neutrophil percentage count was lower than the manual neutrophil percentage (p = 0.002). A similar difference was not noticed for the absolute manual and automated neutrophil counts.
All cats included in the Baso-HBs group had an artifact in the Perox cytogram that was characterized by numerous dots located in the bottom left-hand corner of the graph (Fig. 2). This artifact was not clearly detected in the HBs group. The evaluation of the RBC scattergrams revealed that the Baso-HBs cats had an RBC population right-shifted toward hyperchromic, and occasionally microcytic, erythrocytes (Fig. 6). Similar findings were not detectable in the HBs group. The Baso-HBs cats had a significantly higher frequency of PX-NV, B-NV, and CHCMCE flags as compared to the HBs cats (Tables 1, 2).
The hematologic data of the Baso-HBs cats at all of the different times were available in 4 of 9 cats (Table 4). Over time, in the Baso-HBs group, there was a significant and progressive decrease in HB percentage. Concurrently, ΔWBCB-WBCP, MCHC, CHCM, and ΔMCHC-CHCM decreased significantly between T0 and T2, and T0 and T3, and between T2 and T3. In 3 of 4 cats in the Baso-HBs group, there was complete disappearance of the Baso-channel–related artifactual changes at T3.
Selected hematology variable results obtained from cats belonging to the Baso-HBs group at different times, following inclusion in the study.
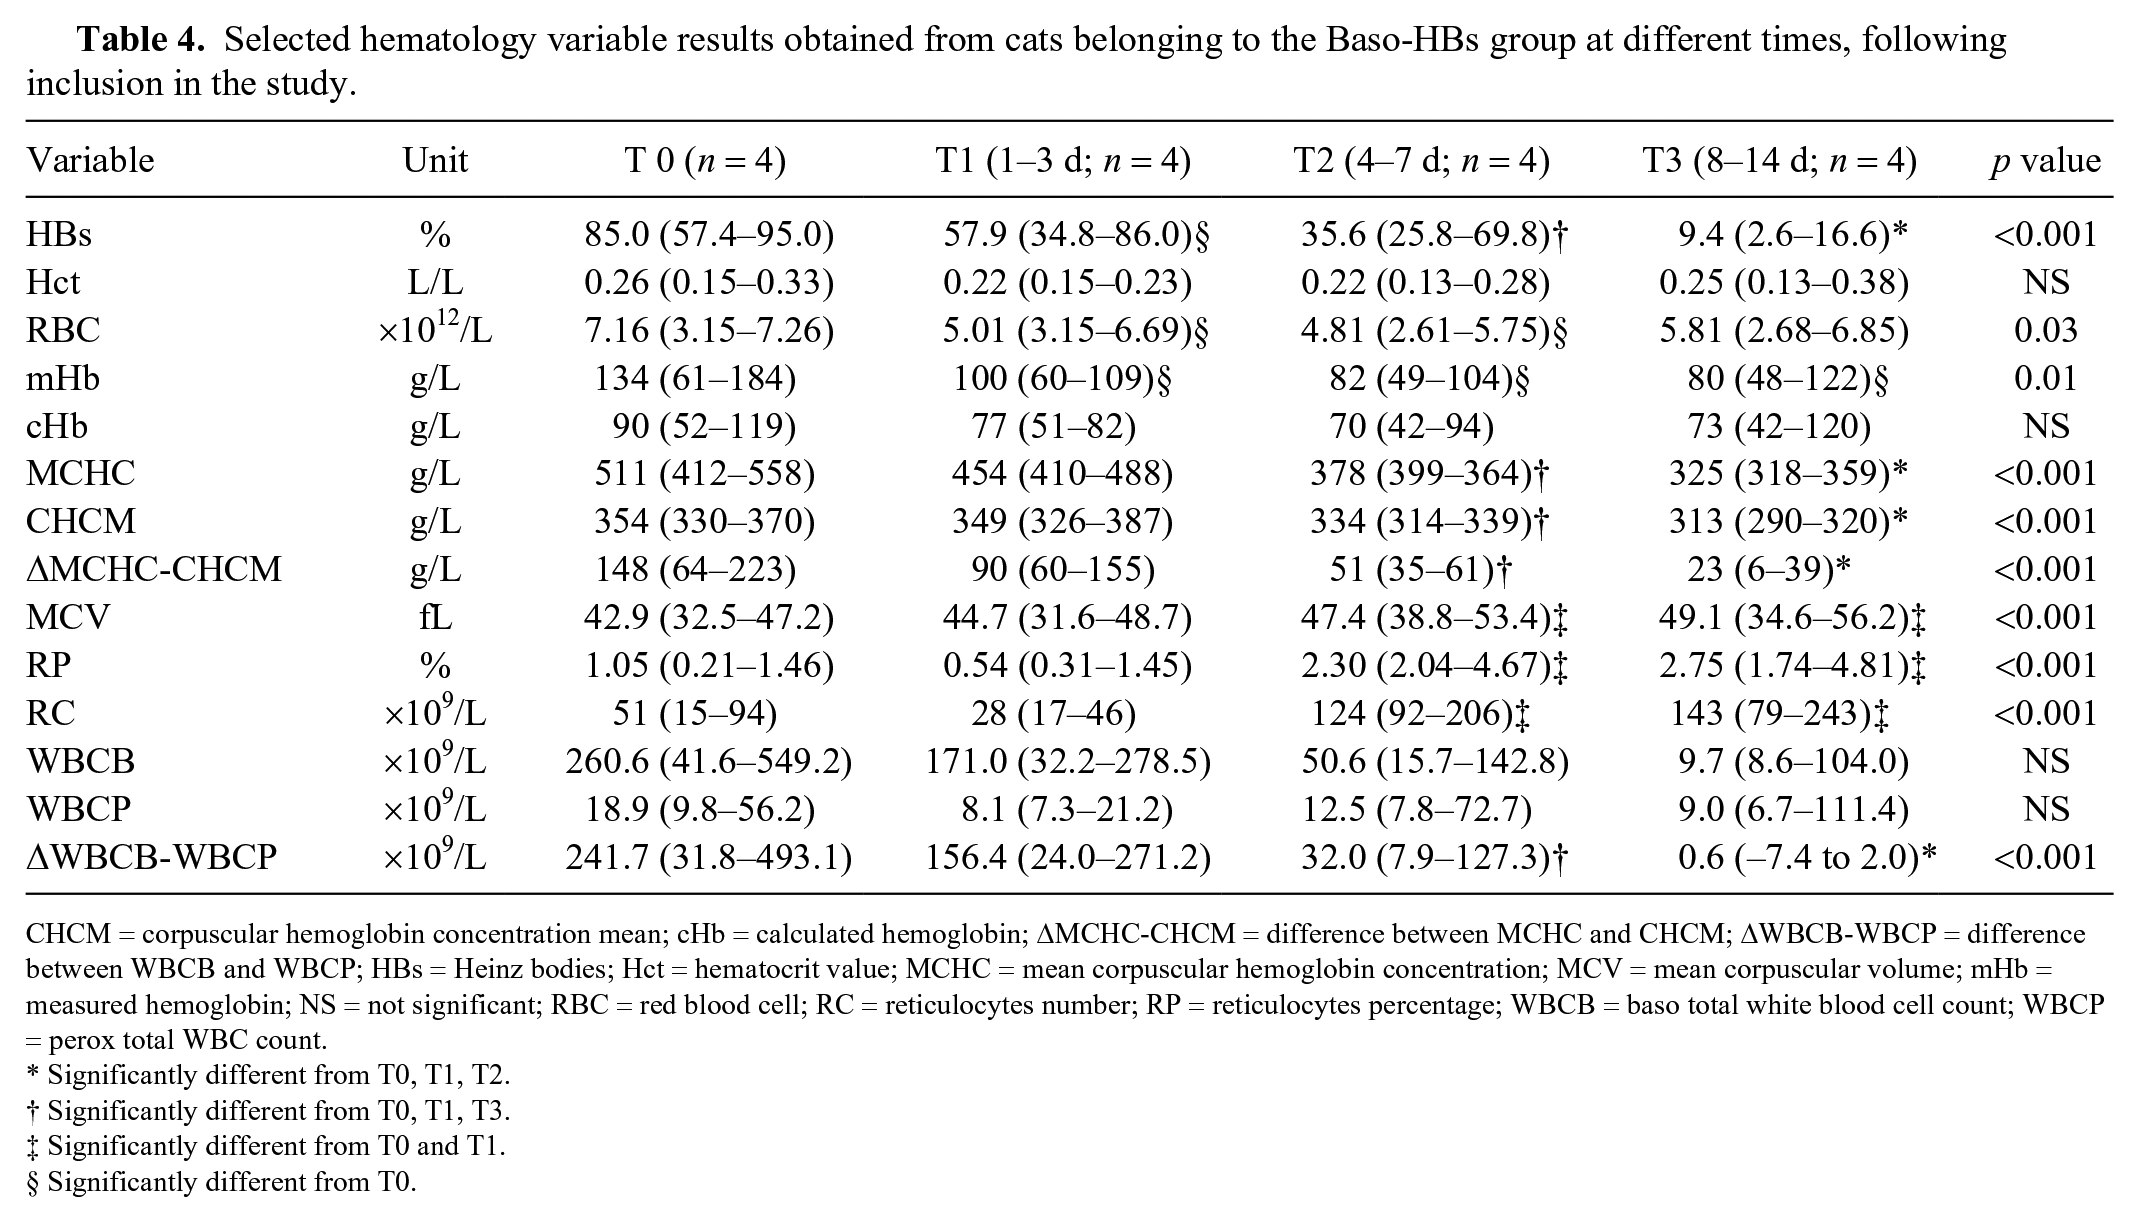
CHCM = corpuscular hemoglobin concentration mean; cHb = calculated hemoglobin; ΔMCHC-CHCM = difference between MCHC and CHCM; ΔWBCB-WBCP = difference between WBCB and WBCP; HBs = Heinz bodies; Hct = hematocrit value; MCHC = mean corpuscular hemoglobin concentration; MCV = mean corpuscular volume; mHb = measured hemoglobin; NS = not significant; RBC = red blood cell; RC = reticulocytes number; RP = reticulocytes percentage; WBCB = baso total white blood cell count; WBCP = perox total WBC count.
Significantly different from T0, T1, T2.
Significantly different from T0, T1, T3.
Significantly different from T0 and T1.
Significantly different from T0.
Discussion
We evaluated the potential HB interference with hematology results in cats obtained by an automated analyzer by comparison of numerical and graphical data. During the study period, we evaluated cases in which a marked presence of HBs produced relevant artifacts in the CBC results. Underlying diseases previously related to HB formation were identified by clinicians in the majority (6 of 9) of the Baso-HBs cats; no clear etiology promoting HB formation was identified in the remaining subjects. In particular, to our knowledge, traumatic injuries have never before been associated with HB formation in cats. Although the identified underlying diseases were similar in HBs and Baso-HBs cats, the number of HBs was significantly increased in the latter. In our study, in particular, the diseases more frequently associated with HB presence were diabetic ketoacidosis and lymphoma. A previous study reported a significant correlation between the number of HBs and the plasma concentration of β-hydroxy-butyrate. 6 Similar findings, however, were not confirmed in our study (data not shown). Different disease severity associated with a more compromised antioxidant status can only be hypothesized to explain the difference detected in our study groups.
Our results indicated that an elevated number of HBs in feline erythrocytes significantly affected some hematologic results of the automated analyzer used in our laboratory. In particular, the presence of elevated percentages of HBs (>36% of RBCs) is highly associated with WBCB artifacts and leads to an erroneously increased total WBCB count, which must be verified by blood smear examination.
In the hematology system used in our study, the Baso and Perox assays were the default methods for routine total and differential WBC counts, respectively. In humans, as in veterinary species, however, both the Perox and the Baso methods are able to provide total WBC counts (WBCB and WBCP) that must coincide or agree within specific limits. 17 In humans, a discrepancy between the results of the 2 methods, calculated as an increase in the ΔWBCB-WBCP, has been reported in the presence of NRBCs, malaria parasites, or incomplete RBC lysis (e.g., the presence of HBs). 29 To our knowledge, the causes of increased ΔWBCB-WBCP are not well known in veterinary medicine. In all of the cats included in our study, an elevated concentration of NRBCs was ruled out by blood smear evaluation. The artifactual leukocytosis detected by the Baso channel and the significantly higher ΔWBCB-WBCP observed in the Baso-HBs cats could be reasonably related to the elevated number of HBs. In particular, WBCB count reached 459 and 549 × 109 WBC/L in 2 cases, further increasing the difference between the study groups. Feline HBs are predominantly distinct, large, round structures and have a high density that frequently leads to incomplete RBC lysis20,26; hence, interference with the Baso method could also have been expected in the populations of our study, as described previously. 25 Moreover, the events represented as a cluster of small particles overlapping the bottom threshold of the graph could have incremented the WBCB incorrectly and prevented a correct automated separation between MN and PMN cells, flagged by B-NV. Visual evaluation of the Baso cytograms carried out by the operator would have allowed identification of the spurious leukocytosis and possible determination of its cause. Furthermore, the identification of a cutoff value to differentiate samples with elevated HB could be considered a relevant finding in our study and could be useful in clinical practice. Although we did not evaluate other causes of increased ΔWBCB-WBCP in our study, a value >1.59 × 10⁹ WBC/L was strongly related to a marked concentration of circulating HBs in cats.
The WBCP appeared to be less affected by the marked HB presence in those cats in our study that had a higher percentage of HBs (Baso-HBs group). To evaluate the accuracy of both automated WBC counts in this population, the automated results were compared to a manual estimation of WBC concentration. This estimation is commonly used in veterinary medicine, particularly in critical care settings. However, its use is scarcely supported by the literature and has inherent limitations that should be taken into account when evaluating the results of our study. Manual WBC estimation was not significantly different from the WBCP, although it was significantly decreased when compared to the WBCB. Nevertheless, these results do not allow us to exclude HB interference on the Perox channel. A previous paper has supported the statement that a manual differential count shows good agreement with the automated lymphocyte and neutrophil differential counts obtained by the analyzer used in our study with the peroxidase reaction. 4 In our population, however, based on the Perox differential count, significantly increased lymphocyte percentage and absolute number were detected, when compared to the manual differential count results. In our opinion, the spurious increase in the automated lymphocyte count could have been the result of HB interference on the Perox reaction or cell type detection, leading to a misleading classification between lymphocytes and the HBs that were likely identified as small lymphoid cells. For this reason, it is reasonable to hypothesize that the total WBCP could also be overestimated in cats with an elevated percentage of circulating HBs. In these animals, the Perox scattergrams presented dots located in the bottom left-hand corner probably preventing a correct differential leukocyte count, and they were flagged by the PX-NV in 89% of cases, supporting the hypothesis in our study. Similar findings using the laser flow cytometry automated analyzer which preceded the one used in our study have been reported. 25 As mentioned above for the WBCB, the visual inspection of the Perox cytogram routinely carried out by the operator could also allow the identification of potential HB-related artifacts on the automated differential WBCP.
We also detected an association between the presence of HBs and the artifactual changes in RBC indices. The analyzer that we used has 2 methods for hemoglobin measurement: a cyanide-free colorimetric method (total hemoglobin or mHb) and a flow cytometry cell–based hemoglobin assay (reported as CHCM). 3 In contrast to CHCM, the MCHC is a calculated variable that reflects the average concentration of hemoglobin within the erythrocytes, based on the colorimetric measurement of mHb, using the following formula: MCHC = mHb/[RBC × MCV] × 1000. For each sample, MCHC and CHCM are compared automatically, and the system flag CHCMCE is generated if ΔMCHC-CHCM values are >19 g/L. 3 A significant increase in MCHC but not in CHCM (leading to a significant increase in ΔMCHC-CHCM) was observed in the Baso-HBs group. Furthermore, in all of these cats, the RBC scattergrams showed a population of erythrocytes shifted toward hyperchromic RBCs, which could correspond to RBCs with HBs, as suggested previously. 24 Thus, the high optical density of numerous RBCs containing HBs in Baso-HBs cats could primarily explain these findings and, particularly, the increased value of the MCHC. It is also known that some other conditions that can cause turbidity in the sample, such as lipemia, icterus, extreme leukocytosis, and in vivo or in vitro hemolysis can result in the overestimation of mHb and MCHC, without a significant effect on CHCM.3,23 None of the cats included in our study had macroscopic lipemic or icteric samples, and extreme leukocytosis was excluded by means of manual WBC estimation.
In our opinion, the role of hemolysis was of little relevance in the Baso-HBs cats compared to the HBs cats, given the absence of statistical differences in the erythrocyte mass and MCV values, in the morphologic signs of hemolysis other than HBs on blood smear examination (ghost cells and erythrocyte fragments), and in serum total bilirubin concentration (data not shown). However, the possibility that Baso-HBs cats suffered more marked hemolysis could not be completely excluded because Hct and RBCs were slightly decreased in the Baso-HBs group. The absence of statistical significance could be related to the limited number of patients included in the Baso-HBs group and should be considered when interpreting our results.
Our results indicate that a value of ΔMCHC-CHCM >36 g/L seemed to be highly predictive of a marked presence of RBCs with HBs, potentially leading to artifactual results in RBC indices. Although CHCM is considered more accurate than mHb or MCHC, HBs might interfere with the light-scattering properties of the erythrocytes affected. This could also cause a mild alteration in the CHCM value, as has been reported.23,25 Our results, however, do not support this latter data, given that the CHCM was within the reference interval in all of the cats included, and was not statistically different between the Baso-HBs and HBs cats.
The serial CBC results of the Baso-HBs cats evaluated at different times revealed that HBs could persist in peripheral circulation for up to 14 d, with prolonged presence of interference and artifacts in automated CBC and cytogram results. The HB percentage decreased significantly during follow-up evaluation, leading to a reduction in interference on the Baso cytogram and a progressive decrease in WBCB and ΔWBCB-WBCP within 8–14 d from the first clinicopathologic evaluation.
Some limitations should be considered when interpreting our results. Given its retrospective design, the medical records of the patients included were not complete in all cases; in particular, inaccurate identification of the underlying disease could have misidentified interference with the automated CBC, in addition to that related to HB formation. Moreover, the sample size was small given the rarity of the artifact herein reported, potentially lowering the power of the statistical analysis carried out.
A high percentage of circulating HBs (>36% of RBCs) can lead to significant abnormalities in automated feline CBC results. Even though blood smear examination remains essential in routine veterinary practice to confirm the automated CBC results and identify the presence of HBs, careful evaluation of the cytograms and flags obtained by a flow cytometry–based hematology analyzer could raise suspicion of HB-related interference in cats.
Footnotes
Acknowledgements
The preliminary results were presented as a poster presentation at the 29th International Society for Laboratory Hematology annual meeting, Milan, 2016.
Declaration of conflicting interests
The authors declared no potential conflicts of interest with respect to the research, authorship, and/or publication of this article.
Funding
The authors received no financial support for the research, authorship, and/or publication of this article.