
Abstract
We assumed that proteins are most likely responsible for synovial fluid fluorescence and that changes detected in fluorescence intensity are most likely the result of changes in the concentration of fluorescent proteins. Synchronous fluorescent matrices from synovial fluid samples were measured in the excitation wavelength range of 200–350 nm using a luminescence spectrophotometer. The synchronous matrix of synovial fluid consists of 2 dominant fluorescent centers (F1 and F2) in the ultraviolet region. The fluorescence intensities of both centers were significantly higher in pathological samples, with p = 0.001 (a 59% increase of the median value) for the F1 center and p = 0.002 (a 52% increase of the median value) for the F2 center. Receiver operating characteristic analysis confirmed that synovial fluid autofluorescence is a significant predictor of medial compartment disease in dogs, with the area under the curve at 0.776 (F1) and 0.778 (F2). We did not detect any differences in the autofluorescence of synovial fluid between male and female, or any breed-based changes. No position changes of fluorescent centers were recorded in the synovial fluid in diseased dogs compared with healthy dogs. The synovial fluid metabolic fingerprint of canine patients with medial compartment disease differed from that of healthy dogs. Our study demonstrated the feasibility of synovial fluid fingerprinting to identify disease-specific profiles of synovial fluid metabolites.
Medial compartment disease (MCD) of the elbow joint is frequently diagnosed as a cause of thoracic limb lameness in certain medium- and large-breed dogs. 16 Traditionally, mechanical overloading because of joint incongruence has been proposed as the most probable underlying cause of MCD, 2 which is generally known to terminate in progressive osteoarthritis (OA). There is a prolonged preclinical “molecular” phase and a “preradiographic” phase, when many metabolites are released into the synovial fluid, providing a real-time snap shot of joint disease. 11 Existing biomarkers of OA are not specific for the various stages of OA, and in some cases may not even be specific for OA. 11 By measuring a combination of relevant metabolites in biological fluids, metabolic fingerprinting potentially meets these criteria. 7
Metabolomics is a noninvasive technique enabling the quantification and identification of a wide range of low-molecular-weight metabolites within a biological fluid under a given set of conditions, thus creating a profile of several markers that could serve as a more accurate and discriminatory watermark. 4 This analysis has also been used to develop profiles of synovial fluid. 5 The construction of a metabolic profile would detect every single individual metabolite, without bias for specific molecules, which is a considerable challenge in both the generation and analysis of data. 5
Fluorescence spectroscopy is a type of electromagnetic spectroscopy that analyzes fluorescence from a sample using a beam of light that excites the electrons in molecules of certain compounds and causes them to emit light of lower energy. In recent years, given successful applications in various fields of science, fluorescence spectroscopy has been shown to be a very sensitive technique and very suitable for analysis of the metabolome. Native fluorophores are specially conjugated polycyclic or aromatic molecules. Among the endogenous fluorophores are many important metabolites, such as pyridoxine derivatives, reduced nicotinamide adenine dinucleotide (NAD(P)H), flavin adenine dinucleotide (FAD), and porphyrins. Successful diagnostic application of this technique could be achieved by autofluorescent alteration of tissues or body fluids caused by pathological processes. 13
The purpose of our study was to examine whether metabolomic profiles may be useful in predicting the development of MCD in patients with an early stage of arthritis, an area where better diagnostic tools are currently needed. We hypothesized that such an analysis could provide novel insights into MCD mechanisms.
The dogs in the study were divided into 2 groups: the group affected with MCD and the unaffected group. Based on anamnesis, orthopedic examination, radiographic examination, or arthroscopy, dogs were included in the affected group if the diagnosis of MCD was confirmed: bilateral (3 dogs) and unilateral (13 dogs; n = 19 affected joints). In 3 dogs (n = 5 elbows) with the bilateral form and in 2 dogs (n = 2 elbows) with the unilateral form of MCD, evidence of advanced osteoarthrosis was recorded. Samples of the synovial fluid were taken (29 samples from healthy joints and 19 from joints with clinically diagnosed MCD). Client-owned animals were used for the study, with written consent forms obtained before enrollment in the study. The protocol for collection of synovial fluid from animals was reviewed, and approval to conduct this study was obtained from the local Animal Welfare Committee.
In the analyzed groups of samples, we created subgroups by sex and breed, took samples from the left or right elbow joint, and noted the presence of blood to determine if there was any influence of these factors on the fluorescent properties of the synovial fluid. Synovial fluid was taken using a 20-gauge needle and 2-mL syringe from the elbow joint in 135° of flexion. The puncture was performed upright distal from the capitulum of the humerus and the lateral edge of the extensor carpi radialis muscle, under general anesthesia. Samples were frozen in liquid nitrogen at −196°C. Before fluorescence analysis, samples were diluted by ultrapure water a in a ratio of 1:1,000. Synchronous fluorescence spectra (Δλ 10 nm, Δλ increment 20 nm, number of scans: 13) were measured in the wavelength range of 200–350 nm using a luminescence spectrophotometer b and a quartz cuvette (10 mm). c Synchronous matrices were created from synchronous spectra. The source of excitation was a xenon flash tube, which produces an intense, short-duration pulse of radiation over the spectral range of 200–800 nm. Measured data was processed using computer software, d and statistical analysis of the data was performed using a commercial computer software program. e
Unpaired t-tests (equal variances assumed) were used to compare the differences in fluorescence intensity values between the groups according to health status, diagnosis, and sex. The influence of the presence of blood in the synovial fluid on fluorescence intensities was evaluated using the Pearson chi-square test. A p value ≤0.05 was considered statistically significant for differences and correlations. Receiver operating characteristic analysis was used to determine the sensitivity and specificity of our method.
The synchronous matrix (SM) of the synovial fluid consists of 2 dominant fluorescent centers (Figs. 1, 2) in the ultraviolet region. The first center (F1) with a higher intensity of fluorescence is made up of a double peak with the excitation/emission maximum at 219/349 nm (P1) and 228/338 nm (P2). The second center (F2), with a lower intensity of fluorescence, is formed by a single peak with the excitation/emission maximum at 277/347 nm. The position of the first center’s peaks P1 and P2 in the SM of the synovial fluid is very close, and the fluorescence intensities of individual peaks P1 and P2 (Fig. 3) correlate strongly (Pearson r = 0.98); therefore, we further considered the fluorescence of the first center F1 as representing the whole. There is also a relationship between the fluorescence intensity of both fluorescent centers F1 and F2 (Pearson r = 0.87), indicating their interdependence (Fig. 4).
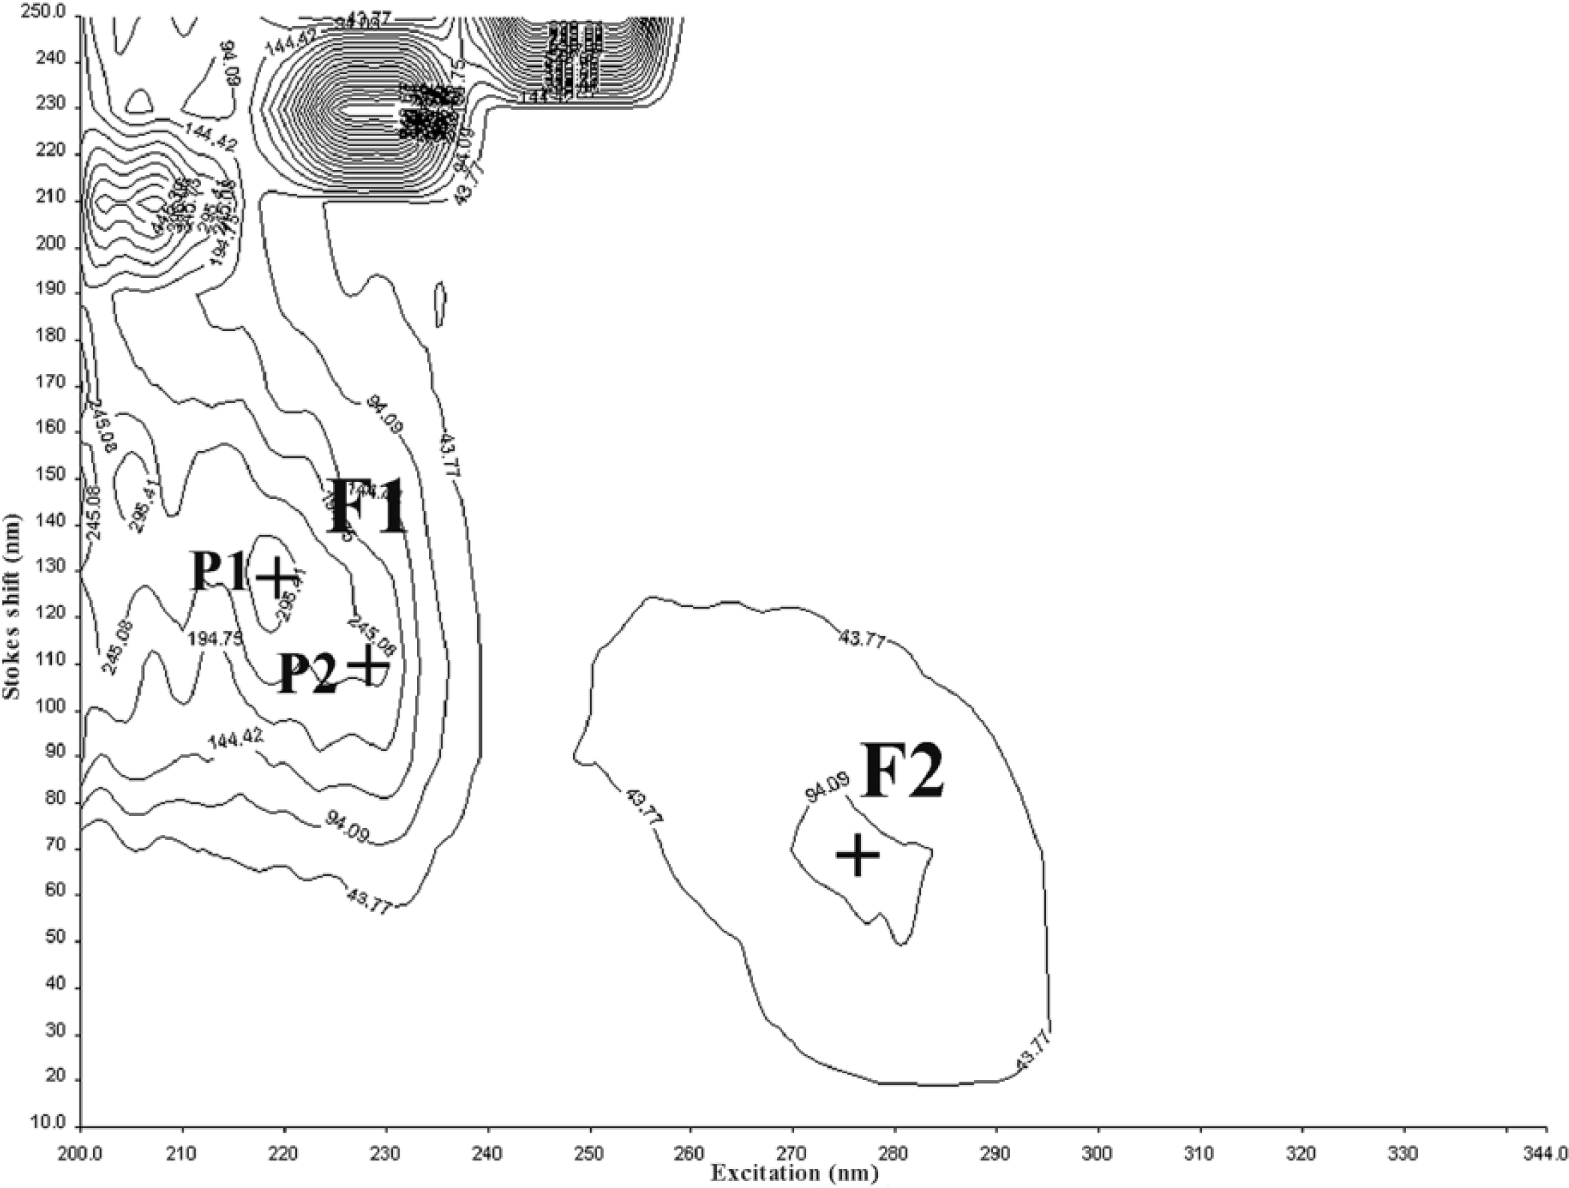
Synchronous matrix by fluorescence spectroscopy of synovial fluid of healthy dog 9.
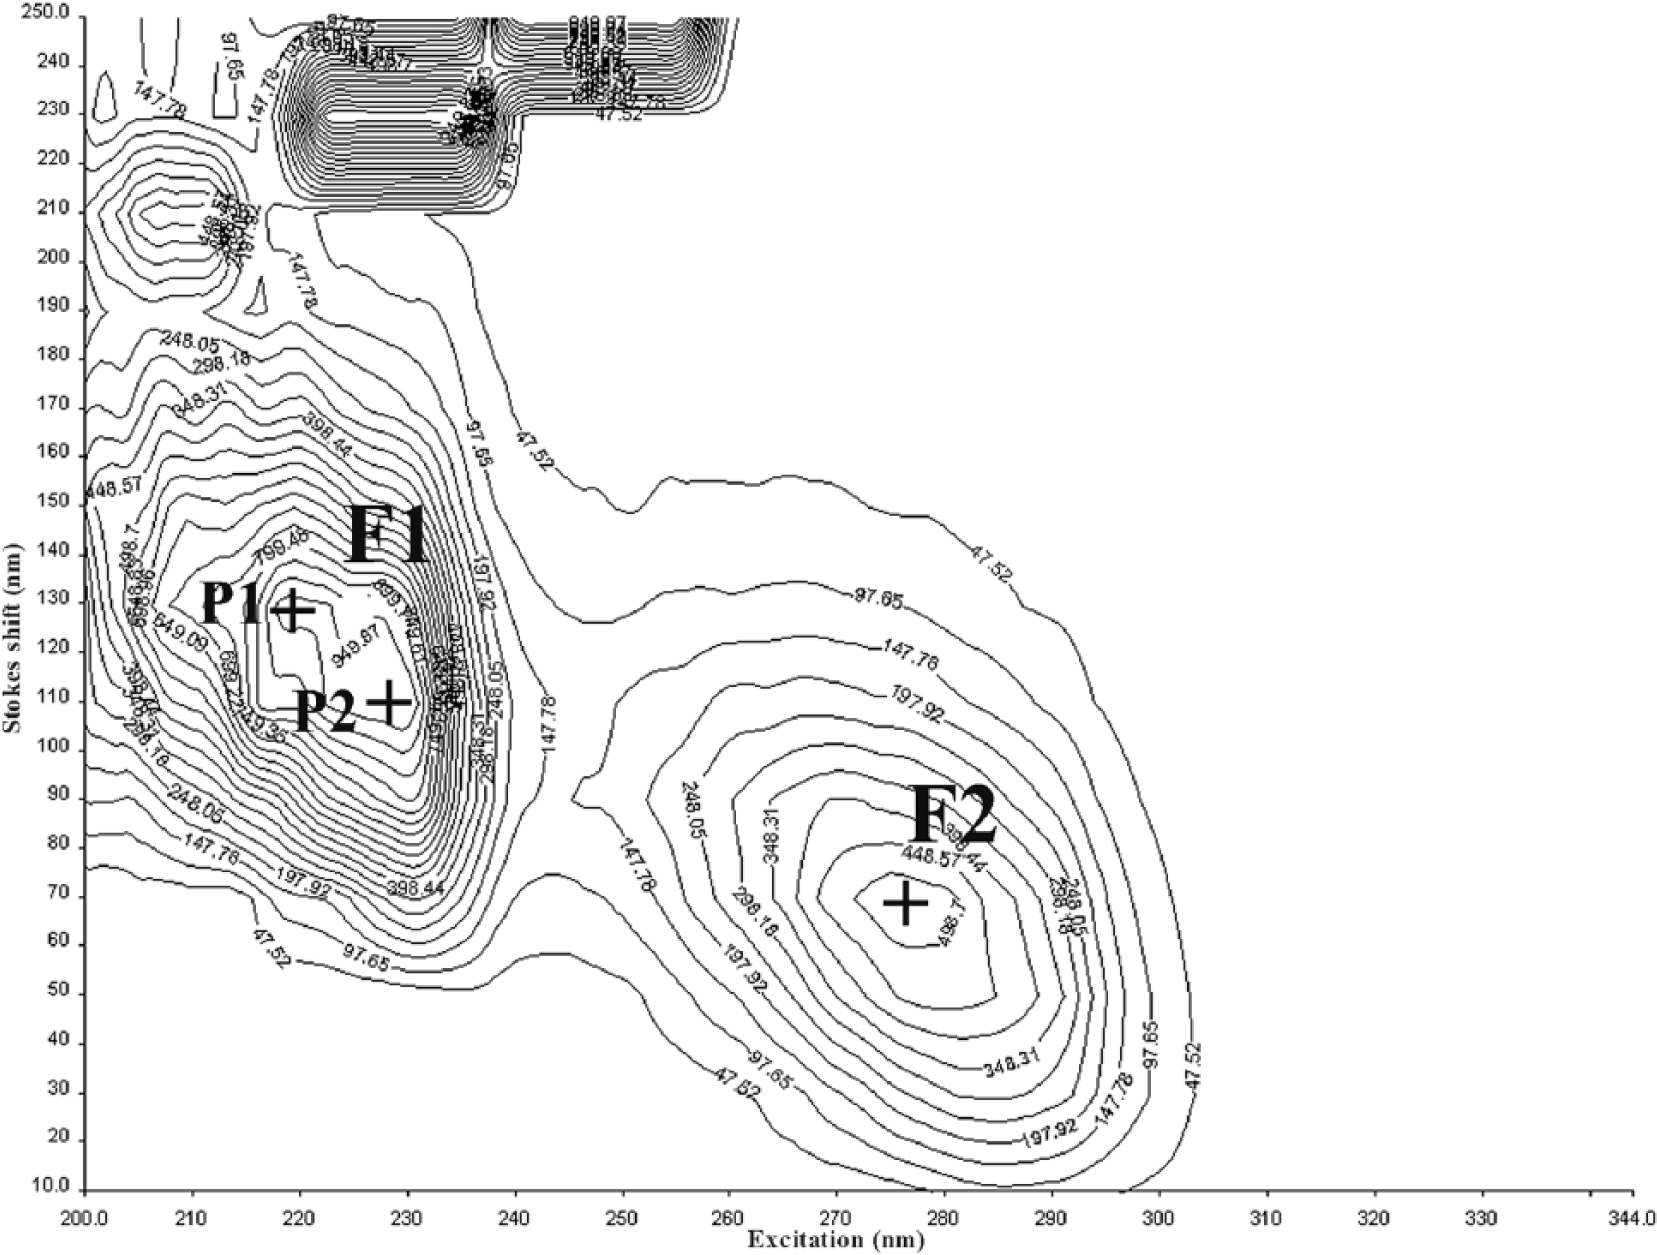
Synchronous matrix by fluorescence spectroscopy of synovial fluid of diseased dog 19.
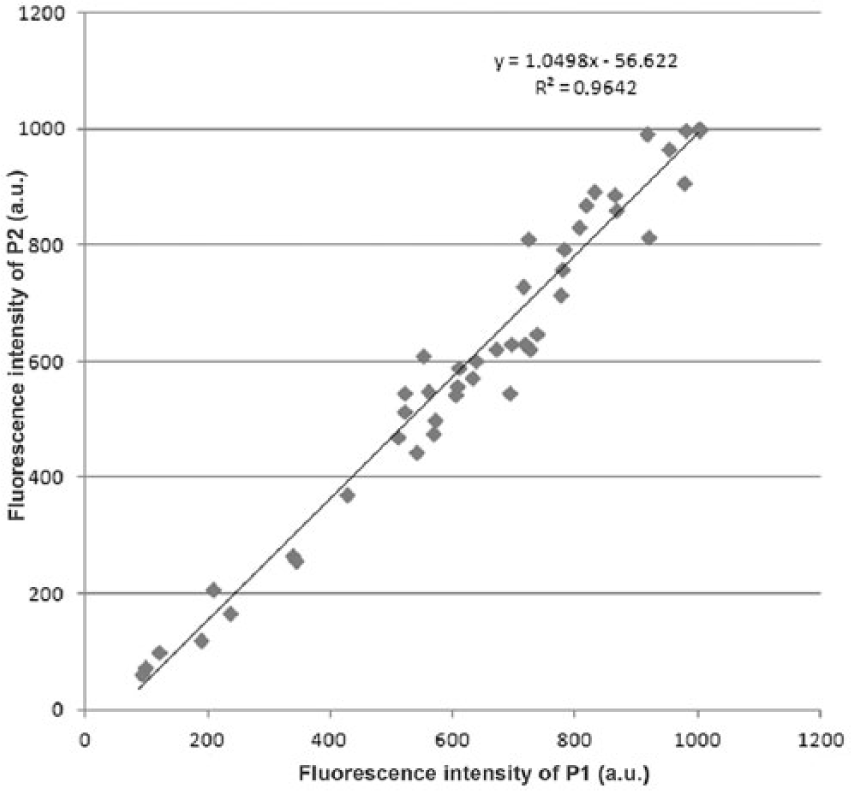
Interdependence of the fluorescence intensities of P1 and P2.
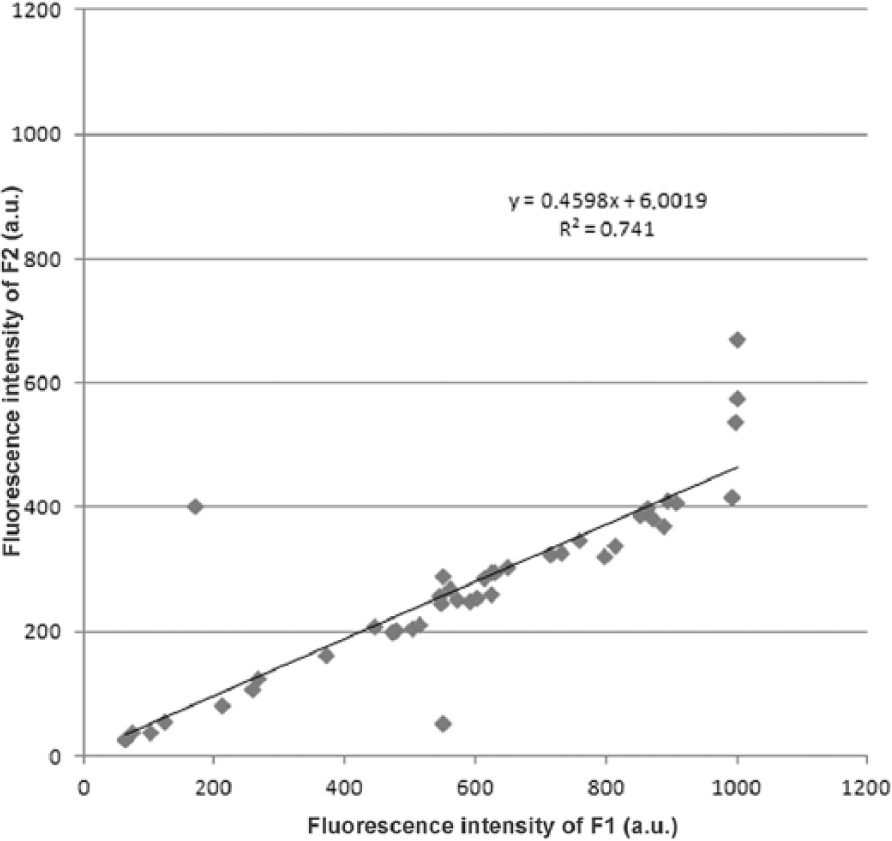
Interdependence of the fluorescence intensities of F1 and F2.
The fluorescence intensities of both centers were significantly higher in the pathological samples compared with the healthy group samples (Table 1; Fig. 5), with p = 0.001 (a 59% increase of the median value) for the F1 center and p = 0.002 (a 52% increase of the median value) for the F2 center.
Values of fluorescence intensities F1 and F2 centers in control group and pathological samples.*
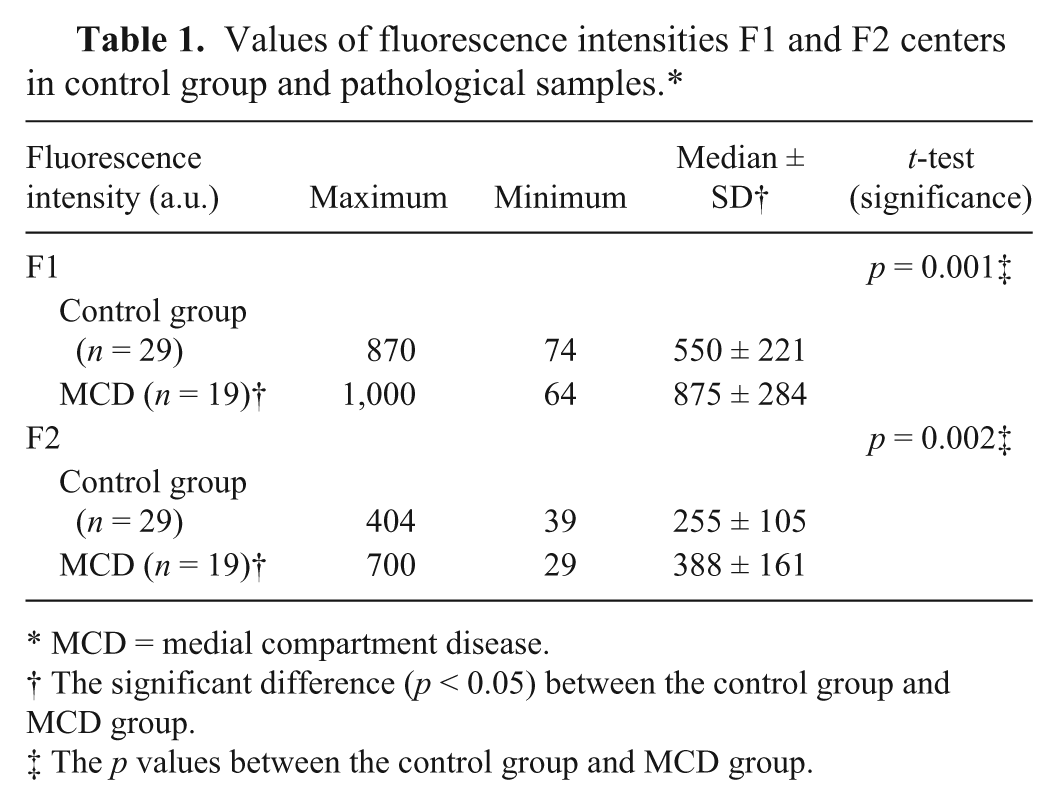
MCD = medial compartment disease.
The significant difference (p < 0.05) between the control group and MCD group.
The p values between the control group and MCD group.
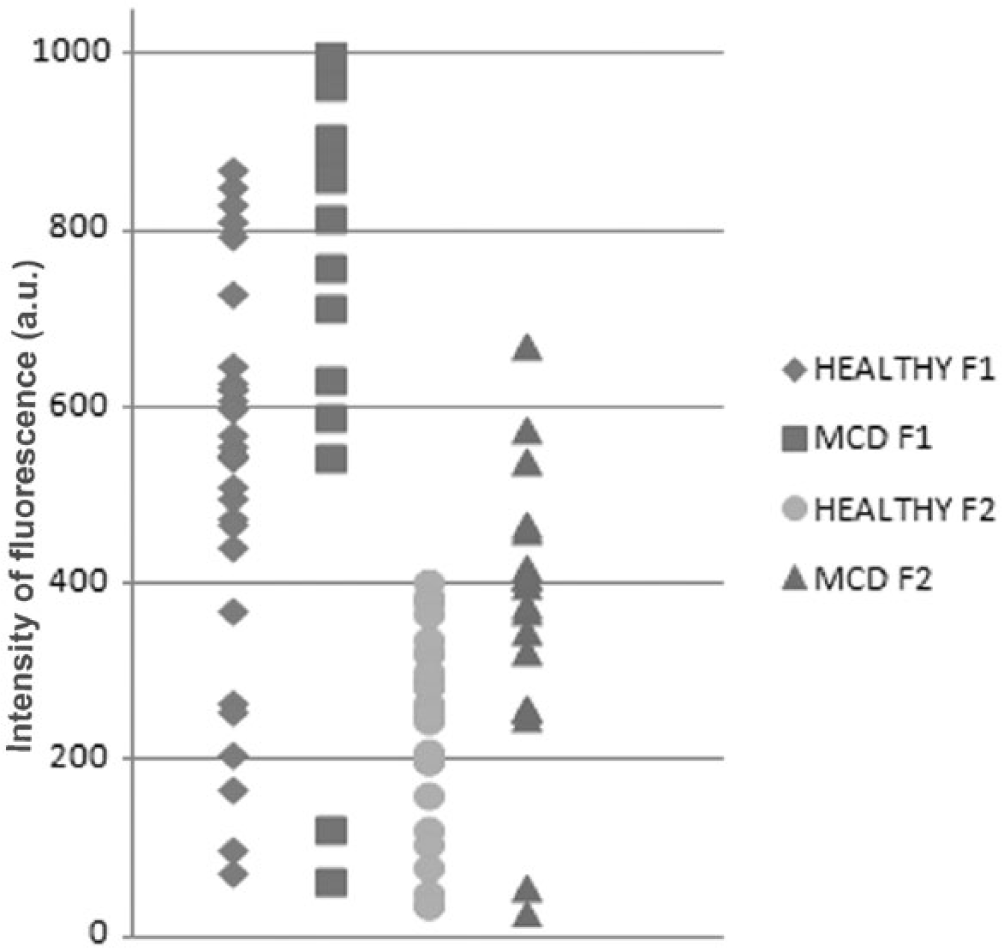
Distribution of fluorescence intensities values of the first (F1) and second (F2) fluorescent centers in the control group and the group suffering from medial compartment disease.
Receiver operating characteristic analysis (Fig. 6A, 6B) confirmed that synovial fluid autofluorescence is a significant predictor of MCD in dogs with areas under the curve at 0.776 (F1) and 0.778 (F2). We did not detect any differences between the autofluorescence of synovial fluid in males and females or any breed-based changes. The presence of blood in the synovial fluid also did not affect its autofluorescence in the excitation wavelength range of 200–350 nm.
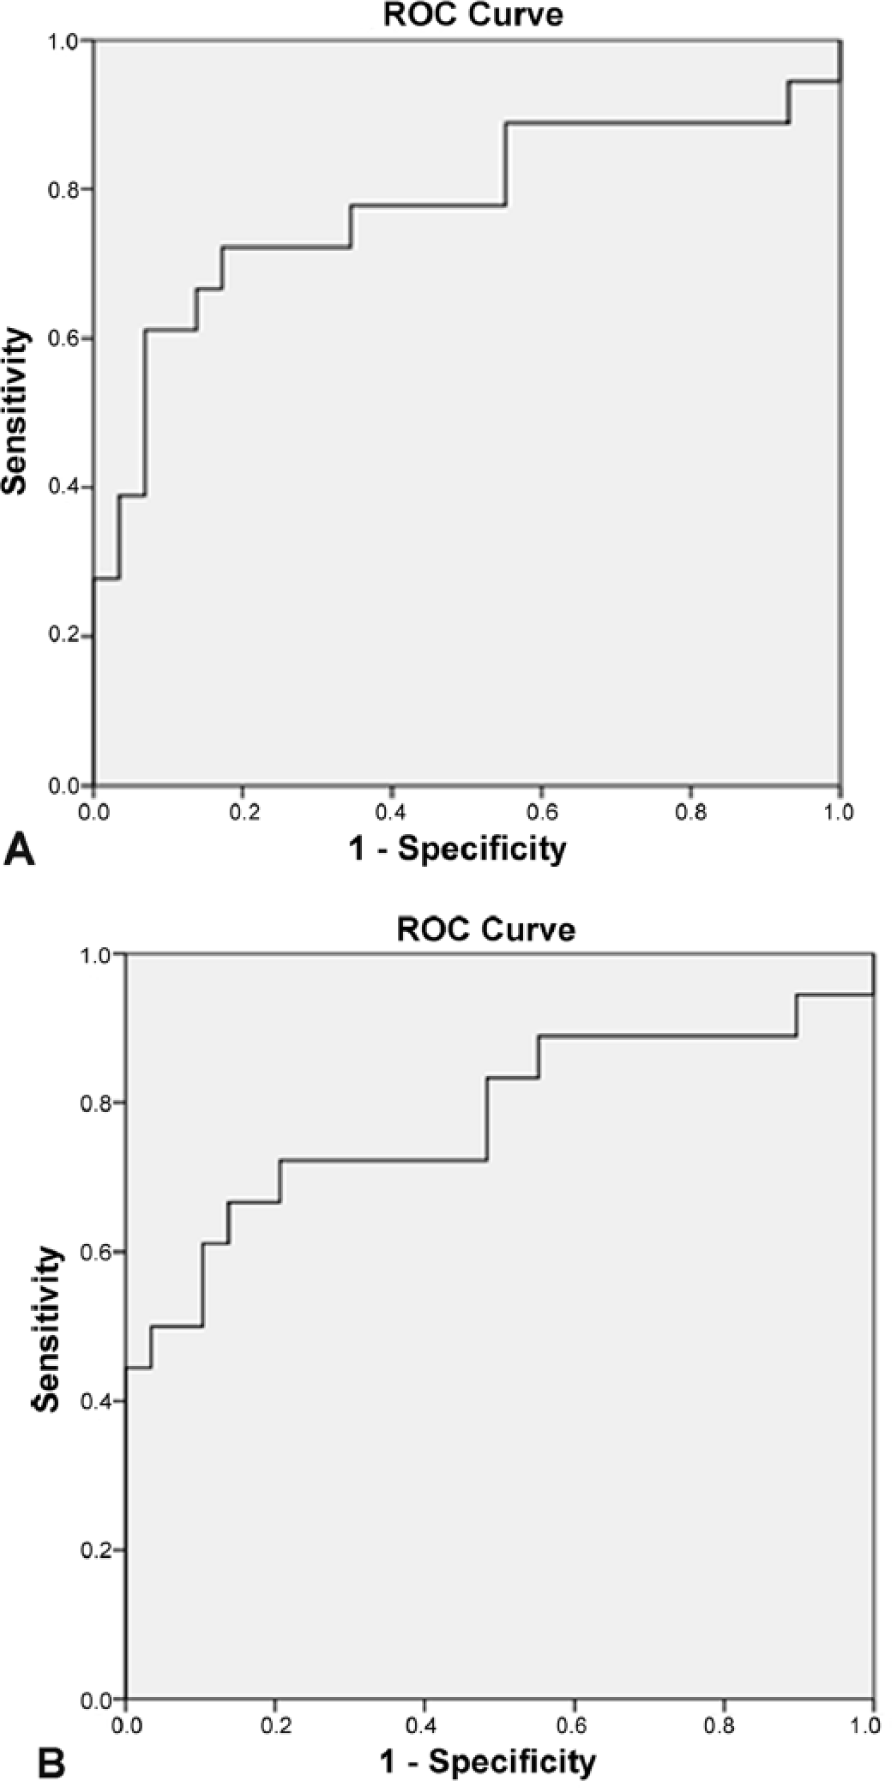
Receiver operating characteristic curves for medial compartment disease prediction by fluorescence intensity.
Synovial fluid may contain many molecules potentially responsible for its autofluorescence, including various proteins, lipids, or small molecules derived from aromatic amino acids (e.g., 5-hydroxyindoleactic acid, 5-hydroxytryptamine, indoxyl sulfate, 15 or dopamine 12 ).The presence of the aromatic amino acids tyrosine and tryptophan is primarily responsible for protein native fluorescence. The fluorescence of a protein containing tyrosine is not dependent on the environment, in contrast to the fluorescence of proteins containing tryptophan. 6
In our study, the SM of synovial fluid consists of 2 dominant fluorescent centers. Based on measured excitation/emission characteristics, it is possible that both of the fluorescence centers that we detected could be protein-like (Table 2). Tryptophan-like protein fluorescence, in terms of changes in fluorescence intensity and repositioning of excitation–emission maxima, should be sensitive for conformation and the microenvironment of proteins. 17 Even after detailed analysis, no statistically significant position changes of fluorescent centers were recorded in synovial fluid in the group of diseased dogs compared with healthy dogs. In accord with the theory that only proteins are responsible for synovial fluid fluorescence, we expected the detected changes in fluorescence intensity to most likely be the result of changes in the concentration of fluorescent proteins.
Fluorescence maxima of possible protein-like fluorophores compared with the fluorescence maxima of this study.
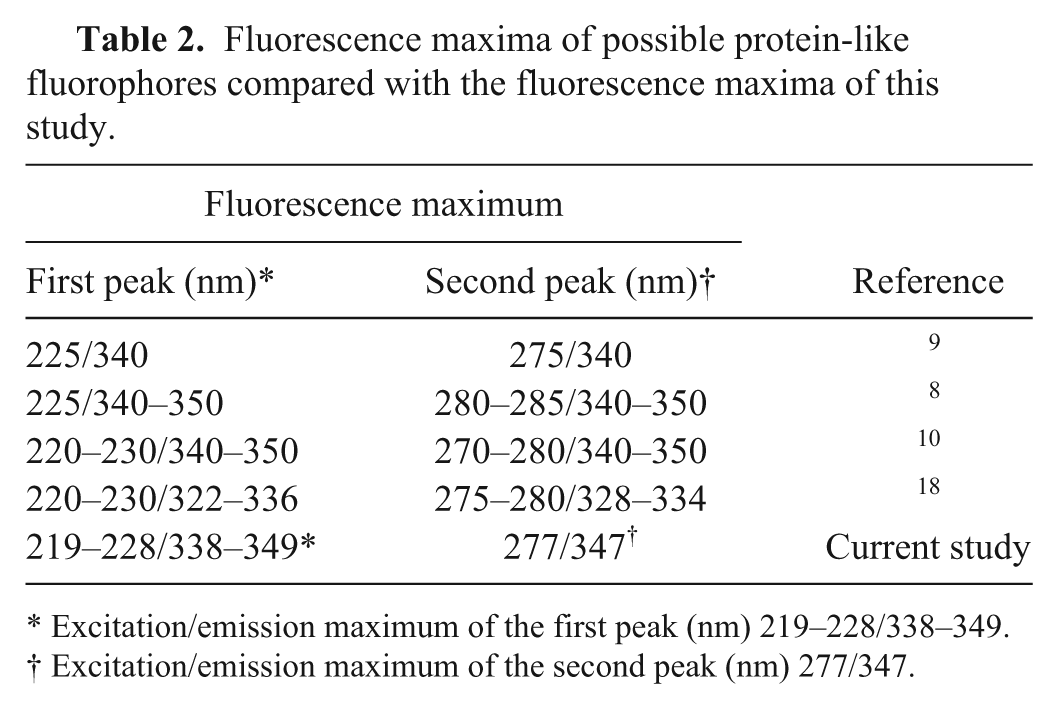
Excitation/emission maximum of the first peak (nm) 219–228/338–349.
Excitation/emission maximum of the second peak (nm) 277/347.
Novel proteomic analysis of synovial fluid shows that 575 proteins can be identified in synovial fluid, and many were found to be differentially expressed during various disease conditions. This indicates that all stated proteins are rich in aromatic amino acid content. Subcellular compartmentalization, or association with biological processes of a few proteins differentiated in OA, 1 are listed in Table 3 along with its tyrosine and tryptophan molecule number.
Partial list of novel proteins upregulated in osteoarthritis more than 3 times,* supplemented with a number of tyrosine and tryptophan residues.
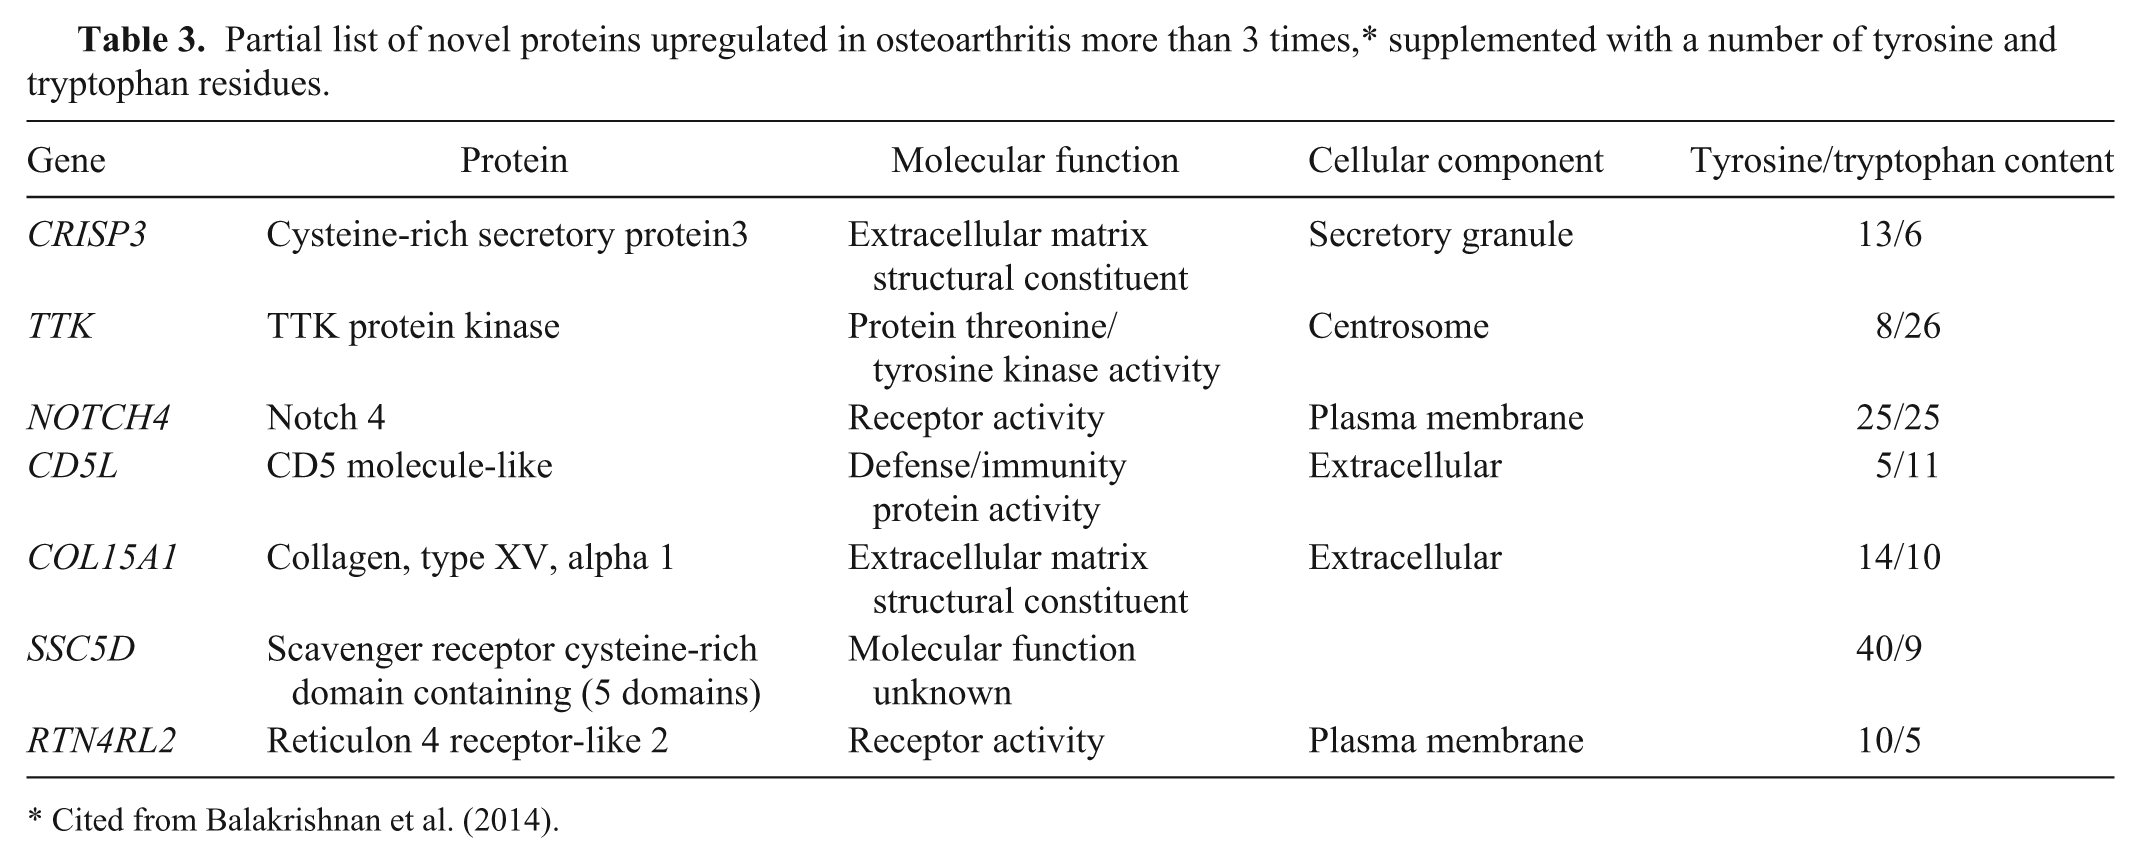
Cited from Balakrishnan et al. (2014).
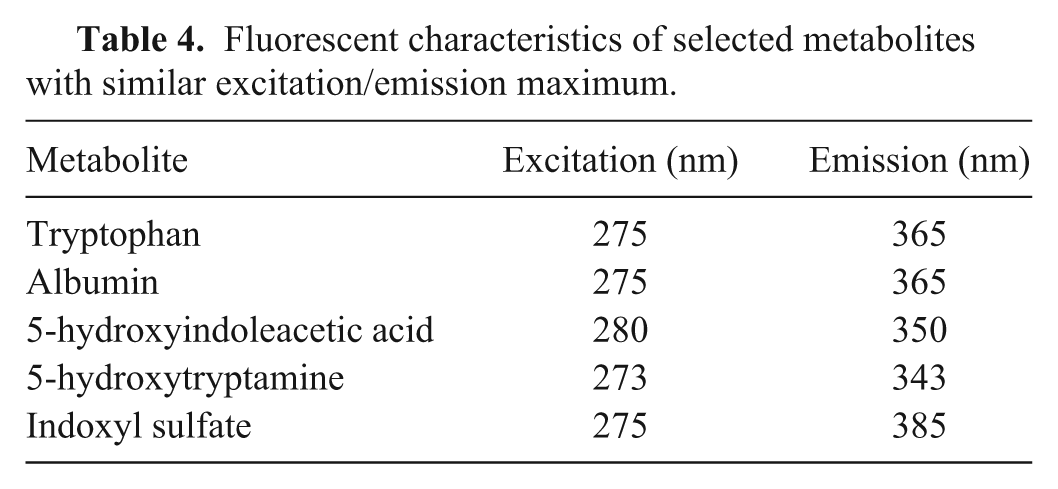
In our conditions, not only tryptophan, but also albumin, standards have an excitation/emission maximum at 275/365 nm, which means a slightly different F2 center position compared with both our results and references from the literature focused on protein-like fluorescence. If it is accepted that other components are involved in the fluorescence of the synovial fluid in response to the position of the excitation/emission maximum, we can also consider other molecules with native fluorescence (e.g., a fluorescent aromatic amino acid derivative with a built-in indole ring, such as 5-hydroxyindoleacetic acid, 5-hydroxytryptamine, or indoxyl sulfate with a proven presence in synovial fluid; Table 4). 15
Fluorescent characteristics of selected metabolites with similar excitation/emission maximum.
In addition to fluorescent molecules, the total native fluorescence of synovial fluid can be influenced by many other metabolites and factors. The intra-articular environment of an OA joint is more hypoxic and acidic than a healthy joint. 3 Molecular structure and its chemical environment influence whether a substance will fluoresce and the intensities of these emissions. Denaturation, and conformational changes in general, cause changes in the emission maximum and quantum yield. 14 Thus, we assumed that differences in fluorescence intensities between the healthy and diseased group of dogs are based on the same phenomena.
Some authors have suggested that changes observed in the biochemical profile of canine osteoarthritic synovial fluid may be useful in understanding alterations in joint metabolism consequent to arthritic diseases and may identify potential markers of OA. 3 Our data demonstrate that the synovial fluid metabolic fingerprint of canine patients with MCD differs from that of healthy dogs. Metabolomics also provides promising opportunities for both diagnosis of orthopedic diseases and study of the underlying processes, which may offer clues to how the inflammatory process develops. 11
Footnotes
Acknowledgements
We thank Peter Kolarčík for his technical assistance with the article.
Authors’ contributions
K Bilská contributed to acquisition and interpretation of data; drafted the manuscript; and gave final approval. Z Šteffeková contributed to analysis and interpretation of data, and critically revised the manuscript. A Birková contributed to acquisition, analysis, and interpretation of data, and critically revised the manuscript. M Mareková contributed to conception and design of the study; critically revised the manuscript; and gave final approval. V Ledecký contributed to conception of the study; and gave final approval. M Hluchý contributed to conception and design of the study; drafted the manuscript; and gave final approval. T Kisková contributed to analysis of data; critically revised the manuscript; and gave final approval. K Bilská, A Birková, and V Ledecký agreed to be accountable for all aspects of the work in ensuring that questions relating to the accuracy or integrity of any part of the work are appropriately investigated and resolved.
a.
Simplicity ultrapure water system, Millipore SAS, Alsace, France.
b.
Luminescence Spectrophotometer LS 55, Perkin Elmer Inc., Waltham, MA.
c.
Quartz cuvette 101-QS, (10 mm), Hellma Analytics, Müllheim, Germany.
d.
FL WinLab software, PerkinElmer, London, United Kingdom.
e.
IBM SPSS 18.0 for Windows, SPSS Inc, Chicago, IL.
Declaration of conflicting interests
The author(s) declared no potential conflicts of interest with respect to the research, authorship, and/or publication of this article.
Funding
The author(s) disclosed receipt of the following financial support for the research, authorship, and/or publication of this article: This work was made possible with the support of the Grant Agency VEGA, Ministry of Education, grant 1/0731-13 (Etiopathogenesis, diagnosis and treatment of medial compartment disease of the elbow joint and patella in dogs).