
Abstract
External validity is fundamental to veterinary diagnostic investigation, reflecting the accuracy with which sample results can be extrapolated to a broader population of interest. Probability sampling methods are routinely used during the collection of samples from populations, specifically to maximize external validity. Nonprobability sampling (e.g., of blood samples collected as part of routine surveillance programs or laboratory submissions) may provide useful data for further posthoc epidemiological analysis, adding value to the collection and submission of samples. As the sample has already been submitted, the analyst or investigator does not have any control over the sampling methodology, and hence external validity as routine probability sampling methods may not have been employed. The current study describes several Geographic Information System (GIS) and non-GIS methods, applied posthoc, to assess the external validity of samples collected using both probability and nonprobability sampling methods. These methods could equally be employed for inspecting other datasets. Mapping was conducted using ArcView 9.1. Based on this posthoc assessment, results from the random field sample could provide an externally valid, albeit relatively imprecise, estimate of national disease prevalence, of disease prevalence in 3 of the 4 provinces (all but Ulster, in the north and northwest, where sample size was small), and in beef and dairy herds. This study provides practical methods for examining the external validity of samples postcollection.
Introduction
External validity is fundamental to veterinary diagnostic investigation, reflecting the accuracy with which sample results can be extrapolated to a broader population of interest. 6 External validity can be affected by sampling bias. 8 Probability sampling methods are routinely used during the collection of population samples, specifically to minimize the potential of sampling bias. Using probability sampling, each member of the population has a known nonzero probability of being selected. 5 Using these methods, the results are expressed in a probabilistic manner; that is, an estimate of prevalence (with a defined precision and confidence) in the broader population, or substantiation of disease freedom (at a defined level of confidence and given a minimum disease prevalence, if infections were present) in the broader population. 4,14 Simple random sampling is the “purest” form of probability sampling. For example, in a previous study 13 of farm-level risk factors for porcine reproductive and respiratory syndrome (PRRS) in Denmark, a random sample of sow herds was selected from the PRRS register, which provided a complete list of all PRRS investigations conducted in Denmark. 13 However, this method is frequently unworkable, as a complete list of the population (a sampling frame) may not be available. Several other random sampling strategies are more commonly used in veterinary medicine, including systematic sampling and multistage sampling. 2 Variants of the latter include stratified and cluster sampling. 10,11 When nonprobability methods (e.g., purpose, opportunistic, and snowball) are used during sample selection, it is not possible to formally determine the degree of sampling bias present. 12
In veterinary medicine, posthoc stratification has routinely been applied following sample collection to compare characteristics of the sample with those of the broader population. 6 Broad guidelines are now available from the medical literature to enhance the quality and transparency in health research (www.equator-network.org; e.g., the Strengthening the Reporting of Observational studies in Epidemiology [STROBE] statement for observational epidemiological studies, the Standards for Reporting of Diagnostic Accuracy statement, the Consolidated Standards of Reporting Trials statement). 1,3,17 Relevant to external validity, the STROBE statement, 17 which covers observational epidemiological studies in general, and cohort, case-control, and cross-sectional studies in more detail, provides the following reporting guidelines:
In the Materials and Methods, it is important that authors present detail of selection criteria for participants, source and method of selection, and a flow diagram.
In the Results, detail should be presented of the number of participants potentially eligible, confirmed eligible, included in study, and lost to follow-up as well as descriptive data on characteristics of each participant group.
In the Discussion, authors should interpret the external validity of the study.
Guidelines specifically for reporting surveys are also available. 9
Nonprobability sampling (e.g., of blood specimens collected as part of routine surveillance programs or laboratory submissions) may provide useful data for further posthoc epidemiological analysis about the condition(s) for which the samples were originally submitted for testing. Following additional testing, similar analyses can also be conducted about other condition(s), thereby adding value to existing sample collection. As the data had already been collected, the analyst or investigator does not have any control over the sampling methodology, and routine probability sampling methods may not have been employed, which means the external validity of the sample should be assessed prior to using probability-based statistics for making inferences to other groups from the data.
In 2005, a survey was conducted in Ireland to determine the serological prevalence and within-herd prevalence of Johne's disease in Irish cattle. Random sampling of 1,000 herds was implicit in the study design; however, as a result of errors during specimen collection, there was a shortfall in the number targeted for collection. Further specimens were collected using opportunistic (nonprobability) sampling methods. As a consequence, the external validity of the overall sample needed to be verified. The current paper describes various Geographic Information System (GIS) and non-GIS methods, applied posthoc, to assess the external validity of samples collected using both probability and non-probability sampling methods.
Materials and methods
The data
In Ireland, all cattle herds have a unique herd number and are registered in the national Animal Health Computer System. As part of the national brucellosis eradication program, blood is collected annually from all cattle (females and intact males) over 1 year of age. In 2005, brucellosis sampling was conducted on approximately 132,000 herds. In the current study, the “reference population” included a subset of these herds, specifically the 96,163 (breeding) herds where at least 1 home-born calf had been registered in 2003.
A simple random sample of 1,000 herd numbers was selected from the reference population, using computer-generated random numbers. This sample size is sufficient to estimate a national herd level prevalence of 10%, with a 95% confidence interval and a precision of 2%. Arrangements were then made, through the national brucellosis testing laboratory, to collect all sera from each of these herds. A computer program was used to notify staff when relevant samples were available. Between June and November 2005, the sera from 640 herds (the “random field sample”) were collected in this way. However, a computer error occurred for a period mid-year, and a proportion of the target samples were not collected. Once the error was detected, sera from a further 367 herds were collected based on opportunistic sampling during early winter 2005 to make up for the earlier missed samples. Samples in this “opportunistic field sample” were selected by laboratory staff from the brucellosis submissions as they came in, without any formal methodology of sampling employed. These datasets were checked for entry errors, including multiple entries. Duplicate entries for 4 herds (1 in the random field sample, 3 in the opportunistic field sample) were removed.
A further 3 herd samples were artificially generated to provide comparison groups to the field samples, using the random number selection in the Animal Movement extension of ArcView version 2.4. a These generated samples included random A (605 herds, for comparison with the random field sample), random B (295 herds, for comparison with the opportunistic field sample), and random A+B (random A and B combined, 900 herds, for comparison with the combined random and opportunistic field samples).
Data analyses
General GIS information. In Ireland, herd numbers are geo-referenced to digitized parcels of land, constructed for calculating European Union land-based farming aid. The geo-referenced farm database does not include farms that do not manually complete an application for farming aid, including those that were automatically eligible and those where a claim for farming aid was not made. In the current study, the position of each farm was based on the center of the largest land fragment. Mapping was conducted using ArcView version 9.1. a
Posthoc assessment of external validity. Non-GIS methods.–-The percentage of herds within each of the 26 counties of Ireland was determined based on available herd-level data from the reference population (n = 96,163 herds), the random field sample (n = 639), the opportunistic field sample (n = 364), and the combined field sample (n = 1,003). The percentages were graphed, and a chi-square test b was used to separately compare county herd distribution in the random field sample versus the reference population and the opportunistic field sample versus the reference population. The field samples and reference population were also stratified by province (4 categories: Connaught, Leinster, Munster, Ulster), county (26) and enterprise type (3: dairy, beef, mixed). Enterprise type was determined based on the proportion of beef and dairy breeds among mature cows in each herd (beef: >66% beef breeds; dairy: >66% dairy breeds; mixed: all other herds). A chi-square test b was used to separately compare the distribution of herds in the random field sample versus the reference population, and the opportunistic field sample versus the reference population, by province and by enterprise type.
GIS methods.–-The spatial distributions of the random and opportunistic field samples were visually compared. Then, the average nearest neighbor method (ArcView 9.1) was used on both the field (random, opportunistic, combined) and generated (random A, B, A+B) samples to determine the degree of clustering in each. This method is a simple technique that assumes all “points” are free to locate anywhere in a study window. Using this assumption, the software calculates the hypothetical average distance between points and compares this with the actual observed distance between points. A normal distribution for the hypothetical calculated average distance is created and the ratio of the observed to expected average values are placed on this curve using the Z-score (that is, the probability that the data is not random). Confidence intervals of 90%, 95% and 99% from the curve are used to determine significance levels that define qualitative definitions of the likelihood that the observed data are randomly distributed. For example, within the confidence limits of 90% (significance level >0.10) there is a “high” likelihood that the points are neither dispersed nor clustered; furthermore, between 90 and 95% (significance level 0.10–0.05), there is a “medium” likelihood data are dispersed or clustered but they are still possibly random. However, outside of the 95% confidence interval (significance level 0.05), there is a “low” likelihood that data are randomly distributed. Outside of 99% confidence interval, there is only a “very low” likelihood that data are randomly distributed, so it is highly likely that they are dispersed or clustered. It is a simple and robust test that defines observed data on a range of qualitative values from clustered to evenly dispersed, with random data falling in the middle of the range. Nearest neighbor ratios and qualitative outputs from ArcView were reported. Because of software restrictions, the nearest neighbor analysis could only be carried out in a rectangular area or “window” (Fig. 1) that incorporated as much of Ireland (but as little sea or Northern Ireland) as possible. Further to this, a kernel density plot (ArcView 9.1) was developed for each sample, except the combined field sample and random A+B, using the same window as a visual representation of the differences in sample distribution to support the findings of the nearest neighbor analysis. The kernel density plot was conducted using a 10-km search radius, with a 100-m grid. Results are presented as points per square kilometer.
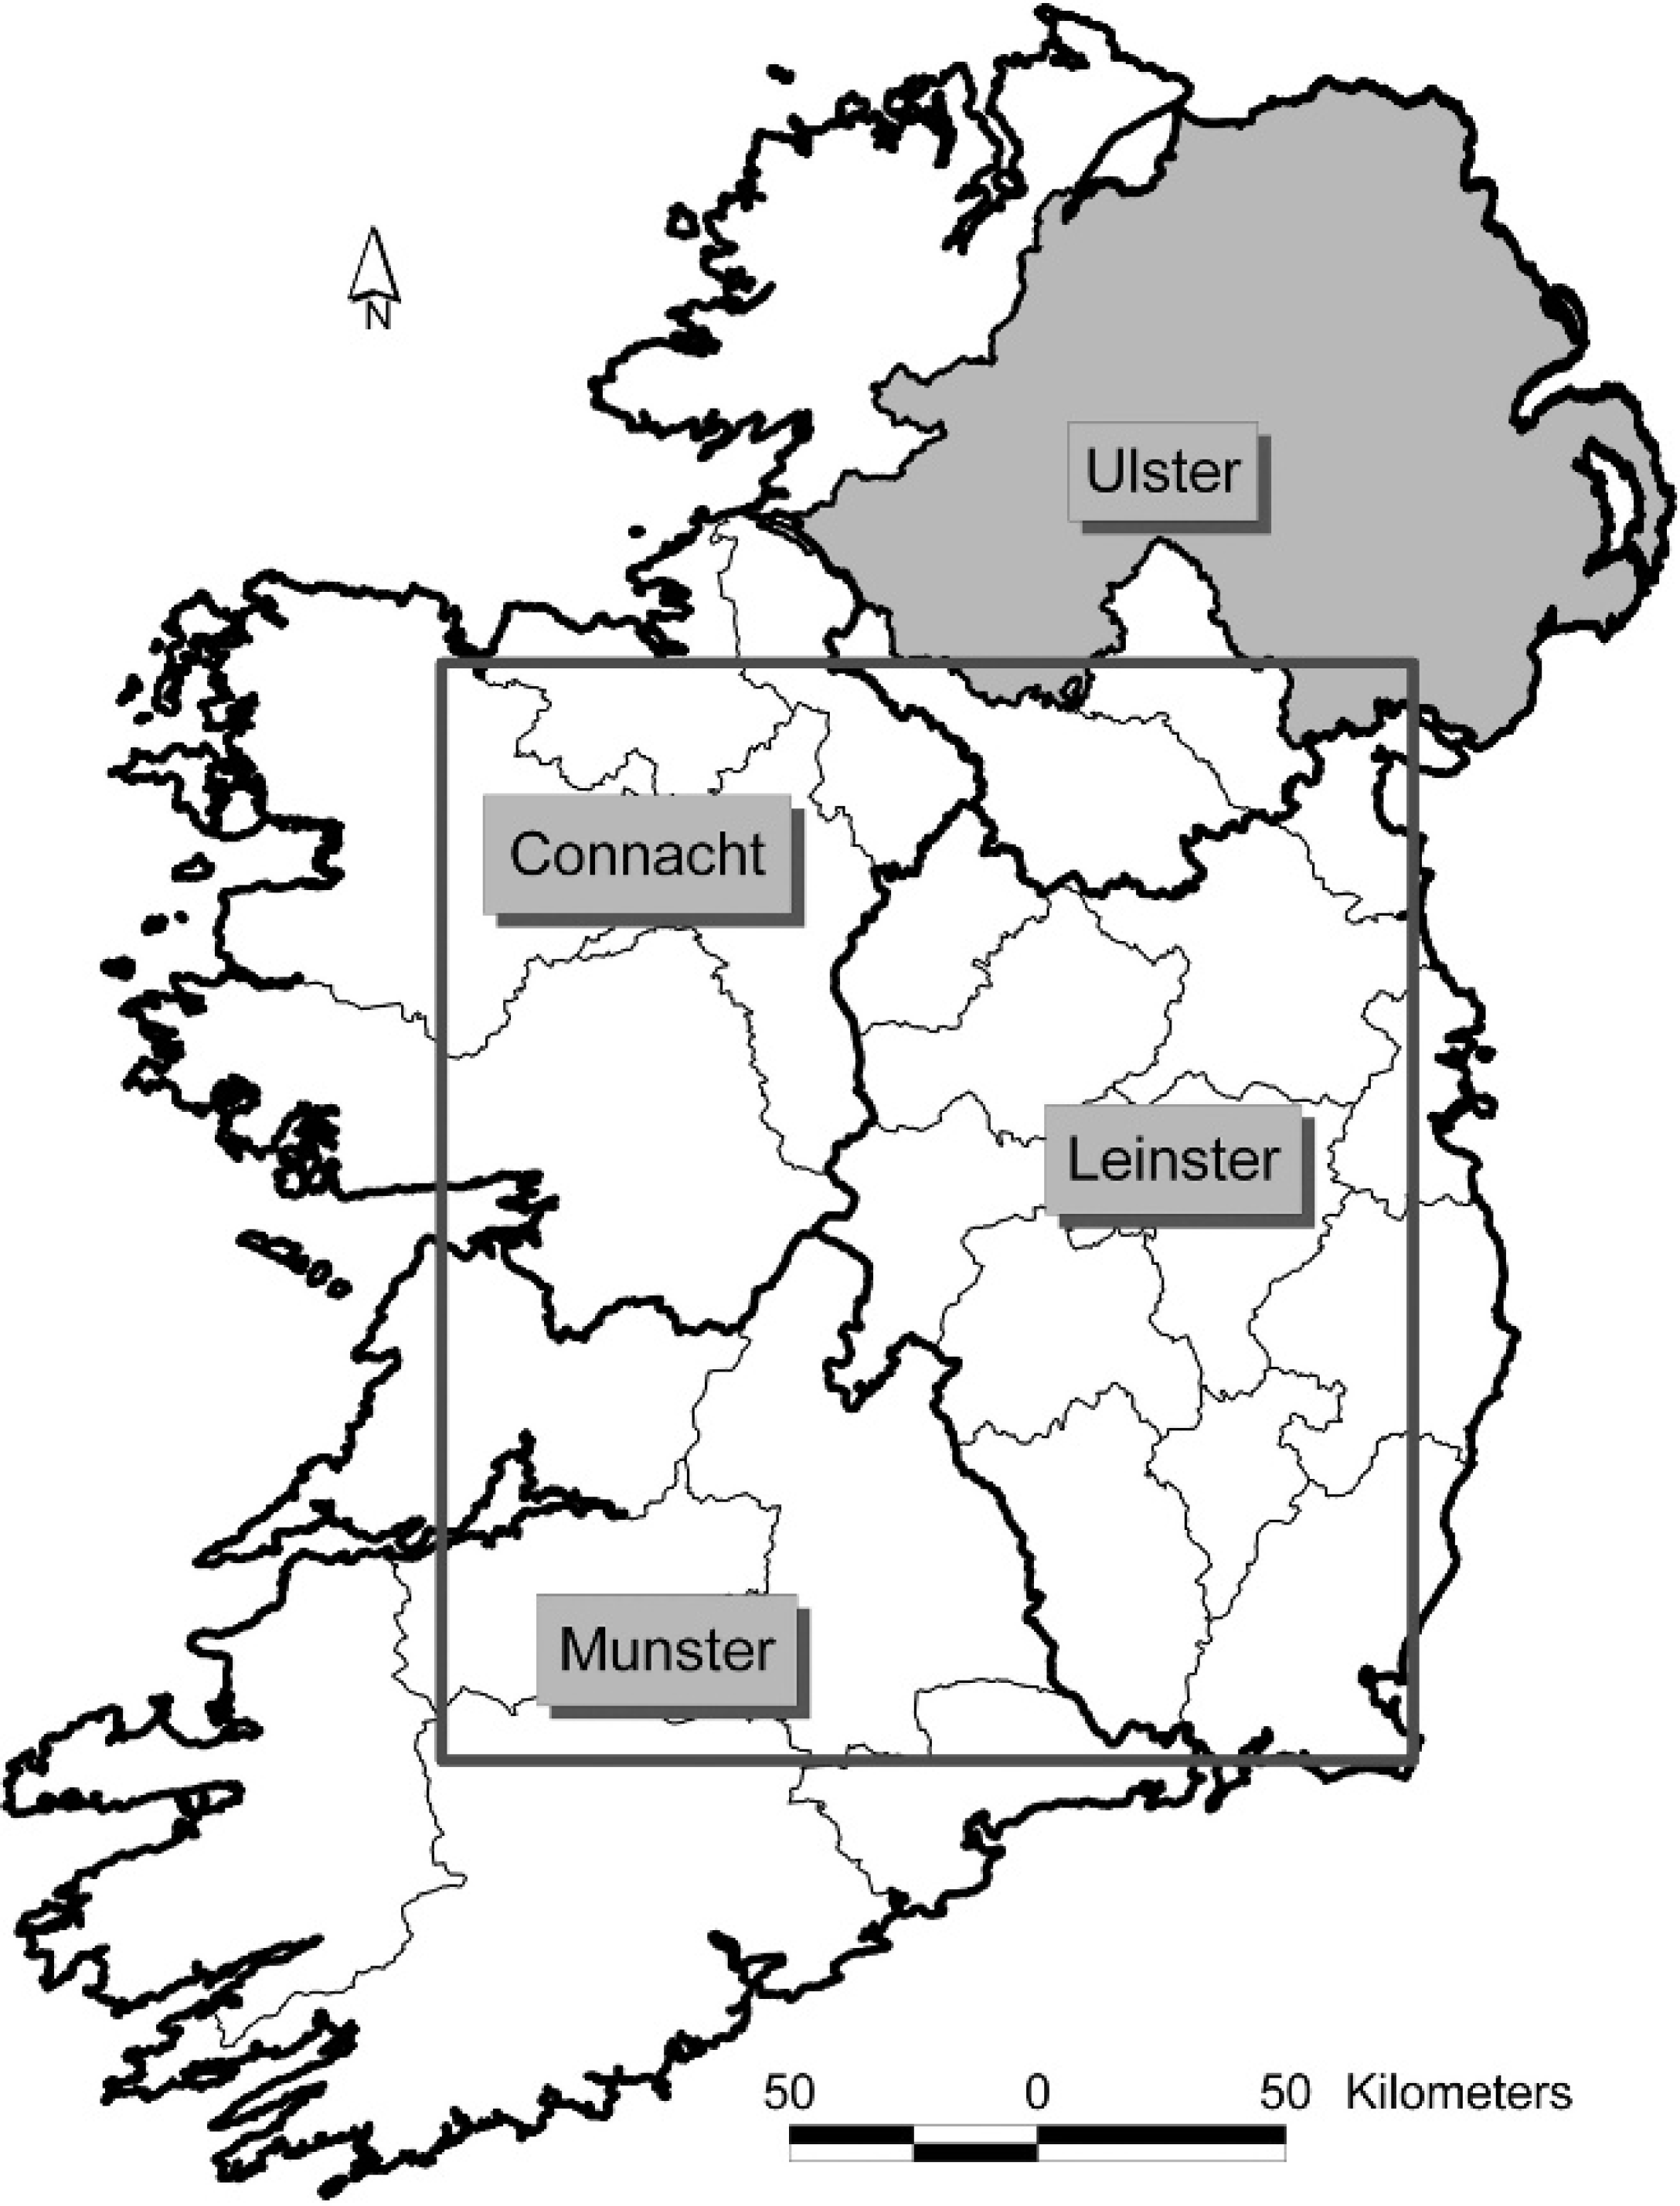
The rectangular area or “window” that was used during the nearest neighbor analysis. The window incorporates as much of Ireland (but as little sea or Northern Ireland) as possible.
Results
The samples
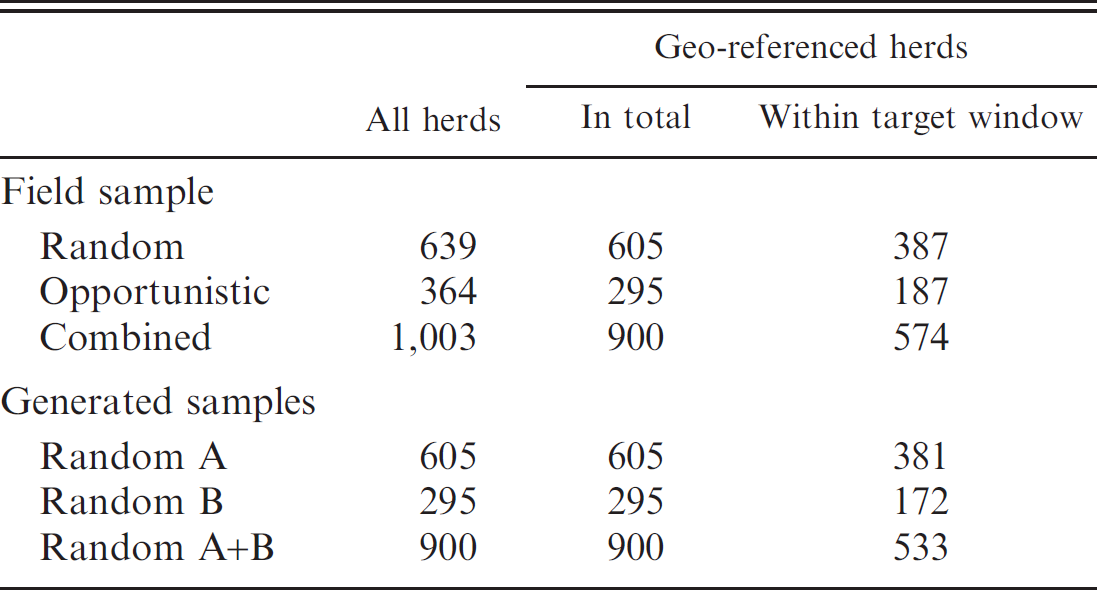
During 2003, there were 96,163 (breeding) herds in Ireland where at least 1 home-born calf had been registered. Of these, 90,807 (93.7%) were geo-referenced, including 58,285 (60.6% of all breeding herds) located within the target window. Table 1 presents the total number of herds, the number geo-referenced
The number of herds, including geo-referenced herds (in total and within the target window), in the field and in generated samples.
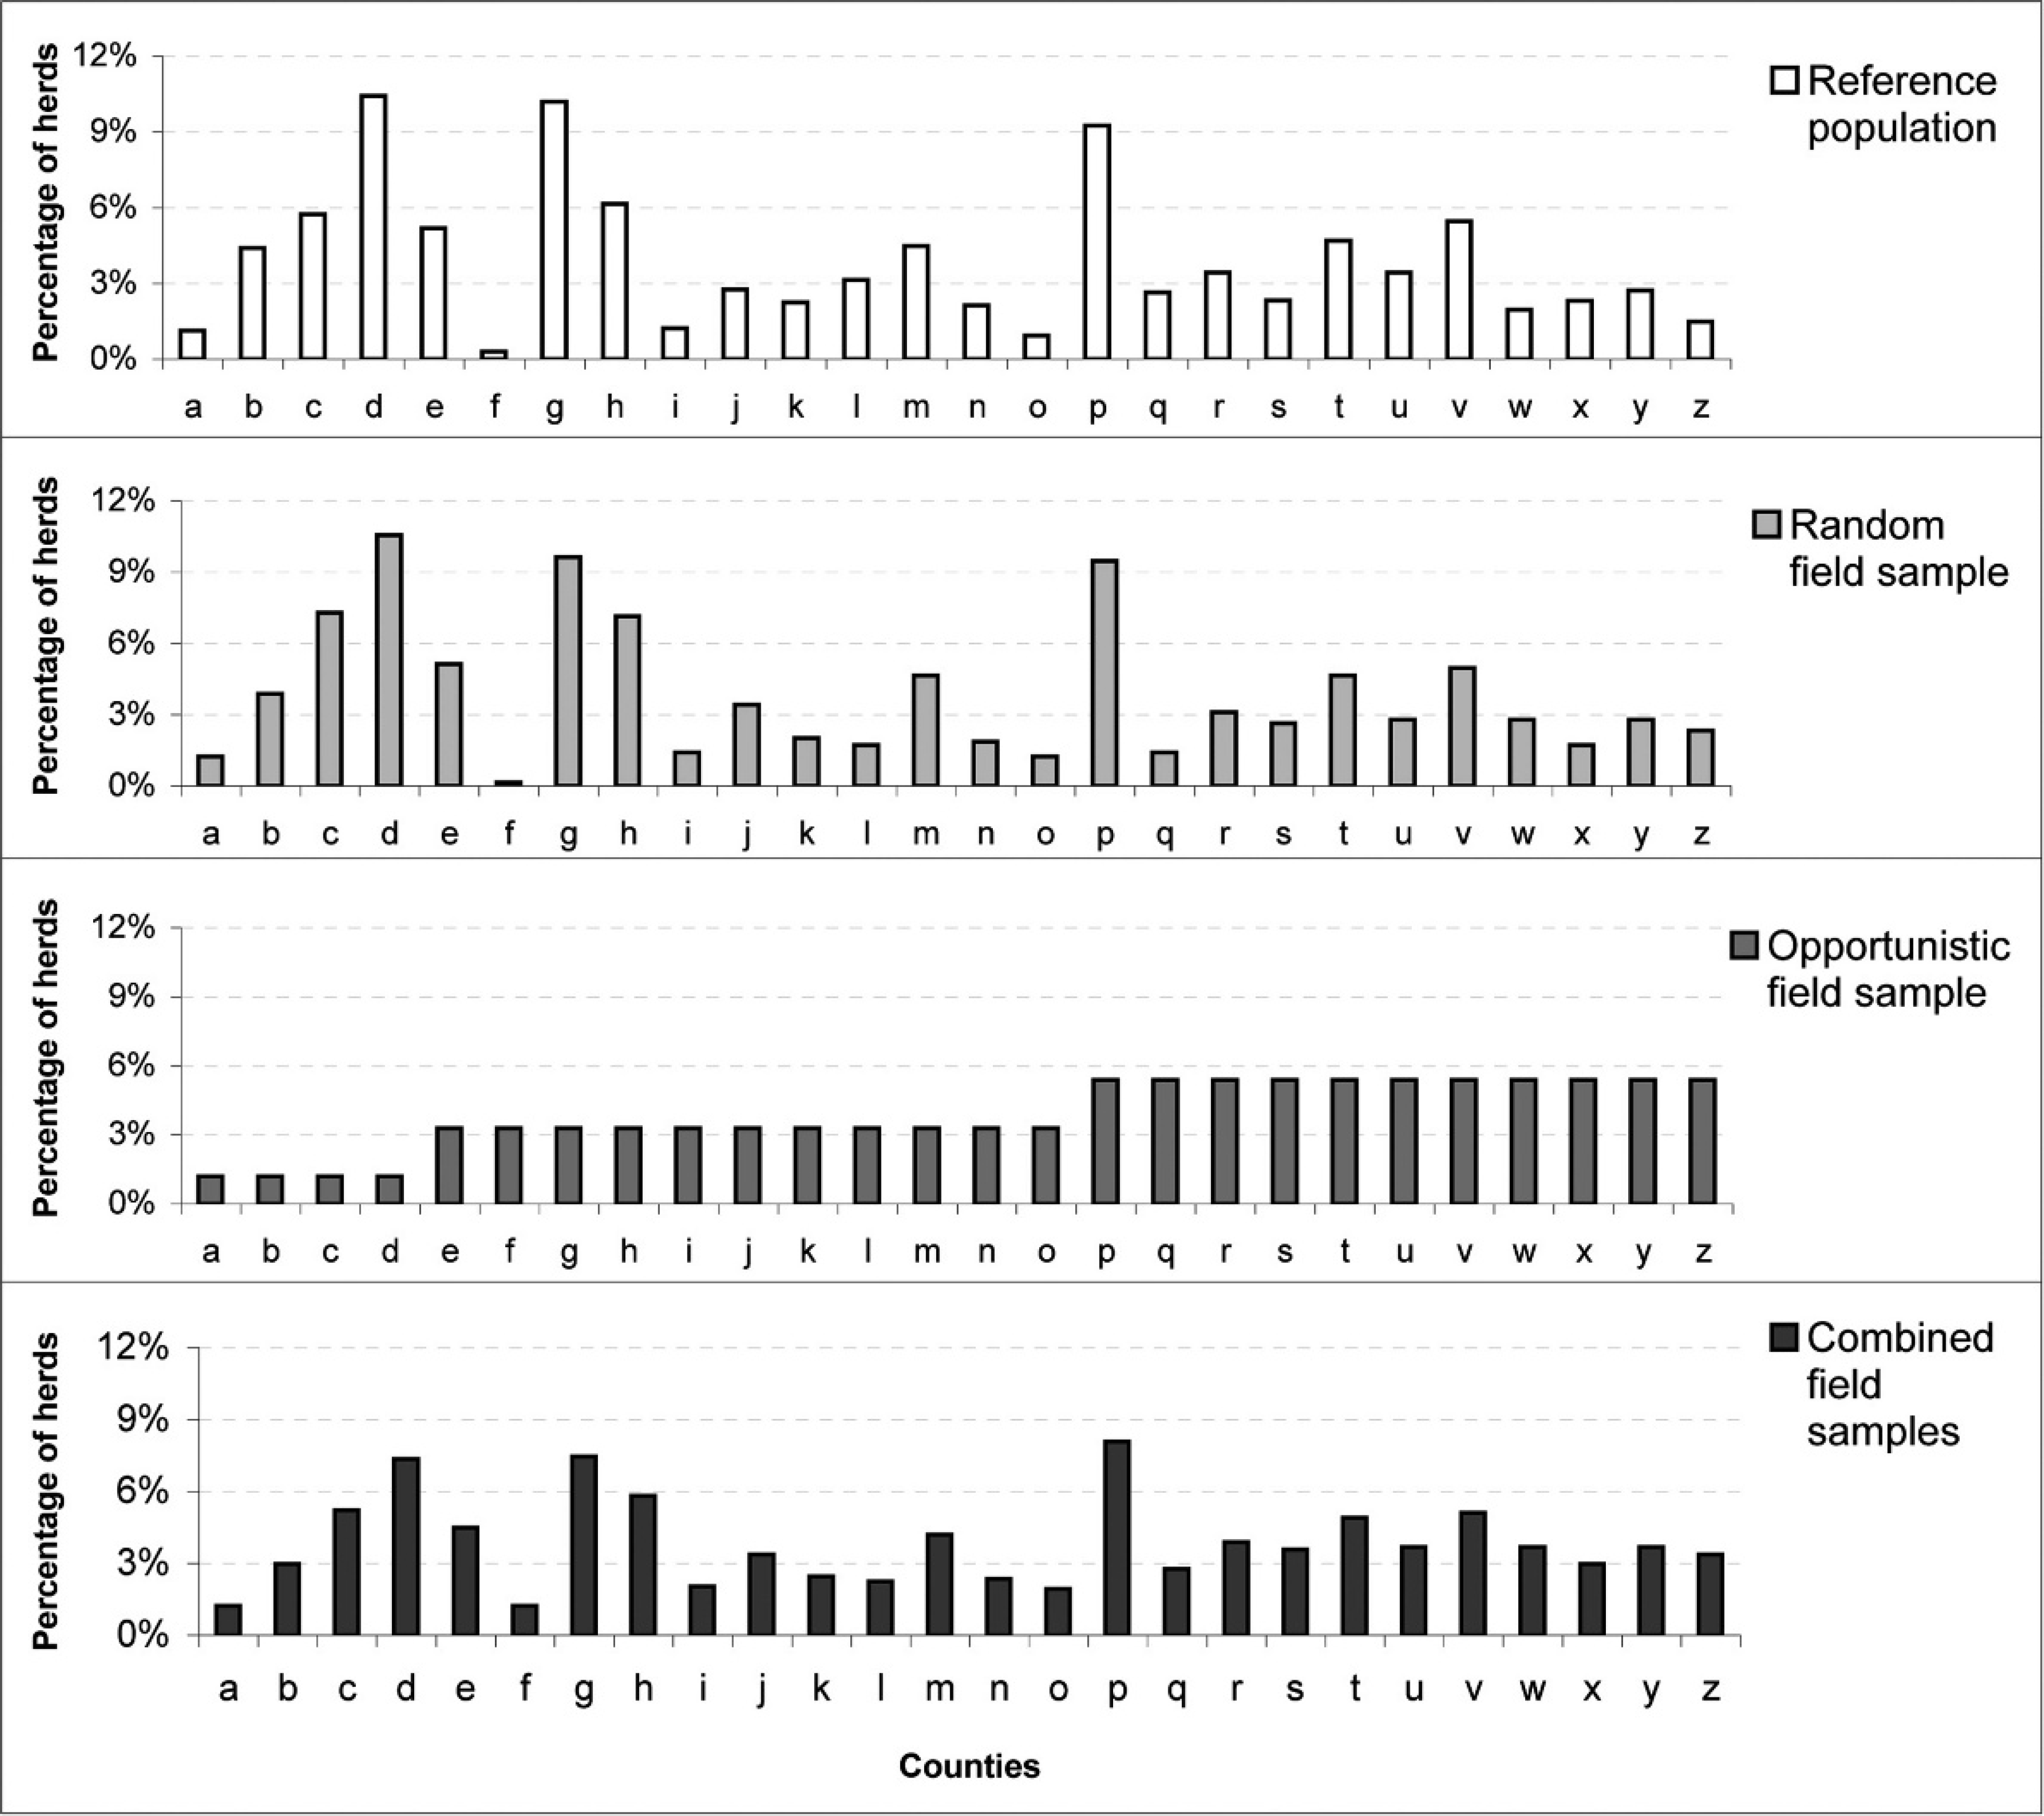
The percentage of herds in each county, by reference population, random field sample, opportunistic field sample, and combined field sample. Counties are alphabetized from Carlow to Wicklow and labeled from A to Z in that order.
in total and within the target window in each of the field, and generated sample datasets.
Posthoc assessment of external validity
Non-GIS methods. Herd distribution.–-The percentage of herds in each county is presented in Figure 2. Compared with the reference population, there were significant differences in the county herd distribution in the opportunistic (P < 0.001) but not the random (P = 0.58) field samples. The distribution of herds by province and by enterprise type is presented in Table 2. Compared with the reference population, there were significant differences in herd distribution for the opportunistic field samples, both by province and enterprise type (each P < 0.001), but not in the random field sample (by province: P = 0.90; by enterprise type: P = 0.66).
GIS methods. Visual assessment.–-The distribution of all geo-referenced cattle herds across the country was visually homogeneous, except for areas obviously not suitable for grazing, such as lakes, bogs, forest, and upland areas. Geo-referenced herds in the opportunistic field sample (n = 295) were distributed in clusters across the country, whereas those in the random field sample (n = 605) were evenly dispersed (Fig. 3).
Nearest neighbor analysis.–-Based on results of the nearest neighbor analysis, herds in the field samples were more clustered than those in the generated samples (Table 3). Furthermore, the herds in the opportunistic and combine field samples tested as more likely to be clustered than those in the random field sample.
Kernel density plots.–-Areas of higher sampling density are present in the kernel density plots of the opportunistic field sample and to a lesser degree the random field sample, but not of the equivalent generated samples (Fig. 4).
Number and percentage of herds in the field and opportunistic field samples, and in the reference population, as well as comparison between random field sample and reference population and between opportunistic field sample and reference population, by province and by enterprise type. *
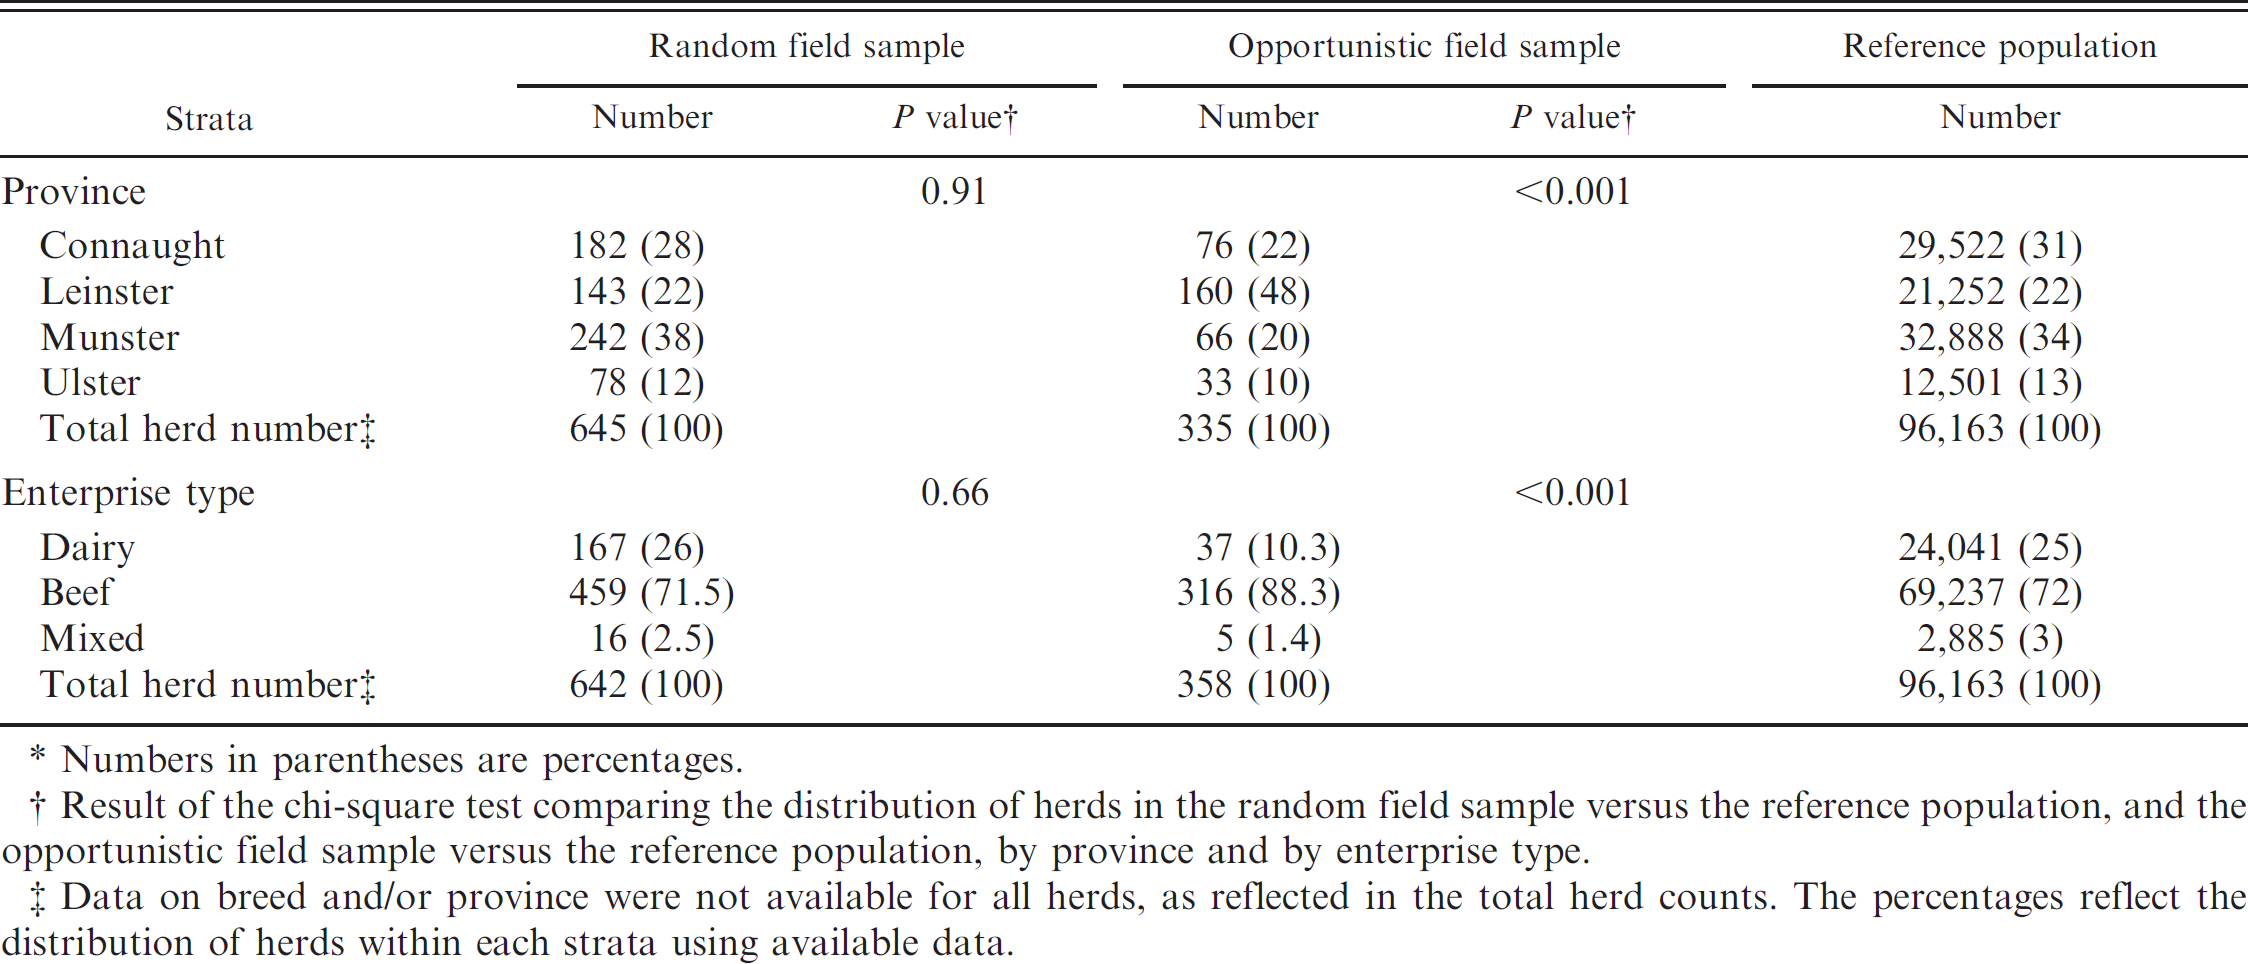
Numbers in parentheses are percentages.
Result of the chi-square test comparing the distribution of herds in the random field sample versus the reference population, and the opportunistic field sample versus the reference population, by province and by enterprise type.
Data on breed and/or province were not available for all herds, as reflected in the total herd counts. The percentages reflect the distribution of herds within each strata using available data.
Discussion
External validity is a central concept in observational epidemiological studies, reflecting the degree to which study results can be extrapolated from the sample to the broader reference population. This issue was of particular importance in the current context, as the study was seeking to provide accurate estimates of herd and within-herd prevalence of Johne's disease in the Irish cattle population. Although the cost of sample collection was relatively modest (as it was conducted in association with a national program of brucellosis surveillance), there were substantial costs associated with sample testing and subsequent analysis.
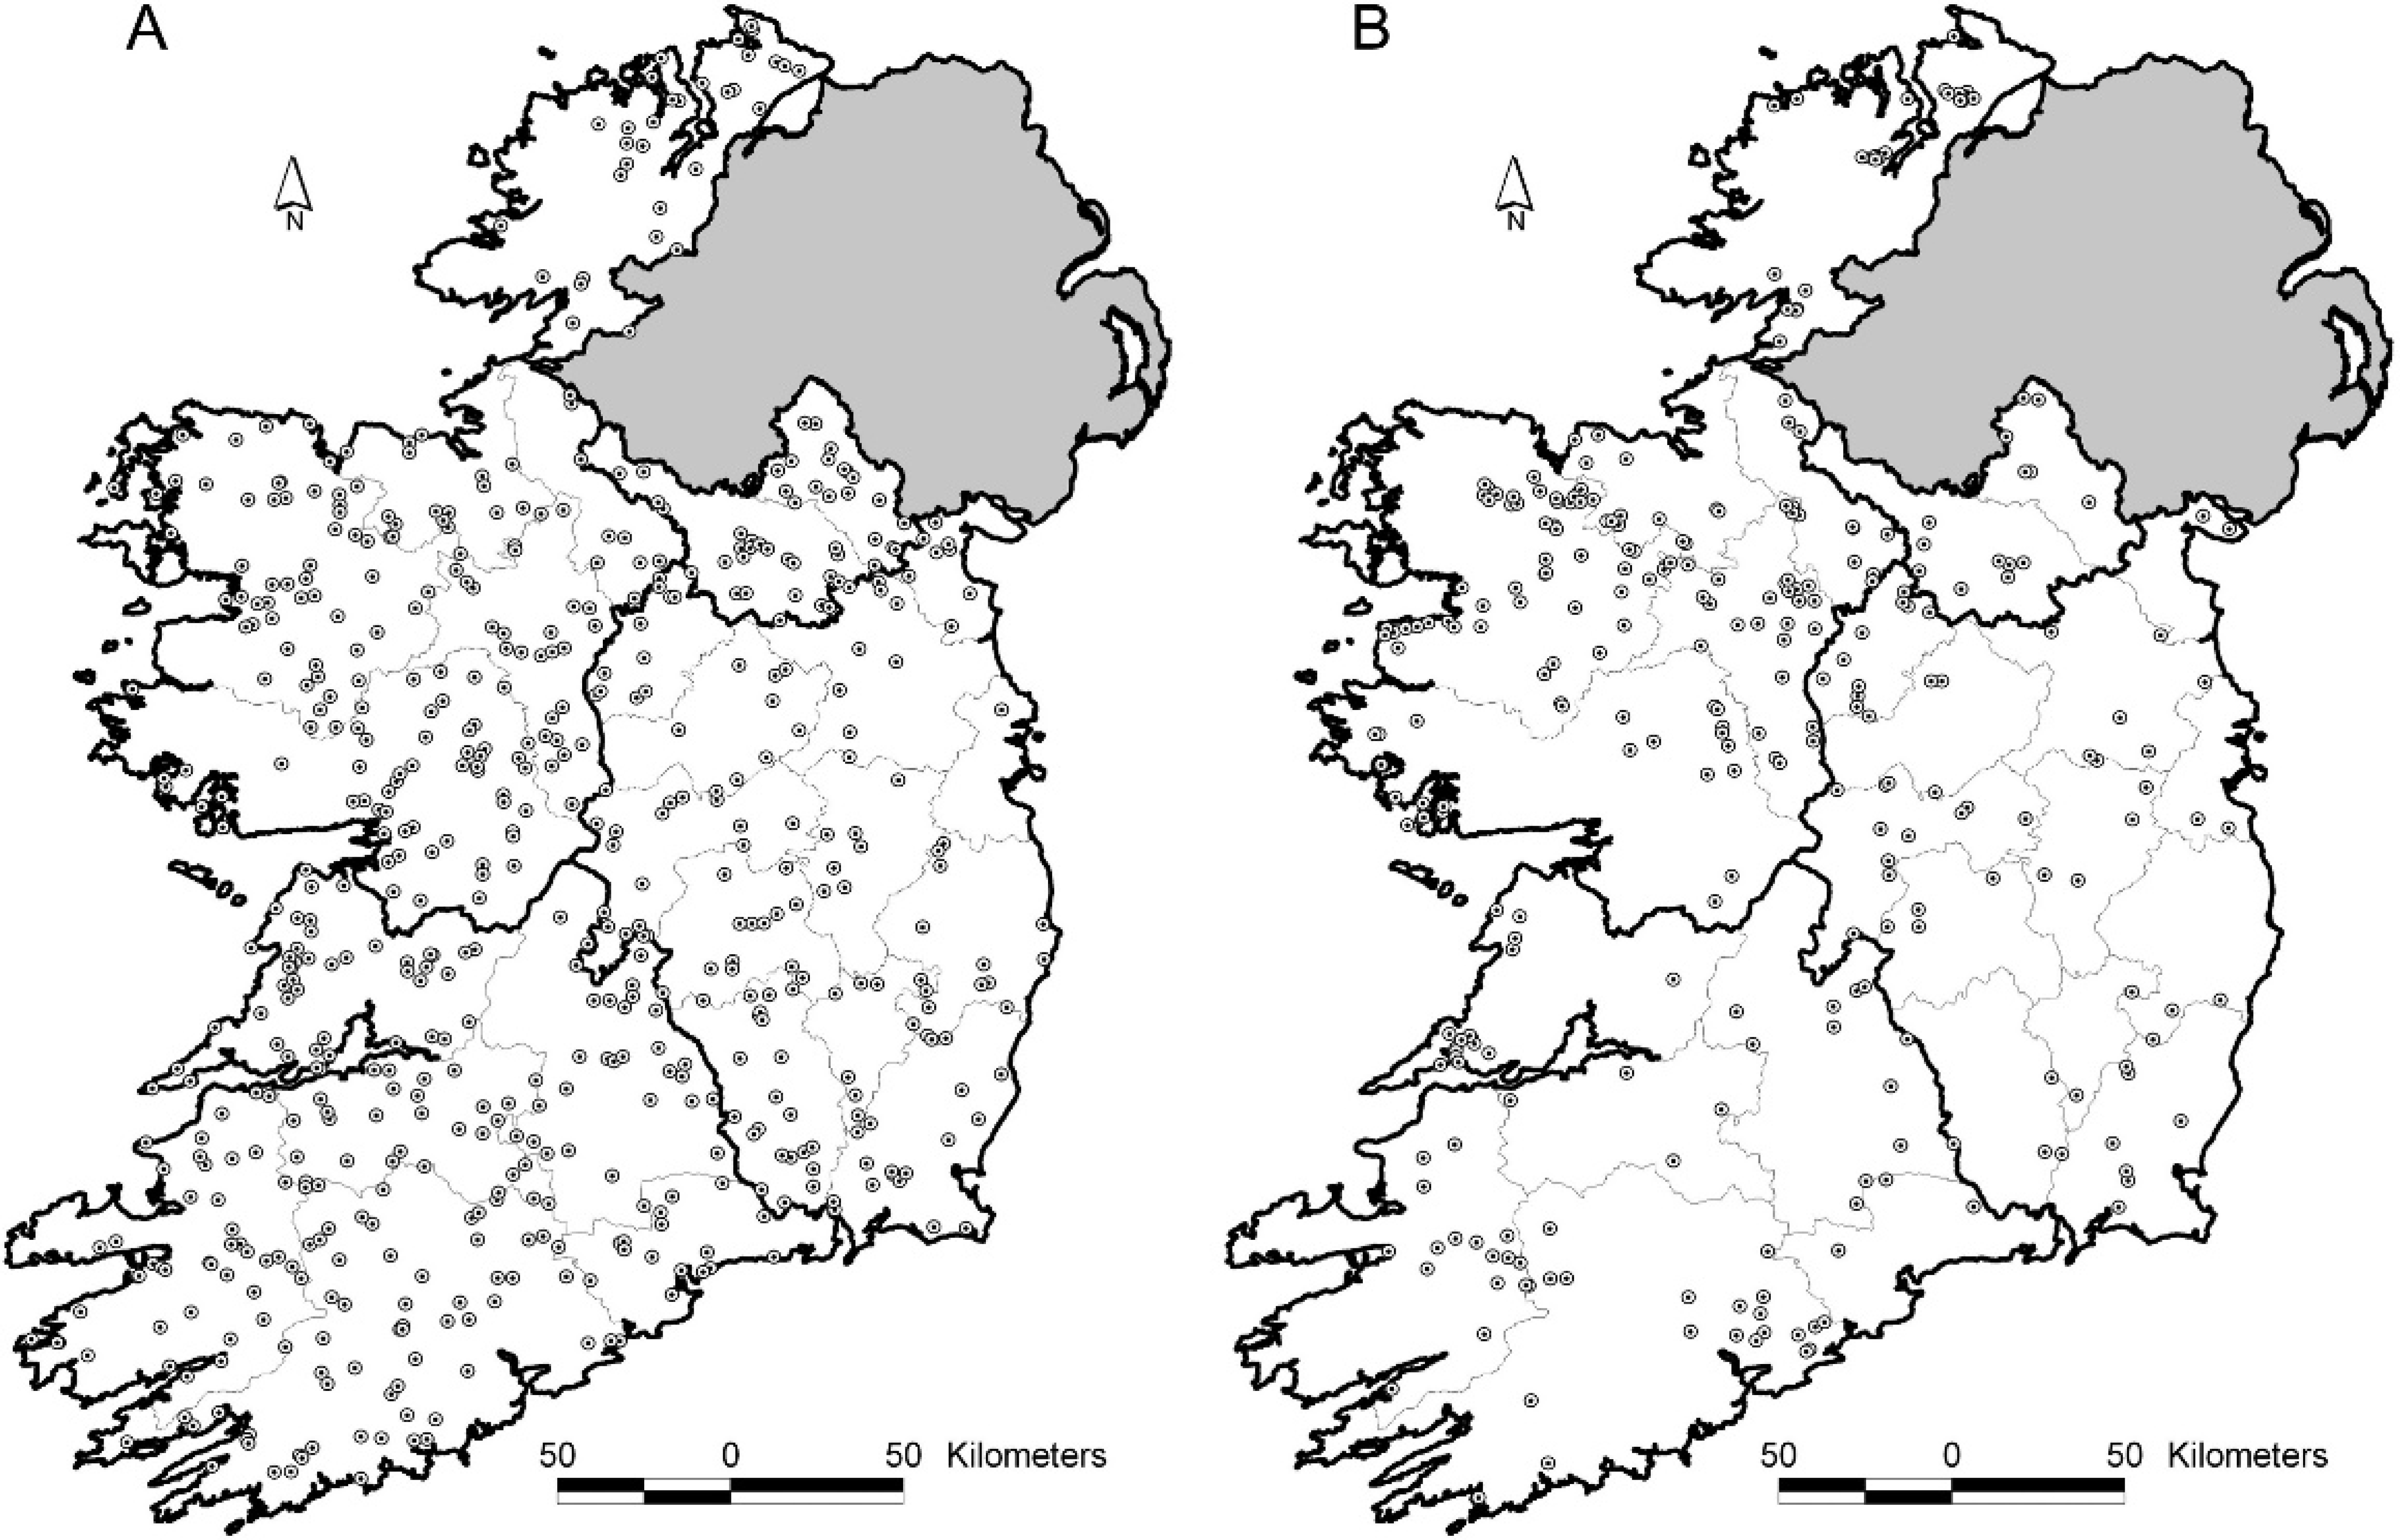
Distribution of geo-referenced herds in the random (
Assessment of herd clustering in each of the field and generated samples, based on the nearest neighbor analysis.
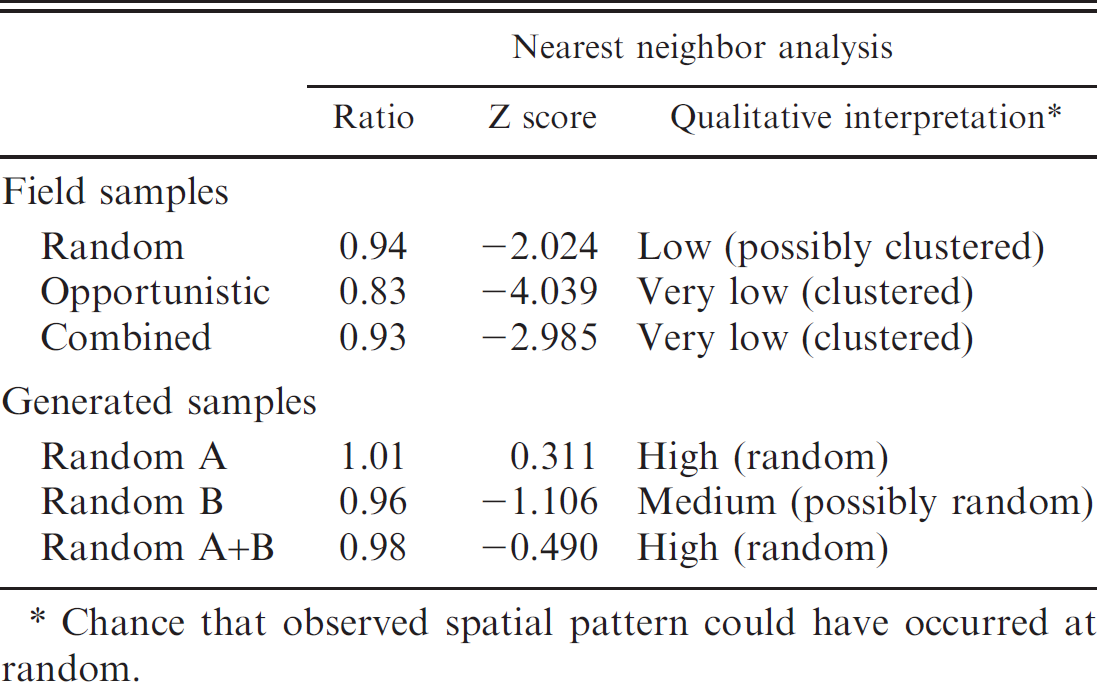
Chance that observed spatial pattern could have occurred at random.
In the present study, various non-GIS and GIS methods were used to assess the external validity of the 2 field datasets. The non-GIS methods included the distribution of herds by province, county, and enterprise type. Contrary to many similar situations, the data were available for the reference population as well as the field samples. The utility of 2 GIS methods was also examined. These methods have a long history in a number of disciplines, including geography and ecology. They are also increasingly common in veterinary medicine, to assess spatial issues relating to both populations and samples. 15,16 These methods can be conducted without prior knowledge of the prevalence of disease surveyed, which was of particular benefit here, where little a priori data were available (prior to the start of the study) regarding the
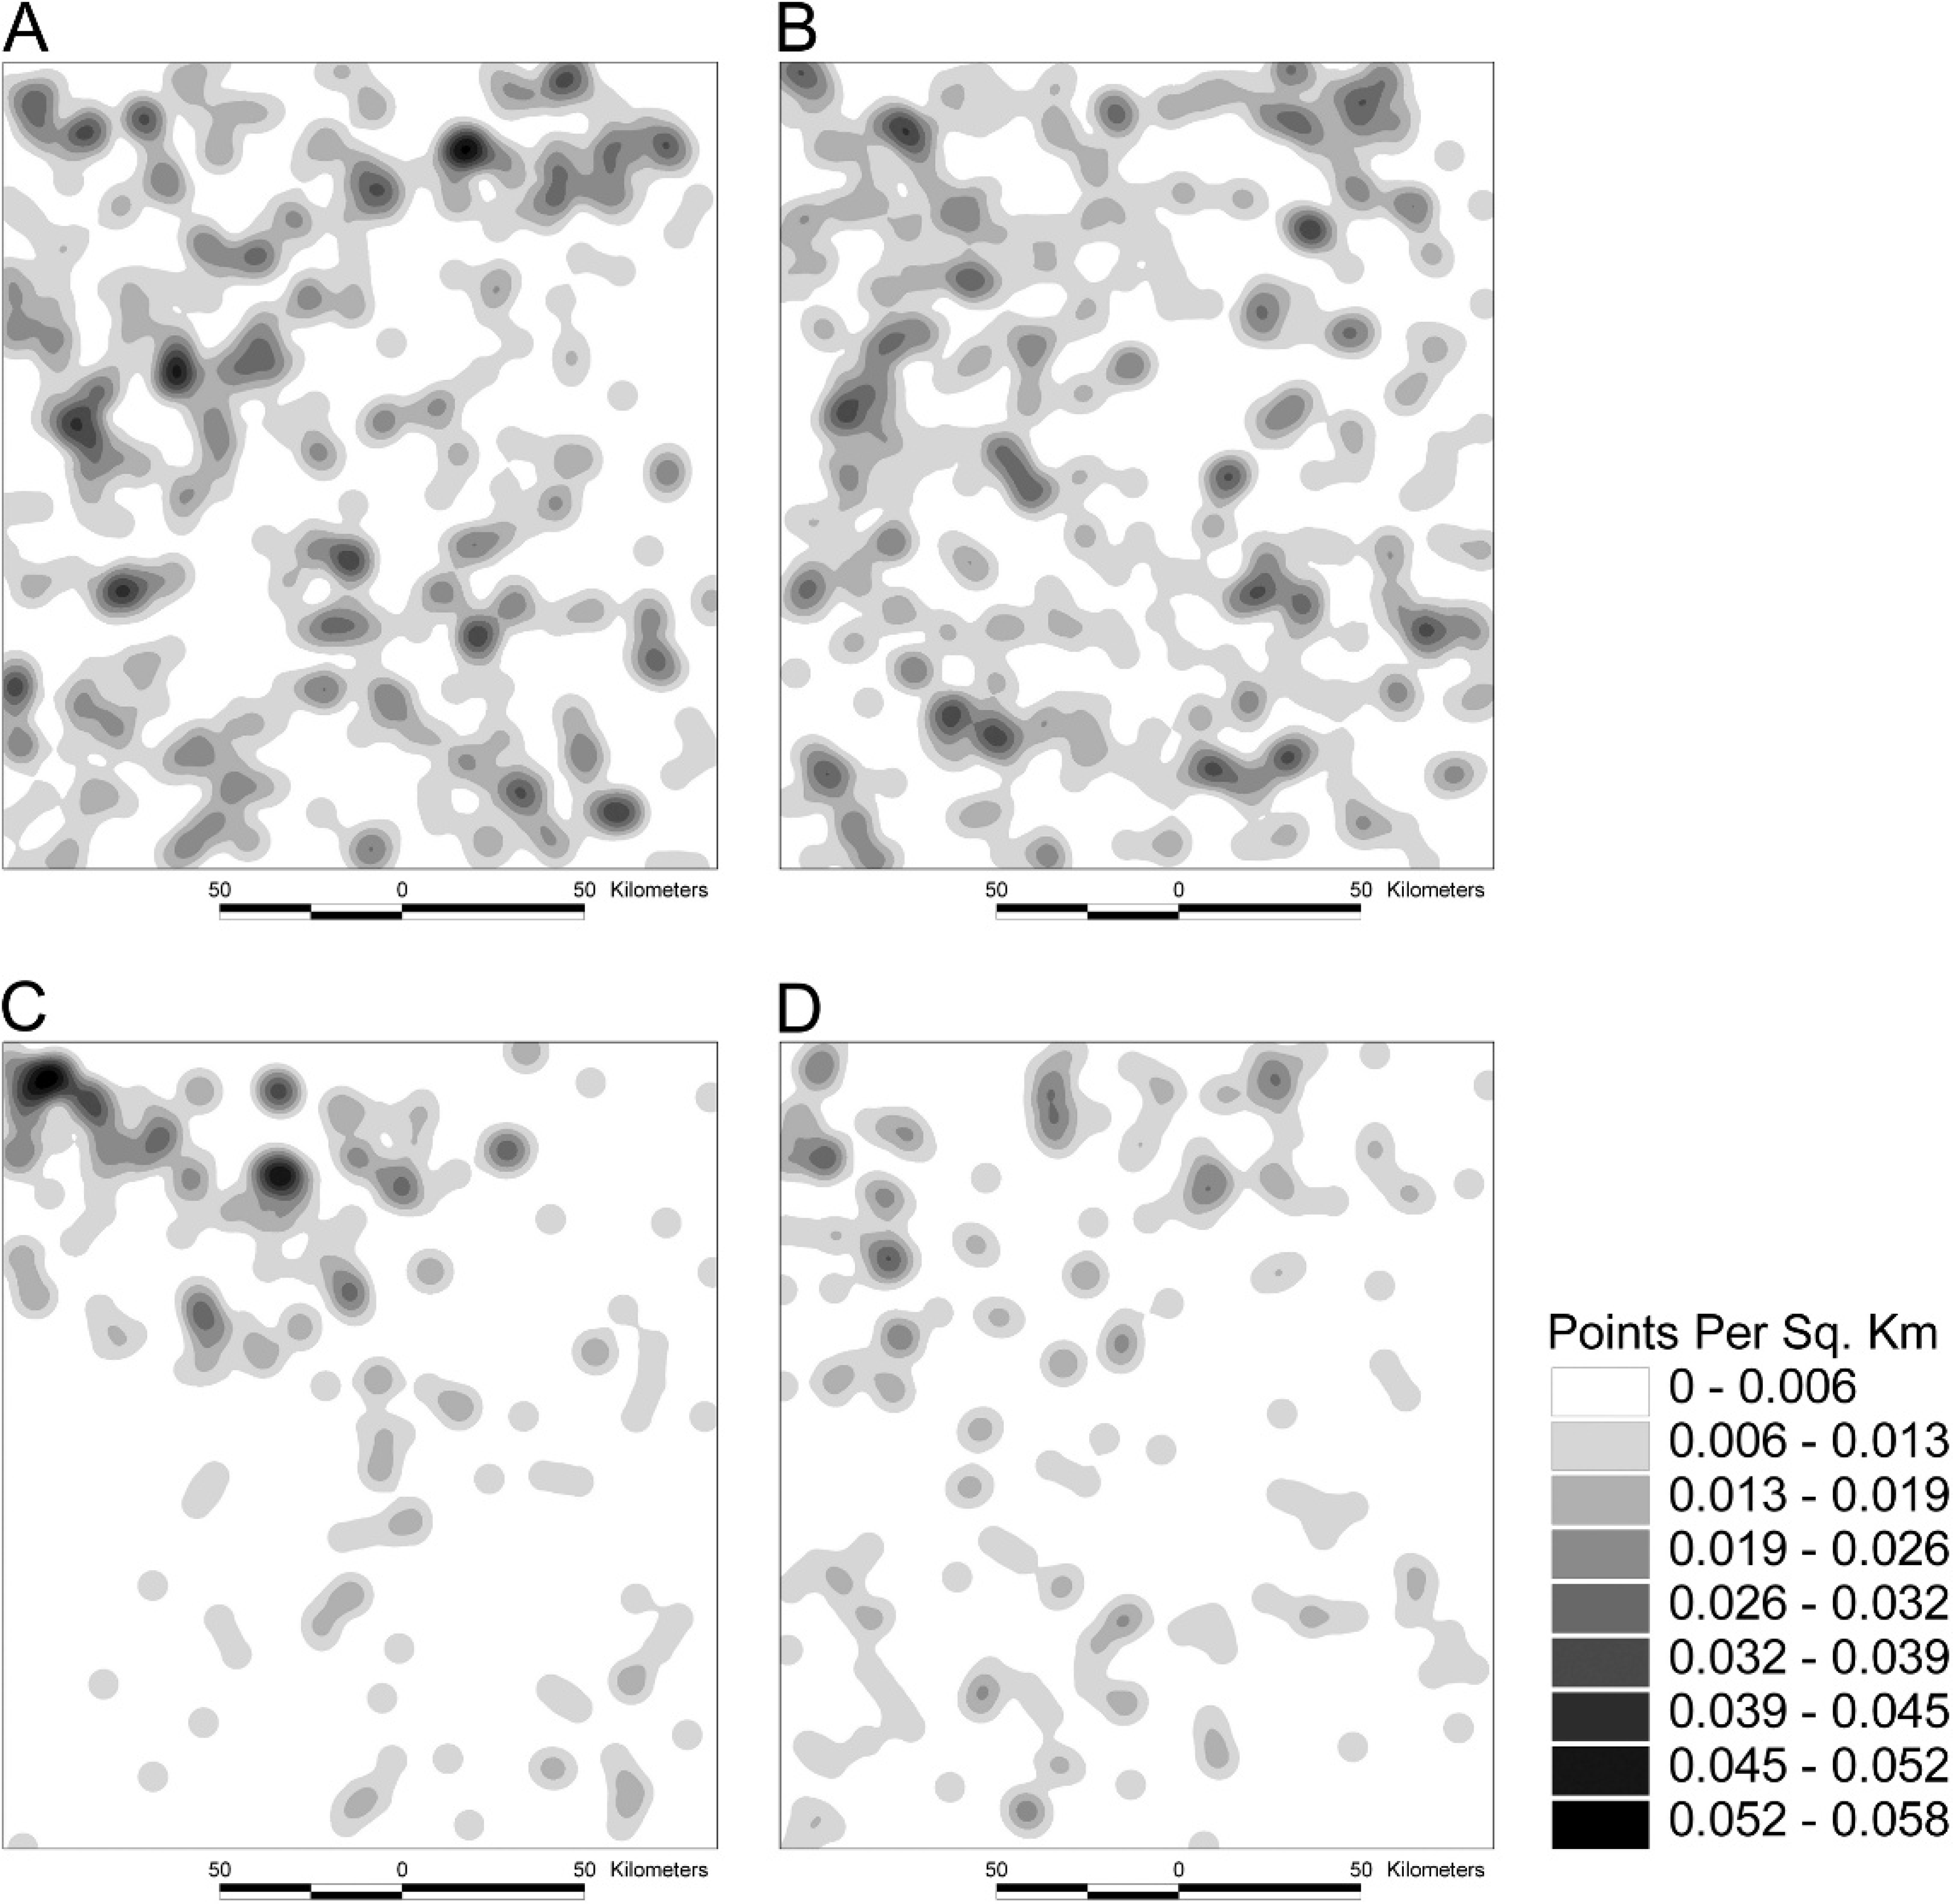
Kernel density plots of herds in (
national prevalence of Johne's disease. Nearest neighbor analysis (Table 3) provided a transparent and useful method to compare the distribution of each dataset with the target population. Further, density plots (Fig. 4) proved useful to explain the outcome of the nearest neighbor analysis. In each case, the generated sample was used to facilitate robust comparison.
The current study identified substantial differences between herd distribution in the opportunistic field sample and the reference population. This difference was seen most clearly when comparing the percentage of herds by county in the reference population and the opportunistic field sample (P < 0.001). The artificially even herd distribution in the opportunistic field sample is immediately evident (Fig. 2). Similarly, compared with the reference population, there was a significant difference in herd distribution in the opportunistic field sample by province and enterprise type (P < 0.001). The opportunistic field sample was heavily biased towards beef cattle and herds in Leinster (the eastern province) compared with Connaght (west), Munster (south), and Ulster (north, northwest; Table 2). These 2 factors are interlinked, noting that Munster has the highest proportion of Ireland's dairy herds, and therefore fewer Munster herds will also result in fewer dairy herds. These findings were consistent with results from the GIS methods. Based on results from the nearest neighbor analysis, there was a “very low” chance that the observed spatial pattern from the opportunistic field sample could have occurred at random (Table 3). The opportunistic field sample was clustered in the northwest, based on both visual appraisal (Fig. 3) and density analysis (Fig. 4). It is rarely possible to produce reliable inferences about a population when opportunistic (nonprobability) sampling is used. 7
The distribution of herds in the random field sample and the reference population were similar. In these 2 datasets, there was no significant difference in herd distribution by county P = 0.58; Fig. 2). Further, compared with the reference population, the herd distribution in the random field sample did not differ significantly, either by province (P = 0.90) or enterprise type (P = 0.66; Table 2). Nonetheless, using GIS methods, there is some evidence of clustering, both in the kernel plots (Fig. 4) and nearest neighbor analysis (Table 3). Although caution is needed, it is likely that disease prevalence in the random field database is a reliable estimate of disease prevalence in the reference population. Note that the field sample includes a relatively small number of herds, particularly within defined strata. Based on this posthoc assessment, one can conclude that the results from the random field sample would provide an externally valid, albeit relatively imprecise, estimate of national disease prevalence, of disease prevalence in 3 of the 4 provinces (all but Ulster, in the north and northwest, where sample size was small), and in beef and dairy herds.
This paper examines a range of GIS and non-GIS methods to assess the external validity of field samples. Both methods, but particularly the GIS methods, require some background information about the reference population. The non-GIS methods are well-suited to situations where data about the reference population are limited. Nonetheless, summary information (for example, the percentage of herds by geographic area) is needed. Using these methods, herd distribution in the field sample(s) and reference population can be compared over a range of strata; in this example, by province, county, and enterprise type. Using the GIS methods, much greater detail about the reference population is required. These methods are appropriate within an Irish context, where geo-referenced data are available about all cattle farms within the country; in other countries, such extensive and accurate information may not be available. In the current study, the GIS methods provided a relatively simple and readily interpretable means to assess the spatial distribution of the field samples and the reference population. Both visual (kernel density plots) and statistical (nearest neighbor analysis) methods are available to assist in these assessments.