
Abstract
Objective
Attention-deficit hyperactivity disorder (ADHD) medication prescriptions in Australia have grown sharply in recent years. We examined the association between online interest in ADHD and prescriptions.
Methods
Monthly Pharmaceutical Benefits Scheme (PBS) and Repatriation PBS (RPBS) Item Reports of ADHD prescriptions and Australian ADHD-related Google Trends (GT) data (2004–2023) were sourced. We modelled the lagged effect of GT on ADHD medication prescriptions, using an autoregressive moving average model with autoregressive conditional heteroskedasticity, adjusting for COVID-19 lockdown effects. Results were compared to a model of GT for pain-related searches and PBS/RPBS opioid prescriptions, and counterfactual alternatives: (1) ADHD-related GT and opioid prescriptions and (2) pain-related GT and ADHD prescriptions. We descriptively analysed additional ADHD-related online news data.
Results
Annual prescriptions doubled from 1,424,904 in 2020 to 3,112,072 in 2023. ADHD medication prescriptions and ADHD-related GT considerably increased since the COVID-19 pandemic. GT had a statistically significant positive lagged association with ADHD prescriptions. Comparator models did not show statistically significant associations between GT and prescriptions. Online news data supported recently increased public interest in ADHD.
Conclusions
ADHD-related online interest predicts increased ADHD prescriptions, which was accentuated during the pandemic. Studies are needed to evaluate causal pathways, health information quality and sociodemographic determinants.
Keywords
Attention-deficit hyperactivity disorder (ADHD) is a neurodevelopmental condition that occurs in approximately 6%–10% of Australian children and adolescents and 2%–6% of adults. 1 There has been a rapid recent growth of ADHD medication prescriptions in Australia. 2 Stimulant treatment more than doubled between 2018 and 2022. 3 A multinational study of ADHD medication sales data from 2015 to 2019 found annualised increases in ADHD medication consumption by 9.7%. 4 Notably, the upsurge only occurred within high-income countries. 4
It is important to understand potential contributing factors to increased prescribing. With better recognition of ADHD comes the corollary risk of over-diagnosis and over-treatment. 5 Broadening ADHD diagnostic criteria, including the relaxation of adult ADHD criteria from DSM-IV to DSM-5 in 2013 may be influential, 5 but heightened public awareness may also have contributed to increased demands for assessment and treatment, leading to more prescriptions.
Public awareness of ADHD is therefore a potential factor for rising ADHD medication prescriptions. The Internet is a popular source of health information for the lay public. 6 Online ADHD information-seeking can be a proxy for measuring public interest and awareness. A time-series analysis of Google Trends (GT) data for ADHD-related keywords found increased searches coinciding with public health campaigns and celebrity and pharmaceutical events. 7 Using the Internet to search for health information may change health behaviours 8 and translate into more medical consultations about ADHD, more access to illicit supply of stimulants, increased misinformation about diagnosis and artificial broadening of diagnostic criteria, for example, the popular notion that ‘hyperfocusing’ comprises an integral part of ADHD. This development can potentially overload existing clinical services with unnecessary referrals. 9
There was a global acceleration in ADHD symptoms 10 and medication prescriptions 11 during COVID-19. Pandemic lockdowns have led to increased Internet use among Australians. 12 A recent study in the United States found a strong association between GT searches for ADHD medications and prescription rates from the Medical Expenditure Panel Survey (MEPS), with a notable rise during COVID-19. 13 There have been no Australian studies of Internet search activity as a predictor of rising ADHD medication prescriptions.
This study aimed to (1) describe the Australian trend of ADHD medication prescriptions before and after COVID-19; (2) describe the Australian trend of online ADHD search interest and (3) examine the association between online interest in ADHD and ADHD medication prescriptions. We hypothesised that an increase in monthly GT scores would be associated with increased ADHD medication prescriptions the following month. The severity of pandemic lockdowns was a potential confounder and additional factor. For further validation, we performed additional analyses using pain-related GT data and opioid prescriptions as a comparator set. Opioids were chosen as the comparator drugs as both ADHD medications and opioids have a similar emphasis on regulatory oversight and drug misuse concerns.
Methods
Data sources
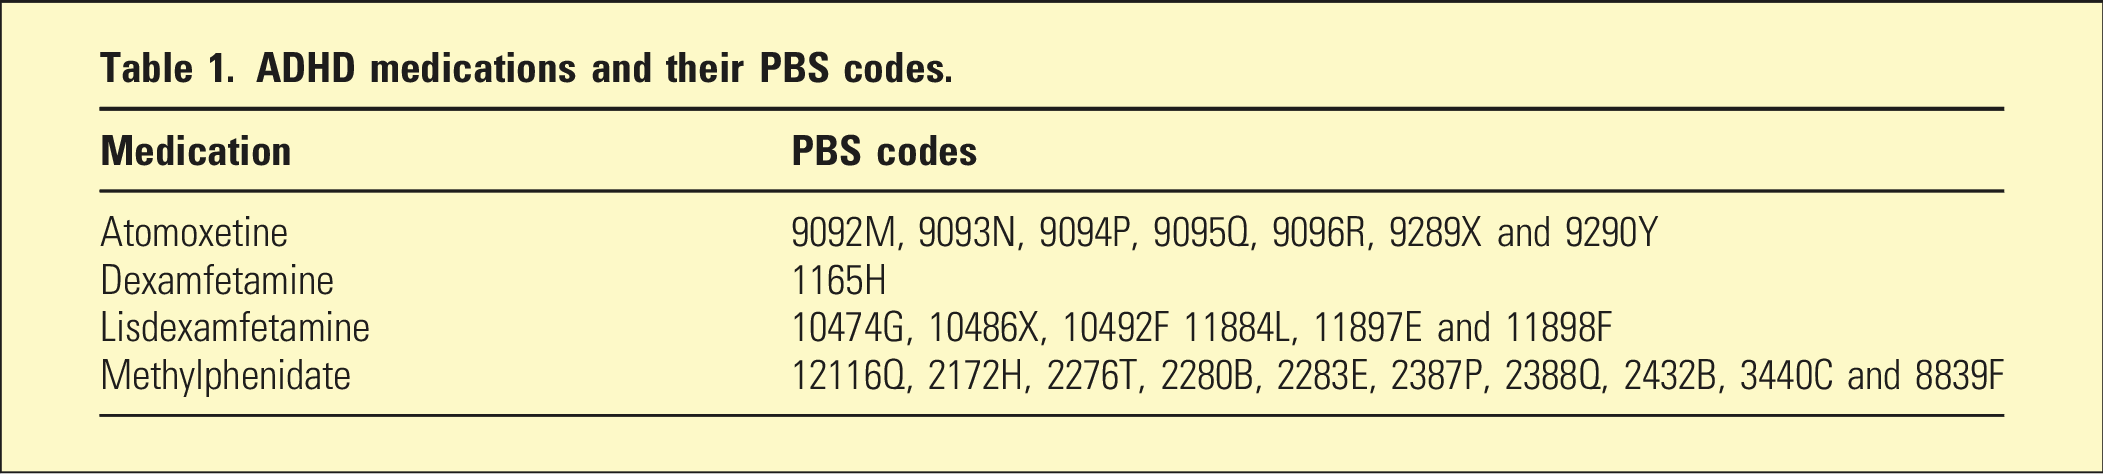
ADHD medication prescriptions
ADHD medications and their PBS codes.
ADHD-related online searches
We obtained monthly GT data for Australia (January 2004–December 2023) for ADHD-related online searches using the following keywords: ‘ADHD’, ‘ADHD treatment’, ‘ADHD medication’ and ‘ADHD therapy’. 7 The data showed how often the terms were looked up on Google, with the location limited to Australia. The normalised data (0–100) indicated the relative search interest of the topic, with 0 and 100 representing the lowest and highest points of all-time interest in the search terms, respectively.
Lockdown severity
The Stringency Index (SI) from 1 January 2020 to 31 December 2022 had nine metrics (school closures, workplace closures, public event cancellations, public gathering restrictions, public transport closures, stay-at-home requirements, public information campaigns, internal movement restrictions and international travel controls). It ranged from 0 (no measures taken) to 100 (strictest measures for all nine metrics). 14 The daily SI data for Australia (weighted for the vaccinated population) were converted to monthly average values.
Additionally, we searched for English-language news and publications in Australia (January 2004–December 2023) using the same ADHD-related keywords in Factiva, a database with diverse online information sources including newspapers, magazines, websites and industry publications. The search produced a yearly report of relevant document counts and allowed us to compare the trends of ADHD-related news content with ADHD-related GT data.
Data analysis
The analysis was performed in Stata 18 (StataCorp LLC, College Station, TX). We first investigated descriptive statistics and time-series plots of ADHD medication prescriptions and the ADHD-related GT time series.
To explore our primary study hypothesis, we used an autoregressive moving average model with exogenous (predictor) variable (ARMAX) to model ADHD medication prescriptions as a function of its past values and disturbances and the GT score of the previous month when adjusted for SI. Each data series was firstly filtered by a stationary-inducing transformation by log-differencing so that they were in growth rates and then seasonally differenced in the ARMAX model. Visual inspection of time-series plots indicated time-varying volatility in the percentage changes in ADHD medication prescriptions. Therefore, we tested for autoregressive conditional heteroskedasticity (ARCH) using a regression model. The Lagrange Multiplier (LM) test result was statistically significant, indicating strong statistical evidence favouring an ARCH process. An ARCH model was therefore considered to model the conditional volatility model. 15 We used the Akaike information criterion (AIC) to select the number of lags of the autoregressive and moving average components of the ARMA process for our regression model. An ARMA(3, 4) model was chosen. We examined the partial autocorrelations of the squared residuals of the ARMA model and identified one lag for the autoregressive specification for the ARCH model. After fitting the ARMAX-ARCH model, we further fitted a generalised ARCH (GARCH) model to include lagged values of the conditional variance in the model with a GARCH(1,1) specification. 16 We compared the information criteria (AIC and Bayesian information criterion, BIC) and forecasted error variance of the ARMAX-ARCH and ARMAX-GARCH models. We selected the ARMAX-GARCH model which performed better than the ARMAX-ARCH model (see Supplemental Material: Stata commands and results).
We performed additional analysis using GT data for pain-related searches and PBS/RPBS opioid prescription data as the comparator set (see Supplementary Materials: PBS/RPBS opioid items and GT pain-related search terms and Supplemental Figure 1 for additional information on these datasets). Figure 1 shows the other three relationships (Numbers 2, 3 and 4) besides the main model (Number 1) that were examined. The identical ARMAX-GARCH approach was used. For relationship 4, we also tested for ARCH given the borderline p-value (p = .0592) from the LM test for this model, to enable appraisal of any possible discrepancy. For all statistical tests, the significance level was set at alpha 0.05. Cross-comparisons of the relationships between online search activities and prescriptions. 1: ADHD-related search activities and ADHD medication prescriptions. 2: ADHD-related search activities and opioid prescriptions. 3: Pain-related search activities and ADHD medication prescriptions. 4: Pain-related search activities and opioid prescriptions.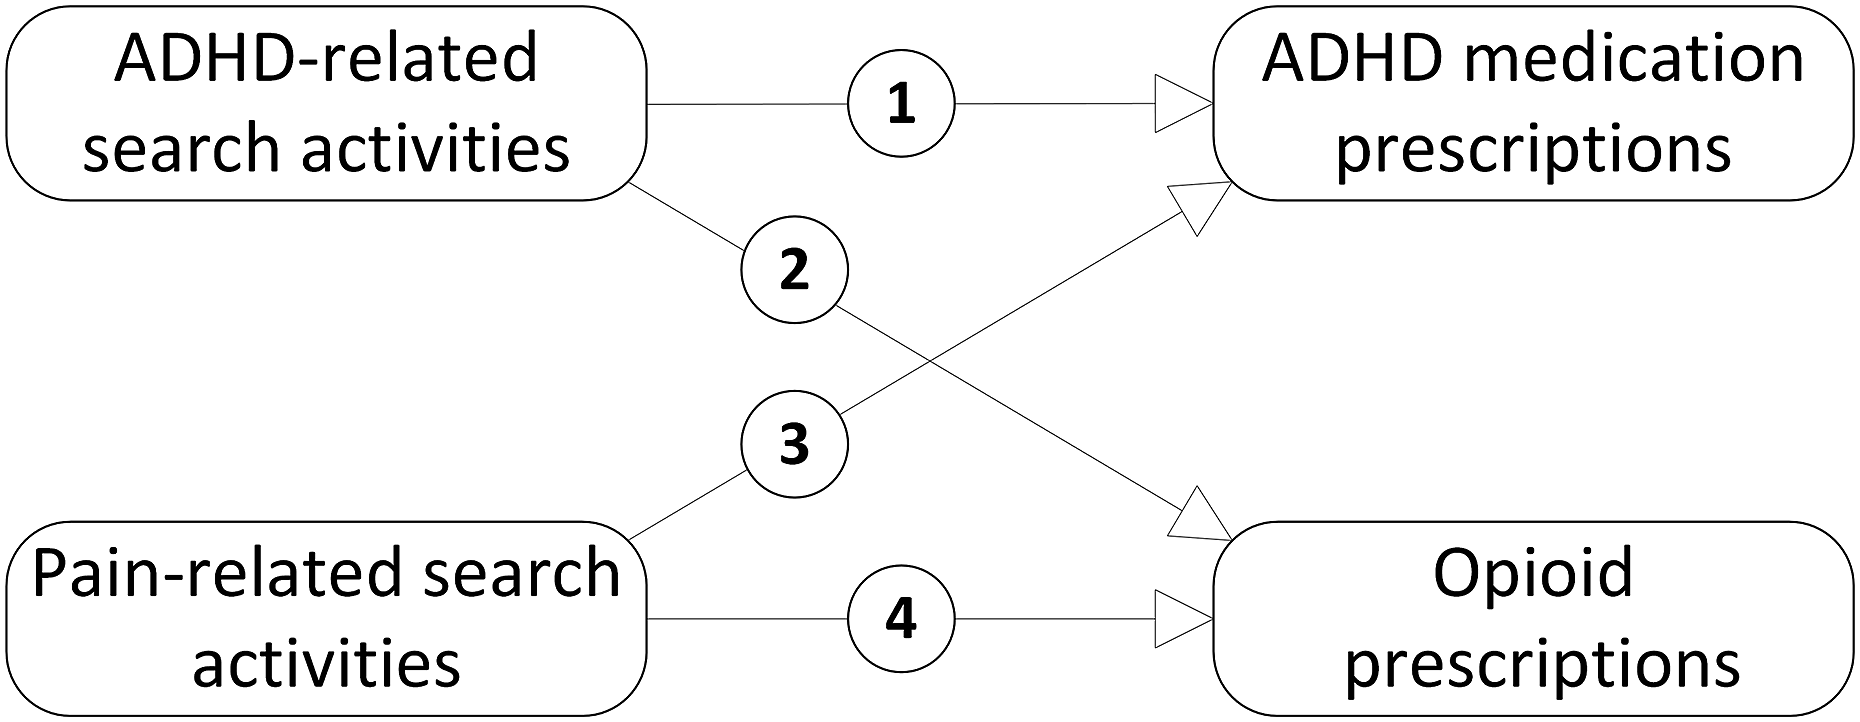
Finally, we descriptively examined the ADHD-related news item search findings to complement our main results using Factiva search data.
Ethical approval was not required for this study because the Pharmaceutical Benefits Schedule data used in the analysis were approved for public availability through Services Australia in an aggregate, deidentified format by the Australian Government.
Results
Descriptive
Total ADHD medication prescriptions during the study period were 18,695,308, with median monthly prescriptions of 55,259 (IQR: 36,654, 100,055). The lowest prescription count was in February 2005 (16,770), while the highest was 326,741, in December 2023. The lowest GT score (4) occurred in December 2004; the highest score (100) occurred in March 2023. The median score was 13.0 (IQR: 11.0, 22.0).
Stimulant prescriptions showed steady growth between 2004 and 2020 with an accelerated increase from 2020 onward (Figure 2). Annual prescriptions more than doubled from 1,424,904 in 2020 to 3,112,072 in 2023. The variance in monthly prescriptions changed over time, with greater volatility around 2015. The ADHD-related GT scores were stable at low levels until 2015. Subsequently, the scores began to rise with a large surge starting in 2020 and peaking in late 2023. Seasonality was present for GT, with peak activity in May for most years. Time series plots of ADHD medication prescriptions and GT data for ADHD (right-side y-axis) from January 2004 to December 2023.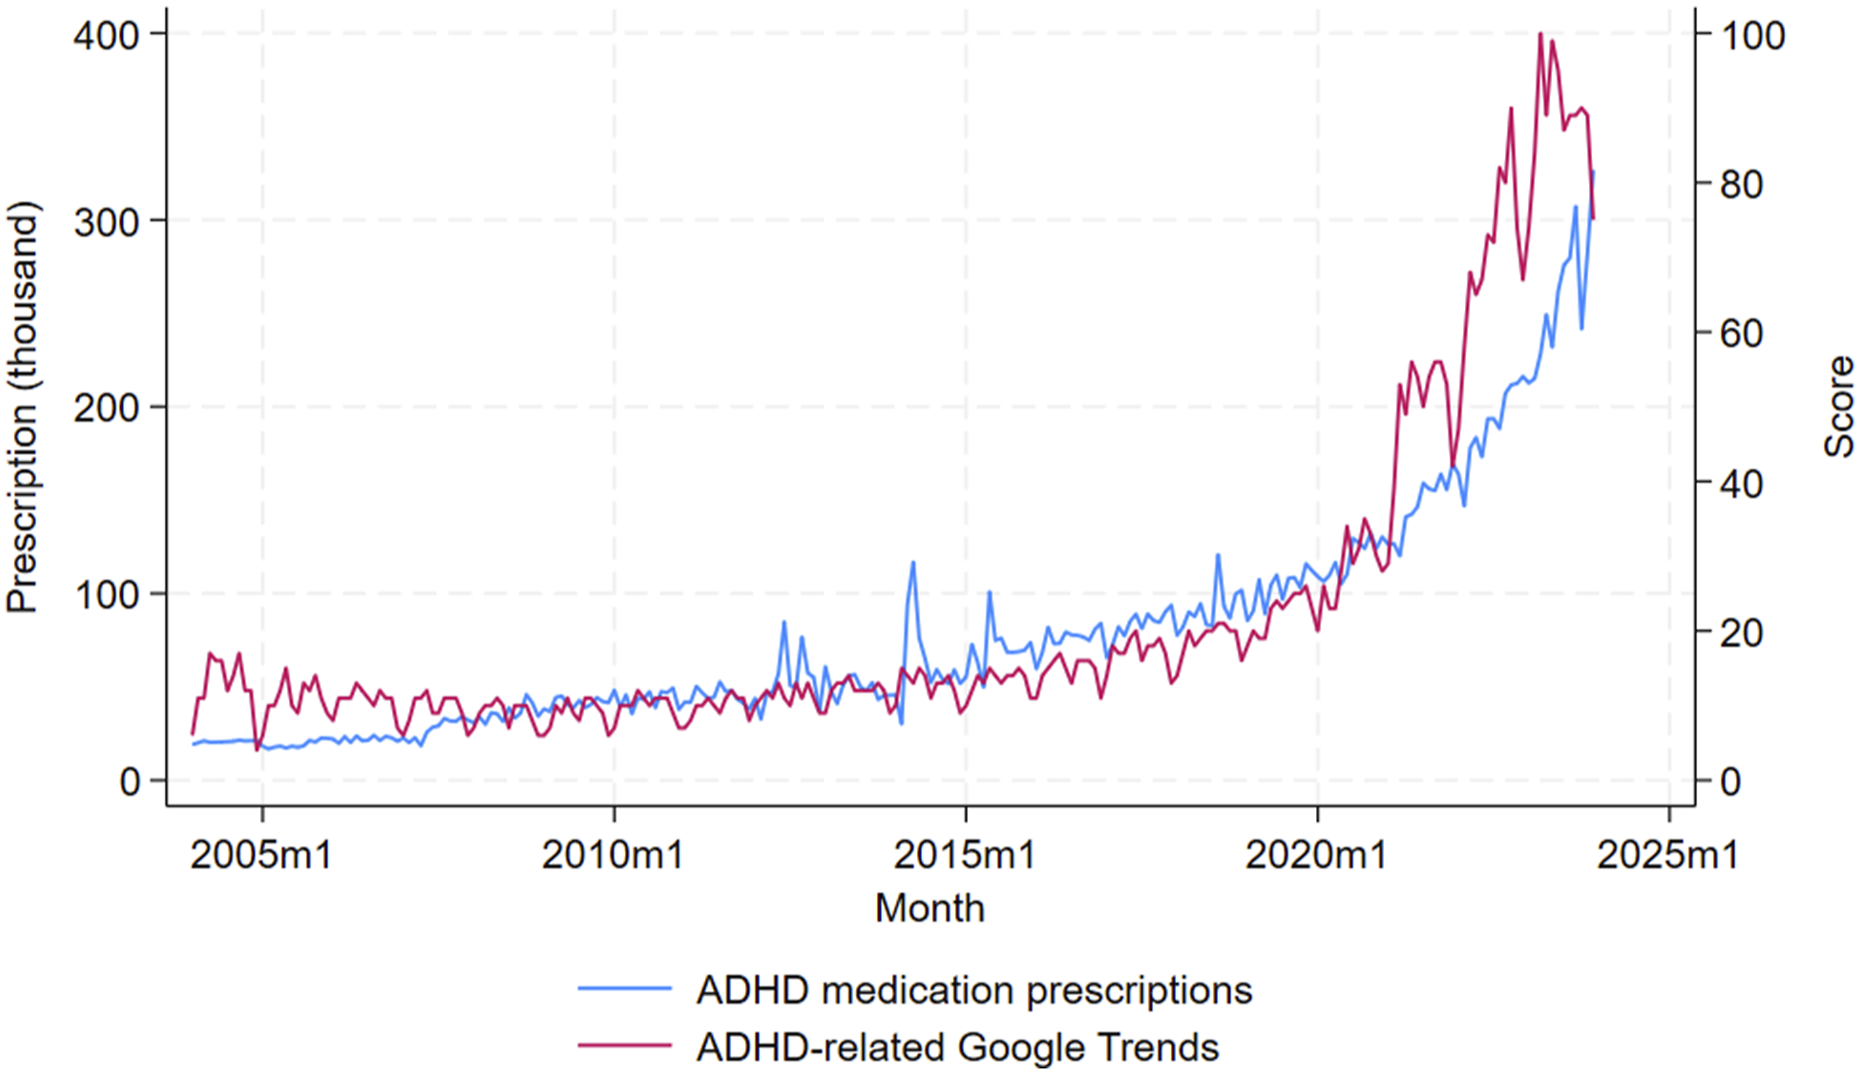
ARMAX-GARCH regression model
In the main ARMAX-GARCH model, the percentage change in monthly ADHD medication prescriptions was significantly associated with the percentage change in lagged ADHD-related GT score. One percentage increase in lagged ADHD-related GT score was associated with a 0.185 percentage increase in monthly ADHD medication prescriptions (95% CI: 0.087–0.283). SI was not a statistically significant factor.
All three other models involving pain-related search activities and/or opioid prescriptions did not show a statistically significant relationship between GT and related prescriptions. There was no difference between ARMAX models with or without the GARCH process for relationship 4.
Additional Factiva data
The comparison between ADHD-related Google Trends and ADHD-related Factiva search result counts indicated similar trends (Figure 3). ADHD-related news coverage and online publication content from Australian sources showed a gradual upward change from 2004 (383 items) to 2020 (675 items), except for a sudden spike to 943 items in 2019. Subsequently, the annual counts rapidly increased from 2021 (956 items) to 2023 (1680 items), mirroring the rise in ADHD-related Google Trends during the same period and reflecting an increase in online media interest in ADHD. Time series plots of ADHD-related GT and ADHD-related Factiva search results (right-side y-axis) from January 2004 to December 2023.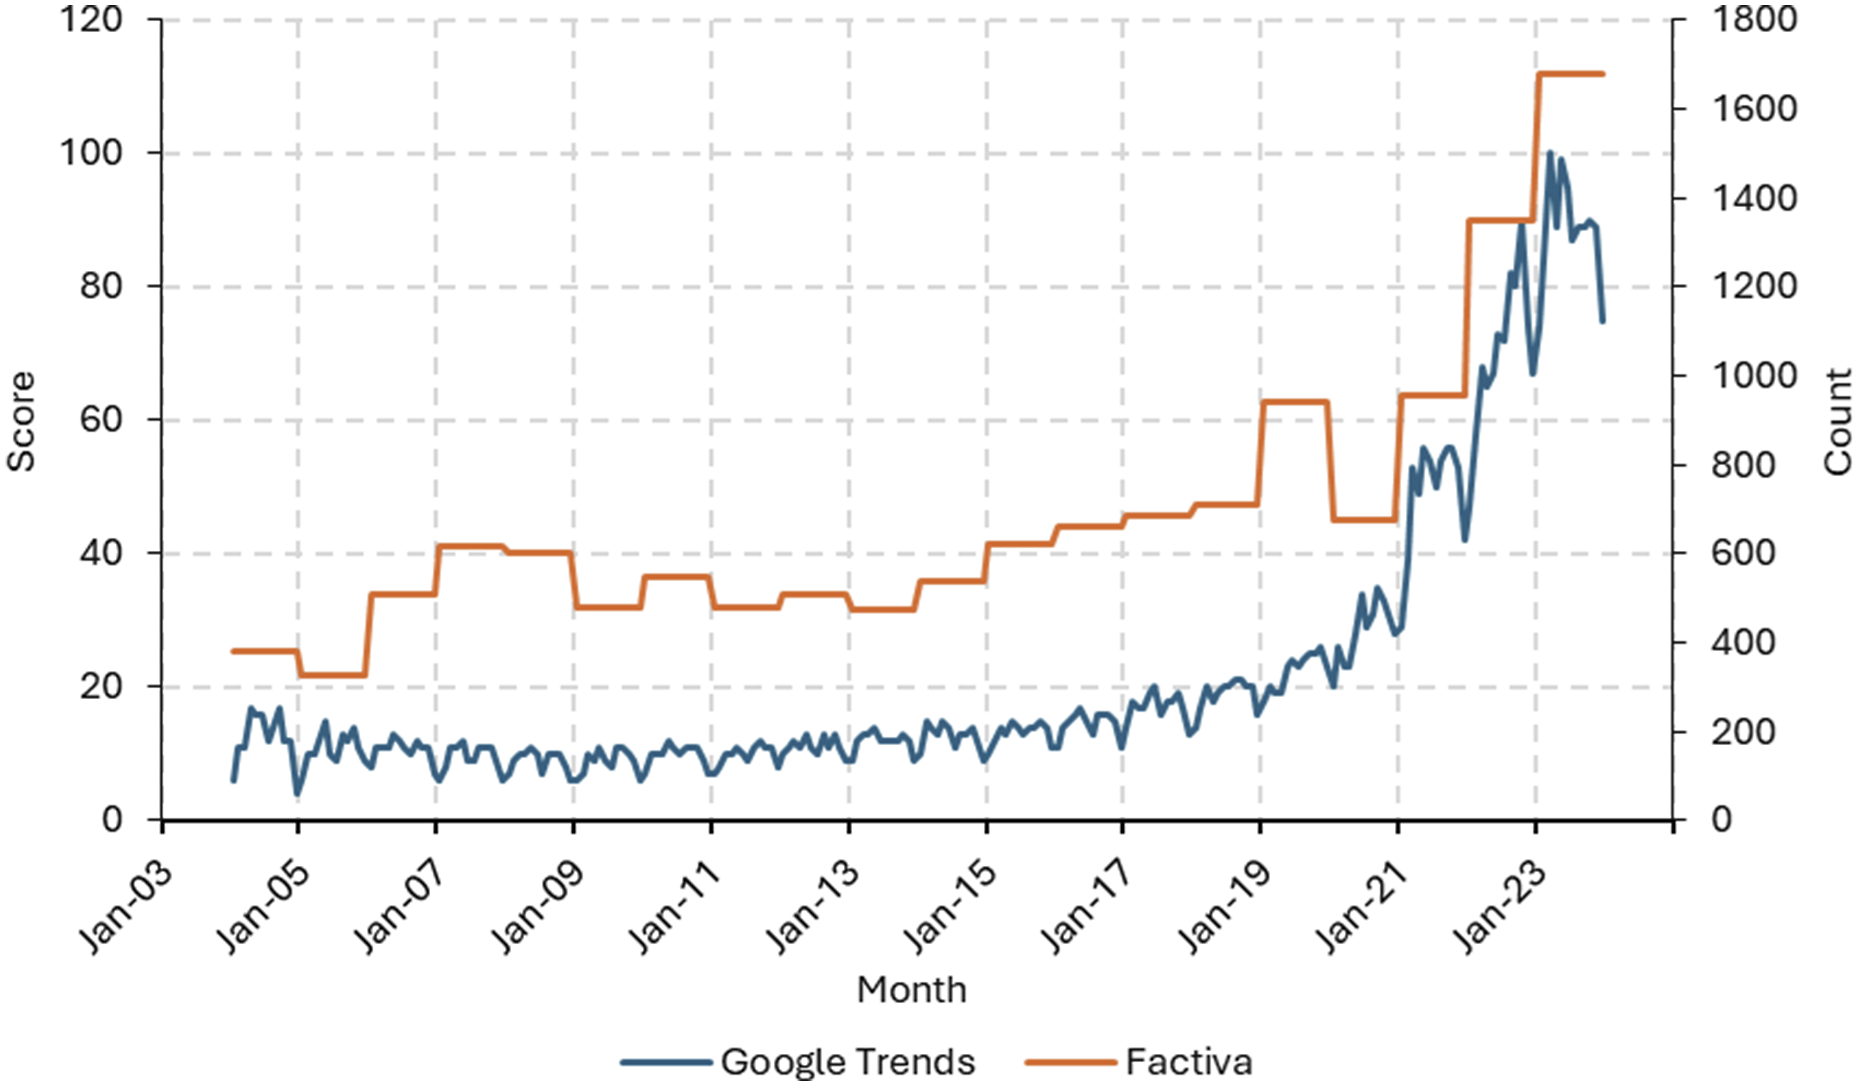
Discussion
In Australia, it is estimated that at least 800,000 individuals are living with ADHD. This condition has considerable negative impacts on academic and occupational functioning and family, social and intimate relationships. 1 In the present study, we found a positive association between online search interest in ADHD and ADHD medication prescriptions in Australia, with both showing accelerating growth coinciding with the COVID-19 pandemic. ADHD was also surging in popularity in online publications and news items. The findings for ADHD contrast with the lack of association between pain-related online search interest and opioid prescriptions. Better regulatory control and professional actions and restricted advertising to patients could have tempered the patterns of opioid prescriptions in Australia. 17
The dramatic increase in ADHD medication prescriptions occurred as more people were diagnosed and treated for ADHD. The AIHW reported that the number of patients per 1000 population on stimulant treatment grew nearly fourfold from 5 in 2013-14 to 18 in 2022-23. 18 It may be speculated that the higher treatment rates indicate broader recognition of ADHD in populations such as women and older/middle-aged adults. 19 The prevalence of persistent adult ADHD (with both a childhood onset and adult symptoms) and symptomatic adult ADHD (regardless of a childhood onset) was 2.6% and 6.8%, respectively. 20 Seen in this light, the prescription rates have come closer to ADHD’s expected prevalence in adults.
Yet, there is also evidence of increased ADHD diagnoses without an actual rise in symptomatology in the population. In a secondary analysis of the Longitudinal Study of Australian Children, ADHD diagnoses increased from 4.6% in the 1999/2000 birth cohort to 5.6% in the 2003/2004 birth cohort 2 despite similar hyperactive/inattentive behaviour scores. 21 Thus, over-diagnosis is still a legitimate concern, depending on how diagnostic criteria are formulated and applied in clinical practice. 5 Notably, there was a lag period of around six to seven years from the relaxation of the DSM ADHD diagnostic criteria to the upsurge in ADHD medication prescriptions in 2020. This may suggest that the DSM changes ‘primed’ the explosion of ADHD assessments and stimulant prescriptions in developed countries when COVID-19 emerged.
COVID-19 pandemic lockdown measures resulted in isolation, disruptions in daily routines and the shift to remote working and learning. These changes were possibly associated with worsening symptoms among people with ADHD, 22 which might increase the demand for medications. There may have been symptom exacerbations and increased symptom recognition among previously undiagnosed individuals with ADHD, leading to more medical consultations and treatment. Social media consumption increased during COVID-19 lockdowns. 23 Social media as a popular source of health information carries the risk of mental health misinformation. TikTok videos on ADHD, for instance, often contain inaccurate portrayals and might promote pathologising normal life experiences or misattributing symptoms of other disorders to ADHD. 24 Media-driven preoccupation with ADHD symptoms, as demonstrated by the similarly rising trend of online news items and publications on ADHD-related topics in the Factiva data, might also lead to more medical consultations and over-diagnosis.
Another factor could be the widened availability of telehealth services. In Australia, telehealth items in the Medicare Benefits Schedule (MBS), including items for psychiatric consultations, have been considerably expanded and made available nationwide. 25 In a separate analysis, we found that these policy changes were associated with a sharp rise in initial psychiatric assessments via telehealth. 26 It is pertinent to ask if the emergence of dedicated telehealth ADHD clinics, with specific business models that impose potentially substantial out-of-pocket financial burdens on patients, has led to increased ADHD diagnosis and treatment. In a climate of high online ADHD awareness, greater help-seeking and burgeoning telehealth services, there could be social and clinical pressure on clinicians to diagnose and prescribe, which might at least partly increase the risk of over-diagnosis as prescriptions rise.
Fundamentally, both the rise in ADHD symptoms and public interest in ADHD could reflect the growing problem of inattention in society. The perception that attention span is decreasing is probably not just a subjective notion, as research suggests a global decline in attention span over the recent decades. 27 Information technology (IT) profoundly alters how people disseminate and consume information. Exposure in the early formative years could especially cause changes in cognitive control and information processing, 28 predisposing to greater inattention-related symptoms. The cognitive effects of IT use and their causal relationships with ADHD, including individual and contextual factors, warrant further research.
While acknowledging the development of increased recognition and treatment for ADHD, exponential growth in ADHD medication prescriptions in association with surging public interest might have risks. Globally, the prevalence of stimulant misuse has increased in tandem with rising stimulant prescriptions. 29 Given that functional impairment in adult ADHD may be less compared with childhood ADHD, there must be careful consideration of the risk-benefit ratio of pharmacotherapy. 1 Furthermore, popular once-off assessments for ADHD (including telepsychiatry consultations) may overlook comorbidities and exacerbate health inequity. 30 Globally, the much larger and rapidly growing markets for ADHD medications in high-income countries like Australia may direct pharmaceutical companies’ interest away from low- and middle-income countries, 4 exacerbating access equity and supply issues inherent to the low-volume, high-price pharmaceutical business model frequently practised in these regions. 31
This study had several limitations. Given the aggregated nature of our data, we could not directly link online search activities to ADHD medication prescriptions at the individual level to demonstrate a possible causal relationship. Additionally, we could not identify the specific sociodemographic factors of this association. The ADHD-related GT data likely did not entirely represent the online public interest in ADHD and its treatment. We did not include data from social media, which have seen rising popularity as health information sources. 23 However, the similarity between Factiva and GT trends supports the validity of the GT data. The online news/publications data only included English-language sources as Australia is predominantly English-speaking. We must cautiously stress that our analysis suggests online ADHD search interest could forecast ADHD medication prescriptions rather than cause the prescriptions.
Conclusions
Our study provides preliminary evidence that the recent substantive growth in ADHD medication prescriptions in Australia coincident with the COVID-19 pandemic may be correlated to rapidly rising online interest among the public. More refined analysis is required to establish whether this relationship is causal. If more frequent (monthly) news item data becomes available, future research may investigate whether news items on ADHD lead to more Google searches that result in more prescriptions, using structured models. Differential gender effects are another potential area of research. Future studies could investigate relationships between rising levels of inattention in the population, the success of mental health promotion and improved health access addressing previously unmet mental health needs.
Supplemental Material
Supplemental Material - Online interest in ADHD predicts ADHD medication prescriptions in Australia from 2004 to 2023: A time-series analysis revealing COVID-19-related acceleration
Supplemental Material for Online interest in ADHD predicts ADHD medication prescriptions in Australia from 2004 to 2023: A time-series analysis revealing COVID-19-related acceleration by Luke Sy-Cherng Woon, David Smith, Stephen Alllison, Jeffrey CL Looi and Tarun Bastiampillai in Australasian Psychiatry.
Footnotes
Acknowledgements
We thank Services Australia which provides public access to the Pharmaceutical Benefits Schedule Item Reports.
Disclosure
The author(s) declared no potential conflicts of interest with respect to the research, authorship, and/or publication of this article.
Funding
The author(s) received no financial support for the research, authorship, and/or publication of this article.
Ethical statement
Supplemental Material
Supplemental material for this article is available online.
References
Supplementary Material
Please find the following supplemental material available below.
For Open Access articles published under a Creative Commons License, all supplemental material carries the same license as the article it is associated with.
For non-Open Access articles published, all supplemental material carries a non-exclusive license, and permission requests for re-use of supplemental material or any part of supplemental material shall be sent directly to the copyright owner as specified in the copyright notice associated with the article.