
Abstract
While interest in career optimism has grown steadily in the last 15 years, most of its investigations rely on cross-sectional convenience samples that prevent exploring how earlier optimism matters for later educational and vocational outcomes. To address this issue, I use structural equation modelling to assess measurement invariance and the impact of career optimism at ages 20, 23 and 26 in a nationally representative sample of 2900 young Australians. A three-item measure of career optimism shows metric but not scalar invariance across young adulthood, meaning that while optimism's components remain the same, their levels fluctuate. Optimism helps young adults enrol in a university and enter professional employment by age 26. However, the positive impact of career optimism partly reflects the variation in youths’ socioeconomic backgrounds. Thus, future studies of career optimism should consider if some individuals tend to be more optimistic because they grew up in environments with more cultural and economic capital.
Keywords
Career optimism, conceptualised as a tendency to see one's vocational prospects positively, has evoked a growing interest for the last 15 years, with scholars perceiving optimism as a trait that engenders a wide range of desirable outcomes. The onset of the COVID-19 pandemic intensified the focus on factors that enhance resilience and a positive career outlook among youth on the brink of post-compulsory education.
However, research in this area draws on theoretical perspectives that contain few predictions about the extent to which optimists and pessimists end up in dissimilar educational pathways and occupations (Eva et al., 2020). This issue merits attention as career optimism may reflect more than an individual tendency to expect the best possible career outcome. Its understanding may benefit from incorporating sociological insights into the operation of contextual variables over an individual life course.
Moreover, while the traditional conceptualisation of career optimism assumes it is a stable trait, this conjecture often goes untested. In longitudinal work, researchers focus on changes in the levels of optimism without checking for the possibility that, within individuals, optimism comprises changing components at different points in time. Finally, the many existing studies on data from university students cannot assess the impact of career optimism on outcomes that do not vary between students, for example, on chances of university entry. The current paper accounts for these three issues and recommends further developments in future research.
Prior research on career optimism
Theoretically, specialised research in this area has drawn primarily on psychological theories of career orientations, with most studies reliant on Rottinghaus’ (2005) conception of optimism as “a disposition to expect the best possible outcome or to emphasise the most positive aspects of one's future career development, and comfort in performing career planning tasks” (p. 11). This approach extends Super and Knasel's concept of career adaptability (1981) and construes career optimism as a manifestation of a healthy personality (Hirschi, 2012, p. 4).
As outlined below, a recent literature review on career optimism up to 2017 (Eva et al., 2020) compared various theoretical frameworks prevalent in most studies, noting insufficient exploration of socioeconomic status, ethnicity, migration status and gender. It advocated for theories capable of incorporating these factors. The review further underscored significant sample and temporal scope limitations affecting many prior cross-sectional studies. It pinpointed numerous design flaws, some tackled in the current analysis.
Career optimism, in the context of survey research, is most frequently operationalised as a component of the Career Futures Inventory, comprising 25 items. There, it is juxtaposed with two other subscales, that is, career adaptability, which is the capacity to deal with unexpected events that may alter career plans or trajectory and to construe such events as an opportunity to benefit (Rottinghaus et al., 2005). The other subscale, “knowledge,” is the perceived knowledge of the job market. The initial career optimism subscale introduced in 2005 involved up to 11 indicators, with Cronbach’s alpha of .87, and captured positive attitudes to the ability to set career goals and the prospects of achieving them. This three-pronged approach, where career optimism is closely related to career adaptability, knowledge and social and psychological resources (Hirschi, 2012), has dominated empirical studies in this field for the last 20 years. The initial 11 indicators allowed for reports of excitement, inspiration and eagerness rather than frustration or difficulties in setting career goals. Later, a revised career optimism scale comprised only four items measuring a negative career outlook, juxtaposed with four other subscales containing 24 other measures (Rottinghaus et al., 2012). Thus, over time, some researchers opted for fewer higher-quality indicators (Hofer et al., 2021).
Dominant theories
Eva et al. (2020) noted that, between 1998 and 2017, three conceptualisations dominated studies on career optimism. These are the Planned Happenstance Learning Theory (PHLT; Kim et al., 2014), Social Cognitive Career Theory (SCCT; Lent et al., 2002) and Career Construction Theory (CCT; Savickas, 2013). PHLT emphasises that individuals develop career goals and dispositions as a result of unplanned as well as predictable events. The SCCT focuses on the role of self-efficacy in enhancing career optimism but notes that social support and contextual factors are essential for developing positive career expectations. The CCT is interested in the fit between personal and environmental characteristics that can produce optimism toward expected vocational outcomes. All of these approaches point, to various extents, to the possibility that career optimism is a malleable rather than a fixed trait that fluctuates in response to social contextual factors, for instance, social support. However, all these approaches stop short of recognising that social support might depend considerably on individual access to social, economic and cultural capital. For instance, as Eva et al. (2020) point out, opportunities to experience career-enhancing chance events, to receive support from others, and to achieve a good fit between individuals and career goals might differ between cultural and economic elites and everybody else. Thus, omitting cultural and economic contexts in consideration of optimism may undermine its understanding and sustainability.
Social, economic and cultural capital—missing contextual factors
Social reproduction theory provides the most comprehensive definition of social, economic and cultural capital (Bourdieu, 1986; Saha, 2021). Economic capital involves financial resources, which comprise income, wealth and inheritance. Social capital is a web of networks individuals can rely on to derive benefits. Cultural capital is the knowledge that can be objectified in valued possessions, for example, books, works of art, or technological devices. It can be institutionalised through educational credentials and embodied in stable dispositions formed through socialisation within the family environment. Such disposition may involve lasting preferences for specific educational careers and valuing the pursuit of particular academic credentials and jobs, for example, in the professions or trades. Most people recognise the value attributed to privileged cultural capital within a culture, yet such capital facilitates more success only for those with its higher stocks. Capital enhances self-efficacy and creates opportunities for giving and receiving more effective mentoring, training and vocational development.
Teenagers’ inclination to work in an occupation similar to their parents has been linked to the social reproduction of cultural capital (Sikora & Pokropek, 2012). Likewise, at least one study noted that parental support enhanced career optimism among university students (Garcia et al., 2015). Social reproduction theory stresses that parents who have completed university degrees and pursued related careers know how to mentor their adult children more effectively than parents without such experiences.
Limitations of prior career optimism studies
Some literature proposes conceptualising optimism as a malleable state rather than a fixed trait. Nevertheless, among the 31 studies Eva et al. (2020) reviewed, most were cross-sectional and limited to convenience samples involving undergraduate students. Such designs prevent the investigation of temporal stability in career optimism. They make it impossible to compare university students to those who never attended university. Furthermore, they limit the potential to explore social milieu factors that enhance career optimism, including its educational antecedents and outcomes.
Similar design limitations transpire in the complementary examination of 29 subsequent peer-reviewed articles published on career optimism between 2018 and mid-2022 listed in Elsevier’s Scopus database (Table 1). Career optimism has become a concept of interest across diverse fields, including higher and vocational education studies, teacher education, public health, hospitality, sport, or business management. Nevertheless, nearly all research in Table 1 is cross-sectional or accounts for brief periods, no longer than a few days or months (except for two datasets that covered 3 years). The range of contextual sociodemographic and economic factors considered in these studies is restricted to collecting respondents’ sex and age. Apart from social and cultural capital, Eva et al. (2020) noted that sociodemographic variables such as ethnicity, race or sex affect career optimism in the direction stipulated by the discrimination literature. For instance, majority groups, such as Caucasians, tend to be more optimistic than minorities (Hennessey et al., 2008). Most studies are with undergraduate university students, comprising convenience samples ranging from 100 to 300 participants (Table 1). One potential reason most studies rely on undergraduates might be the relative ease with which teaching academics can generate the extended Rottinghaus inventory data in one-point-in-time student samples. This benefit, however, comes at the cost of not being able to trace temporal changes in career optimism and specify models in which antecedents precede the hypothesised outcomes in time. One cannot establish how optimism affects subsequent educational or vocational destinations of young people in such designs.
Designs, samples and scale properties in peer-reviewed studies on career optimism published between 2018 and mid-2022.
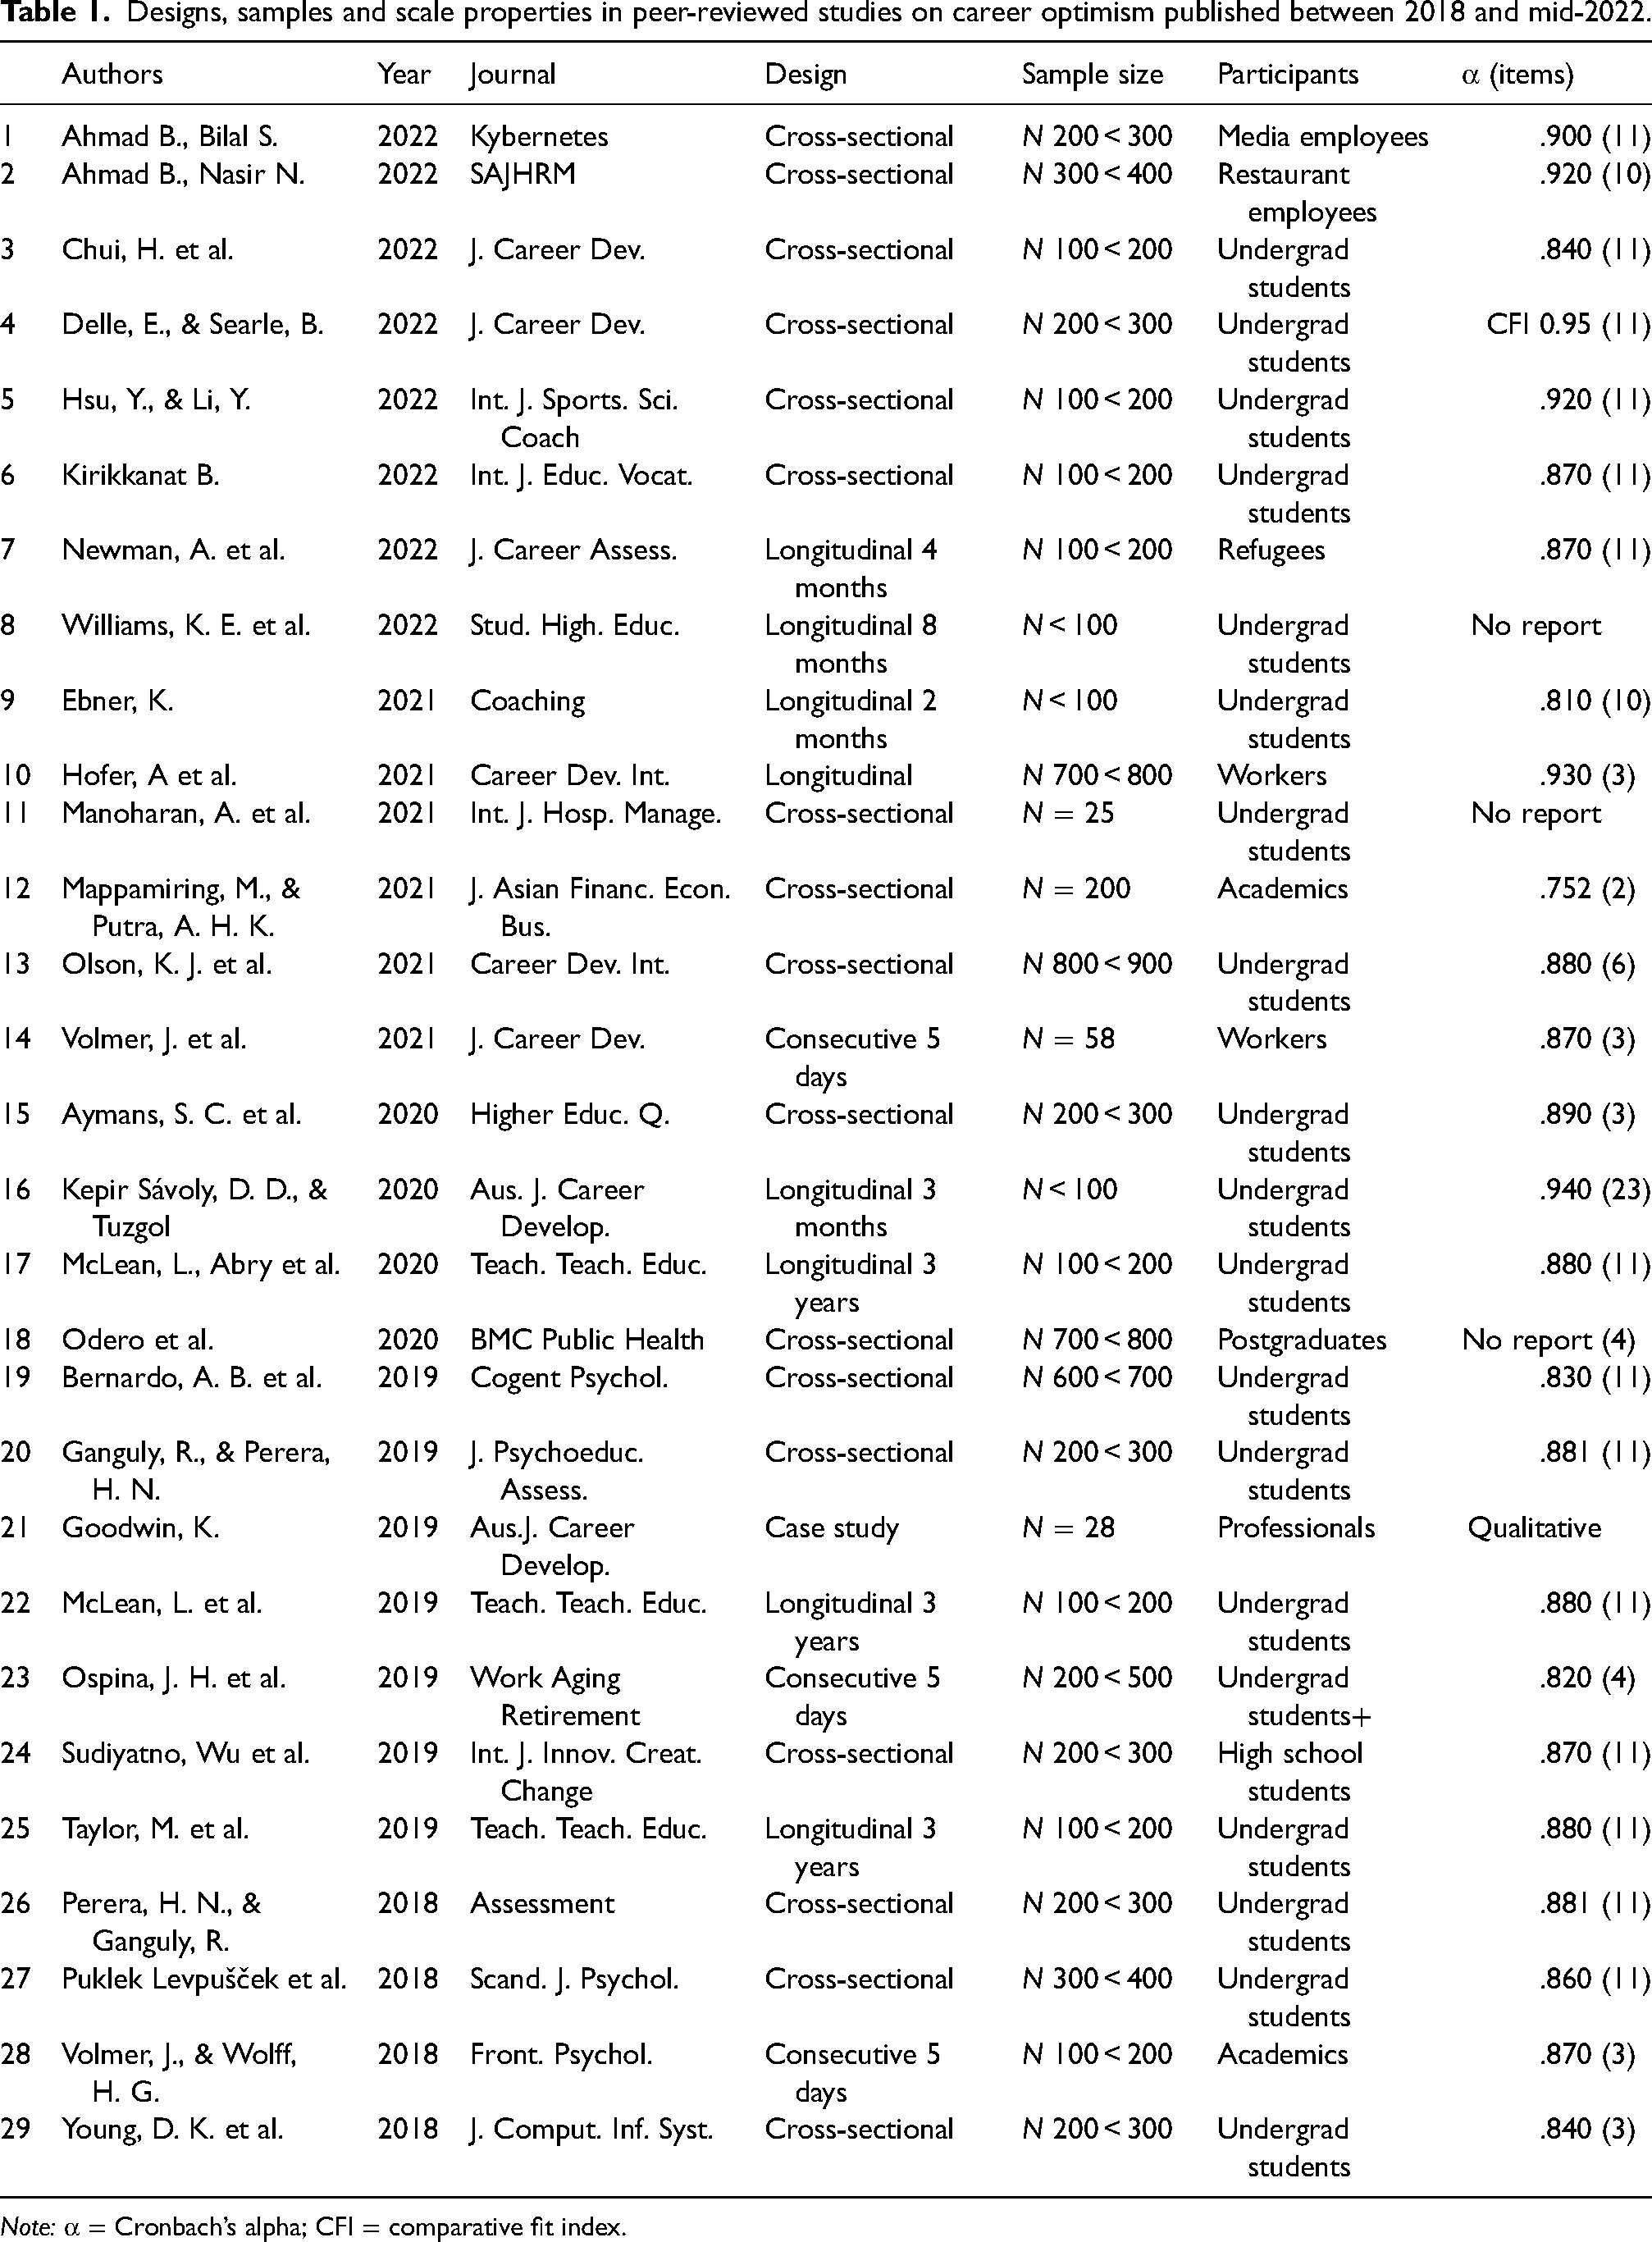
Note: α = Cronbach’s alpha; CFI = comparative fit index.
Thus, the current analysis pursues three objectives: firstly, to assess the temporal measurement invariance of the Career Optimism Scale, as delineated by the initial three hypotheses below; secondly, to evaluate the influence of sociodemographic variables on the optimism scale, as per Hypothesis 4; and thirdly, to ascertain its effect on the likelihood of university admission and professional employment attainment, as proposed by Hypotheses 5 and 6.
Methods
Assessing the above hypotheses requires a large sample with sufficient sociodemographic variables and multi-group structural equation modelling.
Data
The data employed in this study are derived from the Longitudinal Survey of Australian Youth (LSAY), initiated in 2009 with a cohort exceeding 14,000 participants from the Australian Programme for International Student Assessment. The initial nationally representative sample of 15-year-olds in formal education was tracked annually for 12 years to collect data on their educational progress, work experiences and attitudes. The current analysis focuses on data from four survey years: 2009, 2013, 2016 and 2019, which marked the end of the LSAY09 collection. The survey gathered sociodemographic details in 2009. The Australian government—the project’s funder—decided that only three questions assessing career optimism would be asked in 2013, 2016 and 2019, aligning with the respondents’ progression into their early to mid-twenties. Typical of longitudinal studies, attrition reduced the number of participants, leaving 2,900 respondents for this analysis.
Variables
Dependent variables
Although career optimism in LSAY was measured by only three items out of the original 11-item Rottinghaus (2005) inventory, these items represent later conceptualisations (Gunkel et al., 2013; Odero et al., 2020) reliant on the same three-item construct. The respondents were asked in 2013, 2016 and 2019, “On a scale from zero to ten, where zero means strongly disagree and 10 means strongly agree, how much do you agree or disagree with each of these statements when thinking about your career? (1) Thinking about my career inspires me, (2) I am eager to pursue my career dreams and (3) I get excited when I think about my career.”
University study was measured by a variable where the value of 1 indicated that the respondent completed or was enrolled in a university study in the reference year. Participants who dropped out and didn’t intend to continue or have never been to university were coded 0.
Professional employment was coded 1 for participants who worked in occupations falling into “Major Group 1 Managers” or “Major Group 2 Professionals” of the Australian and New Zealand Standard Classification of Occupations (ANZSCO; ABS, 2006). All others who provided information on occupation were denoted by zero.
Independent variables
Besides career optimism, which is conceptualised as a potential predictor of university study and professional employment, other independent variables depict characteristics previously identified as under-researched (Eva et al., 2020). They are (1) economic, social and cultural status, which reflects economic and cultural capital; (2) sex; (3) occupational expectations, which precede the measurement of career optimism in time; (4) immigration status and ethnicity indicated by country of birth; and (5) attendance of a secondary school in metropolitan versus non-metropolitan areas. The OECD’s PISA Index of Educational, Social and Cultural Status is a composite variable incorporating over 26 items related to economic and cultural capital, including its objectified and embodied forms. Several subscales represent family wealth, cultural possessions, home educational resources, parental academic qualifications and occupational status. The overall scale reliability was 0.59 in Australia in 2009, with subscale reliabilities above 0.6 and 0.7 (OECD, 2012: see pages 288 and 312 for details).
Females were coded 1, with all other students coded 0. Youth who attended an urban secondary school in 2009 were also denoted by 1, whereas respondents from provincial and remote schools were coded with 0. Two dummy variables depicted immigration status. First-generation migrants were coded 1 if they were born overseas with both parents also born abroad. Second-generation migrants were coded 1 if they were born in Australia with at least one parent born overseas. These variables and students’ PISA reading test scores are also used in the analysis to partly correct for attrition (Lim, 2011). PISA reading test score is the 2009 plausible value (henceforth Reading score). PISA uses an incomplete balanced matrix design, meaning that students answer only a subset of test questions and other performance values are imputed. Using one rather than five plausible values leads to the same results in samples over 2000 observations (OECD, 2012), so, for simplicity, one reading value 1 was used. The OECD standardised it to a mean of 500 and a standard deviation of 100.
The final independent variable was occupational expectation about 3 years before career optimism was measured. For 2013 career optimism, the occupational expectation from 2009 was used; for career optimism in 2016, it was the expectation in 2013; for career optimism in 2019, it was the occupational expectation in 2016. Occupational expectations were measured verbatim as open-ended questions about a job expected at age 30. Job titles were coded to ANZSCO four-digit occupational codes. Subsequently, they were converted into AUSEI06 occupational status scores. As its authors explain, to generate AUSEI06 “optimal scaling procedures are used, assigning scores to occupations in such a way as to maximise the role of occupation as an intervening variable between education and income. Conceptually, occupations are viewed as the means of converting a person's human capital (education) into material rewards (income). This remains the state-of-the-art approach for the continuous scaling of occupations” (McMillan et al., 2009, p. 125). AUSEI06 is a continuum ranging from 5 to 100, where 100 depicts high-status occupations such as surgeons or psychiatrists while 5 denotes unskilled farm workers, with all other occupations scored in between. McMillan et al. provide the complete list of occupations and their values in Appendix of their publication.
Analytical strategy
Given the goals of this study, the optimal strategy is structural equation modelling estimated with the full information maximum likelihood to retain information from all participants, including those with some missing values (see Example 26 in StataCorp, 2021). Following the multi-group confirmatory factor analysis at three-time points, two structural equation models were estimated. The first predicted university enrolment as a function of career optimism and sociodemographic variables. In the second model, professional employment replaced university study as the dependent variable. Professional work is generally more secure and better paid than other types of work. Hence, it can be perceived as more desirable. Most professional careers and many senior managerial jobs require a university degree at entry, but estimating the (high) probability of securing professional employment due to graduating from university is not of interest here.
This analysis methodically investigates career optimism through a temporal lens, commencing with descriptive statistics to capture the trajectory of optimism over time. Subsequent phases entail three confirmatory factor analyses, segmented by year, to assess the scale’s dimensional stability. Initially, the model permits variability in factor loadings and constants. Next, a metric invariance constraint is applied to factor loadings across temporal points, aligning with established methodologies (Putnick & Bornstein, 2016). The final specification imposes equivalence in both factor loadings and constants over time. The analysis proceeds with deriving coefficients for the structural part, culminating in estimating two models: one predicting university entrance and one predicting professional employment.
Results
Australian youth are upbeat about their career prospects (Table 2). On a scale from 0 to 10, where 0 denotes pessimism, and 10 signifies maximum optimism, the average score for “Thinking about my career inspires me” was 7.4 in 2013, with 8 for “I'm eager to pursue my career dreams” and 7.4 “I get excited when I think about my career.” Few 19 to 20-year-olds feel pessimistic at this stage in life. However, the averages reduce by a small yet notable margin after three and then after another 3 years. By 2019, these three averages decreased to 6.9, 7.3 and 6.7 by about 6% (Table 2). Most young people are thus moderately if not strongly optimistic, yet the positive feelings marginally wane over time (Table 2).
Descriptive statistics for career optimism items.
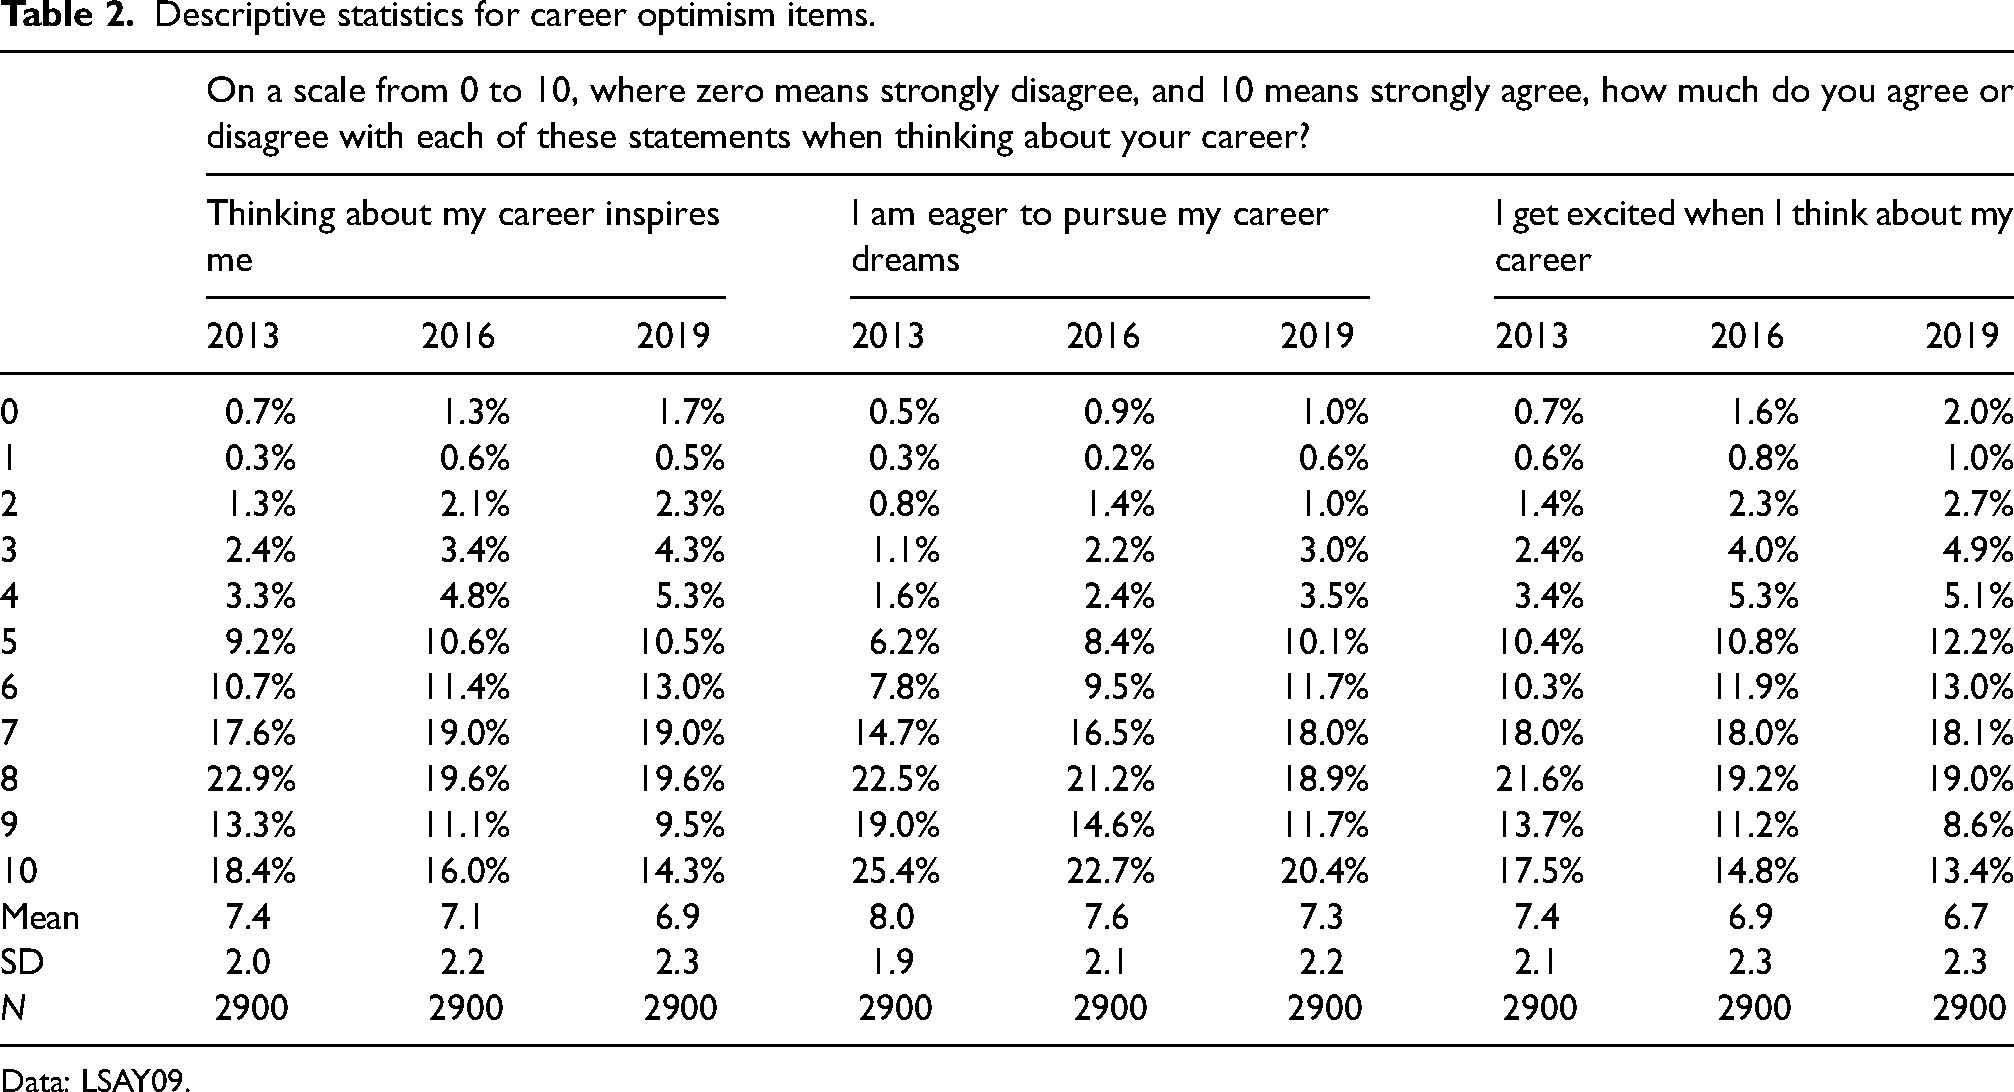
Data: LSAY09.
Overtime invariance in career optimism
While usable (Odero et al., 2020) and superior to many prior studies in its use of 10-point rather than 5-point Likert scale answers, which dominated studies listed in Table 1, the three-item scale is suboptimal as different item configurations cannot be assessed. The configural model is just identifiable with no degrees of freedom (Model 1 in Table 3). Consequently, although standardised factor loadings are very high, Model 1 is saturated, and thus, no fit indices can be computed (Putnick & Bornstein, 2016). Nevertheless, high loadings suggest a nuanced confirmation of Hypothesis 1, as the scale's components consistently represent career optimism from adolescence through early adulthood.
Confirmatory factor analysis: overtime invariance in career optimism.
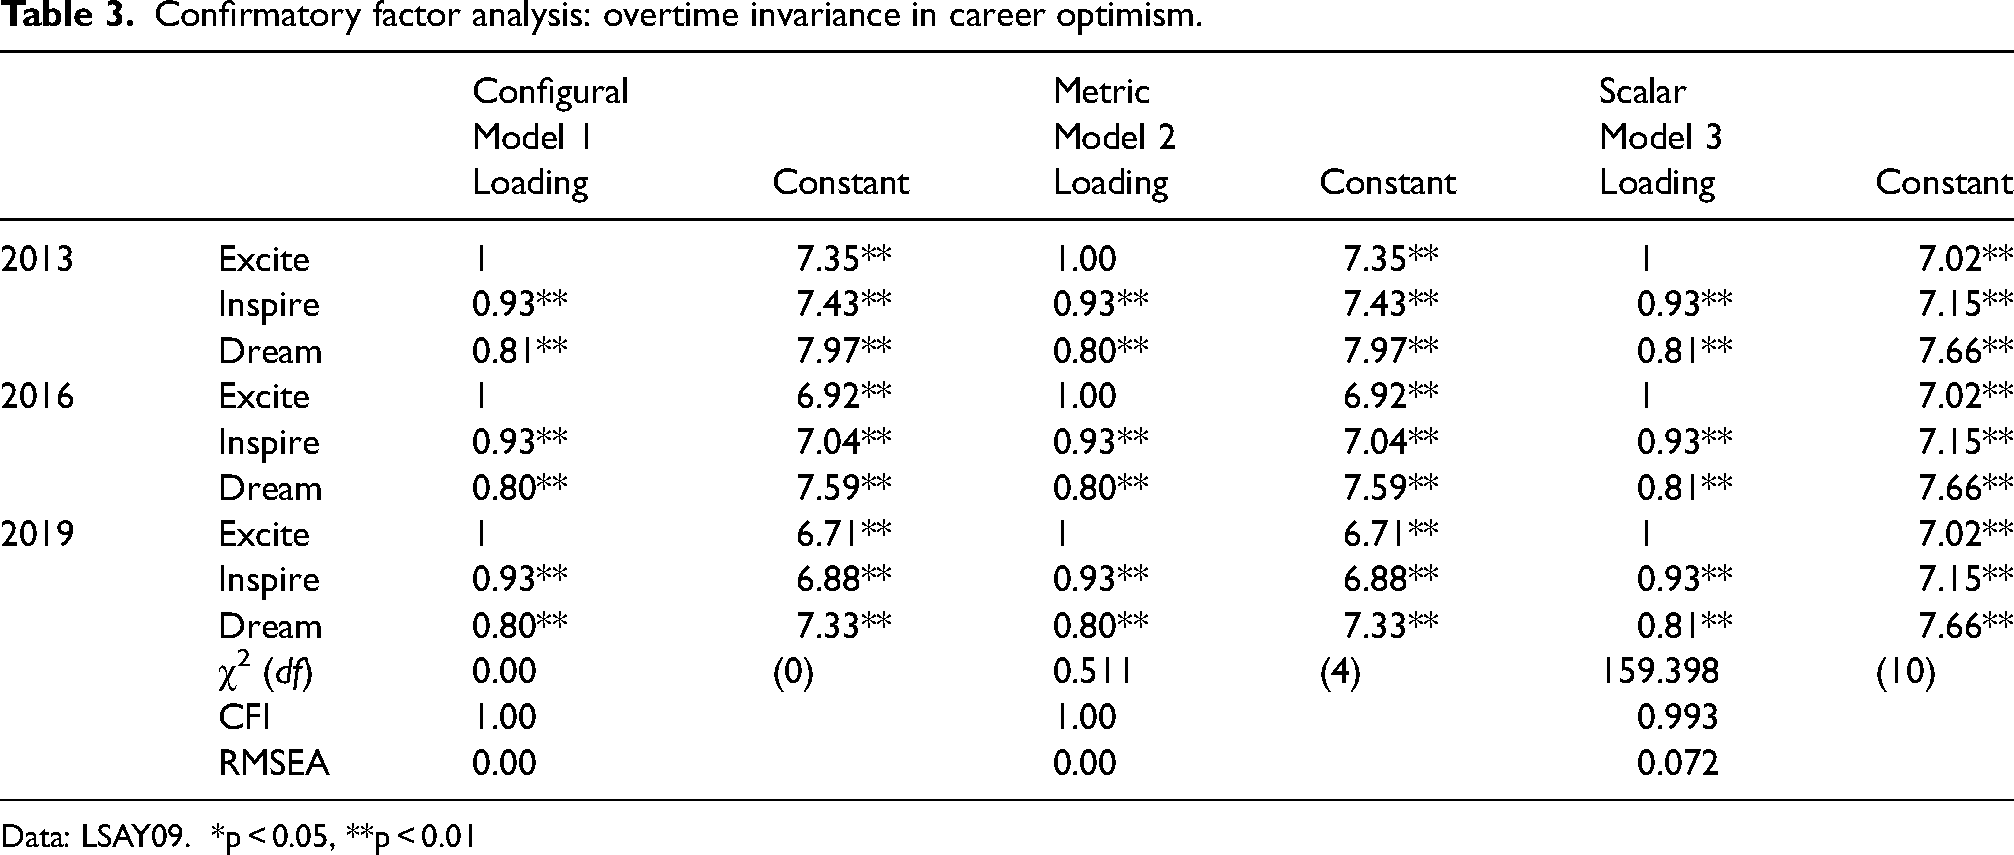
Data: LSAY09. *p < 0.05, **p < 0.01
Fit can be established, however, for other assessable models. Hypothesis 2 anticipated that the scale exhibits metric measurement invariance, with stable component contributions to the latent concept of career optimism over time. The findings in Table 3 validate this hypothesis, as evidenced by Model 2—the metric invariance model's excellent fit. The Comparative fit index (CFI) scores (Bentler, 1990) and the root-mean-square error of approximation (RMSEA) values (Browne & Cudeck, 1992) for the full information maximum likelihood (FIML) estimation are well within the acceptable range.
Hypothesis 3 suggested that the scale would show scalar measurement invariance across time. While the scalar invariance model demonstrates a good fit according to the CFI, the RMSEA’s exceeds the conventional threshold of 0.05, as seen in Table 3. Moreover, a significant chi-square difference from the metric model indicates variations in optimism levels over time. These results challenge Hypothesis 3. The slight waning of optimism levels is incompatible with the assumption they are entirely invariant, as posited in Hypothesis 3. Model 2 fits the data better than Model 3 in Table 3. This conclusion corresponds with recent research showing a modest reduction in subjective well-being from adolescence to early adulthood during the transition from education to employment (Dietrich et al., 2022). Overall, both the descriptive statistics and indices of fit point to the metric invariance model as optimal. Opting for the scalar invariance Model 3 would neglect the incremental waning of optimism over time, a “substantive scientific consequence,” according to Xia and Yang (2019, p. 421).
Sociodemographic antecedents and outcomes of career optimism
The LSAY sample comprised 63% of respondents who had been to the university by 2013, rising to 65% in 2016 and 68% in 2019 (Table 4). There were very few young people in professional employment in 2013, only 5%, but this proportion went up to 20% in 2016 and 41% in 2019. The sample involved 57% females and mostly students from secondary schools in metropolitan areas (73%). Seven percent were first-generation migrants, whereas 31% were second-generation migrants with at least one parent born overseas. The average value of the index of economic, social and cultural status (ESCS) was 0.56. This means that Australian respondents were, on average, half a standard deviation better off than the PISA 2009 participants elsewhere in the OECD. Their reading scores were also higher than the OECD average of 500, at 572 points. Occupational expectations were ambitious among these young people, as in other countries, where most teenagers report plans to work in professional jobs. In 2009, the average occupational status score on a scale from 0 to 100 was 75. Still, these expectations were later adjusted downwards, with the average expected occupational status scoredropping to 72 by 2016.
Descriptive statistics for dependent and control variables.
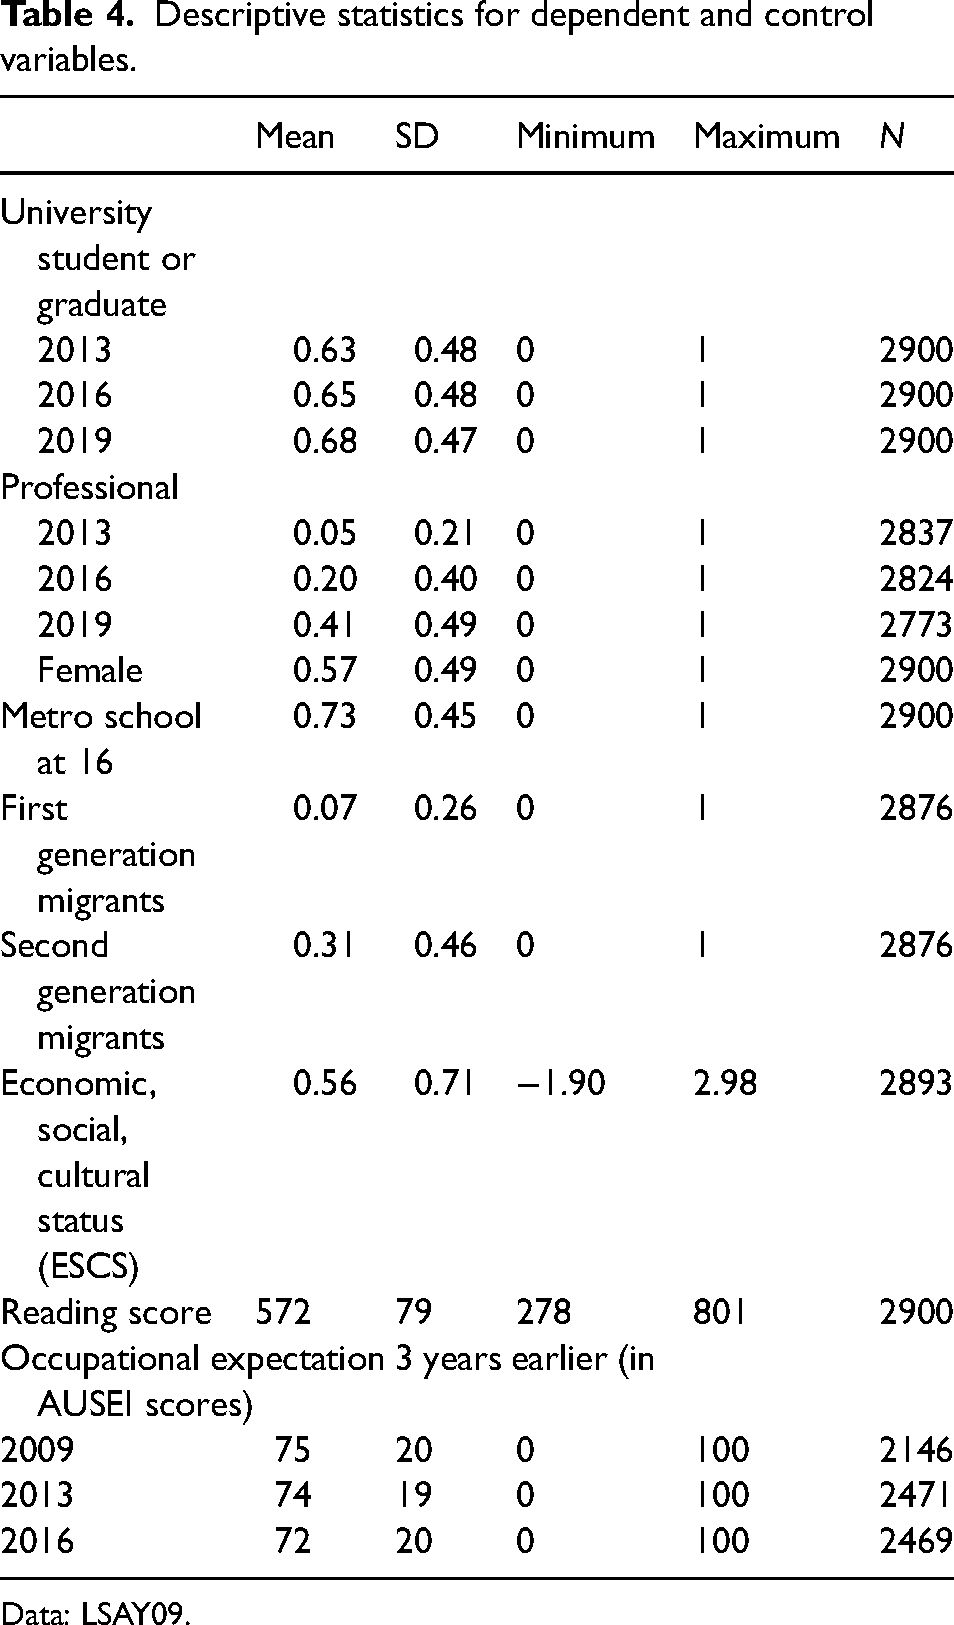
Data: LSAY09.
To assess Hypothesis 4, the impact of sociodemographic contextual variables on career optimism was estimated (as shown in both Figures 1 and 2) while using the career optimism scale with factor loadings fixed to be equal across time. Subsequently, Hypothesis 5, about how optimism affects access to university education, underwent evaluation as shown in Figure 1. Hypothesis 6, about professional employment, is assessed in Figure 2. Social psychological theories of career optimism are anchored in the assumption that regardless of career choice, individuals can feel optimistic and enthusiastic about their career-related activities, plans, or mentoring. If this assumption is correct, there should be no relationship between career optimism and professional employment or university study because employment dependent on university qualifications shouldn't differ in its capacity to evoke positive attitudes from other work prospects. So, the assumption that various careers can elicit a similar level of career optimism stipulates there will be no effect of occupational expectations on career optimism and, contrary to Hypothesis 4, no effects of sociodemographic variables on levels of career optimism. However, the research reviewed by Eva et al. (2020) indicated that sociodemographic variables did differentiate levels of career optimism, as posited in Hypothesis 4. Yet, none of the dominant career development theories accounts for the systematic patterns in this variation. While all theories expect contextual variables to matter, they remain silent about why certain variables would affect optimism in a specific direction and whether and why this impact endures over time.
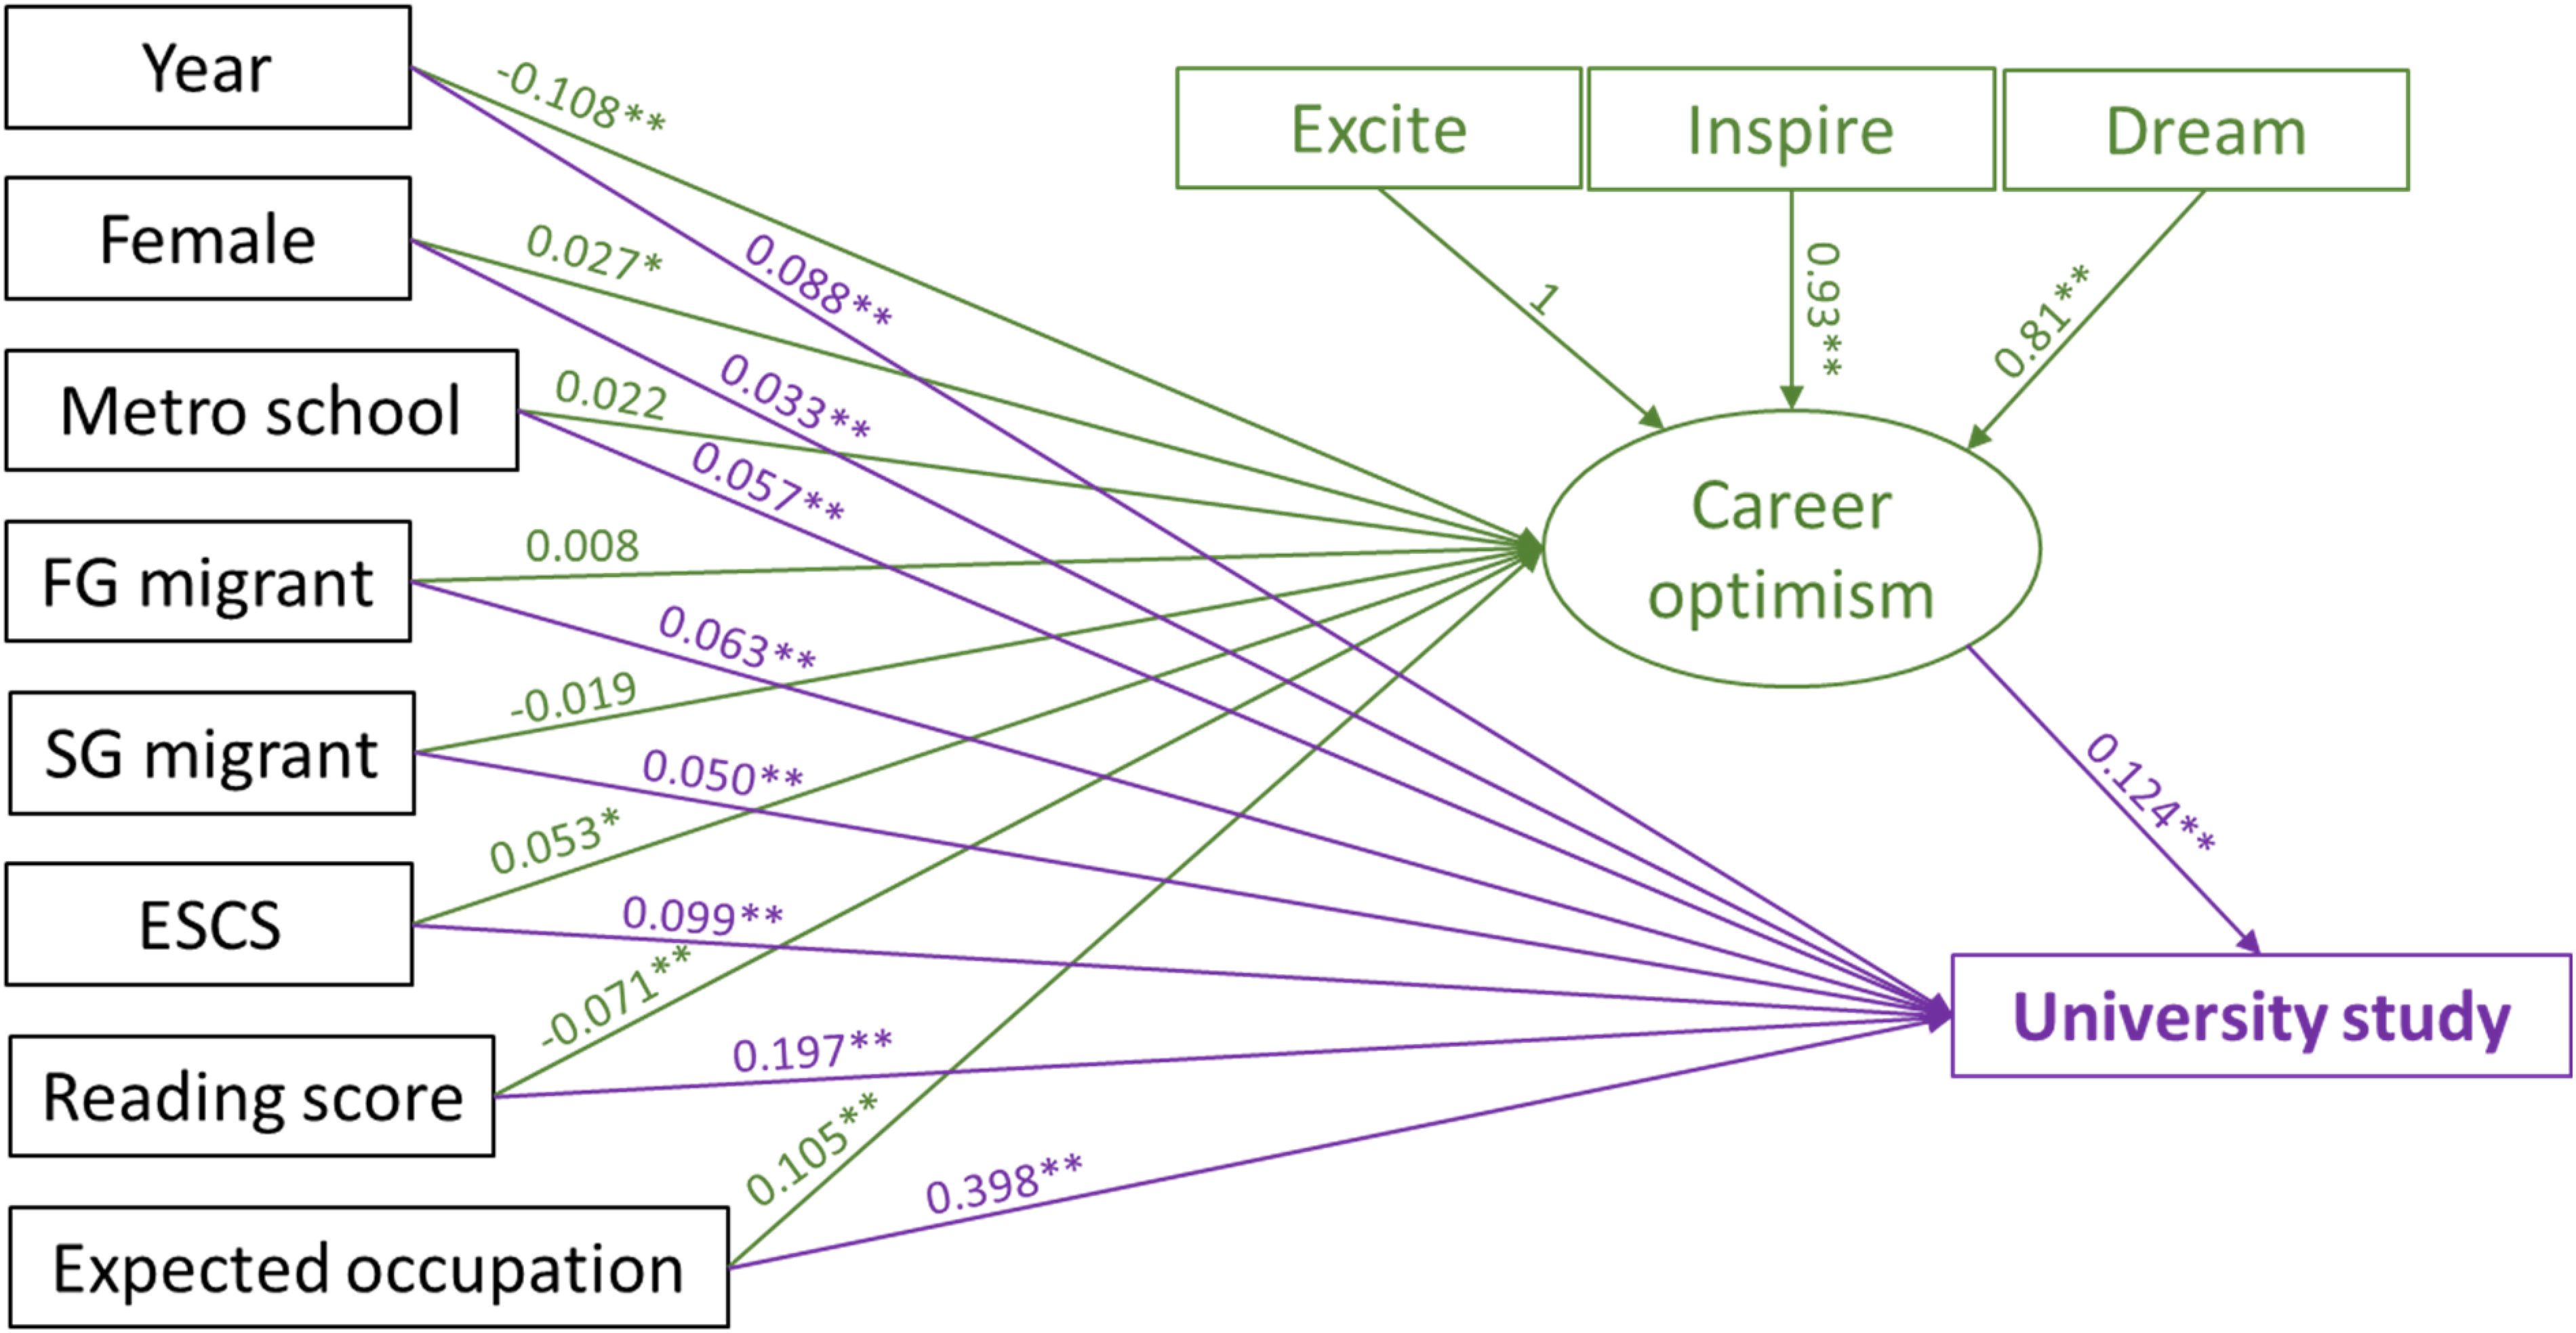
Structural equation model: career optimism and university study.
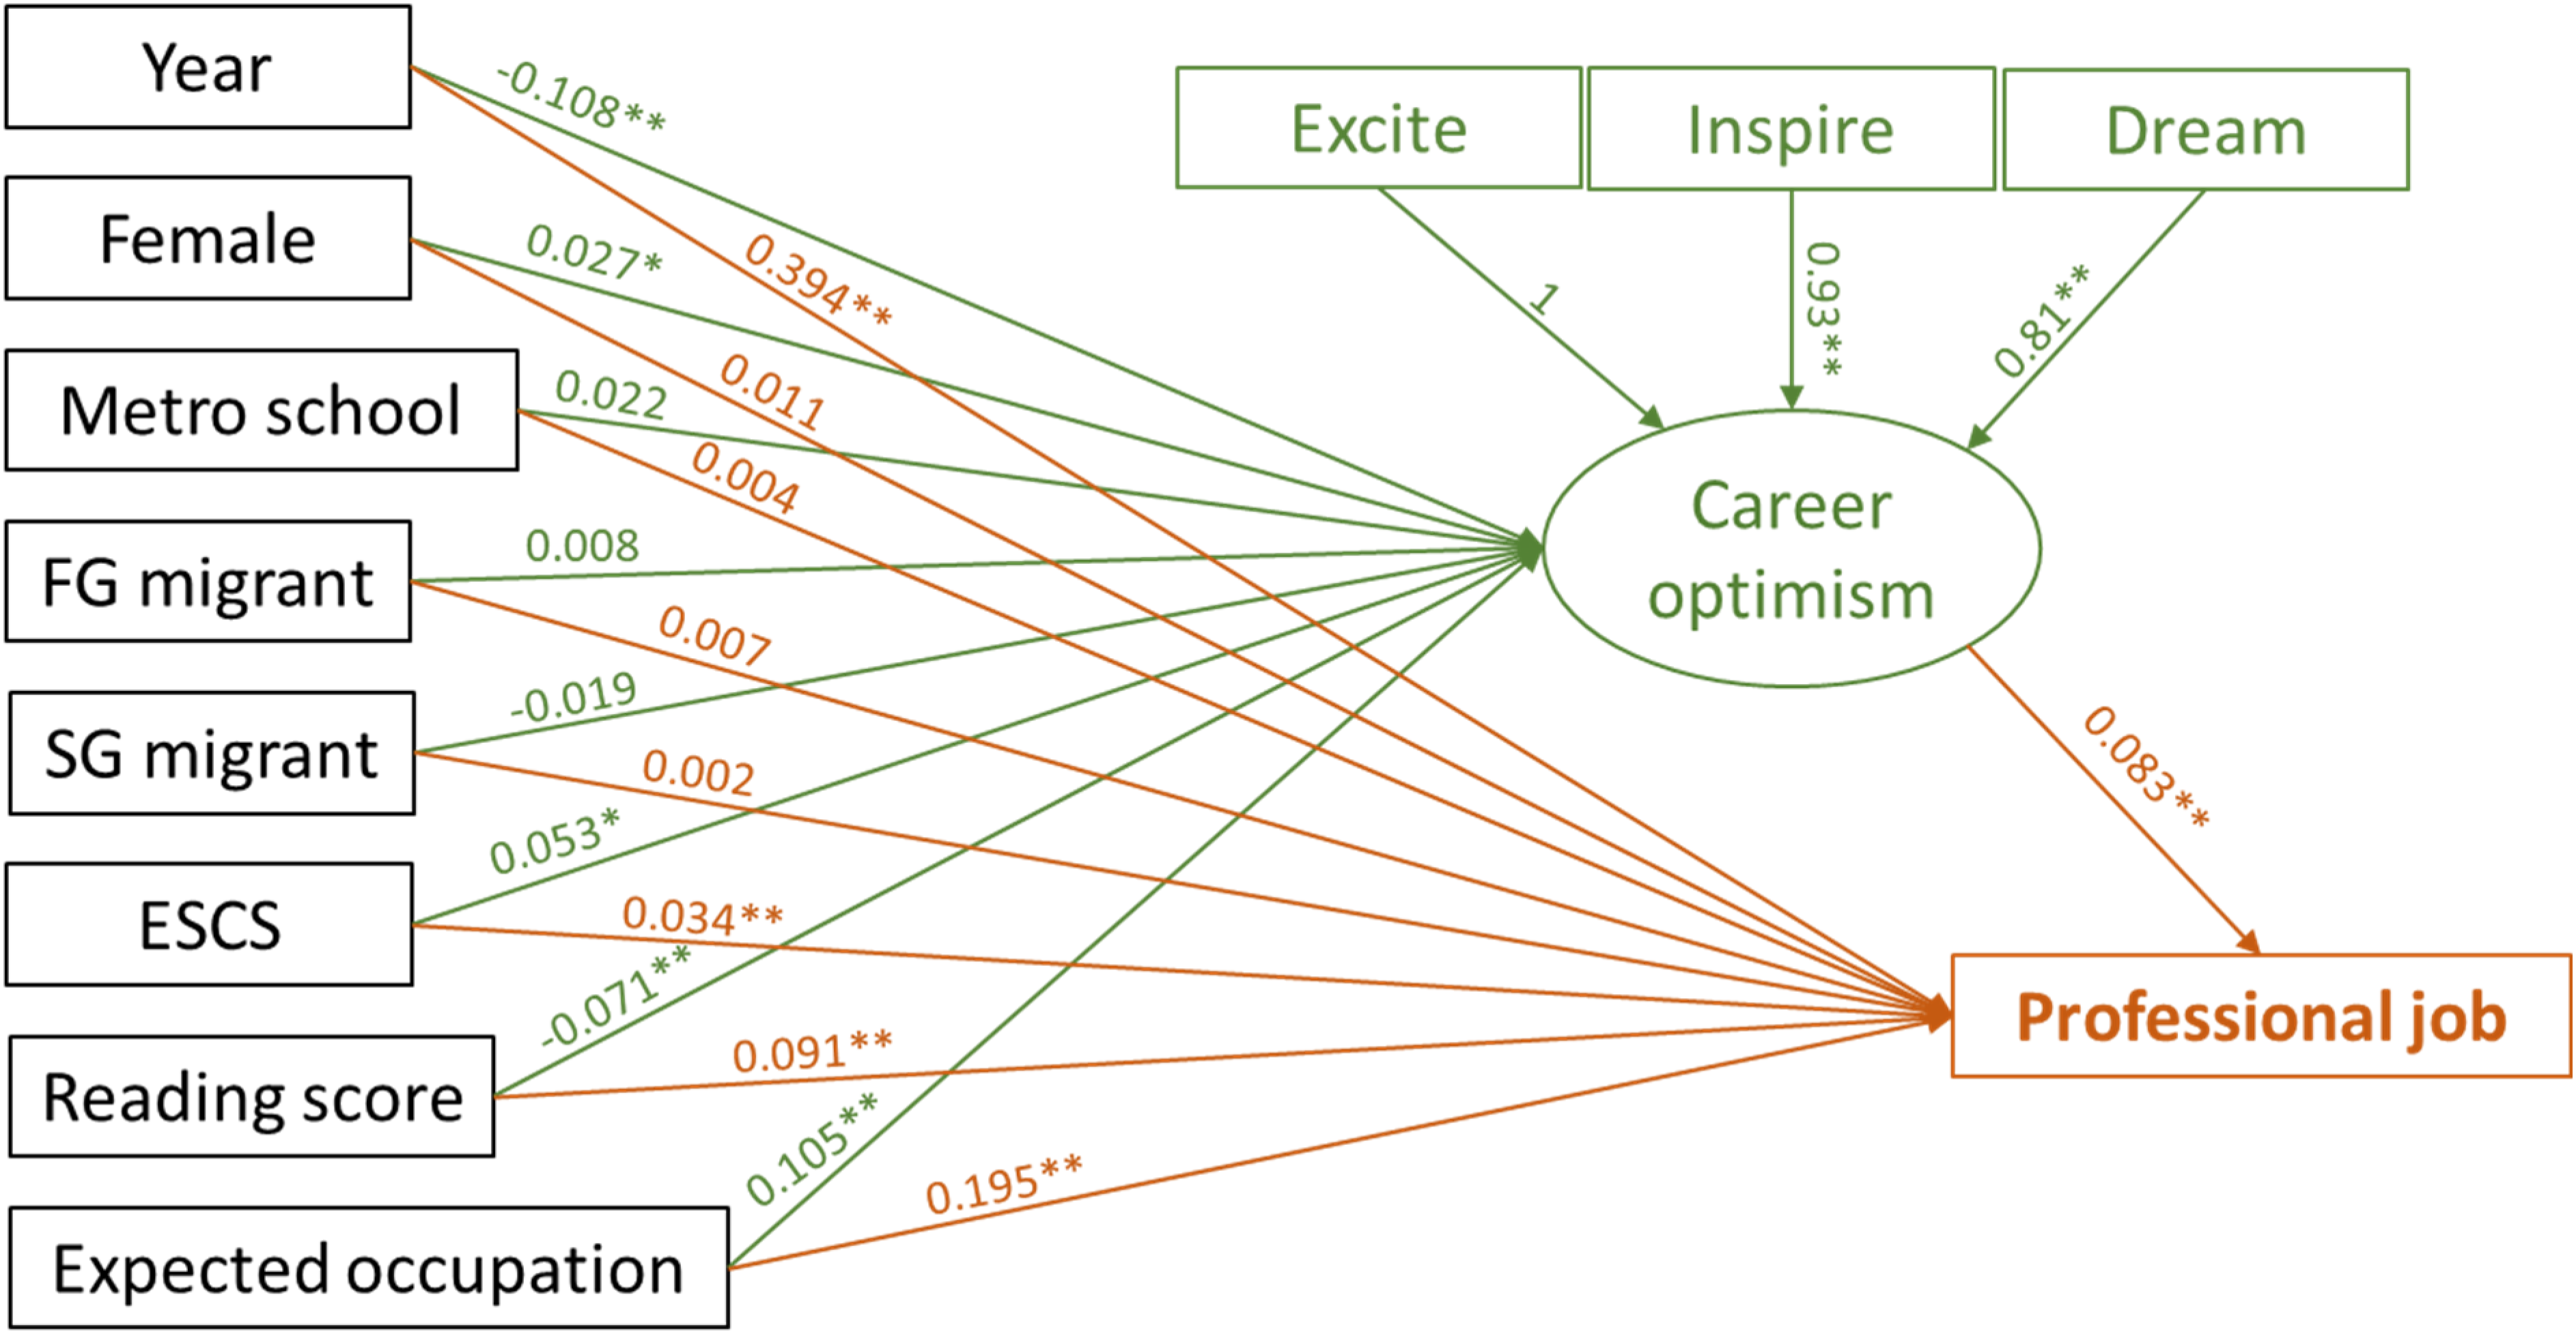
Structural equation model: career optimism and professional employment.
Figures 1 and 2 show the fully standardised solution from the relevant structural equation models. The two most significant predictors of career optimism are life stage, proxied by the passage of time, i.e., variable “year” and an expectation of a high status job in the future. Time negatively correlates with optimism while an earlier expectation of a career in a higher-status occupation enhances it. In line with Hypothesis 4, individuals who expect to work in higher-status occupations are more optimistic about their vocational prospects, with a positive coefficient of 0.105 standard deviations in size. Females are marginally more upbeat than males (0.027), and young people who grew up in families with high levels of economic and cultural capital are also more likely to be optimistic about their careers (0.053), regardless of the status of their expected jobs. Students who do well academically are slightly less upbeat (−0.07), but this effect becomes negative only after their more positive occupational expectations are held constant.
Figure 1 also confirms Hypothesis 5 because additional optimism raises the likelihood of entering university at some point in time, and this positive effect (0.124) is greater than the effect of sex, attending a secondary school in a metropolitan area, being of specific immigration status or coming from a family with more economic and cultural capital. The only variables that exceed the importance of career optimism as predictors of university study are adolescent reading test scores (0.197) and the expectation of entering a higher-status job by age 30 (0.398). Unsurprisingly, older respondents were more likely to be at university, as shown by the positive coefficient for “year.” Overall, career optimism in this model is a vital antecedent of university enrolment above and beyond ambitious occupational expectations.
In the second structural equation model, which depicts the impact of career optimism on securing professional employment by age 26, career optimism is also a vital factor. Over time, significantly more young people enter professional jobs. This proportion might be underestimated, given that some had not had the chance to complete their postgraduate studies by the time the survey ended. This might be one of the reasons why the effect of occupational expectations (0.195) is not as substantial for employment as it was for university entry. Nevertheless, net of the sociodemographic predictors considered here, career optimism positively correlates with professional work, as suggested in Hypothesis 6.
Discussion
This analysis provides information on the development of career optimism over a crucial period at the stage of life between 20 and 26 years of age when many young people pursue and complete tertiary education or enter jobs they see as their potential careers. Five out of six posited hypotheses find empirical support. The first two hypotheses expected configural and metric invariance in career optimism over time, which indeed transpired. However, the third hypothesis about scalar invariance, or time-invariant levels of optimism, had to be rejected. Career optimism as a life-course construct is configurally stable between 20 and 26 as particular components are comparably relevant. However, as demonstrated by the lack of scalar invariance, average levels of optimism fluctuate. More precisely, between adolescence and mid-twenties, there is a steady, albeit modest, reduction in levels of optimism—about 6%. Thus, career optimism is corrected downwards as youth acquire more education and labour market experience.
Next, in line with Hypothesis 4, career optimism is consistently higher among youth who grow up with more economic and cultural capital and among those who expect in adolescence and consistently afterwards high-status occupations by age 30. This finding corresponds with the literature emphasising the malleability of career optimism in response to receiving support and mentoring (Garcia et al., 2015). Still, the current analysis suggests that support and mentoring are likely more effective when correlating with higher cultural and economic capital stocks within the family or origin. In light of the two approaches to career optimism, which treat it as either a fixed trait or a malleable state, the evidence presented here contributes to the conceptualisation that emphasises the state-like components (Kluemper et al., 2009). However, they should be seen as socially conditioned on access to economic and cultural resources because young Australians from families where parents are highly educated and work in skilled professional occupations are more optimistic about their careers than their otherwise situated peers. Thus, optimism is created or enhanced at the intersection of the family and schooling environment. It is a disposition reinforced or weakened by early ambitious career expectations or lack thereof, the familial milieu and the potential reinforcement of similar educational and professional expectations in the peer and wider social networks.
Career optimism, however, is not reducible to the levels and types of cultural and economic capital that individuals possess. It remains a relatively significant predictor in its own right of university entry, as stipulated by Hypothesis 5, and entry into professional employment by age 26 as per Hypothesis 6. Thus, it might be seen as a conduit through which the familial environment becomes beneficial for achieving societally accepted and valued educational and vocational outcomes.
These findings suggest that training interventions can enhance career optimism (Luthans et al., 2006). Yet, the qualification implied by this study is that the same interventions might generate more optimism among individuals with particular family backgrounds and be less successful among those with less economic and cultural capital in their qualitative and quantitative dimensions. Other sociodemographic characteristics that may evoke prejudice or discrimination might also reduce vocational optimism.
Interestingly, this cohort's prior school success alone, denoted by reading scores, does not foster career optimism unless better-performing students also have ambitious occupational expectations. This implies that high-achieving students are as much in need of targeted career guidance as all other students because optimism goes hand in hand with specific expectations of future high-status employment. It also indicates that more research is required to explore discrepancies between academic achievement and vocational optimism.
Limitations
While this study overcame several limitations that affected most prior research on career optimism, its shortcomings include potential bias due to attrition in longitudinal surveys and the inability to compare different scale configurations. The latter stems from LSAY’s lack of a broader range of Career Future Inventory items. Future studies should investigate the longitudinal relationship between the three-item inventory and other relevant inventory items.
Several sociodemographic variables have been included in the model to counter the impact of attrition. However, it is unknown to what extent this bias has been reduced successfully. Notwithstanding that, this study represents the entire young adult cohort better than most previous samples.
Arguably, it would have been optimal to use indicators of university study and professional employment from 2020 so that career optimism measures refer to the preceding year. However, the survey ended in 2019, so optimism measures and dependent variables are from concurrent years. While ideally, the hypothesised causes ought to precede the hypothesised outcome in time, in this analysis, an assumption had to be made that career optimism proxied the respondent’s situation in the preceding year.
Conclusions
In light of this study, which empirically addressed stability in career optimism and illustrated the role of economic and cultural capital as its essential antecedents, the key to better understanding contextual factors is adopting a life-stage approach. In it, the family environment when growing up, as well as the school and work environments in adolescence and young adulthood, is traced back in time to appreciate the fluctuation dynamic in career optimism and how it might affect later educational and vocational outcomes. Work remains to be done to demarcate the key correlates that need to be included in such life-stage or biographical examinations, as models with large numbers of constructs will be impractical to measure repeatedly. The progress of future research on career optimism will depend on establishing more theoretical clarity and the empirical distinction between career optimism and other related motivational constructs, such as academic optimism (Phan, 2016). To succeed in having measures of such optimism included in future nationally representative surveys such as LSAY, a reliable set of subscales comprising moderate numbers of items needs to be developed and shown to predict critical vocational outcomes effectively. This paper contributes two such evaluations regarding university study and professional employment. Hopefully, more evaluations will follow in the future. More attention must be given to teenage career optimism among youth who never reach university and to later life stages than adolescence or young adulthood. Considering the overtime dynamic of career optimism in the context of educational and work experiences also seems crucial for older adults. Only longitudinal designs can show how career optimism as an individual disposition can persist despite structural barriers and be sustained by reactive, learned coping strategies.
This study suggests the need for career advisors to consider individuals’ backgrounds, encompassing family environments, educational experiences and early work history when tailoring career advice and designing support for maintaining ambitious goals. Because youth from less socioeconomically privileged backgrounds might have lower economic and cultural resources to sustain their optimism over time, they might need more intense ongoing career guidance support. Both researchers and career advisors are encouraged to consider career optimism from a life-course, longitudinal perspective and encourage more empirical research that scrutinises the dynamics of optimism, the related constructs, their antecedents and outcomes. To better understand career optimism, it will be essential to distinguish between it and other motivational constructs, such as academic optimism, at more than one life stage. After all, career optimism is equally desirable among students and working adults of all ages undergoing multiple career transitions.
Footnotes
Declaration of conflicting interests
The authors declared no potential conflicts of interest with respect to the research, authorship and/or publication of this article.
Funding
The authors received no financial support for the research, authorship and/or publication of this article.
Notes
Appendix
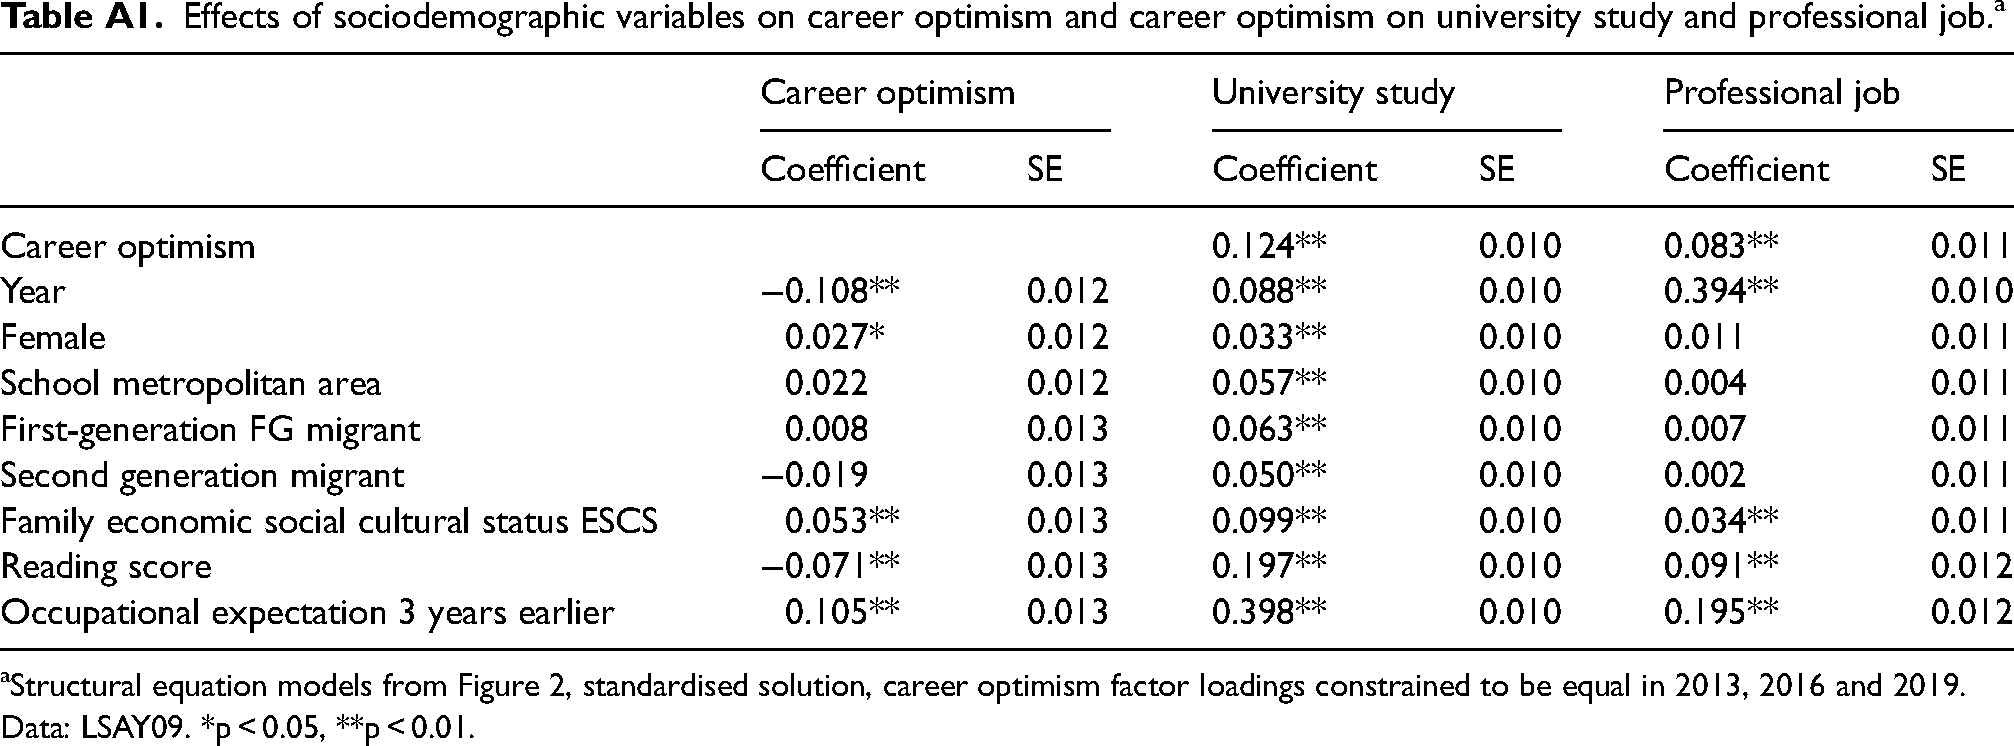
Effects of sociodemographic variables on career optimism and career optimism on university study and professional job. a
| Career optimism | University study | Professional job | ||||
|---|---|---|---|---|---|---|
| Coefficient | SE | Coefficient | SE | Coefficient | SE | |
| Career optimism | 0.124** | 0.010 | 0.083** | 0.011 | ||
| Year | −0.108** | 0.012 | 0.088** | 0.010 | 0.394** | 0.010 |
| Female | 0.027* | 0.012 | 0.033** | 0.010 | 0.011 | 0.011 |
| School metropolitan area | 0.022 | 0.012 | 0.057** | 0.010 | 0.004 | 0.011 |
| First-generation FG migrant | 0.008 | 0.013 | 0.063** | 0.010 | 0.007 | 0.011 |
| Second generation migrant | −0.019 | 0.013 | 0.050** | 0.010 | 0.002 | 0.011 |
| Family economic social cultural status ESCS | 0.053** | 0.013 | 0.099** | 0.010 | 0.034** | 0.011 |
| Reading score | −0.071** | 0.013 | 0.197** | 0.010 | 0.091** | 0.012 |
| Occupational expectation 3 years earlier | 0.105** | 0.013 | 0.398** | 0.010 | 0.195** | 0.012 |
Structural equation models from Figure 2, standardised solution, career optimism factor loadings constrained to be equal in 2013, 2016 and 2019.
Data: LSAY09. *p < 0.05, **p < 0.01.