
Abstract
The immersive experience of media such as music, films, games, and virtual reality is becoming increasingly important in the entertainment industry. The 10-item Immersive Music Experience Inventory (IMEI) was recently developed in an online study to measure the immersive experience of listening to music via headphones. However, it had not yet been tested in a laboratory setting with loudspeaker playback. Therefore, the first aim of this study was to validate the IMEI in a laboratory context using techniques from classical test theory, including a reanalysis of data from the online study, and item response theory. The second aim was to compare immersive experiences of listening to headphone playback in the online study and loudspeaker playback in the laboratory study after testing for invariance. Based on data from 57 participants listening to 29 stimuli in various audio formats through loudspeakers in a laboratory, the IMEI showed a reasonable fit in a confirmatory factor analysis and good reliability. Evaluation of these data using the probabilistic model of many-facet Rasch measurement resulted in a good fit both overall and for the items and the response scale. Based on two musical examples presented in the audio formats of mono, stereo, and three-dimensional (3D) audio in both studies (online and laboratory), we found evidence for measurement invariance. The comparison between listening conditions suggests that listeners have similar immersive experiences when listening through headphones and loudspeakers. We conclude that the IMEI is a reliable and valid measure of immersive music listening experiences in both contexts.
According to the claims of neuroeconomics (Zak, 2022), human beings show a need for the extraordinary and are willing to pay for it. Immersive experiences in entertainment, education, and communication are assumed to fulfill this need. Although most of this line of research is related to non-musical content (e.g., advertisements or movies), the generation of peak experiences is a gatekeeper for strong media experiences. Although immersive media experiences are often triggered by virtual environments (e.g., VR technology) or immersive narratives, immersive audio can also contribute to this strong experience. However, music research in this field is still in its infancy. Thus, the effects of sound reproduction in a three-dimensional (3D) audio format (otherwise known as immersive audio) could offer a way to enable an intensified musical experience instead of a mere everyday listening event.
In this context, immersion is an important concept in virtual-reality research. It can be “characterized by diminishing critical distance to what is shown and increasing emotional involvement in what is happening” (Grau, 2001/2003, p. 13). Other terms related to immersion are absorption and presence, for which a variety of partially overlapping definitions exist. For example, absorption is defined as “an extreme involvement or preoccupation with one object, idea, or pursuit, with inattention to other aspects of the environment” (American Psychological Association, 2018). Presence is understood as “the subjective experience of being in one place or environment, even when one is physically situated in another” (Witmer & Singer, 1998, p. 225). The most concise definition of presence is the experience of “being there” (Lombard & Jones, 2015, p. 16). However, due to the lack of clear definitions and comprehensive concepts, it is difficult to distinguish between different types of presence. We draw on Witmer and Singer’s (1998) definition of immersion as a “psychological state characterized by perceiving oneself to be enveloped by, included in, and interacting with an environment that provides a continuous stream of stimuli and experiences” (p. 227). Since interaction in the sense of intervention into or manipulation of the environment is not feasible in music listening, we understand interaction in terms of a cognitive and emotional process of engagement. In this context, being immersed means being involved in a given context, not only physically but also mentally and emotionally (Georgiou & Kyza, 2017). Our view is in line with that of Agrawal et al. (2020) who regard immersion in audiovisual media as a psychological concept that characterizes the subjective perceptual experience rather than a description of the technical properties of a system that facilitates the experience. For the purposes of our study, we further assume in our working definition that immersion is a continuous latent state. Thus, the development of the Immersive Music Experience Inventory (IMEI; Wycisk et al., 2022) was the first approach to the music-specific measurement of immersive listening experiences.
In the last two decades of empirical research on media and communication, the related concept of Spatial Presence (SP) has also been investigated in relation to the impact of media. However, the resulting inventories measuring presence are largely non-music specific and thus differ from the IMEI. For example, the Spatial Presence Questionnaire (MEC-SPQ; Vorderer et al., 2004) focuses on the experience of text, film, and virtual environments. The Spatial Presence Experience Scale (SPES; Hartmann et al., 2016) is an 8-item self-report measure based on the theoretical model of SP by Wirth et al. (2007) with two dimensions: self-location, that is, “being physically situated within the spatial environment” (p. 497), and perceived action possibilities. It explores participants’ experiences of media such as virtual reality, video games, television, and books. Neither self-location nor possible actions are applicable to the experience of listening to music as, while recordings of live performance reproduce natural room acoustics, most studio productions do not, and no recordings of music offer the opportunity for listeners to interact with them. Newjoto (2018) adapted the eight subscales of the MEC-SPQ (Vorderer et al., 2004) to audio content (live and studio recordings), reproduced in Dolby Digital 5.1 format through loudspeakers and stereo playback through headphones. While the author showed that SP can play a role in the experience of audio content such as radio drama, its primary purpose might be the evaluation of sensory immersion in audio content communicated via spatial-audio reproduction systems. However, the extent to which the MEC-SPQ measures psychological immersion or the listener’s emotional experience remains unclear. In a study of the evaluation of audio examples in different formats, listeners’ ratings showed that envelopment (LEV: the feeling of being surrounded by reverberant sound from all directions) and presence (the sense of being in the recording venue) are two independent dimensions (Eaton & Lee, 2022).
Unlike other inventories measuring SP and related concepts, the IMEI focuses not on the acoustic environment but on the listeners’ emotions while listening, as opposed to the emotions perceived to be expressed by a piece of music. This important distinction is in line with Gabrielsson’s (2001) typology of emotional expression.
Besides the acoustic environment and listeners’ emotions, other criteria can be used when comparing audio formats. Research in the field of audio engineering often uses technological sound-field features: for example, stereo, surround-sound and 3D mixes can be compared using the global attributes of basic audio quality (BAQ) and overall listening experience (OLE) in a multiple-stimuli-with-hidden-reference-and-anchor (MUSHRA) paradigm (ITU-R BS.1534-2; Schoeffler et al., 2017); differences between listeners’ experiences of stereo, surround-sound and 3D audio can be compared using LEV, presence, overall tonal quality (OTQ), and OLE (Eaton & Lee, 2022). These approaches are not concerned, unlike ours, with listeners’ psychological experiences of music in audio formats enabling different degrees of sound immersion.
3D reproduction of sound is increasingly important in virtual reality, video entertainment, and computer games. For example, Dolby Atmos has been available in cinemas since 2012 (Giardina, 2012) and a growing number of music-streaming services offer 3D audio. Increasing degrees of immersion (as realized, for example, by a rise in the number of channels and loudspeakers for sound reproduction) seem to be accompanied by intensified emotional experiences, or the illusion of presence or “being there” (Nordahl & Nilsson, 2014). In a meta-analysis of the effects of immersive experiences realized through various technologies on perceived presence, Cummings and Bailenson (2016) found a small-to-medium effect (r = .26) for sound. In a more recent study comparing presentation formats, Sander et al. (2023) observed small-to-medium effects on the emotional experience of music; the strongest effect was for stereo versus Auro-3D 9.1 (Cohen’s dZ = 0.64).
From a technical perspective, 3D audio can be played back via headphones using binauralization and via loudspeakers using multi-channel technologies. Both approaches have the disadvantage of potentially reducing listeners’ ability to localize sound sources and therefore their impression of being in a particular space, but for different reasons. Playback through headphones can be affected by so-called head-related transfer-function mismatches between the binaural rendering of the content and the listener. Playback through loudspeakers can be affected when localizing virtual (phantom) sound sources in the median plane between vertical loudspeakers, as localization mechanisms based on interaural time or level differences are insufficient and spectral cues may be ambiguous (Pulkki, 2001). In general, immersive loudspeaker systems rarely use speakers in the median plane, which can be seen as a disadvantage compared to binaural rendering of content. Neither method of reproduction can therefore be considered superior to the other.
To summarize, constructs such as SP, involvement, absorption, and engagement differ from the latent construct of immersive music experience as measured by the IMEI, but there is some overlap between them. Our approach differs from previous approaches because the IMEI measures the psychological affective experience of music rather than engagement and involvement, which are more related to SP and virtual reality (Shen et al., 2020). As emphasized by Agrawal et al. (2020), immersive experiences are the result of cognitive processes that can cause a shift in the listener’s attentional state.
Although the IMEI is a reliable instrument for measuring the emotional experience of immersion in listening to music in various audio formats through headphones, it is not yet known whether it retains its psychometric properties when music is presented through loudspeakers. As shown by Lepa et al. (2014), for example, the more spatial cues there are in audio playback, the more the listener perceives the music to be emotionally expressive. This can be observed in listeners’ responses to live-concert simulations as opposed to the same music played through stereo headphones.
Topical questions in this context are whether different playback formats (e.g., stereo, surround-sound, and 3D audio) can affect the immersive experience of listeners, and how to measure the psychological construct of immersion. The IMEI, recently developed in an online study using binaural 3D audio for headphones, can be used to measure the immersive music-listening experience according to modern psychometric standards. In that study, the Headphone and Loudspeaker Test (HALT; Wycisk et al., 2023, 2024) was administered to control the use of headphones. Suitable items for the IMEI were determined according to the analysis of a complete within-subjects design, in which four pieces of music were played to 190 listeners in mono, stereo, and 3D-audio formats (see the Materials sub-section of the Method section for a full description of the IMEI).
Research aims
The present study had two main aims. The first aim was to validate IMEI in a laboratory context using techniques derived from classical test theory (CTT), including a reanalysis of the data from the development of the IMEI, and item response theory (IRT). The second aim was to compare immersive experiences of listening to headphone playback in the online study and loudspeaker playback in the laboratory study. Having carried out formal invariance testing, we attempted in this comparison to answer the question of the likely but not yet investigated high similarity—convergence, so to speak—of responses to headphone and loudspeaker playback.
Method
Participants
Potential participants were recruited to the laboratory study through university mailing lists, social media posts, and advertising posters. Initial screening was carried out online, using the Quick Hearing Check (Kochkin & Bentler, 2010) to rule out severe hearing loss and other types of hearing impairment; potential participants then provided written informed consent, demographic information, and responses to items measuring control variables. A total of 57 individuals aged 19–50 years (M = 26.14, SD = 6.47; 31 female, 26 male) both completed the online screening and questionnaire and took part in the study. The Emotions subscale of the Goldsmiths Musical Sophistication Index (Gold-MSI; Müllensiefen et al., 2014; Schaal et al., 2014) was used to assess the participants’ music-related emotional behavior. Their mean score (33.18; SD = 4.97) was slightly above that reported by Schaal et al. (2014), falling into the 65th percentile. While 35 participants reported that they did not work in the field of music, the remainder included nine music students, five music teachers, six professional musicians, a musicologist, and an amateur musician.
Ethical approval
The studies were performed in accordance with relevant institutional and national guidelines (Föderation Deutscher Psychologenvereinigungen, 2022; Hanover University of Music, Drama and Media, 2024) and with the principles expressed in the Declaration of Helsinki. Formal approval of the study by the Ethics Committee of the Hanover University of Music, Drama and Media was not mandatory as the study adhered to all required regulations.
Materials
Questionnaire
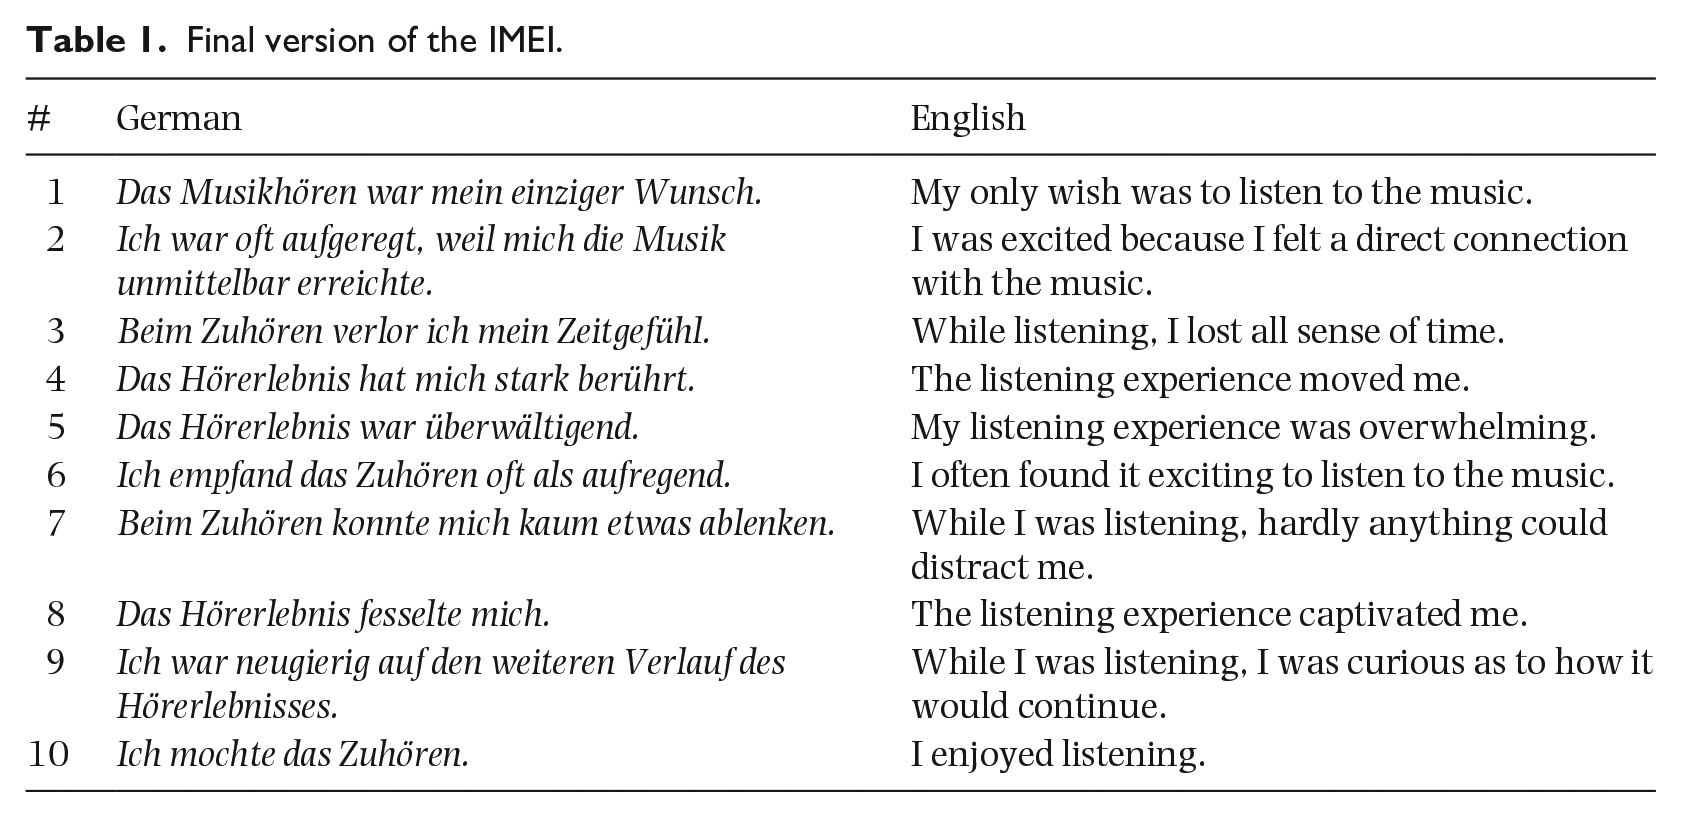
The final version of the IMEI requires participants to rate 10 items using a 4-point Likert-type scale from 1 (strongly disagree) to 4 (strongly agree) (see Table 1). The score is calculated by averaging the responses to all 10 items, resulting in a range of 1 to 4 in increments of 0.1.
Final version of the IMEI.
Stimuli
As in the development of the IMEI, a piece of music had to be available in or convertible to several audio formats to be considered as stimulus material. After a multi-stage selection and production process involving the participation of two audio engineers with expertise in multi-channel mixing (see Wycisk et al., 2022), excerpts from eight pieces of music from a variety of musical genres, such as jazz, pop, rock, and classical music, were selected; for details see Table S1 (in the Supplementary Materials). Two pieces, Die Hantel (The Barbell) and Variations on a Rococo Theme, had been used in the development of the IMEI.
All the stimuli were prepared for channel-based loudspeaker playback in a 5.1.4 speaker arrangement in the Immersive Media Lab (IML) of Leibniz University Hannover (Bergner et al., 2019; Hupke et al., 2018, 2019) following ITU standards (BS.2159-9, BS.1116-3). Each piece was produced in three formats: stereo (2.0 channel), surround-sound (5.1 channel), and 3D (5.1.4 channel). Die Hantel and Variations on a Rococo Theme were also produced in mono (1.0 channel) format for the purpose of comparing responses to the two stimuli in the two studies and their playback conditions (headphones vs. loudspeakers). A second 3D rendition of Die Hantel was included to assess test-retest reliability.
For the purposes of another study, one stimulus was produced in multi-mono format (i.e., the mono version was played back through all speakers, not just one speaker), and one 3D stimulus was played back at 5 dB less than its original level. The first was included to check the extent to which immersive music experience depends on sounds coming from all or many directions, via 3D and multi-mono playback, as opposed to sounds coming from different speakers for aesthetic purposes, via 3D but not multi-mono playback. The second was included to examine the influence of level of audio playback.
The stimuli that had been released commercially were either already publicly available in the required formats or were processed as necessary; the remainder were produced from original multi-track recordings. The recording aesthetic was established in the 3D format and retained in the other formats by manual downmixing.
The levels of loudness of all the stimuli were matched in a two-stage process. First, the levels of all stimuli from the same piece (i.e., the piece in all its formats) were matched using short-term loudness units relative to the full scale (LUFS) of the stereo format as a reference (for details see Bergner et al., 2023). Second, one of the audio engineers matched the levels between pieces so that differences between them plausibly reflected differences between the instrumentation used in the stimuli (e.g., a recording of the song Im wunderschönen Monat Mai for singer and pianist sounded quieter than The Ride of the Valkyries for orchestra). As reported in Kiyan et al. (2023), sound field parameters and features were obtained from re-recordings of the stimuli at the listening position using an em32 Eigenmike® (higher-resolution spatial microphone). These re-recordings at the so-called sweet spot were assumed to be sufficiently representative of the sound field experienced by participants since they would find it hard to move away from the listening position because of the psychophysiological-measurement equipment attached to them. According to the sound field parameters obtained, the mean sound pressure level (SPL) was 73.93 dB(A) when considering the SPL time series for each stimulus and 73.64 dB(A) when averaging the mean SPLs of all stimuli (for details see Table S2 and Figures S1 to S8).
Procedure
Each participant was tested individually in a session lasting approximately 1 hr. First, the participant was seated in the sweet spot of the IML. Next, an experimenter used a standardized script to inform them about the listening experiment. For the purposes of taking psychophysiological measurements for a study to be reported elsewhere, the experimenter placed electrodes on the participant, and fitted them with pupillometry glasses. The experimenter then left the room. A tablet placed next to the participant’s seat was used to guide them through the experiment.
The order of stimulus presentation was determined individually for each participant by a stochastic algorithmic process that ordered the stimuli randomly while ensuring that the same piece was not played back more than twice in succession (e.g., if the participant heard Die Hantel played back first in stereo and then in surround-sound, it would be followed by a stimulus from another piece). After hearing each stimulus, the participant completed the IMEI to report their subjective experience of immersion while listening to it. They also responded to an additional item, “Das Musikstück hat mir gefallen” (“I liked the piece of music”) using the same 4-point rating scale from 1 (strongly disagree) to 4 (strongly agree). The order of the IMEI and additional liking items was also determined randomly for each individual participant. Figure 1 illustrates the sequence of events in each testing session.
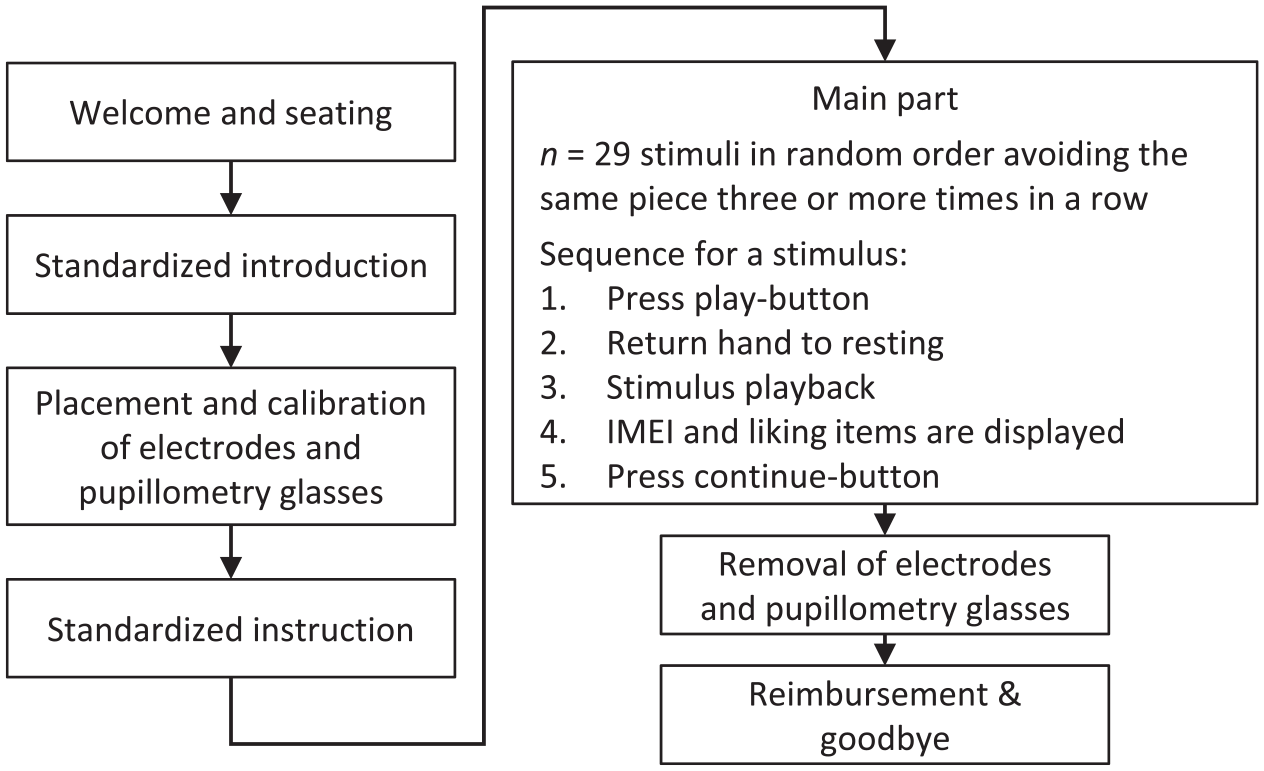
Sequence of events.
Data analysis
To validate the IMEI for use in the laboratory, the data were analyzed as they had been its development, using approaches from CTT based on structural equation modeling (SEM) and IRT techniques. The analyses were designed to complement and reconfirm each other.
Confirmatory factor analysis and reliability
A confirmatory factor analysis (CFA)—a type of SEM—was performed to test the assumed unidimensionality of immersion. As discussed by Widaman and Revelle (2023), when a one-factor model shows good data fit, the use of the sum or mean of the item responses (sum score) is justified. All 10 items were therefore used as indicators of the single factor of immersive music experience. In contrast to the initial CFA by Wycisk et al. (2022), the potential predictors of the immersive music experience—piece and format—were included in the model (see Figure 2).
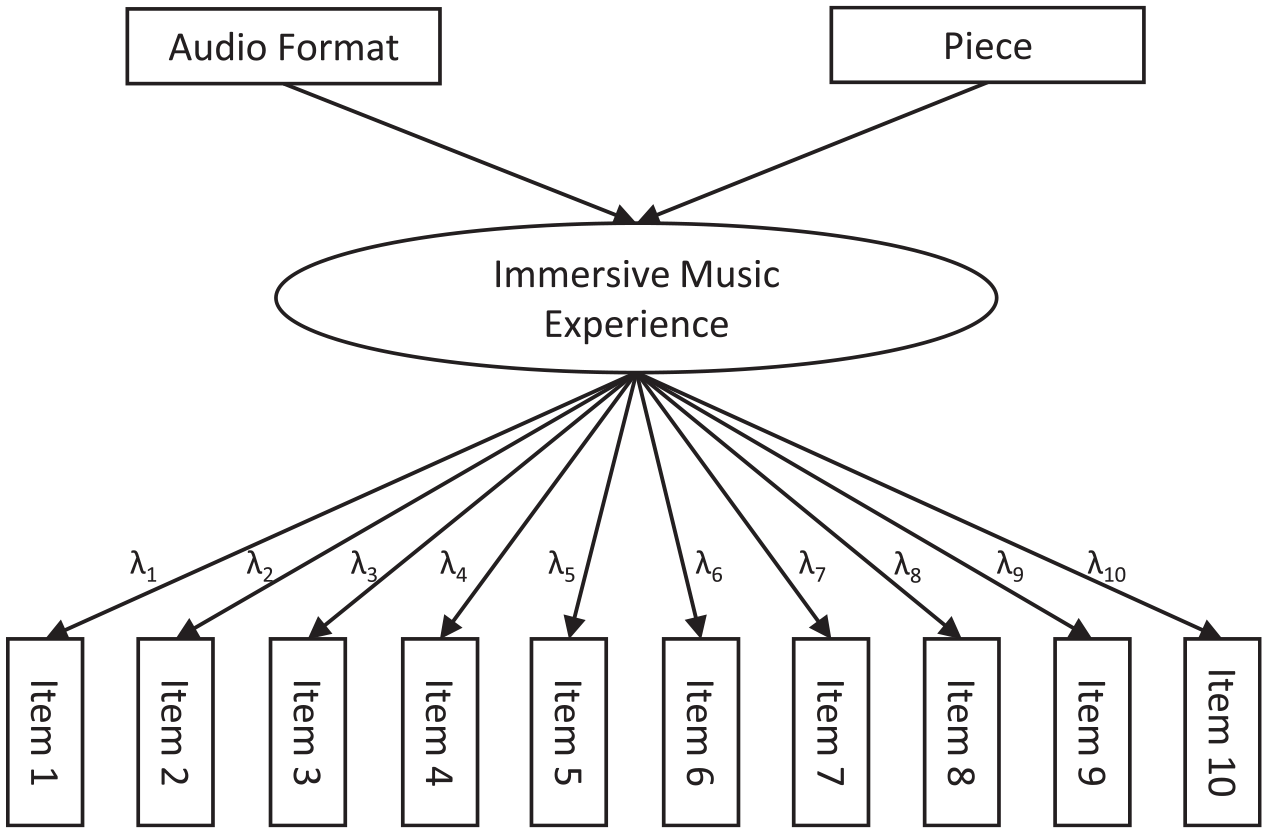
Structural model for SEM.
The same model was used to reanalyze the data from the online study. The following five variants were estimated separately for the two datasets (online: headphones vs laboratory: loudspeakers) with different constraints according to the measurement model used: (1) the strictly parallel model constrains the factor loadings, intercepts, and error variances to be equal across all items (Cho, 2016; Widaman & Revelle, 2023); (2) the essentially parallel model constrains the factor loadings and error variances to be equal across all items, freeing the intercepts compared to the strictly parallel model; (3) the strictly tau-equivalent model constrains the factor loadings and intercepts to be equal across all items, freeing the error variances compared to parallel models; (4) the essentially tau-equivalent model constrains only the factor loadings to be equal across all items; (5) the congeneric model constrains none of the parameters listed above. These variants of the measurement model are nested, such that parallel models are also (at least essentially) tau-equivalent models, which are themselves also congeneric models. Reliability coefficients for sum scores have to be calculated differently, according to the measurement model. In general (i.e., according to the congeneric model), the reliability coefficient is calculated from the factor loadings, which represent the true score variance, and the error variances. Congeneric reliability is also known as composite reliability, construct reliability, McDonald’s or unidimensional omega, and “Raju (1977) coefficient” (Cho, 2016, p. 659). Because of the constraints on equality in the parallel and tau-equivalent models, factor loadings are known a priori, simplifying the calculation of reliability. For tau-equivalent reliability, these lead to the formulae known as Cronbach’s or coefficient alpha, Guttman’s λ3, the Hoyt method, or KR-20, whereas parallel reliability is also referred to as standardized alpha in the literature. These simplified calculations are permissible if, and only if, the relevant model shows good data fit (Cho, 2016; Widaman & Revelle, 2023). Otherwise, reliability will be underestimated.
The CFA was calculated by means of the lavaan package (Rosseel, 2012; Rosseel et al., 2023) in R (R Core Team, 2023). Since all participants responded to all the stimuli, we used the cluster option to reflect the within-participant grouping of responses. According to Mardia’s Test (Mardia, 1970) as implemented in the MVN R package (Korkmaz et al., 2014, 2021), multivariate normality was not present in either the laboratory (Mardia Skewness = 916.55, p < .001, Mardia Kurtosis = 17.08, p < .001), or online dataset (Mardia Skewness = 1672.46, p < .001, Mardia Kurtosis = 61.28, p < .001). Accordingly, maximum likelihood estimation was used, which is robust to non-normality (Hoyle, 1995). Specifically, the maximum likelihood estimator MLM, which provides robust standard errors and a Satorra-Bentler scaled test statistic, was applied in model fitting. Format and piece were entered into the analysis as dummy-coded variables with stereo and Die Hantel serving as reference categories. As the second 3D rendition of Die Hantel was used in the laboratory study to examine reliability, it was excluded from the CFA. All other stimuli used in either the online or the laboratory study were included in the respective CFA models. For identification purposes, the factor loading of Item 1 was fixed to 1 and its intercept was fixed to 0.
The following measures are often used to assess model fit: the χ2 test, comparative fit index (CFI), Tucker–Lewis index (TLI), standardized root mean residual (SRMR), and the scaled and robust root mean square error of approximation (RMSEA; Sass & Schmitt, 2013). The χ2 tests exact model fit, while the others are approximate fit indices. It is important to emphasize that, according to Sijtsma et al. (2024), “the 1-factor model merely defines one of the many sufficient conditions for sum score use but not a necessary condition” (p. 101).
Item response theory model
Many-facet Rasch measurement (MFRM; Linacre, 1994) was used as the IRT model. Compared to CTT, the application of IRT offers clear advantages, including a more extensive evaluation of the psychometric properties of a measure and more informed scale and item bank development (Reise et al., 2013). The main unifying feature of IRT, unlike CTT, is the principle of separating the parameters of participants’ skills, on the one hand, and the properties of the items, on the other hand (van der Linden, 2016). In the case of immersive listening experiences, latent ability refers to the potential of a sound object (e.g., audio content played back in a particular format) to produce a certain degree of immersion. Higher scores on the IMEI correspond to the greater potential for a sound object to enable an immersive listening experience. Furthermore, “a broad class of IRT models formally justifies and supports the sum score, and thus supplies the foundation that CTT leaves open” (Sijtsma et al., 2024, p. 107).
The same contextual factors (facets) considered in the development of the IMEI were included in a rating-scale model for the MFRM analysis of the laboratory data: (1) the participant,
Since the IMEI was to be reviewed in the same way as it had been developed in the online study,
The global model fit was assessed using standardized residuals, as suggested by Wells and Hambleton (2018). For a good fit, the mean of the standardized residuals is near 0 (Linacre, 2021a, p. 198; Wells & Hambleton, 2018) and their standard deviation is near 1 (Linacre, 2021a, p. 198). Additionally, “about 5% of the residuals are outside ±2, and about 1% are outside ±3” (Linacre, 2021a, p. 178).
The standardized residuals were also used to check for unidimensionality by means of principal component analysis of the standardized residuals (PCAR; Eckes, 2015; Linacre, 2003). The resulting principal components (contrasts) should have eigenvalues < 2 (Linacre, 2021b). Items can also be clustered according to their loadings on the contrasts. If the measures obtained from those clusters are highly correlated, as indicated by disattenuated correlation coefficients approaching 1, they are assumed to be the same thing, which can be seen as another indicator of unidimensionality (Linacre, 2021b). The PCAR was performed using the Winsteps software package (Linacre, 2021d).
On the item level, we used mean-square fit statistics indicating the randomness within the probabilistic model with an expected value of 1 (Linacre, 2002); specifically, the outfit, which is “outlier-sensitive” (Linacre, 2002, p. 878) and an unweighted mean-square (Eckes, 2015). Wright and Linacre (1994) recommend acceptable ranges of fit statistics and Wu and Adams (2013) provide a formula for calculating thresholds for acceptable fit values in dichotomous models. Were the IMEI model dichotomous, acceptable outfit values of the items would be in the range of 1 ± 0.0708 (for details see Supplementary Materials, S1). We followed Wright and Linacre’s general recommendations and Wu and Adams’ formula for calculating thresholds in dichotomous models as starting points for the evaluation of the obtained fit values, since the IMEI model is polytomous and we did not know how thresholds calculated for dichotomous models might translate to polytomous models.
Another indicator of model fit is the Pearson correlation between the observed score and combined measures (point-measure correlation), rp-m, which is weak or even negative if the observed scores and model expectations do not match well (Eckes, 2015).
To ensure the quality of a rating scale Linacre (1999, 2004) recommends that each response scale category should have > 10 responses and the frequencies across categories should follow a regular distribution. The outfit is also applicable to the response categories and should be < 2. The average measure should increase monotonically with category as well as the category thresholds. Eckes (2015) recommends a permissible range of 1.4 to 5.0 log-odds units (logits) for differences between thresholds. In the present study threshold differences between categories 2 and 3 (1.72 logits) and 3 and 4 (1.90 logits) fell within this range, as the categories were anchored to the values calculated by Wycisk et al. (2022), but they were nevertheless checked for the re-estimated parameters.
A one-tailed Pearson correlation between the average IMEI score across all stimuli and person measure was calculated. In the online study, the scatterplot showed the data points arranged in an S-shape, which is typical of items obtained by IRT methods (Wycisk et al., 2022).
Invariance testing and measures for comparing data from the online and laboratory studies
Having evaluated the use of the IMEI online and in the laboratory, separately, we tested its configural, metric (i.e., weak factorial), and scalar (i.e., strong factorial) invariance in the two contexts (Sass & Schmitt, 2013). Configural invariance is present when the model fits both data sets although the parameters may vary across the two contexts. Metric invariance constrains the factor loadings to be equal in the online and laboratory studies. Scalar invariance constrains the intercept of an item to be equal in the two contexts.
To conduct the invariance testing in lavaan, we used data for Die Hantel and Variations on a Rococo Theme, in mono, stereo, and 3D formats (binaural for the online study and 5.1.4 channel for the laboratory study) as these stimuli were part of both studies. We used the same structural model and the same measurement models as for the separate CFAs (see Confirmatory factor analysis and reliability) together with the constraints for the different types of invariance. The constraints of the invariance and measurement model sometimes coincide (e.g., measurement models fixing the factor loadings to 1 imply at least metric invariance). We assessed the fitted models on the indicators listed above for model fit and differences between χ2, CFI, TLI, SRMR, and RMSEA from the congeneric configural invariance model (Sass & Schmitt, 2013).
For the comparison, we considered IMEI scores (i.e., the mean of the 10 items), parameters from the MFRM model and results of the SEM. Stimuli were presented in mono, stereo, and 3D-audio formats in both studies but may have been perceived differently because participants were listening through headphones in the online study and through loudspeakers in the laboratory study. For example, listeners can miss crosstalk between channels in stereo headphone, but not loudspeaker, playback (Roginska, 2018). We did not expect the formats in the two studies to be in exactly the same position on the latent continuum of immersion, therefore, but to be in the same order:
Results
CTT: Separate confirmatory factor analyses
The CFA yielded significant χ2 tests for exact fit for the five measurement models in both data sets (see Table 2). Since this test is sensitive to sample size and non-normality, we focus on the approximate fit indices for assessing model fit (unless otherwise specified, see Keith, 2015). According to rules of thumb (CFI, TLI ⩾ .90), the CFI and TLI indicate at least “satisfactory fit” (Navarro & Foxcroft, 2022, p. 443) or “adequate fit” (Keith, 2015, p. 312) for the essentially tau-equivalent model and the congeneric model in both data sets (see Table 2). All models have SRMR values below .08 and most models—except those two with fixed intercepts in the laboratory—even have SRMR values below .06, which signifies good model fit. For RMSEA, values up to .08 indicate adequate fit, whereas values below .05 indicate good fit. Considering scaled RMSEA, all models show values significantly lower than .08 indicating at least adequate fit, whereas the models without intercept constraints even show values below .05 indicating good fit; considering robust RMSEA, the strictly parallel and the strictly tau-equivalent model show values indicating poor fit, whereas the other models show adequate fit. Taking all fit measures together, we conclude that CFA resulted in reasonable fit for the congeneric, the essentially tau-equivalent model, and the essentially parallel model (with the small exception of TLI in the laboratory study) in both data sets.
Fit measures for the five measurement models in both data sets.
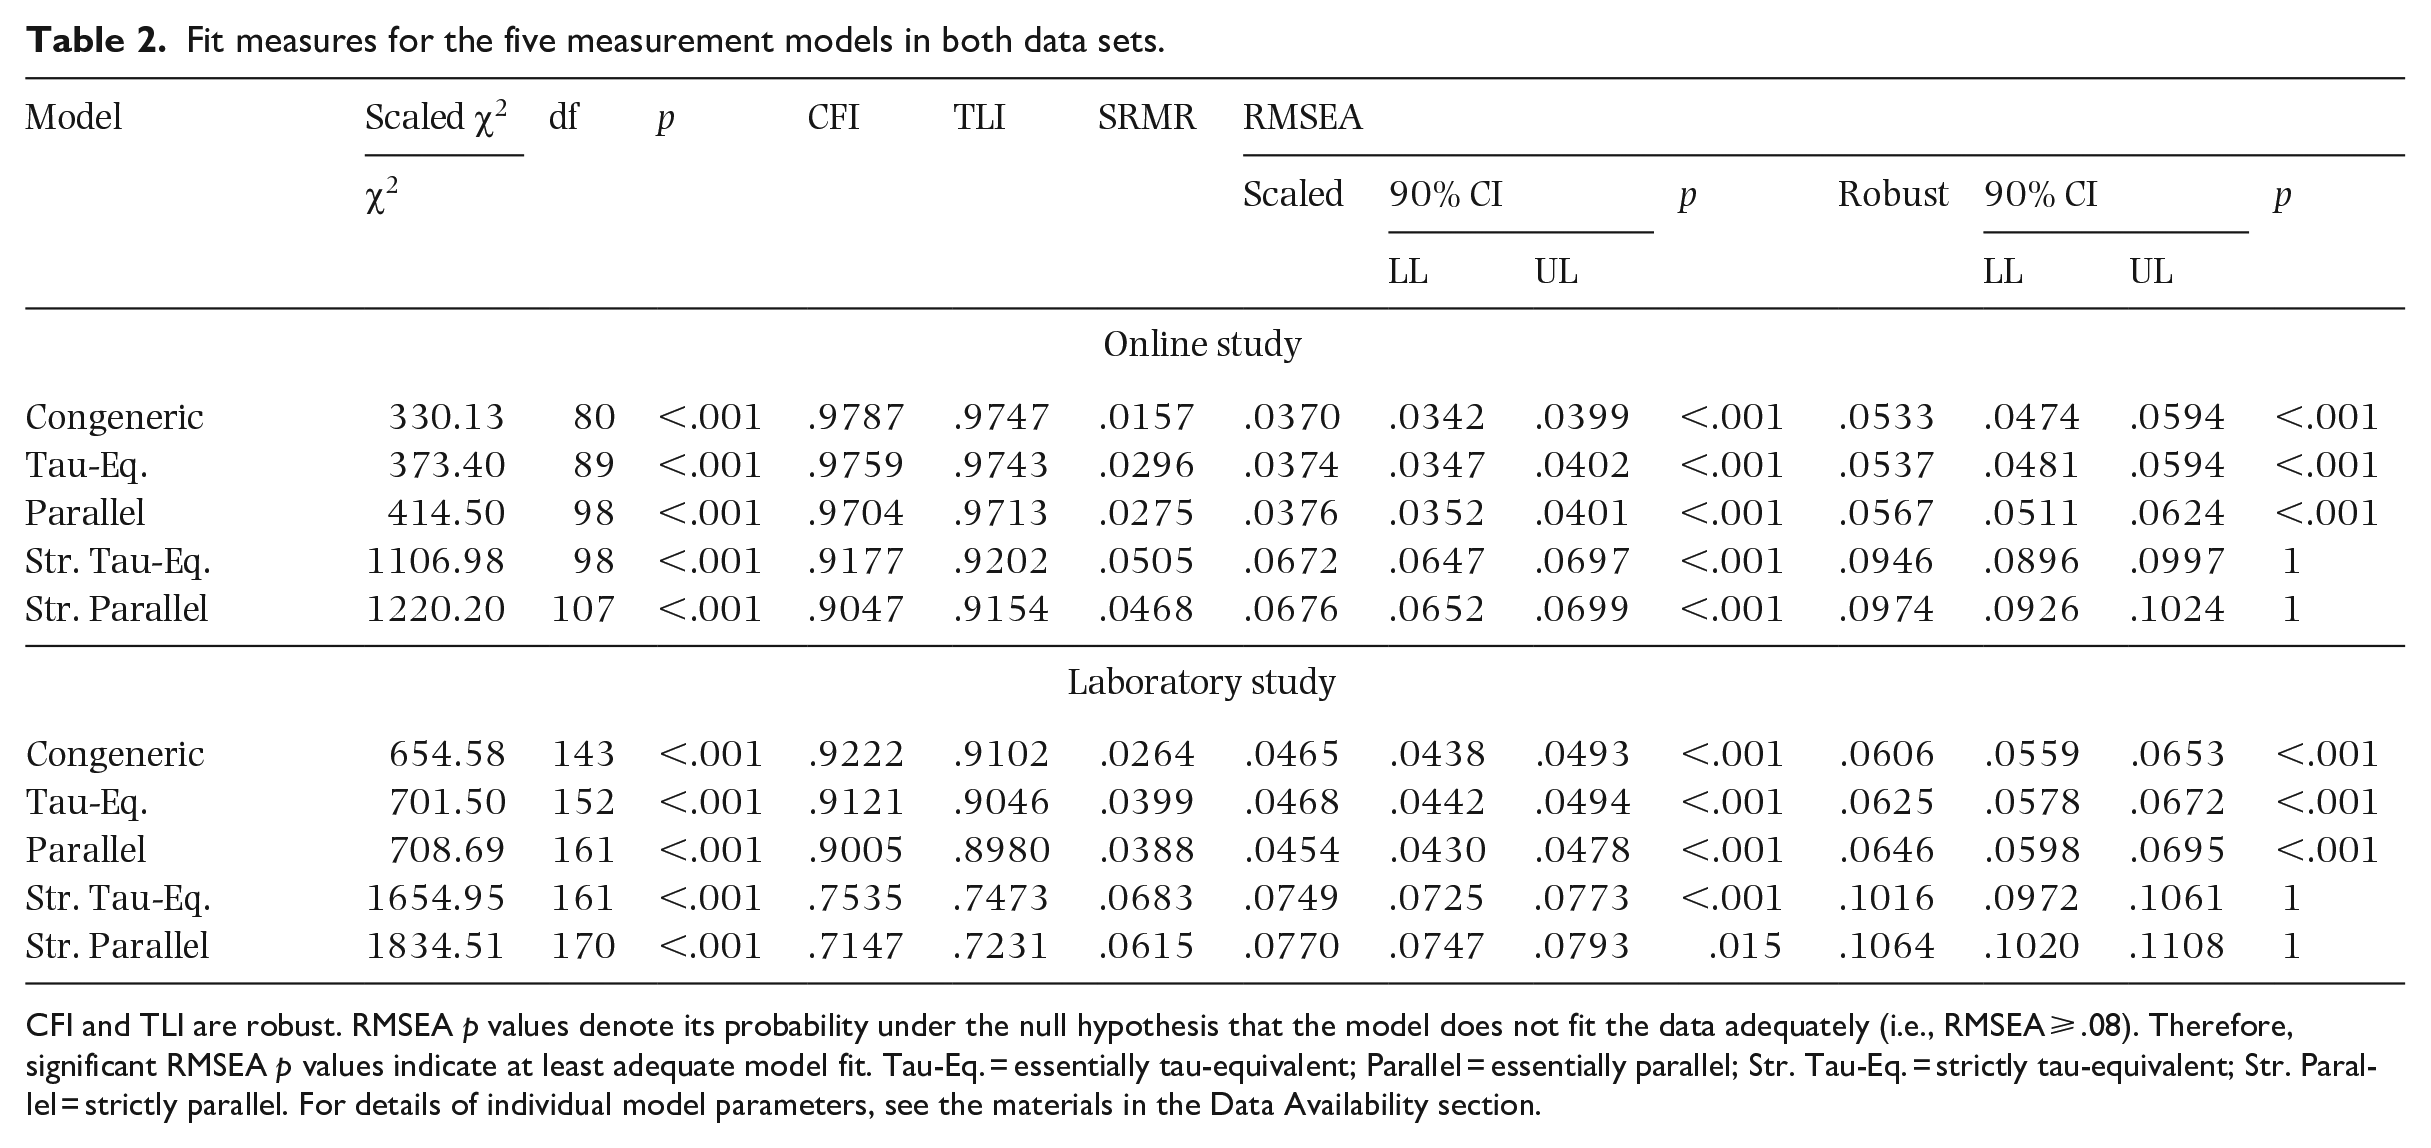
CFI and TLI are robust. RMSEA p values denote its probability under the null hypothesis that the model does not fit the data adequately (i.e., RMSEA ⩾ .08). Therefore, significant RMSEA p values indicate at least adequate model fit. Tau-Eq. = essentially tau-equivalent; Parallel = essentially parallel; Str. Tau-Eq. = strictly tau-equivalent; Str. Parallel = strictly parallel. For details of individual model parameters, see the materials in the Data Availability section.
CTT: Separate reliability analyses
Since the essentially tau-equivalent measurement model fitted both the online and the laboratory data set, we calculated tau-equivalent reliability, ρT (or Cronbach’s α, Guttman’s λ3, Hoyt method, KR-20). This resulted in a value of ρT = .966 for the online study and, excluding the second 3D rendition of Die Hantel, ρT = .929 for the laboratory study. These values are almost identical to those when only the congeneric model would have fitted. They only differ from the fourth decimal place onwards. For the essentially parallel model, which achieved an almost equally good fit, the rounded parallel reliability coefficients were ρP = .966 and ρP = .928 for the online study and the laboratory study, respectively. To complement these overall values, reliability coefficients were calculated for all stimuli individually. The individual values for the laboratory stimuli (including the second 3D rendition of Die Hantel) ranged from ρ = .900 to ρ = .950 with an arithmetic mean of ρC = .930 (congeneric reliability coefficient), ρT = .928, and ρP = .929 (for details see Table S3). The data from the online study showed a smaller range of ρ = .961 to ρ = .970 with an arithmetic mean of ρ = .966 (rounded to three decimal places, ρC = ρT = ρP), slightly higher than the laboratory data (for details see Table S4). All reliability coefficients far exceeded the minimum acceptable reliability of ρ > .700 (Abell et al., 2009).
Since Die Hantel was played back twice in 3D audio, the correlation between the IMEI scores of both renditions of this stimulus was considered a measure of test–retest reliability. According to common effect-size benchmarks (Ellis, 2010), the retest correlation resulted in a large effect of r(55) = .507, p < .001 (one-tailed), 95% CI [.323, 1].
IRT: Many-facet Rasch measurement
Assessing model fit with standardized residuals
The mean of the 15,960 standardized residuals was 0.001 and their standard deviation was 1.045. Therefore, both values indicate a good fit. As can be seen in Figure 3(a), taking the estimated participant measure
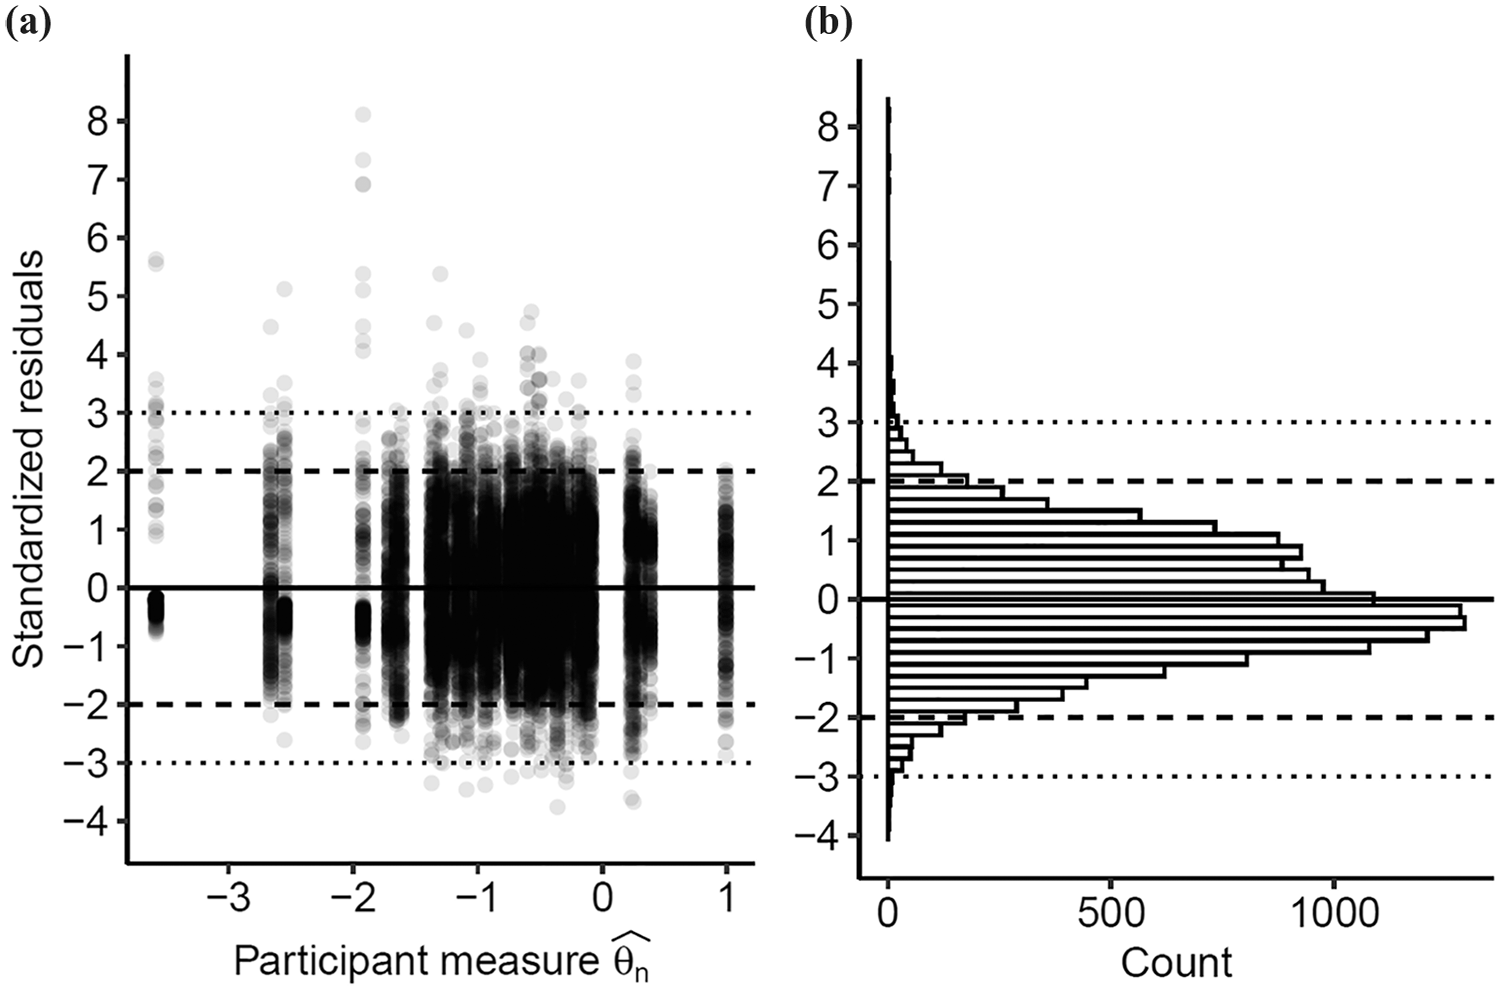
Distributions of the standardized residuals from the MFRM analysis (a) with and (b) without the participant measure.
PCAR: Controlling for unidimensionality
In the PCAR, all contrasts (principal components) had eigenvalues lower than 1.81 (for details see Table S5), so each contrast was less than two items in strength (Linacre, 2021b). In addition, the proportion of variance explained by the Rasch measures of items and persons was more than two and a half times as high as for each of the contrasts. The correlations of measures obtained from different clusters of items were strong (for details see Table S6) and their disattenuated versions approached 1 (for details see Table S7), further supporting the assumed unidimensionality.
Item evaluation
Table 3 shows the measurement report for the IMEI items from the MFRM analysis. Outfit values ranged from 0.93 to 1.33. This range is suitable for most of the types of tests reported by Wright and Linacre (1994). Five of the 10 IMEI items were within the calculated limits according to Wu and Adams (2013), while the remaining five were in close or sufficient proximity.
Measurement report of the IMEI items from the MFRM analysis.
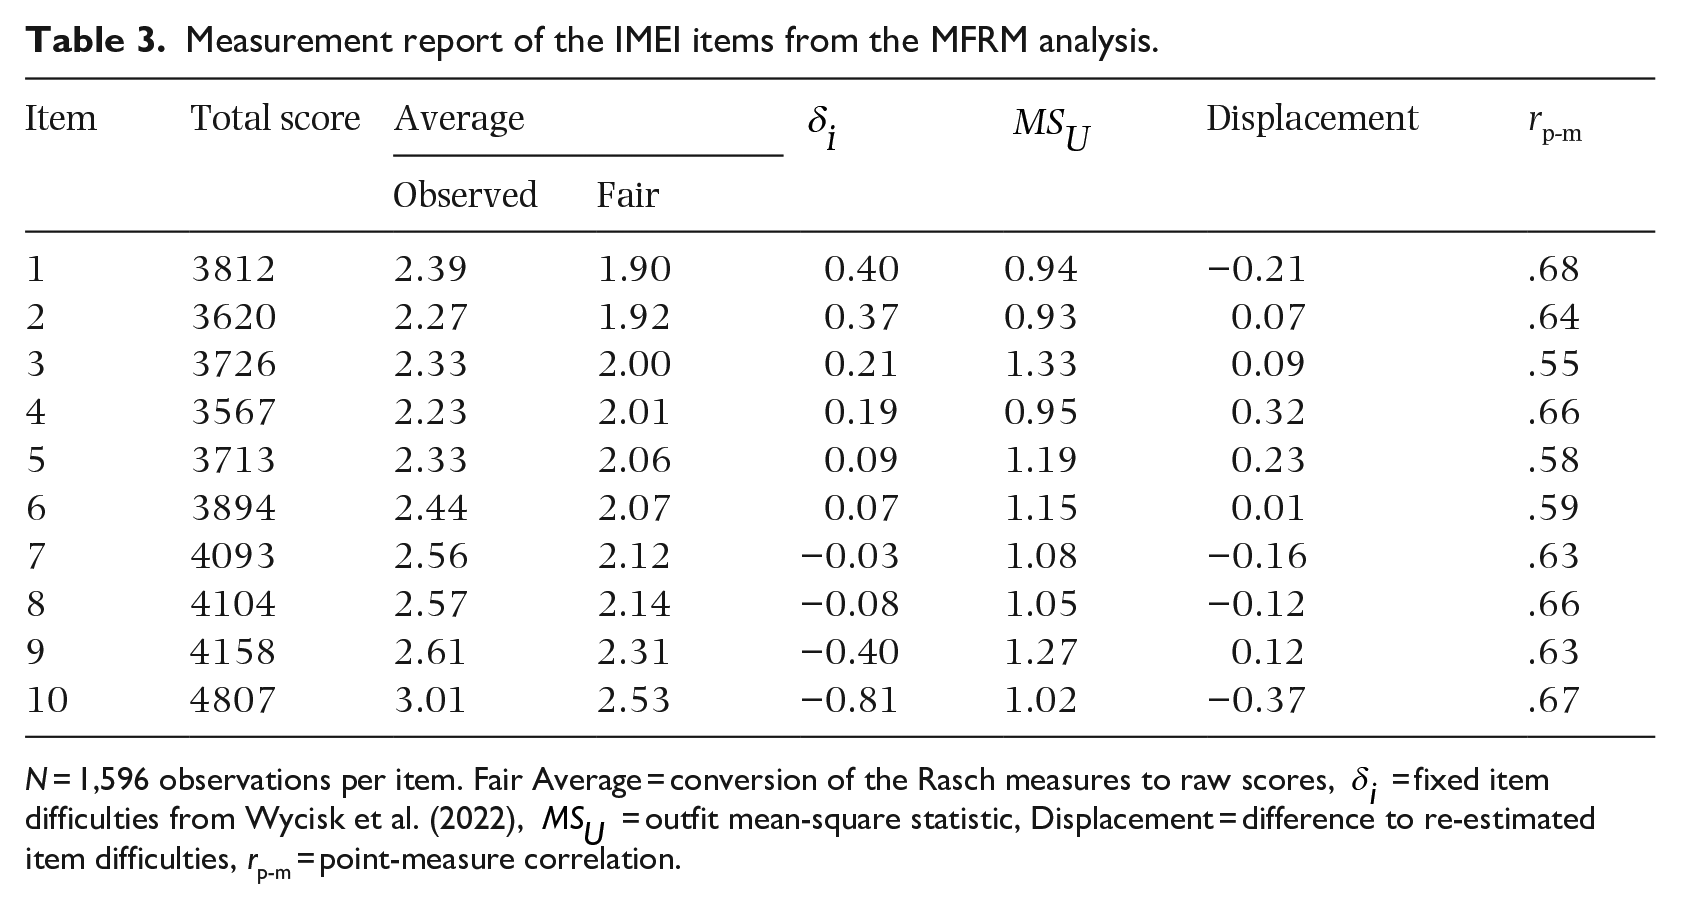
N = 1,596 observations per item. Fair Average = conversion of the Rasch measures to raw scores,
As can also be seen in Table 3, the point-measure correlation was positive and at least .55 for all items. Therefore, model expectations and observed scores should correspond sufficiently.
Response scale evaluation
As can be seen in Table 4, response counts for all categories exceeded the minimum number of 10. Looking at proportions of responses in each category, responses were unimodally distributed around the middle of the scale. The outfit mean-square,
Measurement report for the response categories from the MFRM analysis.
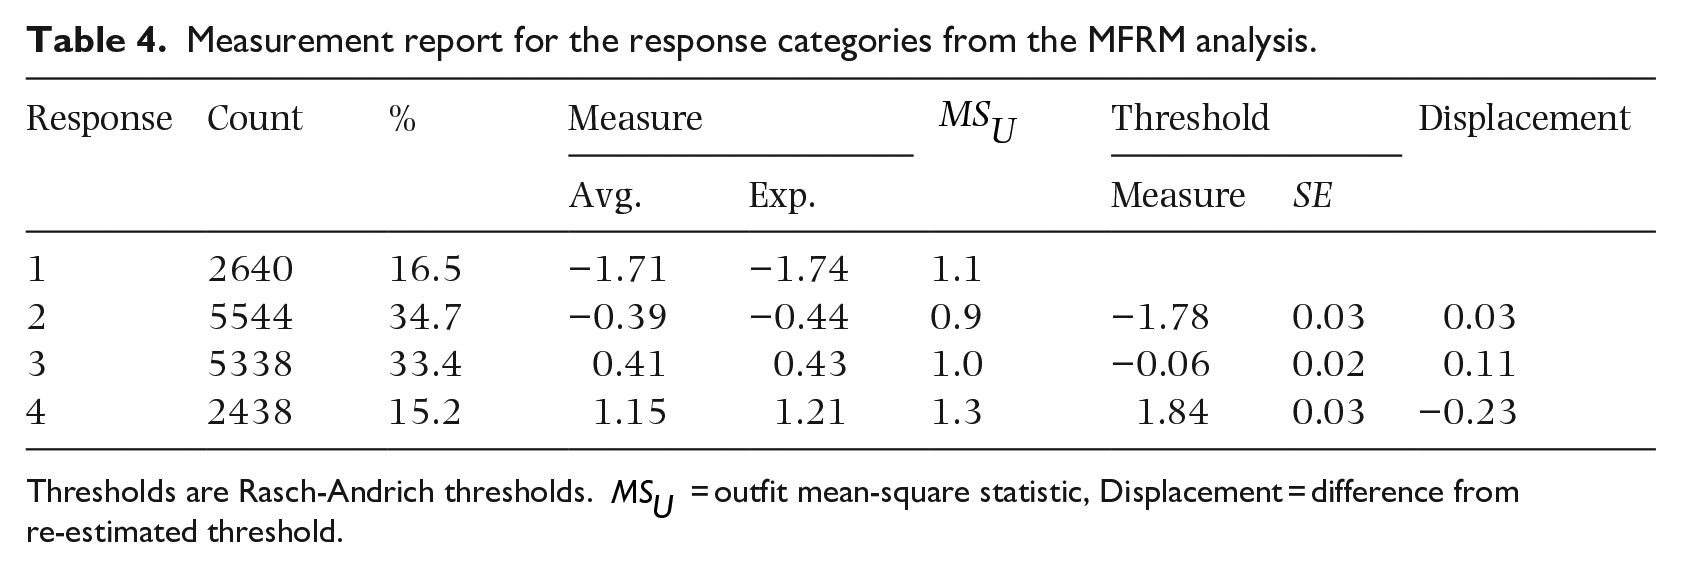
Thresholds are Rasch-Andrich thresholds.
Person measure and mean IMEI score correlation
As can be seen in Figure 4, the 57 data points follow a rising trend. Due to their limited number and distribution, it is difficult to say whether the data points follow a slightly S-shaped arrangement as reported by Wycisk et al. (2022) for the data set used in the online development of the IMEI. The correlation resulted in a high positive value of r(55) = .903, p < .001 (one-sided), 95% CI [.852, 1].
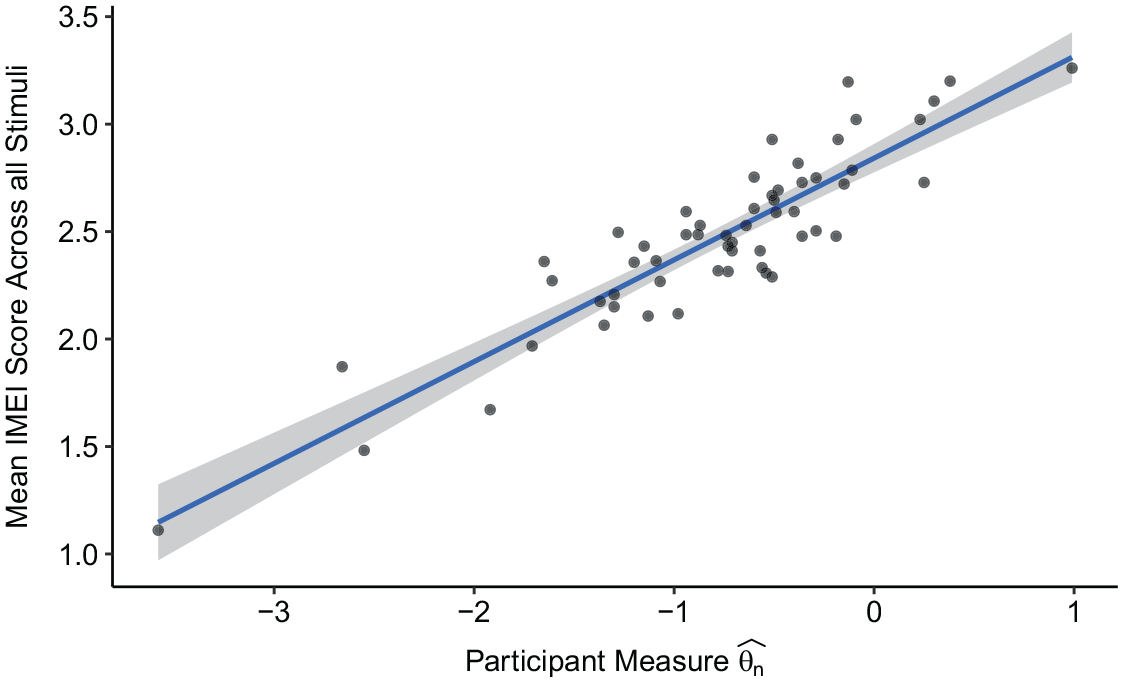
Scatterplot for the mean IMEI score across all stimuli and the participant measure.
Invariance
As in the study-wise CFAs, all invariance models based on the subsets of data from both studies showed a significant χ2 test of exact fit. Again, multivariate normality was not present in the data, and we focus on the approximate fit indices. Considering individual model fit, the models with fixed intercept (strictly parallel and strictly tau-equivalent) did not fit the data well according to CFI, TLI, SRMR and robust RMSEA (see Table 5) and are not considered further. For all remaining models, the fit measures indicated adequate to good fit, with the exception of robust RMSEA, which at least did not indicate poor fit (⩾ .10; Keith, 2015). Individually, the congeneric, the essentially tau-equivalent, and the essentially parallel measurement models for metric and scalar invariance fit the data.
Fit indices of the invariance models.
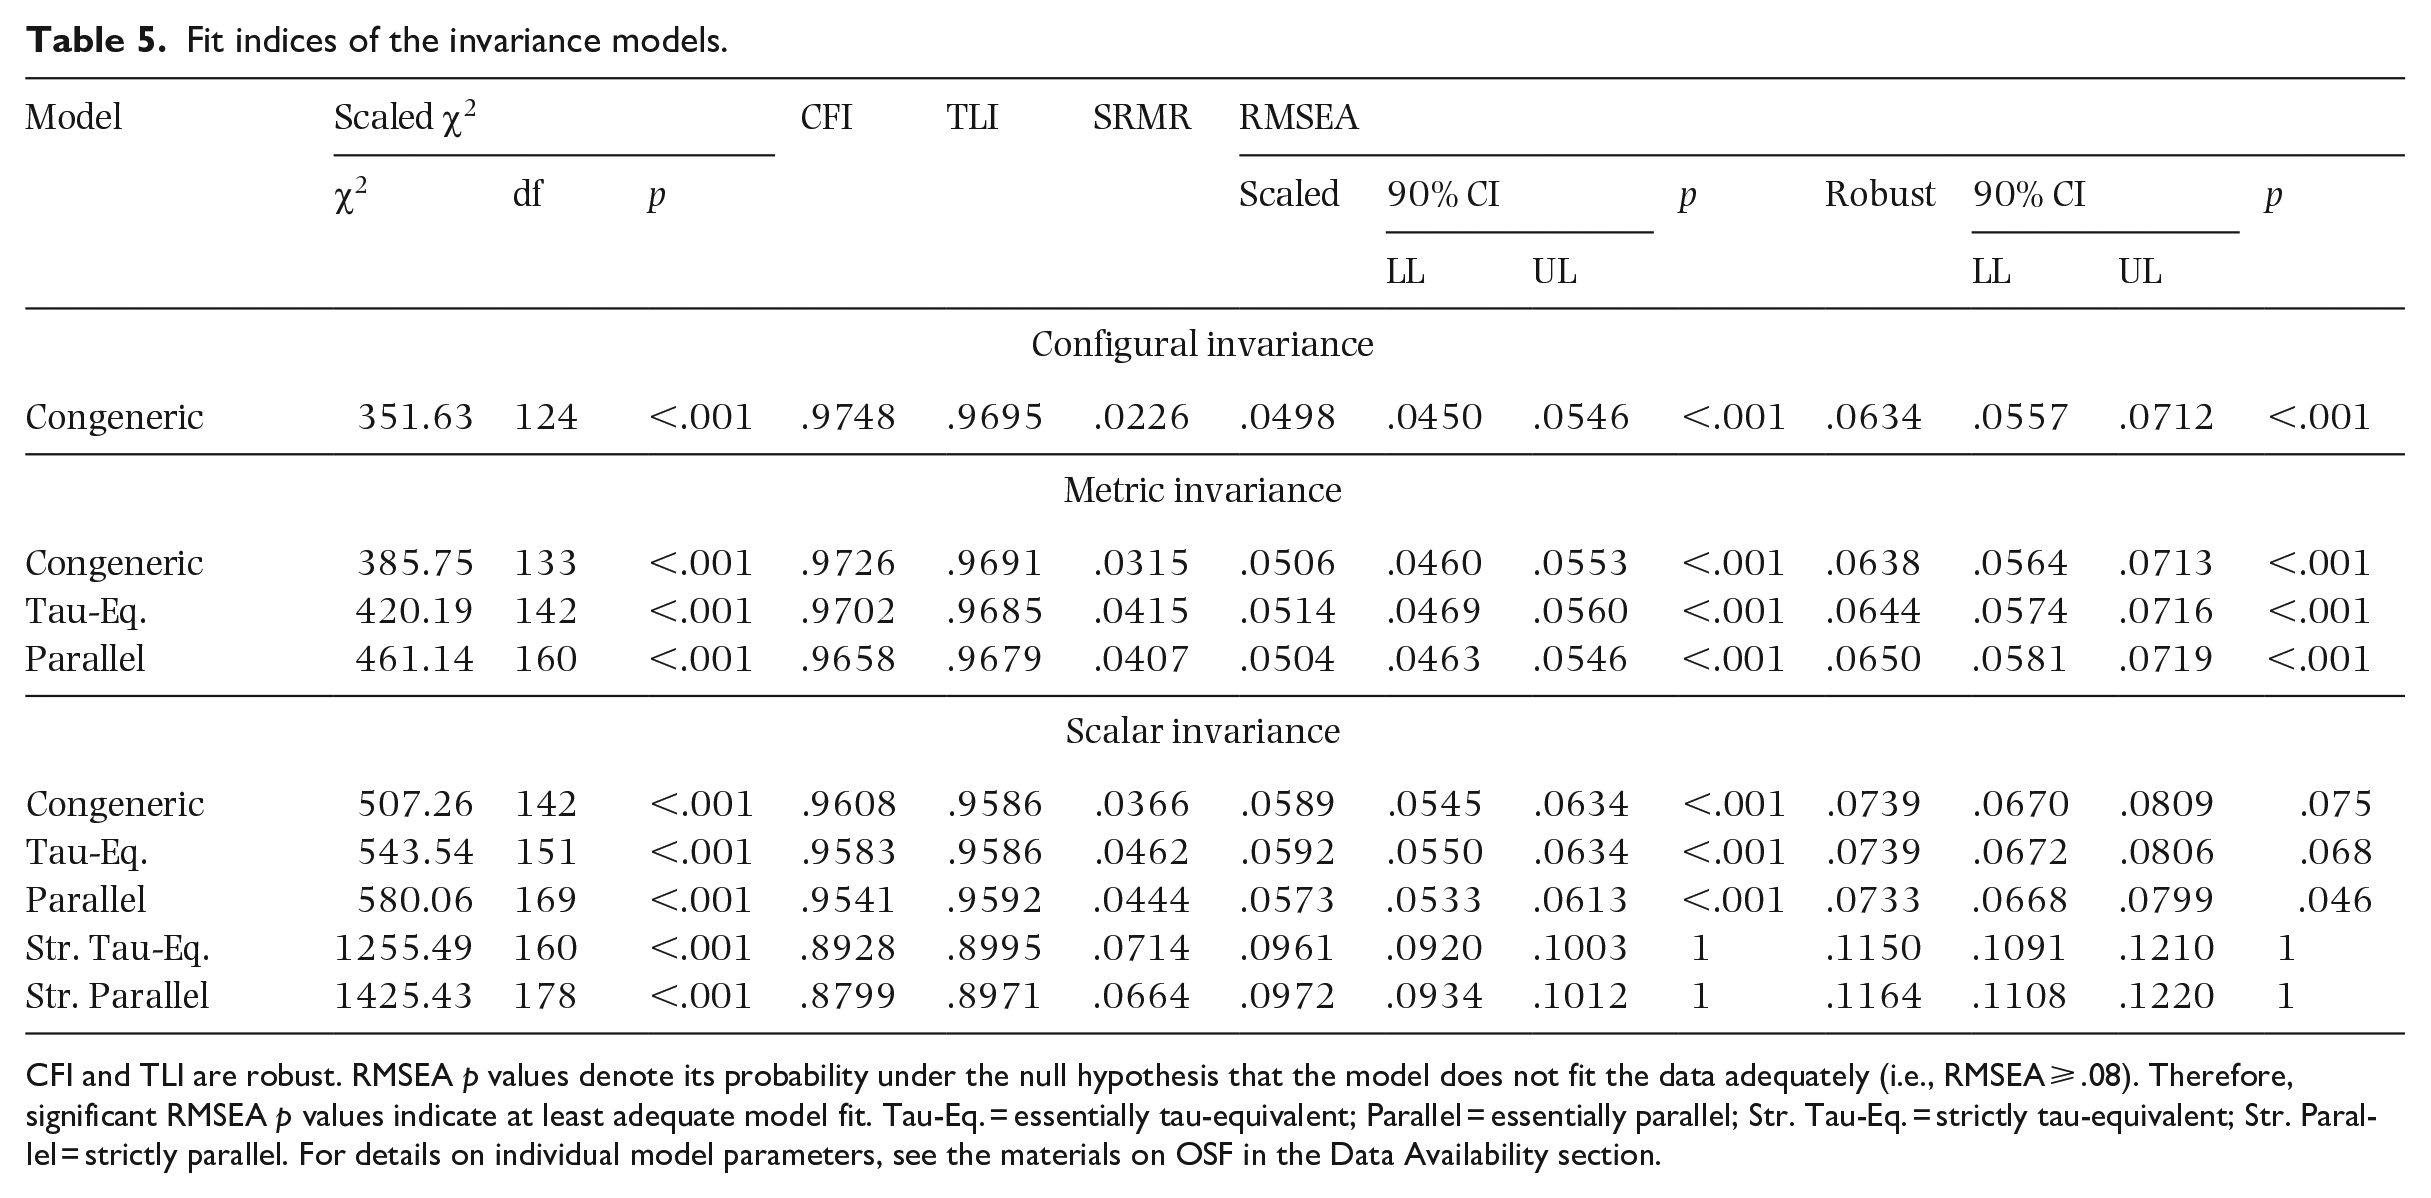
CFI and TLI are robust. RMSEA p values denote its probability under the null hypothesis that the model does not fit the data adequately (i.e., RMSEA ⩾ .08). Therefore, significant RMSEA p values indicate at least adequate model fit. Tau-Eq. = essentially tau-equivalent; Parallel = essentially parallel; Str. Tau-Eq. = strictly tau-equivalent; Str. Parallel = strictly parallel. For details on individual model parameters, see the materials on OSF in the Data Availability section.
Concerning the differences between the congeneric configural invariance model as a reference and the remaining metric invariance models without fixed intercepts (for details see Table S8), metric invariance could be established according to cutoff criteria for CFI and RMSEA (ΔCFI ⩾ −.01, ΔRMSEA ⩽ .01; Sass & Schmitt, 2013, p. 323). Absolute TLI differences, for which there are no cutoff values, but which should be as close to 0 as possible (Sass & Schmitt, 2013), were also low (<.002) further supporting the presence of metric invariance. However, the differences in SRMR lend more support to the congeneric metric invariance model (ΔSRMR ⩽ .015; Sass & Schmitt, 2013, p. 323). For the scalar invariance models, all scaled RMSEA and the robust RMSEA of only the essentially parallel model meet the difference cutoff criterion. CFI differences were all above the proposed criterion, whereas the SRMR difference of the congeneric scalar invariance model was below the cutoff value. Absolute TLI differences were not as low as for the metric invariance models but were still below .011. According to the provided cutoff criteria, the evidence for scalar invariance is mixed. Nevertheless, the individual model fit of the scalar invariance models is good according to the majority of fit measures. It should also be noted that the invariance-testing data contain only a subset of the data from each study. Therefore, we argue, measurement invariance can be cautiously assumed.
Comparison of online and laboratory data
As shown in Figure 5, the Wright Map of the MFRM analysis, the audio formats were in the same order as in the development of the IMEI (Mono < Stereo < 3D; for details see Table S9). Figure 5 also shows that the order of the shared pieces Die Hantel and Variations on a Rococo Theme was the same in both studies,
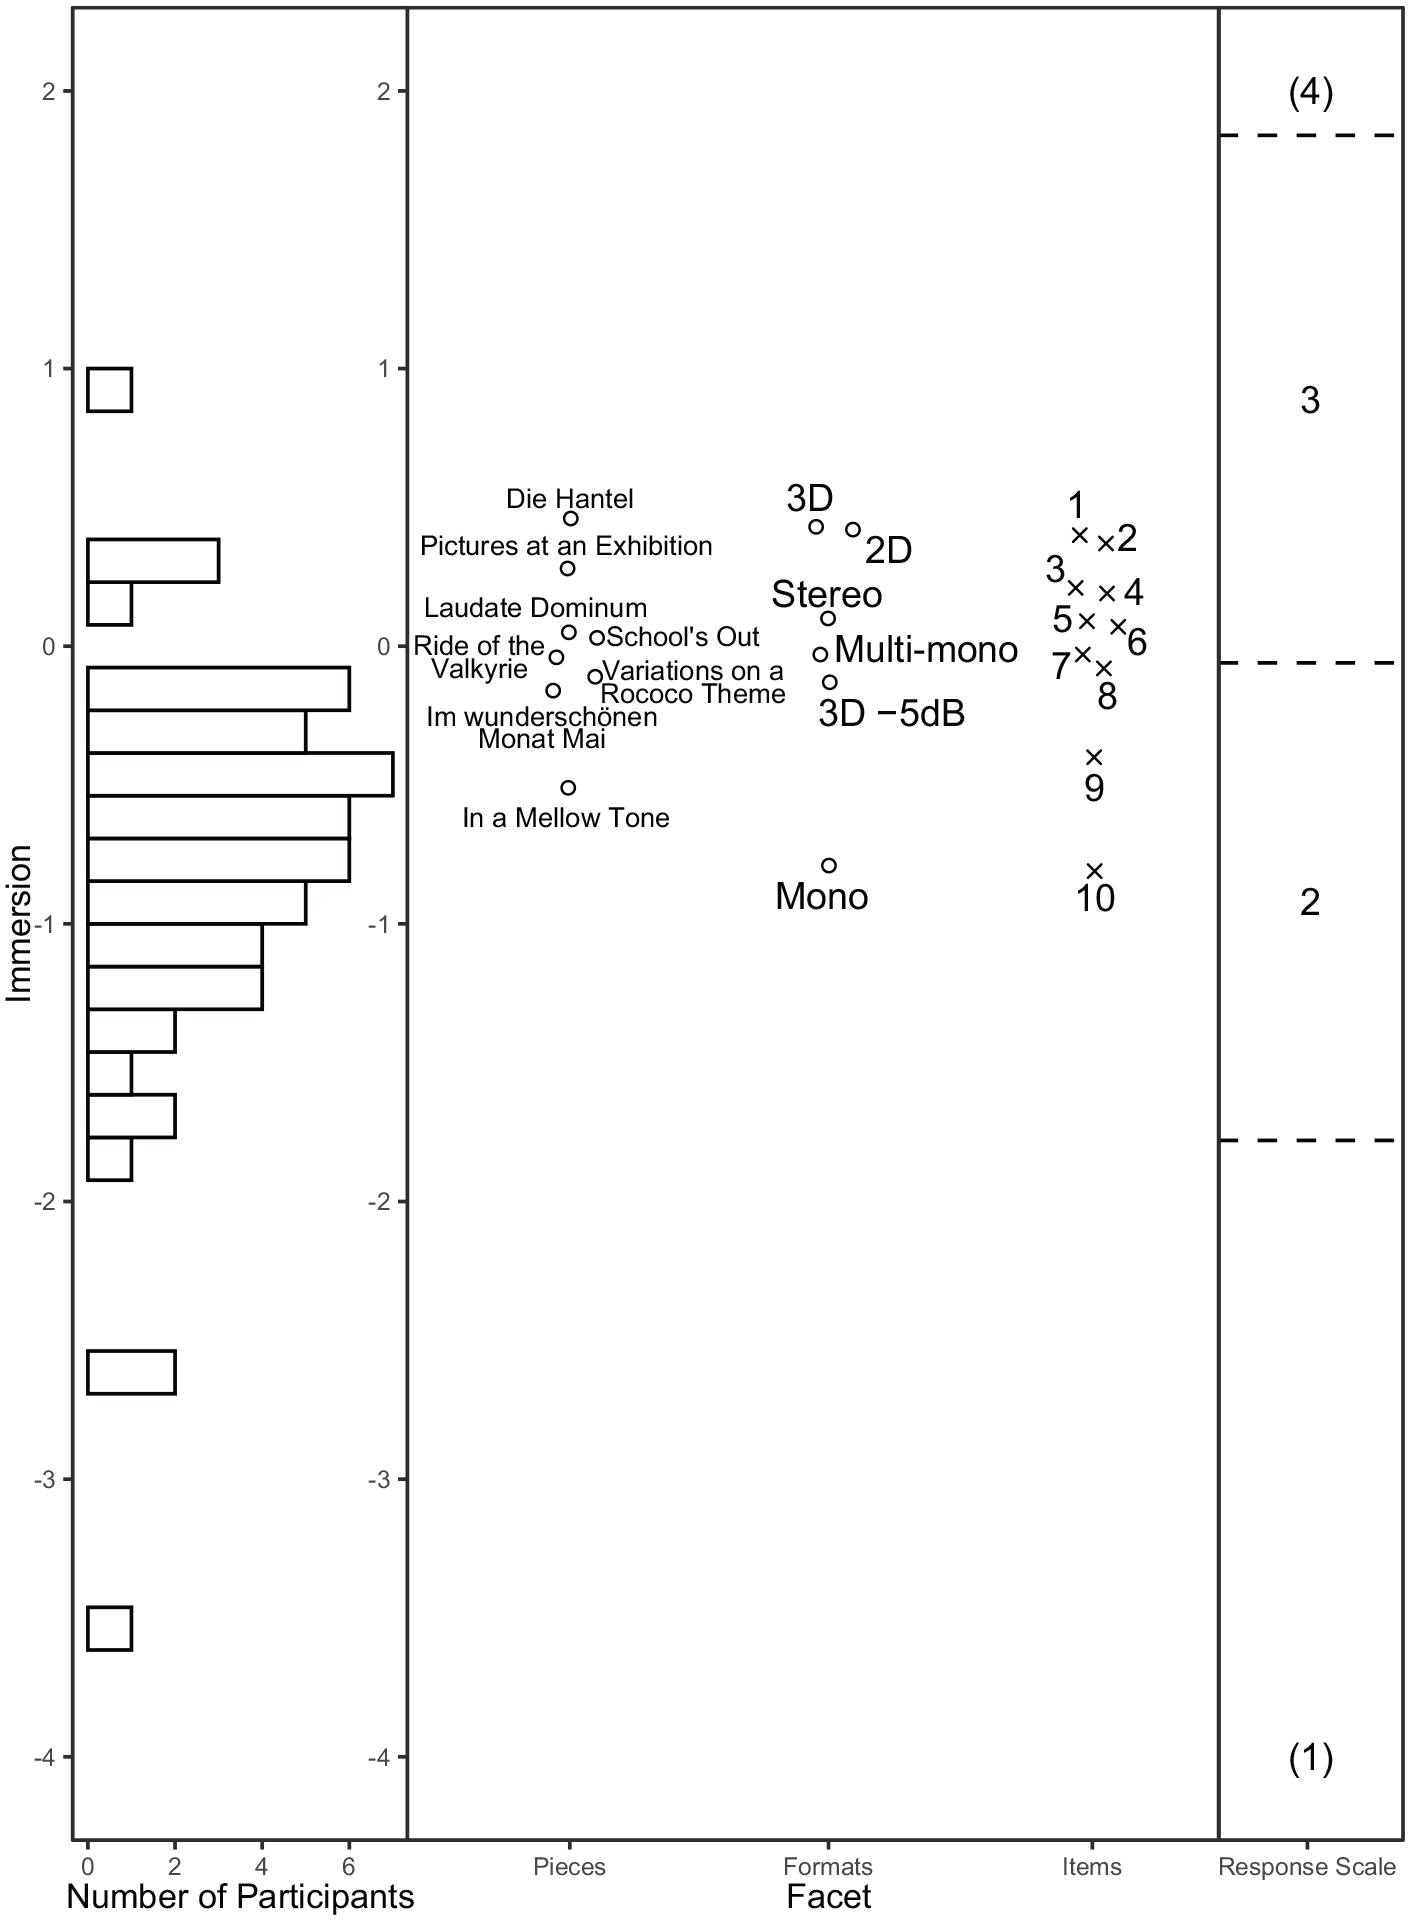
Wright map of the MFRM analysis of data from the laboratory study.
Considering the regression coefficients from the CFA models, mono and 3D audio were significantly different from stereo in both studies across all model variants (for details see Tables S11, S12, and S13). The coefficients indicated the same order of the formats as in the MFRM analysis across studies, such that 3D audio predicted a higher score for immersive music experience than stereo, whereas mono audio predicted a lower score. By contrast, the actual differences between mono and stereo, and 3D audio and stereo, were higher in the laboratory study, βmono = −0.49, β3D = 0.19, than in the online study, βmono = −0.33, β3D = 0.07 (regression coefficients from the essentially parallel model; these coefficients differ only marginally from those of the other model variants). Considering the regression coefficients of the pieces, no significant differences between Die Hantel and the remaining pieces were found except for In a Mellow Tone.
As can be seen in Figure 6, the IMEI scores of the shared pieces in the shared audio formats were similar in both studies. Also, the mean IMEI scores across the formats for the pieces were almost the same, Die Hantel: MLab = 2.37, MOnline = 2.40; Variations on a Rococo Theme: MLab = 2.35, MOnline = 2.46. Nevertheless, there was a wider range of mean IMEI scores for the formats in the laboratory study than in the online study. The data can be conceptualized as a 2 × 2 × 3 within-between design where study (online, laboratory) represents the between factor, and piece (Die Hantel, Variations on a Rococo Theme) and audio format (mono, stereo, 3D audio) represent the within factors. The corresponding repeated-measures ANOVA revealed a significant main effect of audio format, F(2, 490) = 93.8, p < .001, ηp2 = .277, corresponding to a medium effect size according to common benchmarks (Ellis, 2010). Furthermore, there were significant interactions between audio format and study, F(2, 490) = 4.8, p = .008, ηp2 = .019, and audio format and piece, F(2, 490) = 5.8, p = .003, ηp2 = .023, corresponding to small effects. None of the remaining main or interaction effects were significant (for details see the materials on OSF in the Data Availability section).
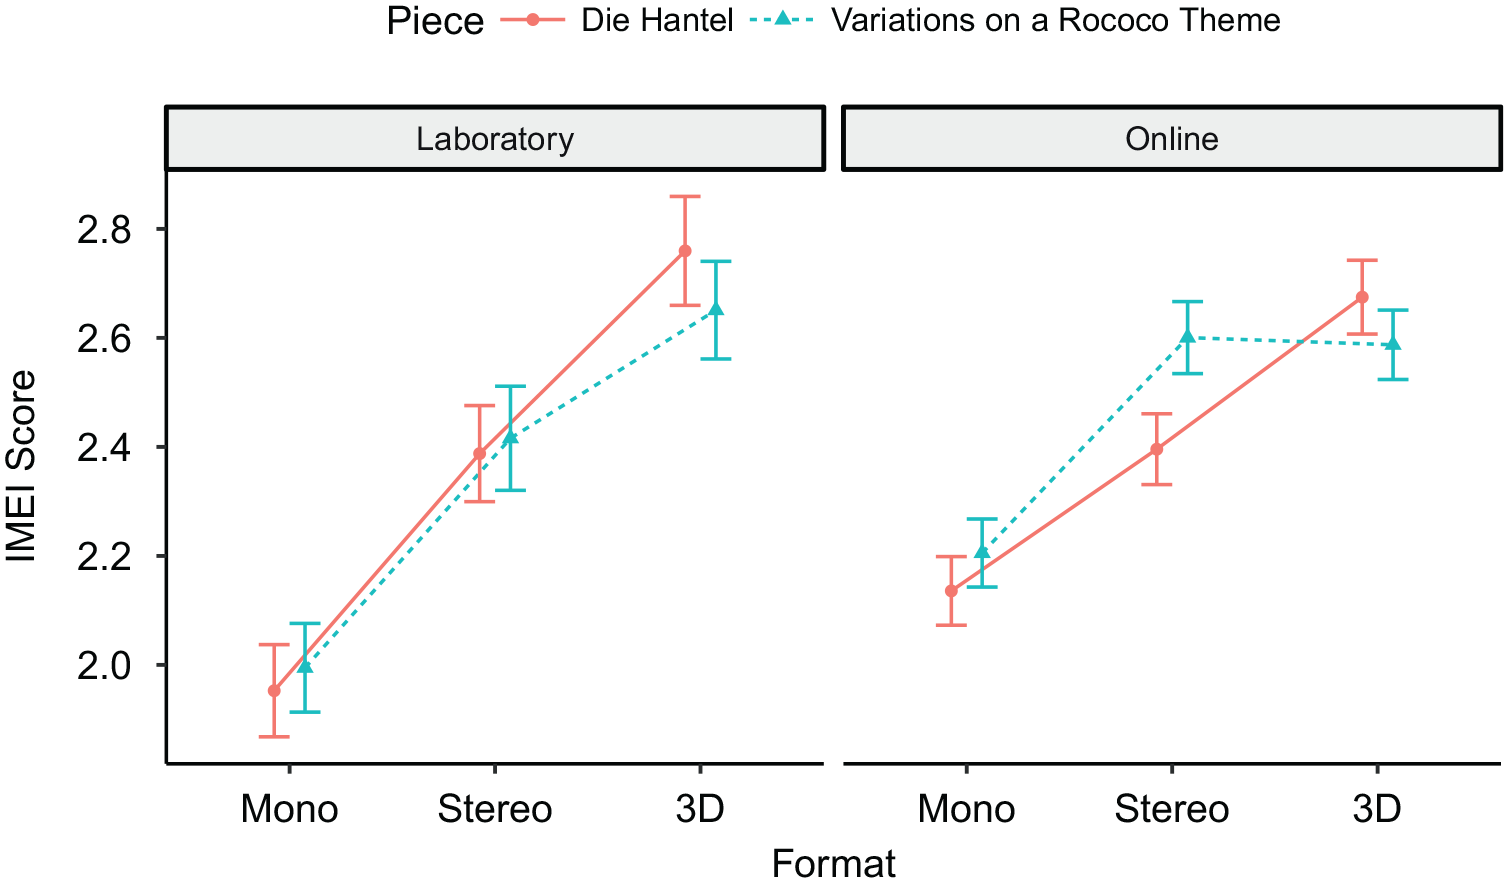
Mean IMEI scores for the shared pieces in the shared formats of both studies.
The results of the ANOVA were checked with additional SEM based on the essentially parallel measurement model for scalar invariance. Therefore, a full model encompassing all possible main and interaction effects was estimated. Subsequently, models without specific effects were compared to the full model to mimic the ANOVA. This procedure is similar but not equivalent to the pairwise F test of regression models. As in the ANOVA, the main effect of audio format was clearly evident. Its removal from the model resulted in considerable misfit (for details see Table S14). This was also true for the interaction between audio format and piece, although the effect was not quite as strong. The interaction between audio format and study, and also the main effect of piece, showed a similar trend.
Additionally, a model including only the significant effects from the ANOVA was estimated and provided good fit, CFI = .9545, TLI = .9588; SRMR = .0420; RMSEA scaled = .0507, RMSEA robust = .0655. Compared to the full model, it did not introduce considerable misfit, Δχ2 = 7.52, Δdf = 5, p = .185. Furthermore, the model reflecting the significant effects revealed by the ANOVA slightly outperformed the full model on TLI and RMSEA.
Discussion
In the first part of this study, we validated the IMEI in a laboratory setting with loudspeaker playback. Unidimensionality can be inferred from the results of the CFA and PCAR analyses of the IMEI items. It is also supported by the reanalysis of the data from the online study. The MFRM analysis resulted in a good model fit, both globally and for the items and the response scale in particular. Additionally, both data sets showed the IMEI to have excellent reliability. The analysis of invariance provided full support for the metric invariance of the essentially parallel measurement model of the IMEI across the online and laboratory studies, and most of the fit indices even indicated the presence of scalar invariance. We therefore conclude that there was measurement invariance and consider the validation to have been successful. In line with Sijtsma et al. (2024), we also conclude that using a sum score for the IMEI is supported by the good fit of the MFRM model as a member of IRT models, as well as by the axioms and factor analyses of CTT. This conclusion also shows that using appropriate control mechanisms in an online study, such as the HALT (Wycisk et al., 2023, 2024), can produce results that are consistent with those obtained in a standardized laboratory environment.
In the second part of the study, we compared our results for the stimuli used in both studies with those obtained in the online study. IMEI ratings in the laboratory study were more extreme than in the online study. On the one hand, the presentation of stimuli in a 3D audio format played through loudspeakers seemed to elicit a stronger emotional response than presentation through headphones (see Figure 6), perhaps because participants heard the acoustic not only of the room in which the recording was made but also the room in which it was played back. Generally, this may produce a stronger perception of spatiality—even in playback rooms lacking the excellent acoustics of the IML—producing higher IMEI ratings. The 3D audio format played through headphones may also have had less impact on participants in the online study since they would have been deprived of the bodily experience of listening to the bass range of the stimuli played through loudspeakers. On the other hand, IMEI ratings were lower for mono-format stimuli played through loudspeakers than through headphones. If the experience of immersion is related at least in part to the perception of spatiality or of sounds coming from multiple directions, this could be explained by possible differences between the way the audio formats are perceived in the two playback conditions. While listeners perceive the sound image of a mono-format signal played through a loudspeaker as emanating from that speaker (Geluso, 2018), they perceive the same signal presented to both ears through headphones as being located between their ears. In the online study this “inside-the-head locatedness” (Roginska, 2018, p. 91) might have enhanced the experience of listening to mono audio but compromised the immersive experience of listening to 3D audio through headphones. However, we found only small differences between IMEI ratings in the headphones and loudspeaker conditions.
Overall, our comparison of IMEI ratings in the laboratory and online studies supports the conclusion that the IMEI is a reliable tool for measuring immersive musical experience in both loudspeaker and headphone conditions, provided that the playback device is controlled (e.g., by the HALT; Wycisk et al., 2023, 2024).
With regard to the psychometric characteristics of the IMEI, we conclude that it is not only valid in both online and laboratory settings but its central features (e.g., reliability, item-, and response-scale quality characteristics) are very similar, according to both CTT and IRT-based approaches. Indeed, the data obtained from the application of IMEI in the online and laboratory settings can be described as convergent. That is, the immersive listening experience is highly similar regardless of the playback device used. One outstanding issue is that there is currently no tool for measuring binaural loudness objectively, which means that loudness cannot be controlled reliably in the two conditions. This issue remains to be resolved in future research.
In conclusion, our findings are relevant to future studies on immersive music experiences (e.g., virtual reality, gaming) irrespective of whether they are conducted online or in the laboratory. Finally, we recommend the IMEI as a measurement tool with excellent psychometric properties that will be useful for the psychological evaluation of audio formats and could help to replace the widely distributed use of single-item scales with unknown psychometric properties for evaluating listening experiences (e.g., Eaton & Lee, 2022; Schoeffler et al., 2017).
Supplemental Material
sj-pdf-1-msx-10.1177_10298649251337683 – Supplemental material for Measuring the immersive music listening experience: Convergence of online and laboratory data
Supplemental material, sj-pdf-1-msx-10.1177_10298649251337683 for Measuring the immersive music listening experience: Convergence of online and laboratory data by Kilian Vogt, Yves Wycisk, Friedrich Platz and Reinhard Kopiez in Musicae Scientiae
Footnotes
Funding
The authors disclosed receipt of the following financial support for the research, authorship, and/or publication of this article: This work was supported by a research grant from “Niedersächsisches Vorab,” a joint program funded by the Volkswagen Foundation in conjunction with the Lower Saxony Ministry for Science and Culture (funding reference: ZN3497) awarded to R.K.
Supplemental material
Supplemental material for this article is available online.
References
Supplementary Material
Please find the following supplemental material available below.
For Open Access articles published under a Creative Commons License, all supplemental material carries the same license as the article it is associated with.
For non-Open Access articles published, all supplemental material carries a non-exclusive license, and permission requests for re-use of supplemental material or any part of supplemental material shall be sent directly to the copyright owner as specified in the copyright notice associated with the article.