
Abstract
This study investigated the perception and learning of relative pitch using vibrotactile stimuli by musicians with and without a hearing impairment. Notes from C3 to B4 were presented to the fingertip and forefoot. Pre- and post-training tests in which 420 pairs of notes were presented randomly were carried out without any feedback to participants. After the pre-training test, 16 short training sessions were carried out over six weeks with 72 pairs of notes per session and participants told whether their answers were correct. For amateur and professional musicians with normal hearing and professional musicians with a severe or profound hearing loss, larger pitch intervals were easier to identify correctly than smaller intervals. Musicians with normal hearing had a high success rate for relative pitch discrimination as shown by pre- and post-training tests, and when using the fingertips, there was no significant difference between amateur and professional musicians. After training, median scores on the tests in which stimuli were presented to the fingertip and forefoot were >70% for intervals of 3–12 semitones. Training sessions reduced the variability in the responses of amateur and professional musicians with normal hearing and improved their overall ability. There was no significant difference between the relative pitch discrimination abilities between one and 11 semitones, as shown by the pre-training test, of professional musicians with and without a severe/profound hearing loss. These findings indicate that there is potential for vibration to be used to facilitate group musical performance and music education in schools for the deaf.
Previous work (Hopkins et al., 2016) has indicated that vibrotactile feedback (i.e., vibration) could be presented at safe levels to facilitate interaction between musicians with a hearing impairment and other musicians, with and without normal hearing, during group performance. For musicians with normal hearing who use amplification when performing, vibrotactile feedback could be used to supplement the use of in-ear or floor monitors at lower listening levels, thus reducing the risk of noise induced hearing loss. For musicians with hearing impairments there is the potential to facilitate group improvisation, rehearsal and performance by transmitting different vibration signals from the instruments to different musicians. Vibrotactile stimuli could augment or replace auditory information for musicians who use hearing aid technology or cochlear implants; whilst these devices increase the audibility of music, they can also distort it because they are primarily designed for speech (Chasin & Hockley, 2014; Limb & Roy, 2014). This article investigates the perception of pitch by musicians in the vibrotactile mode using the glabrous (i.e., non-hairy) skin on fingertips and forefeet. It is relative pitch rather than absolute pitch that facilitates both solo and group performance (see, e.g., Miyazaki, 1992); hence this study investigates the perception and learning of relative pitch, which is defined as the ability to distinguish one note as being higher or lower than another.
The reason to investigate glabrous skin of the hands and feet in this study is that it is more sensitive than hairy skin and therefore has lower detection thresholds for vibration (Verrillo, 1966). For a singer it is feasible to use the fingertips or hand during performance whereas the soles of the feet are a practical option for those playing many (but not all) types of musical instruments. Perception of vibration on glabrous skin is mediated by a Pacinian channel and three non-Pacinian channels for which suprathreshold stimulation can simultaneously activate two or more of these channels (Bolanowski et al., 1988). The Pacinian mechanoreceptors that respond to a vibration stimulus are found deep beneath the glabrous skin of the hands and feet; they typically respond at frequencies between 40 and 800 Hz and are capable of temporal and spatial summation (Bolanowski et al., 1988). For this reason, the Pacinian channel is most relevant to the perception of musical notes although the non-Pacinian channels can still have an effect on the lowest detection thresholds for vibration (Gescheider et al., 1978).
Vibrotactile perception of pitch depends in part on the amplitude of the stimulus (von Békésy, 1957), which is perceived to vary at different sites on the human body and different skin temperatures (von Békésy, 1962). Geldard (1960) noted, accordingly, that intensity has to be controlled if frequency is to be discriminated. Kirman (1973) reviewed attempts to present speech to the skin in the form of vibrotactile stimuli. These were largely unsatisfactory, firstly because of the temporal limitations of the skin compared to the ear (von Békésy, 1959) for linguistically relevant information over the frequency range from 200 Hz to 3.5k Hz; secondly, because adequate stimuli could not be produced by the electromechanical devices and procedures in use at the time of the review. To assess the extent to which a musician with normal hearing might be able to use vibrotactile as well as auditory feedback to enhance tonal control of their instrument or voice, Verrillo (1992) reviewed the findings of fundamental research on vibrotactile perception that he and his colleagues had carried out at the Institute for Sensory Research (Syracuse University, USA). He concluded that vibration signals are not only likely to be available but could well be useful to a musician for controlling tone. He also noted that significant gaps remained in our knowledge of vibrotactile sensitivity over different areas of the body as well as on the vibration of instruments. Finally, it must be acknowledged that the potential masking effects of other musicians’ instruments add to the complexity of vibrotactile pitch perception in the context of musical performance (Verrillo, 1992) and these are not considered here.
A number of studies have investigated discrimination of frequencies presented in the vibrotactile mode to assess the potential for the vibrotactile perception of speech and musical stimuli. Goff (1967) carried out experiments to assess frequency discrimination using vibrotactile stimuli presented to the fingertip at frequencies between 25 Hz and 200 Hz at levels of 20 dB and 35 dB above threshold. Participants were asked to match the frequency of two sinusoids. Goff (1967) showed that frequency discrimination only started to approach the accuracy possible with auditory discrimination below 50 Hz, whereas above 50 Hz the Weber fraction (defined as the ratio of the Just Noticeable Difference (JND) over the baseline frequency) tended to increase with increasing frequency up to 0.55 at 200 Hz when presented 20 dB above threshold. These findings seemingly indicate that it would be very difficult, if not impossible, to identify pitch changes of up to seven semitones using vibrotactile feedback. However, it is difficult to draw conclusions from this work, in which Pacinian and non-Pacinian receptors were activated. Franzén and Nordmark (1975) assessed frequency discrimination using trains of half-sinusoid pulses at frequencies between 1 and 384 Hz, which were presented to the fingertip. This indicated a temporal resolution that was notably more accurate than in the study by Goff (1967) and subsequent studies also indicated that discrimination was better than reported in Goff’s experiments (Verrillo, 1992). Rothenberg et al. (1977) give a critique of Franzén and Nordmark’s experiments. They describe how their methodology yielded a parameter that was not actually the JND but a parameter proportional to the participant’s uncertainty about the JND. They assessed frequency discrimination using the thenar eminence, distal pad of the middle finger and the left volar forearm for participants with normal hearing using both sinusoids and pulses. This showed that discrimination was better for pulses than sinusoids and that the JND tended to increase with increasing frequency. For the forearm (which is less sensitive than the fingertip) these JNDs were lower than those determined by Goff (1967) using the fingertip. They concluded that it should be feasible for people with a hearing impairment to encode some aspects of speech using the forearm and the fingertip to discriminate vibrotactile frequencies.
Experimental evidence for sinusoidal stimuli on glabrous skin indicates that the Weber fraction is approximately constant between 20 Hz and 200 Hz with a tendency to decrease slightly with increasing frequency (Franzén and Nordmark, 1975; Mahns et al., 2006; Mountcastle et al., 1969; Rothenberg et al., 1977). Bensmaïa et al. (2005) proposed a psychophysical model to characterize the Pacinian-mediated representation of any stimulus using a set of frequency-tuned mini-channels. The frequency range under consideration was from 100 Hz to 400 Hz. This corresponds to musical notes from G2 to G4, a range that includes the fundamental frequency of most musical instruments (except sub-bass in electronic music). Bensmaïa et al.’s model was validated by experiments and gave a predicted (frequency-independent) Weber fraction of 0.22. Deco et al. (2007) developed a neurophysiological model based on lower frequencies for which their experimental data for 20, 30 and 40 Hz gave an average Weber fraction of 0.14; however, these frequencies are below the note E1 and 40 Hz is the lowest frequency at which Pacinian mechanoreceptors typically respond. Hence, considering that the Weber fraction for intervals of one, two and three semitones would lie below the value of 0.22 from Bensmaïa et al. (2005) it is reasonable to expect these intervals to be difficult if not impossible to perceive using vibrotactile feedback. This is in contrast to the auditory mode: Zarate et al. (2012) have shown that musicians’ discrimination of pitch intervals begins to improve when the intervals are a semitone or more, but non-musicians’ discrimination begins to improve only when intervals are larger than a semitone.
A sensorineural hearing loss causes changes in the ear that adversely affect auditory pitch perception (Moore and Carlyon, 2005). Gengel (1969) tested the frequency discrimination of children with and without hearing impairments to establish JNDs for tones of 250 Hz and 500 Hz. This confirmed that children with hearing impairments did not discriminate as well as children with normal hearing, but that some improvement was possible with only a few practice sessions. Gfeller et al. (2002) investigated melody recognition and pitch perception by adults with cochlear implants. It was shown that adults with normal hearing were significantly better at recognising familiar melodies than adults with cochlear implants. In a discrimination test using pairs of piano notes covering a three-octave range, it was found that adults with normal hearing had an average discrimination threshold of 1.1 semitones compared with 7.6 semitones for adults with cochlear implants (although they demonstrated a wide range of abilities). Looi et al. (2008) showed that adults using a hearing aid had better auditory pitch perception than adults with a cochlear implant, and that adults with hearing impairments had significantly poorer perception than those with normal hearing. To assess the ability of adults with hearing impairments to discriminate vibrotactile frequencies, Looi et al. (2008) attempted to carry out their warble-tone frequency discrimination tests on two participants with a profound hearing loss but the tests were abandoned due to the participants’ lack of experience in interpreting vibrotactile frequencies. Levänen et al. (1998) used magnetoencephalography to show that the parts of the brain normally used for processing auditory pitch were recruited when a congenitally deaf adult was asked to discriminate between two pitches presented as vibrations to the palm and fingers. Levänen and Hamdorf (2001) compared the frequency discrimination abilities of participants with normal hearing and those with congenital, profound deafness. The latter were found to be significantly better at detecting frequency changes occurring randomly within an otherwise monotonous sequence of 250 Hz stimuli. The authors suggested that this could be explained by neural plasticity and increased attention to the stimuli. However, there is no clear link between these findings and relative pitch for the perception of musical notes. Caetano and Jousmäki (2006) applied 200 Hz vibration to the fingertips of 11 participants with normal hearing and used whole-scalp magnetoencephalography to show activity in auditory areas of the brain similar to that produced by auditory stimuli. This suggests that the involvement of the auditory cortex in vibration perception is not exclusive to congenitally deaf people and that the extent to which neural plasticity in the auditory cortex is attributable to congenital deafness and responsible for the perception of vibration is not yet fully understood.
Imai et al. (2003) demonstrated the potential for simple training exercises to be used for improving the vibrotactile frequency discrimination, at around 20 Hz, of participants with normal hearing. Pairs of tones were presented as vibrotactile stimuli and participants were told whether they had correctly identified the tones as being the same or different. After only 15 days of training, their tactile discrimination had improved, with tactile acuity transferred to the neighbouring fingers and, to a lesser extent, to the other fingers of both hands. However, this transferability does not apply to all aspects of vibrotactile exposure, as indicated by Gescheider and Wright (2012) who tested thresholds at two frequencies: a 250 Hz stimulus to target the Pacinian channel and a 20 Hz stimulus to target the non-Pacinian channel. They found that improvements to thresholds were not transferred from one hand to another or between channels. Improvements did, however, transfer to different intensity levels within the same channel.
Egloff et al. (2018) used sinusoidal signals to investigate vibrotactile presentation of ascending melodic intervals to the fingertip and flank of normal hearing participants, some of whom were musically skilled. The discrimination task used notes from C2 to G2 with intervals from unison to a perfect fifth ascending from the root note (C2). This range of notes corresponds to frequencies between 65 Hz and 97.4 Hz which would optimally activate the Pacinian mechanoreceptors on the fingertip. The results showed that accuracy was higher for the fingertip than the flank, and that accuracy increased with increasing interval size, as shown in previous work (e.g., see Horch, 1991). Based on a criterion of 75% accuracy, the smallest ascending interval that participants were able to identify was two semitones.
While sinusoidal stimuli were used in the majority of the work discussed above, most musical instruments produce complex tones. To investigate pitch discrimination with vibrotactile stimuli, some studies have introduced timbre using square or sawtooth waves that contain different harmonics of the fundamental frequency; these could be considered as representing artificial musical instruments. Branje et al. (2010) used a loudspeaker to present vibration with square waves to the backs (i.e., non-glabrous skin) of four participants with normal hearing. The notes C and F sharp were used as anchor frequencies in the range C2 to C6 with the stimulus starting five semitones above or below the anchor frequency. First, participants were asked whether the stimulus was higher or lower in frequency than the anchor; then the stimulus was raised or lowered by a semitone in a direction that was constant in relation to the anchor. The average JND increased as the frequency of the anchor increased, indicating better frequency discrimination than shown in other studies. This was attributed to the large contact area of the loudspeaker (10.2 cm diameter) although the contact condition between the loudspeaker cone and its circular surround with the skin is potentially quite complex. Loudspeakers are not ideal for the precise, controlled presentation of vibrotactile stimuli because the extent of damping by the skin or clothing is unknown, and also because they are designed to have a relatively flat frequency response for radiation of sound into air rather than vibration into the skin. No evidence was provided to demonstrate that the loudspeakers delivered the same spectral content to the skin as the original signal; hence the findings could be specific to their equipment. Young et al. (2016) assessed vibrotactile frequency discrimination in musicians and non-musicians using sinusoids, sawtooth and square waves as stimuli. They chose to use frequencies and frequency shifts that did not correspond to standard musical notes or intervals to avoid any advantage the musicians may have had from their previous experience. The results showed that, when asked to say whether one pitch is higher or lower than another, it may be advantageous for a musician to receive vibrotactile feedback at the same time as the auditory stimulus. Same-different tests have been used to assess whether it is possible to discriminate between different timbres. Russo et al. (2012) demonstrated that participants with and without hearing impairments can discriminate musical timbre for different stimuli (cello, piano, trombone and simulated timbres with different intensity partials). Senkow et al. (2018) investigated a simpler form of complex tone that was formed from only two sinusoids; this showed that they are more difficult to discriminate than a single sinusoid. In the auditory mode, there is some evidence that musicians have better pitch perception than non-musicians (Kishon-Rabin et al., 2001; Spiegel and Watson, 1984). In the vibrotactile mode, Sharp et al. (2019) carried out same-different tests which showed that musicians were able to discriminate smaller frequency shifts for sine and square waveforms than non-musicians. This was considered to support the hypothesis that musical training results in improved tactile discrimination.
To assess the effect of multisensory integration on relative pitch, Yau et al. (2009) presented sinusoidal stimuli in the vibrotactile domain with and without auditory stimuli (pure tones and band-pass noise). Participants were asked to identify which of two tones presented to the finger was higher in frequency and were instructed to ignore any auditory distractor. The results showed that auditory stimuli adversely affected vibrotactile frequency perception when the frequencies of auditory and tactile stimuli were similar. This interference effect also occurred with auditory band-pass noise indicating that this was not specific to auditory tones. For a musician performing with other musicians, the implication of Yau et al.’s findings on this cross-sensory effect is that the ability to assess relative pitch is likely to vary during a piece of music depending on the auditory feedback that is available. Considering the potentially confounding effect of auditory feedback alongside the conflicting evidence on what is feasible in terms of frequency discrimination (discussed above), the current study focuses on unisensory presentation of relative pitch in the vibrotactile domain. Our intention was to assess a range of musical notes and intervals to establish what is feasible with and without some basic form of training. Future work on practical implementation of vibrotactile feedback for musicians could then consider whether it would be beneficial for musical signals to be processed to remove any complicating aspects of timbre by filtering out some or all of the partials. For musicians with a hearing impairment, it might also be beneficial for cochlear implants to be temporarily switched off. This suggestion is made on the basis that people using hearing aids tend to perform significantly better on pitch and melody tests than those with cochlear implants (Looi et al., 2008). By focusing on sinusoidal stimuli in this study we are assuming that during musical practice or performance it might be necessary (or beneficial) for signals from musical instruments to be processed in real time to minimise any confounding aspects of timbre by filtering out some or all of the partials.
Aims
This article reports experiments designed to determine the extent to which musicians can correctly identify, and learn to identify, the relative pitch of two tones presented consecutively via vibration to the glabrous skin of the fingertip or forefoot. The range of musical notes was chosen to be within the range of Pacinian receptors for these sites, as determined in previous work (Hopkins et al., 2016). Sinusoidal signals were used to minimise the complexity for the participants as timbre can be a confounding factor (e.g., see Senkow et al., 2018). The main aim was to determine the range of musical intervals for which relative pitch can consistently be identified. It was hypothesised that improvement in relative pitch discrimination could be obtained with simple training sessions and that participants might find it easier to discriminate pitch with the fingertip than the forefoot because those who play a musical instrument tend to touch vibrating surfaces with their hands rather than their feet, and therefore gain heuristic knowledge during their lifetime. For the experiments on the fingertip, a comparison was made between amateur and professional musicians. These experiments were carried out first and as they showed no significant difference between amateur and professional musicians, the decision was made to carry out the experiments on the forefoot with amateur musicians only. In addition, the studies investigated the effect of a severe or profound hearing loss on relative pitch discrimination by professional musicians. This extends the work by Egloff et al. (2018) by considering both ascending and descending intervals, as well as a larger range of notes and intervals over a frequency range where the vibrotactile thresholds on the glabrous skin are similar in level.
For the practical implementation of vibrotactile feedback to musicians it has been proposed to use relatively large contactors without a contactor surround (Hopkins et al., 2016) and these contactors were also used in the research reported in this article. This may have implications for the discrimination of relative pitch because the absence of a contactor surround can give frequency-dependent thresholds in the non-Pacinian channels (Gescheider et al., 1978). For this reason, the results reported in this article are expected to be specific to the contactors that were used.
Design and methods
Procedure
The procedure involved four stages: a short demonstration session, a pre-training test to establish baseline levels of performance, 16 training sessions and a post-training test. The stimuli, pairs of sinusoids corresponding to musical notes, were presented consecutively in each stage. Each of the two note durations were 1s (e.g., a crotchet beat at 60 bpm or a minim beat at 120 bpm) with an inter-stimulus interval of 1 s. The note duration was chosen to be consistent with previous work (Hopkins et al., 2016) in which the vibrotactile thresholds were determined with the same contactors. This is important because the duration of a sinusoidal stimulus and the type of contactor affects the threshold (Verrillo, 1965). These durations are also similar to those used by other researchers (e.g., Yau et al., 2009; Russo et al., 2012).
A two-interval forced choice paradigm was used. After each pair of notes had been presented, participants were asked ‘Is the second tone higher or lower than the first tone?’ Participants were instructed as follows: (1) to use the up-arrow key on a laptop computer if they thought the second tone was higher, and the down arrow key if they thought it was lower, and (2) to respond within a 3 s time window. Note that the word ‘tone’ was used in the instructions because it was thought that both musicians and non-musicians would find it easier to understand.
Measurement of vibrotactile thresholds for the fingertips and forefeet of participants with normal hearing, reported by Hopkins et al. (2016), showed that the threshold curve is relatively flat for notes between C3 and C5 inclusive. For the fingertip, this portion of the curve lies in the trough of the U-shaped curve where the Pacinian corpuscle is most sensitive (Verrillo, 1985), so the range of frequencies chosen for the stimuli used in the present study was from C3 (130.8 Hz) to B4 (493.9 Hz).
Six pairs of intervals were presented in the short demonstration session, lasting less than a minute, to ensure that participants had understood the instructions correctly and to enable them to familiarise themselves with the procedure, while minimising any possible effect of practice.
No feedback was given to participants during the pre- and post-training tests as to whether their responses were correct, incorrect or missing. In each test a total of 420 pairs of notes were presented in random order to the participant during a period of approximately 50 minutes. Regular short pauses were allowed approximately every five minutes with one longer break of up to ten minutes after twenty minutes of testing. The pairs of notes, ascending and descending, ranged from an interval of a single semitone to 12 semitones (one octave) over the frequency range from C3 to B4. The entire set of 420 pairs of notes contained 46, 44, 42, 40, 38, 36, 34, 32, 30, 28, 26 and 24 pairs for intervals of 1, 2, 3, 4, 5, 6, 7, 8, 9, 10, 11 and 12 semitones, respectively. This represented all combinations of tones within the experimental range.
Having completed the pre-training test, participants undertook 16 short training sessions lasting up to 15 minutes each. These sessions were carried out, no more than one per day, over a period of five to six weeks with a maximum inter-session gap of one week. In each session, 72 pairs of notes were presented from the complete set of 420. This involved six permutations chosen randomly from each of the 12 possible intervals. However, once a pair of notes had been presented it was not used again in the same session or any subsequent session until all possible pairs of notes for that particular interval had been exhausted. To facilitate learning during the training sessions, the participant was given feedback via the laptop as to whether each of their responses was correct, incorrect or missing. At the end of each session, the percentage of correct, incorrect or missing responses was shown to the participant.
The skin temperature of each participant’s fingertip or forefoot was measured using an infra-red thermometer (Tenma Type 72-6700) before and after each pre- and post-training test, as well as during the longer breaks that occurred after every 20 minutes; it was also measured before and after each training session. Temperature was deemed acceptable between a range of 24ºC and 36ºC. This was consistent with the threshold measurements reported in (Hopkins et al., 2016) based on the findings of Verrillo and Bolanowski (1986) and Békésy (1962) who found that at temperatures of 22°C and 42°C on the fingertip there was no significant difference in pitch perception at frequencies up to 500 Hz. This range was achievable naturally in the laboratory at room temperature (i.e., without using a device for cooling or warming) and can also be considered representative of the practical situation in which a musician might use vibrotactile feedback. If the participant’s skin temperature was outside this range, then the procedure was halted until it returned inside it.
Test environment and equipment
The experimental set-up is shown in Figure 1. An audiometric booth was used for the study in which stimuli were presented to the fingertip, and a semi-anechoic chamber when presented to the forefoot. Both rooms had low background noise. There were no windows or other potential visual distractions and once the demonstration session had taken place, the participant was alone in the room.
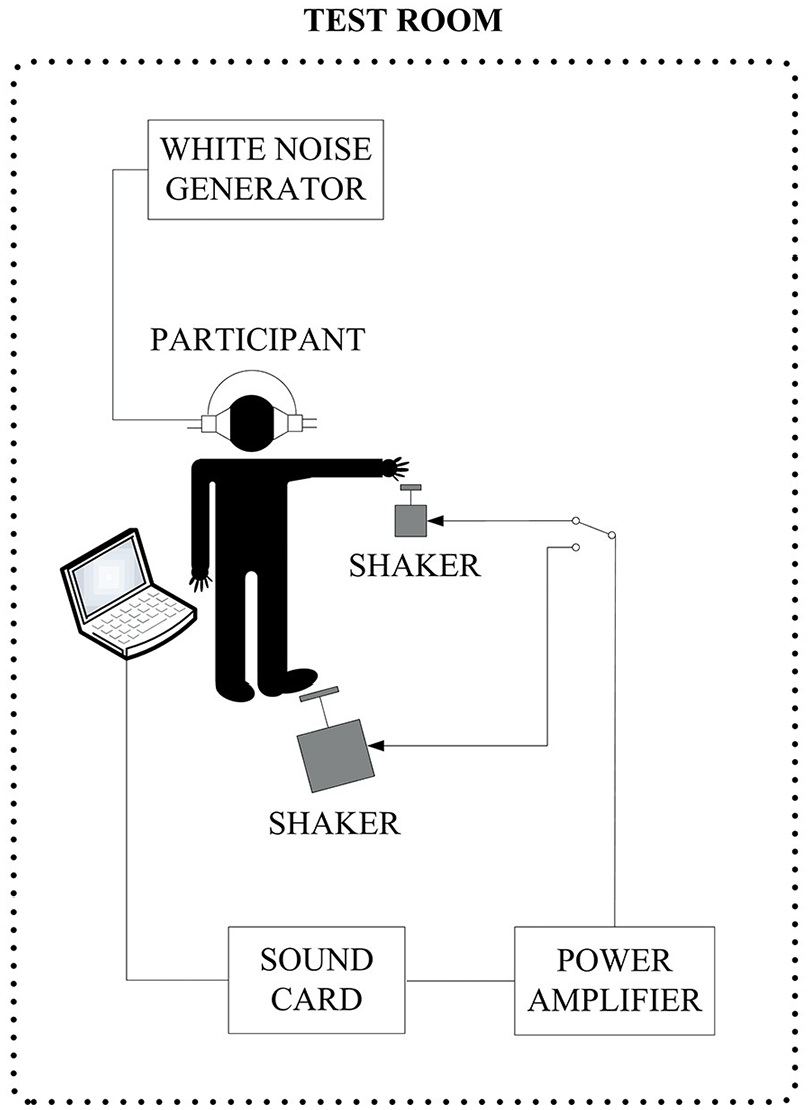
Experimental set-up.
For tests on fingertips, the pad of the distal phalanx of the middle finger of the participant’s dominant hand rested upon the same vibrating contactor disc that was used to determine the vibrotactile thresholds (Hopkins et al., 2016). This was a 0.8 cm thick aluminium disc with a diameter of 2 cm. The fingertip was positioned such that the whorl, arch or loop of the fingerprint was positioned at the centre of the disc. Participants were instructed to relax and not press down on the contactor.
The participant’s forefoot (the distal part of the plantar side of the foot involving the distal and proximal phalanxes and partially the metatarsal bones) rested upon a 2.5 cm thick Perspex disc with a diameter of 12 cm that had been used previously to determine the vibrotactile thresholds (Hopkins et al., 2016). The foot was positioned so that all the toes touched the disc. Participants removed their shoe and sock and were instructed to relax and not press down on the contactor. The participants rolled long trousers up to the knee or hitched long skirts/dresses up to the knee, to avoid any sensation from clothes moving near the foot.
For the tests with the fingertip the contactor was driven by an electro-dynamic shaker (LDS Type V201) that was structurally isolated from the table upon which the participants arm was supported. This shaker was enclosed in a box to reduce the radiated sound. For the tests with the forefoot, the contactor was driven by an electro-dynamic shaker (LDS Type V406 M4-CE) with an auxiliary suspension system to bear the static load of the participant’s leg. The vibration on the contactor discs was measured using accelerometers (B&K Type 4374 and 4393 for fingertips and forefeet respectively). Signal analysis was carried out using a dual channel real-time frequency analyser (B&K Type 2144). To ensure the presentation of sinusoidal stimuli to the skin, the power amplifier introduced very low-level harmonic distortion such that the measured harmonic peaks on the contactor were at least 40 dB below the fundamental frequency that was used as the test note.
Presentation level
The available dynamic range is defined as the lowest level of vibration at which it is practical to feel and use vibrotactile feedback up to the highest vibration level to which the human body can be exposed with minimal or no risk (Hopkins et al., 2016). For vibrotactile presentation of musical notes between C1 and G5 to the fingertip the available dynamic range was reported to be at least 7 dB and at most 36dB, and for the forefoot at least 11 dB and at most 47 dB, when presented 10 dB above the median threshold (Hopkins et al., 2016). It was also shown in Hopkins et al. (2016) that more participants were able to feel continuous signals when stimuli were presented at a level 10 dB above, rather than at, threshold. The aim was therefore to present stimuli at least 10 dB above threshold so as to aid the perception of pitch in the present study. This can also be justified on practical grounds because it is expected to be very difficult for a musician to concentrate on sensations close to, or at threshold, during musical performance.
Within the time constraints for the testing it was not feasible to measure the thresholds of all participants in order to present levels above their individual thresholds. Note that other studies have also been carried out without measuring the thresholds of individual participants (e.g., Branje et al., 2010; Russo et al., 2012; Egloff et al., 2018). In the current study, an average threshold from Hopkins et al. (2016) was used as a baseline. The median thresholds were averaged over the range of notes from C3 to C5 which gave values of 102 dB and 100 dB (in terms of displacement re 10-12 m) for fingertips and forefeet, respectively. The stimuli were presented at 120 dB, which is 18 dB to 20 dB above the average median thresholds and within the available dynamic range that was previously identified (Hopkins et al., 2016). Figure 2 shows this presentation level in relation to the vibrotactile threshold in terms of displacement. It was inadvisable to present stimuli at higher levels for two reasons: firstly, so as not to expose participants to levels of vibration carrying a health risk for humans; secondly, because amplitude can affect perceived pitch (Morley and Rowe, 1990; von Békésy, 1957; von Békésy, 1959). The choice was justified on the basis that having chosen the frequency range between C3 and C5 because the threshold curve was relatively flat, the shape of the contour of equal sensation magnitude should not change substantially when presented above threshold (as indicated by the equal sensation contours from Verrillo et al. (1969). By choosing a single presentation level without manipulation for equal sensation, the results of the study show what is achievable in terms of relative pitch discrimination without using additional processing to account for a specific individual’s sensitivity.
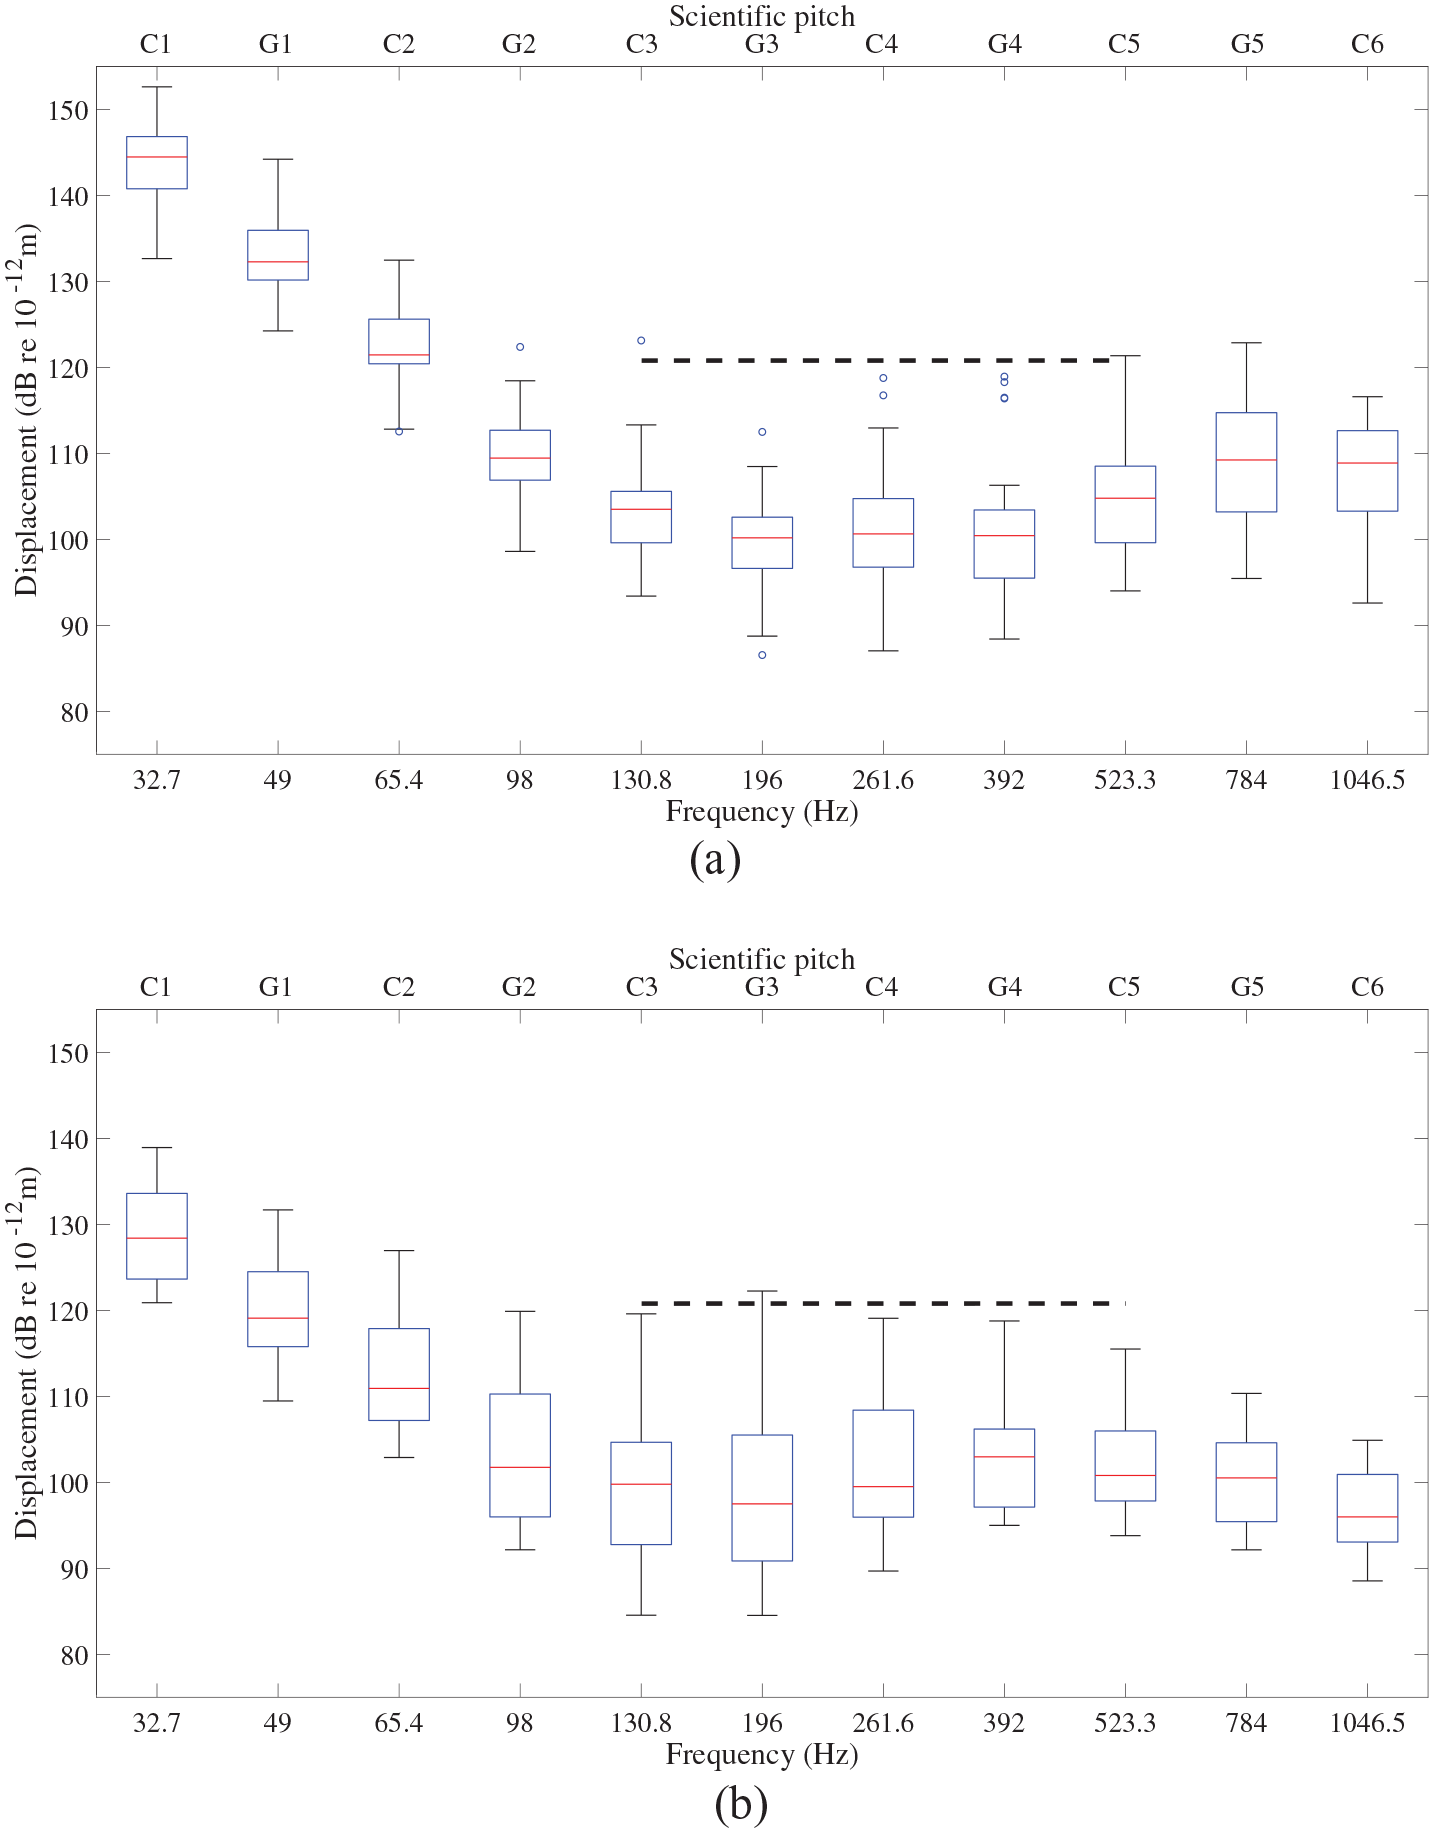
Vibrotactile thresholds from participants with normal hearing for (a) the fingertip and (b) the forefoot, for comparison with the presentation level of 120 dB (horizontal dashed line). In the box plot, the median is indicated by the central line and the 25th and 75th percentiles of the values form the lower and upper bounds respectively of the box which contains the middle 50% of the values. The whiskers indicate values within ±3 standard deviations from the mean and the circles represent the outliers outside this range.
Masking noise
Masking noise was required to avoid unwanted audio cues produced by sound radiated by the shaker and contactor. White noise was presented to the ears using headphones at a level of 75 dB LAeq, so that the masking noise level was at least 20 dB above the sound radiated by the shaker and contactor.
Participants
Approval for the research was granted by the Research Ethics Sub-Committee for Non-Invasive Procedures at the University of Liverpool and the Royal Northern College of Music Research Ethics Committee. Participants agreed to take part in the study by signing a consent form approved by the committee. Only participants with no indication of neuropathy (e.g., self-reported impairment of sensation in their hands or feet) were recruited. All participants had experience playing a musical instrument and/or singing in a choir or vocal group at an amateur or professional level.
Equal numbers of male and female participants were recruited to the sample of professional musicians, but the amateur musicians were all male. Over the range of frequencies used in the experiments we carried out, no significant differences have been identified between the vibrotactile thresholds on the thenar eminence (Verrillo et al., 1979) of males and females respectively, although Gescheider et al. (1984) showed that women’s thresholds may be reduced by ≈6 dB at 250 Hz before menstruation. This was not of concern, since our stimuli were presented above the average median thresholds. In terms of subjective intensity, women’s perception of suprathreshold stimuli at 250 Hz has been shown to be more intense than men’s perception (Verrillo et al., 1979) but no evidence is reported in the literature of any effects of sex on vibrotactile frequency discrimination.
Self-reporting was used to classify participants as having normal hearing or a hearing impairment. The latter group were asked to classify their hearing loss (HL) as mild (25–39 dB HL), moderate (40–69 dB HL), severe (70–94 dB HL) or profound (⩾95 dB HL).
Participants for the experiments using fingertips
Fifteen participants were recruited with self-reported normal hearing. Seven participants (seven male; mean age: 34.1 years, SD: 9.5) described themselves as amateur musicians, playing a musical instrument and/or singing in a choir or vocal group, and eight participants (four male, four female; mean age: 20.8 years, SD: 3.1) played a musical instrument at a professional level.
Four participants (referred to as W, X, Y, Z) with a hearing loss were recruited. All played a musical instrument or sang at a professional level. The two female participants (W, Z) had a non-congenital, profound hearing loss. The two male participants were congenitally deaf, one (Y) had a profound hearing loss and the other (X) had a severe hearing loss. The ages of these four participants ranged from 24 to 58 years (mean: 39.3, SD: 16.0). The effect of a severe or profound hearing loss on relative pitch discrimination was investigated using only the pre-training test, as it was not possible to make arrangements for the extended period of time needed for training sessions.
All tests on the fingertip used the middle finger of the dominant hand.
Participants for the experiments using the forefoot
For the tests on the forefoot, seven male participants were recruited with self-reported normal hearing (mean age: 32.4 years, SD: 9.4). The participants’ shoe size, based on the system used in the UK, was in the range 7.5 to 10 (mean: 8.4, SD: 0.8), their weight was in the range 65 to 90 kg (mean: 74.7, SD: 11.9). All participants described themselves as amateur musicians, playing a musical instrument and/or singing in a choir or vocal group.
The right-hand was dominant for all participants and they all carried out the experiment using the forefoot of the right foot.
Data analysis
Statistical analysis on the percentage of correct scores was carried out using SPSS v27.0 for Windows. The Shapiro–Wilk test was used to assess normality and indicated that some variables were not normally distributed. We therefore used an independent samples t-test to compare amateur and professional musicians with normal hearing, Spearman rank-order correlation coefficients to assess correlations between interval size and correct scores, a dependent t-test to assess the improvement from pre- to post-training tests, the Mann–Whitney U test to assess differences in the pre-test results by professional musicians with and without a hearing impairment and the Wilcoxon signed rank test to assess the effect of interval direction.
The above statistical analysis was supplemented by an approach based on the confusion matrix to evaluate the participant’s performance in terms of all correct and incorrect scores in the pre- and post-training tests. The assessment of relative pitch is a binary classification problem for which the Matthews Correlation Coefficient (MCC) is suited to making a more reliable evaluation than accuracy and F1 score (Chicco & Jurman, 2020). MCC has a high score only if the participants obtain good results in all four confusion matrix categories, these are true positives (TP), true negatives (TN), false positives (FP) and false negatives (FN) where positive and negative correspond to higher and lower, respectively. MCC ranges from −1 to 1 where 0 indicates no relationship, 1 indicates a perfect positive relationship, and −1 indicates a perfect negative relationship. As MCC is a discrete version of the Pearson correlation coefficient the following qualitative descriptions are used in this article: 0.70 and higher indicates a very strong positive relationship, between 0.40 and 0.69 indicates a strong positive relationship, between 0.30 and 0.39 a moderate positive relationship and between 0.20 and 0.29 a weak positive relationship. To avoid presenting a large number of confusion matrices for each semitone interval, MCC, TP, TN, FP and FN are tabulated for the pre- and post-training tests.
Results
Relative pitch discrimination and training
The percentages of correct scores in the pre- and post-training tests for the musicians with normal hearing are shown in Figure 3 for the fingertip and in Figure 4 for the forefoot. For the musicians with normal hearing using fingertips and forefeet, Figure 5 shows the change in the percentages of correct scores (median) from the pre- to the post-training test. For the pre- and post-training tests, MCC, TP, TN, FP and FN data are tabulated for amateur musicians with normal hearing using the fingertip in Table 1, and for professional musicians with normal hearing using the fingertip in Table 2. Table 3 gives MCC values for the combination of amateur and professional musicians with normal hearing using the fingertip. MCC, TP, TN, FP and FN data for amateur musicians with normal hearing using the forefoot in pre- and post-training tests are given in Table 4.
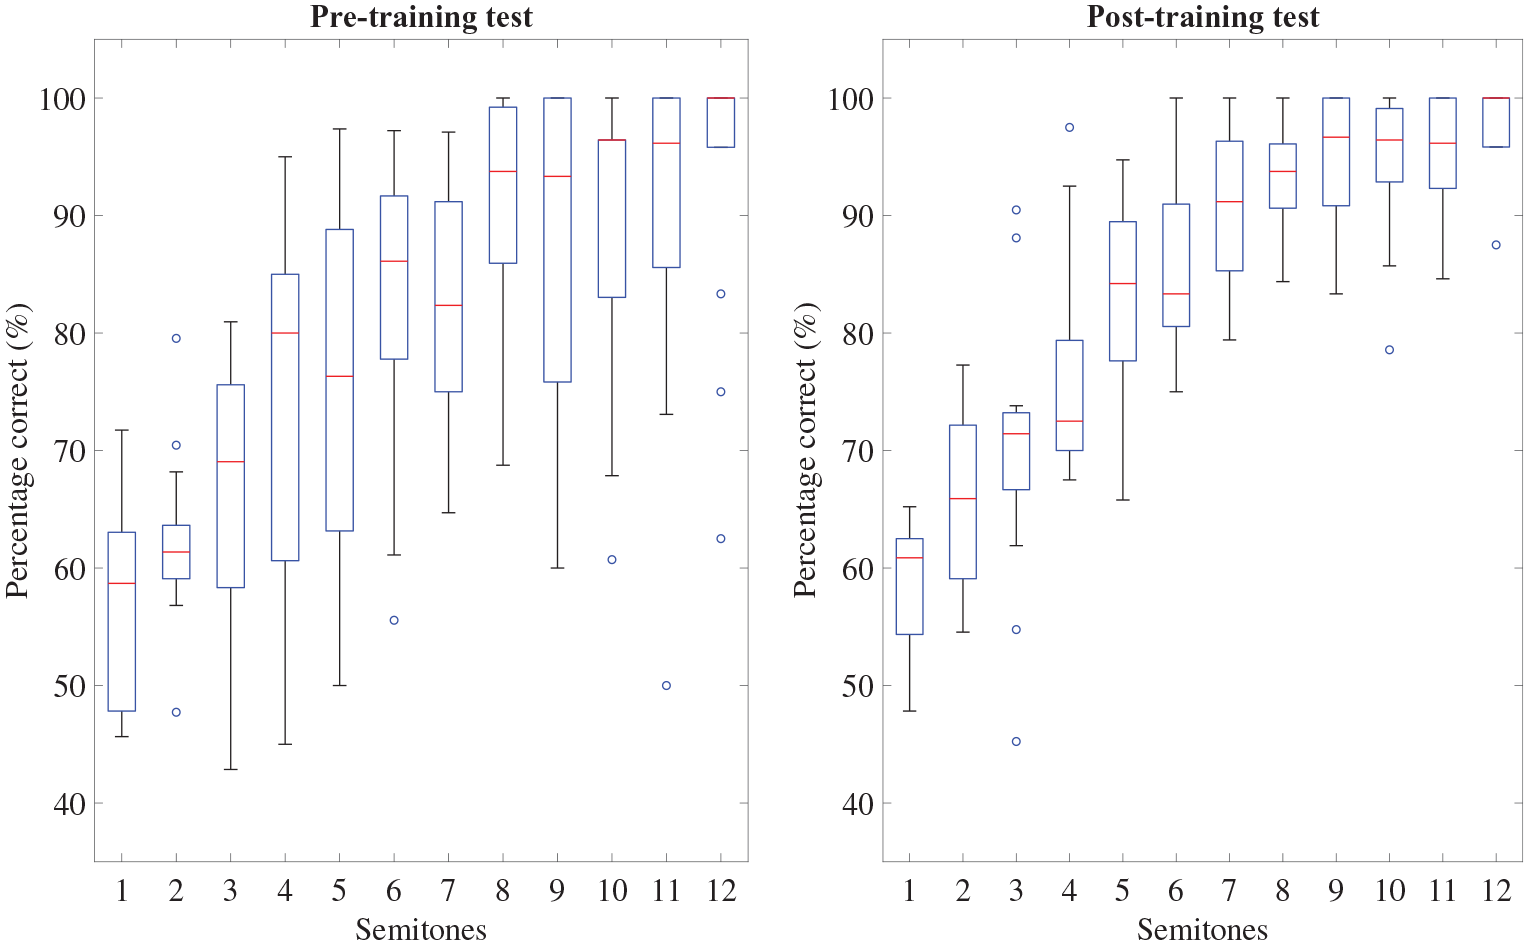
Percentage of correct scores from amateur and professional musicians with normal hearing using the fingertip in the pre- and post-training tests. The box plot representation of the data is the same as described in Figure 2.
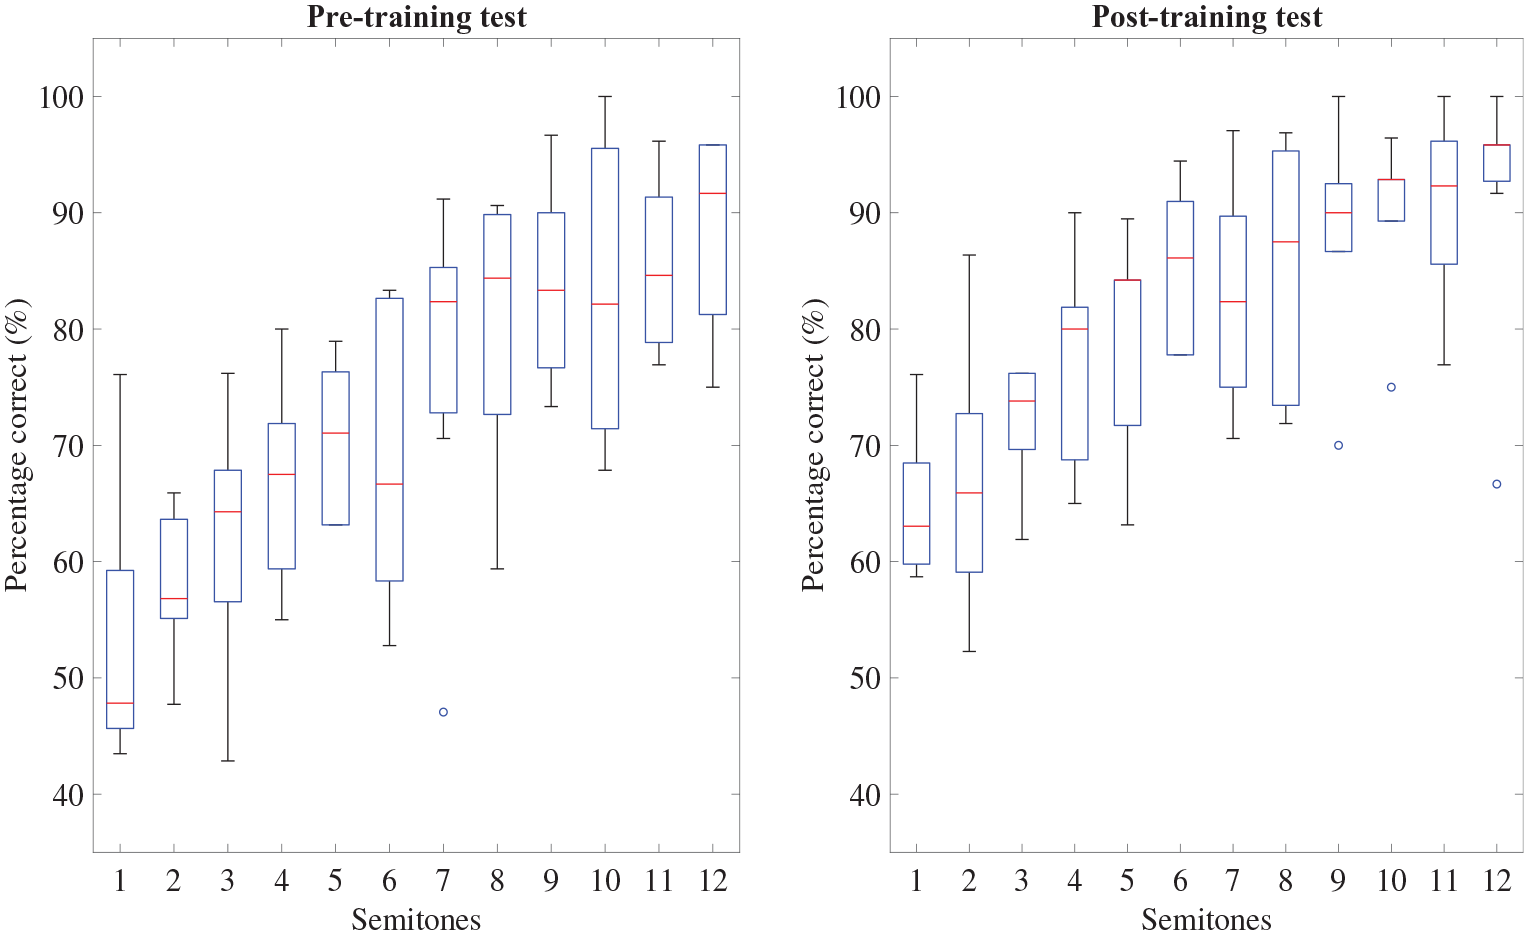
Percentage of correct scores from amateur musicians with normal hearing using the forefoot. The box plot representation of the data is the same as described in Figure 2.
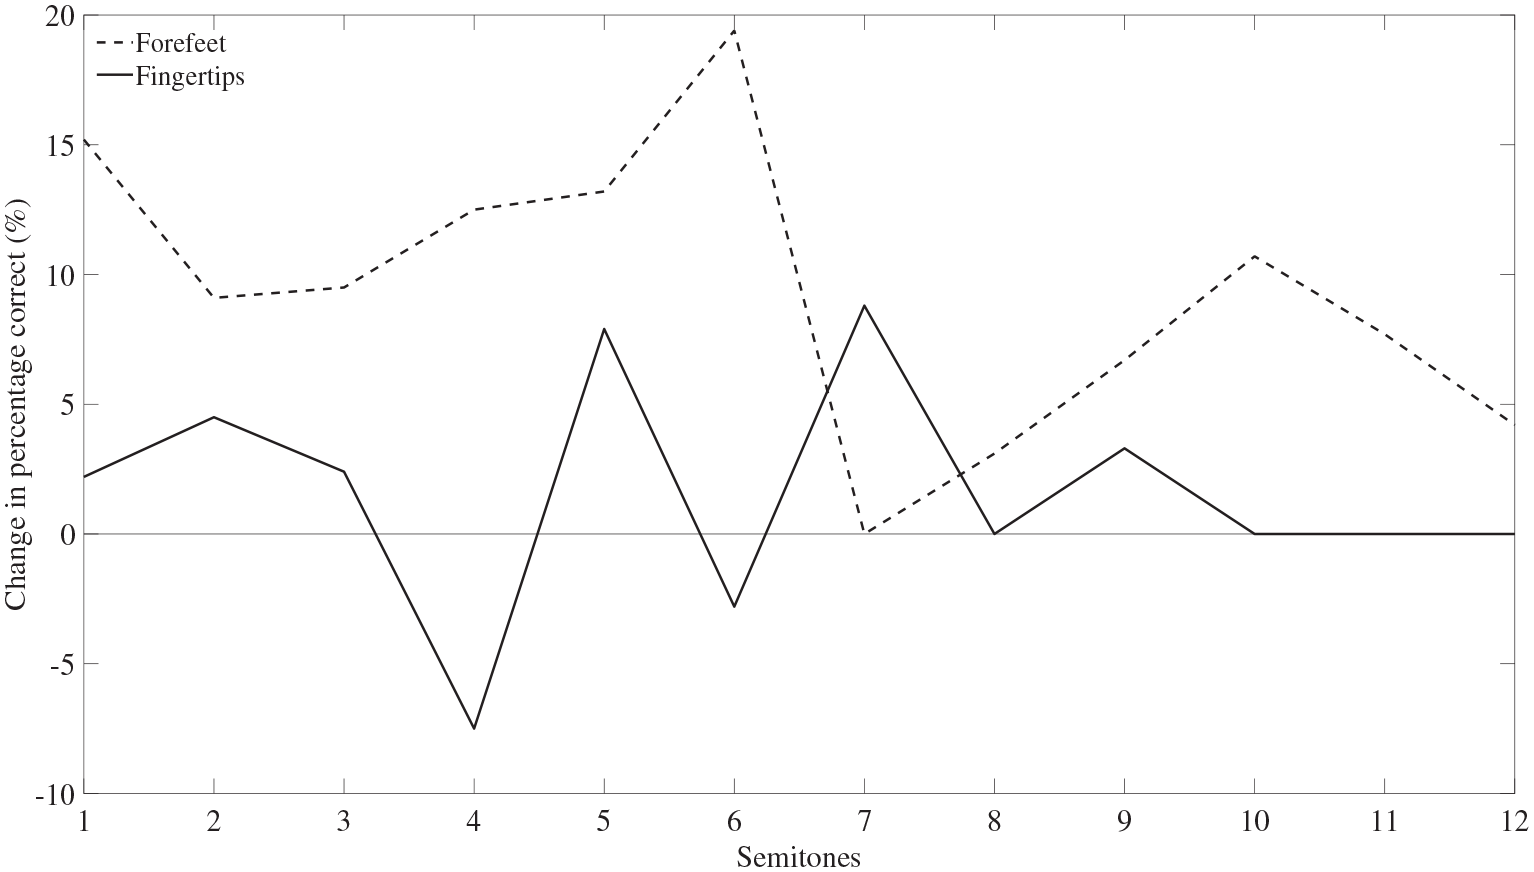
Change in the percentage of correct scores (median) from the pre- to the post-training test from participants with normal hearing using the fingertip (amateur and professional musicians) and the forefoot (amateur musicians).
Assessment of classification performance: Amateur musicians with normal hearing using the fingertip in pre- and post-training tests.
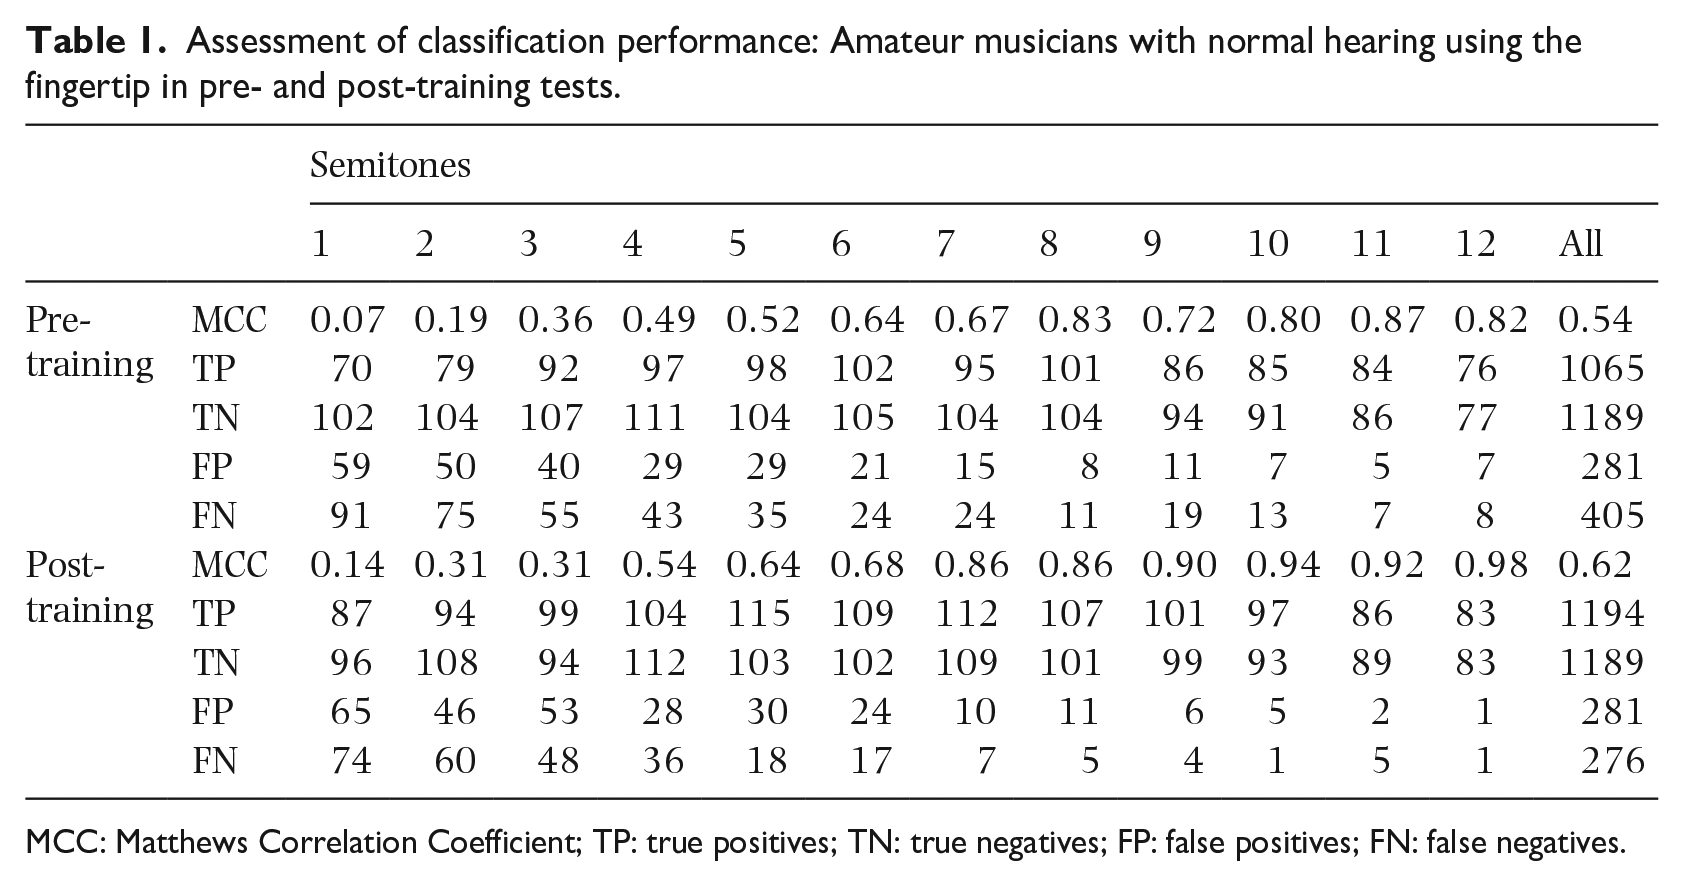
MCC: Matthews Correlation Coefficient; TP: true positives; TN: true negatives; FP: false positives; FN: false negatives.
Assessment of classification performance: Professional musicians with normal hearing using the fingertip in pre- and post-training tests.
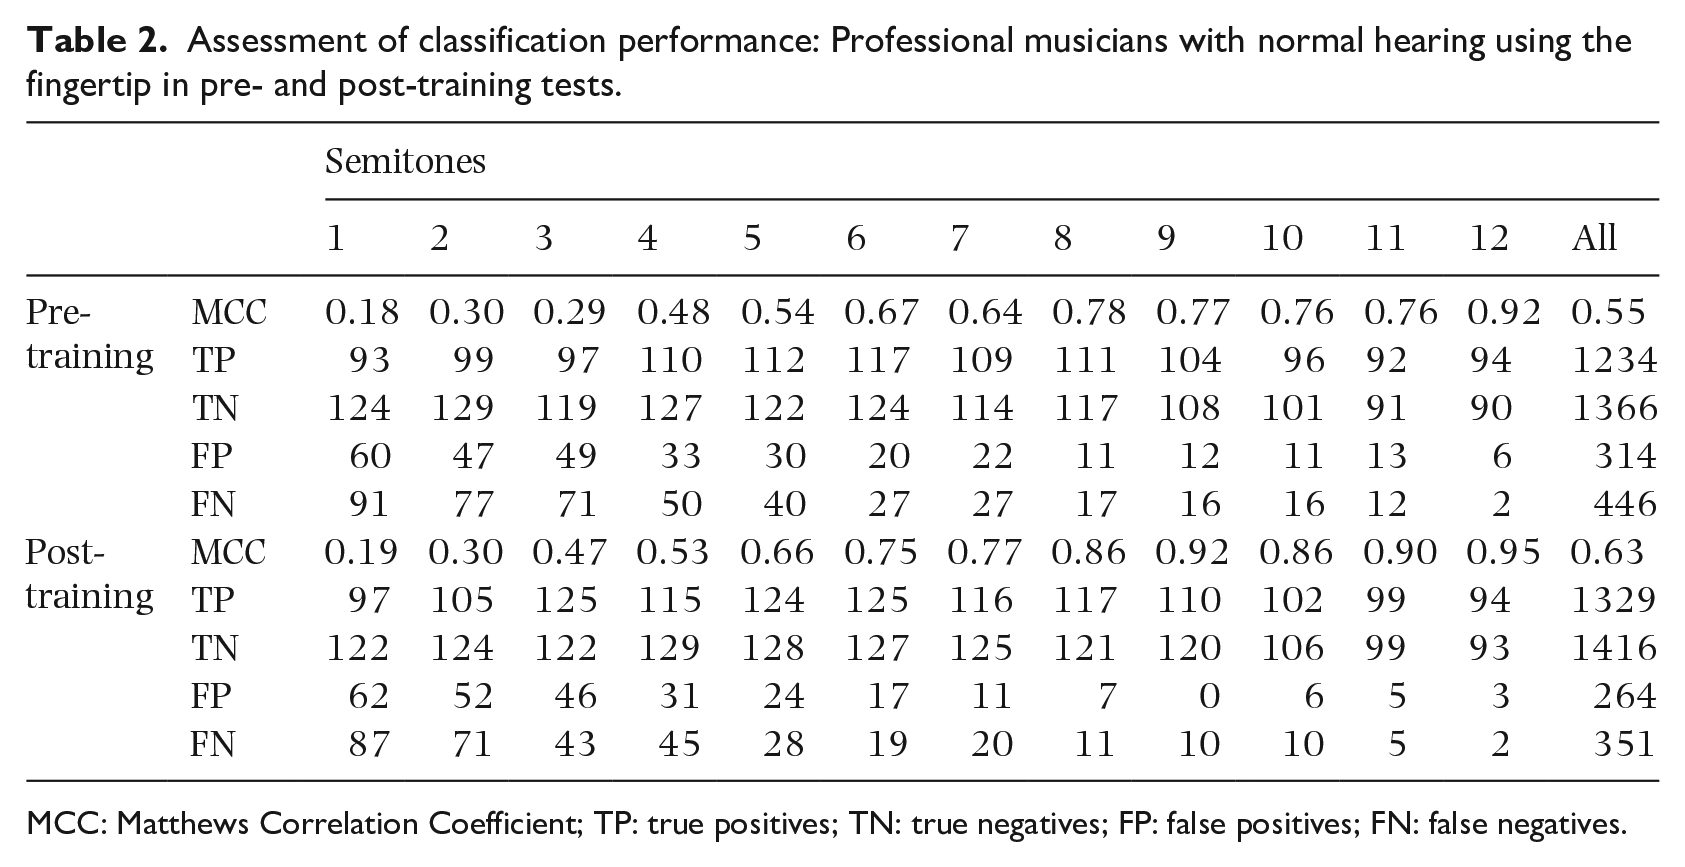
MCC: Matthews Correlation Coefficient; TP: true positives; TN: true negatives; FP: false positives; FN: false negatives.
Classification performance using MCC for the combination of amateur and professional musicians with normal hearing using the fingertip in pre- and post-training tests.
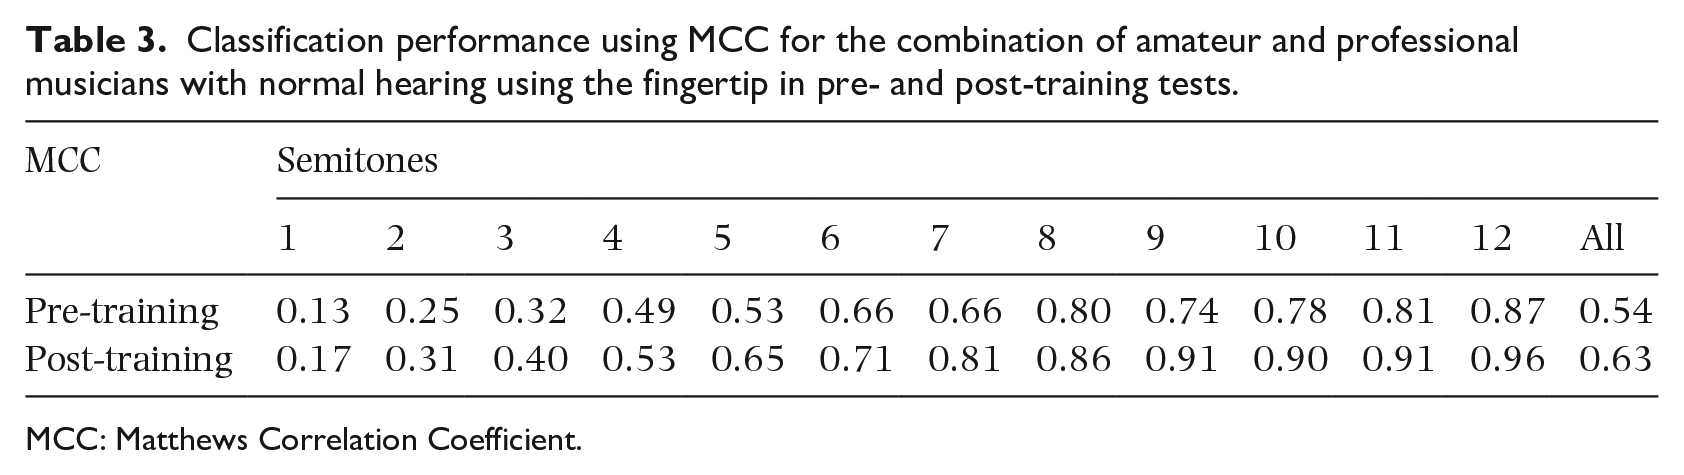
MCC: Matthews Correlation Coefficient.
Assessment of classification performance: Amateur musicians with normal hearing using the forefoot in pre- and post-training tests.
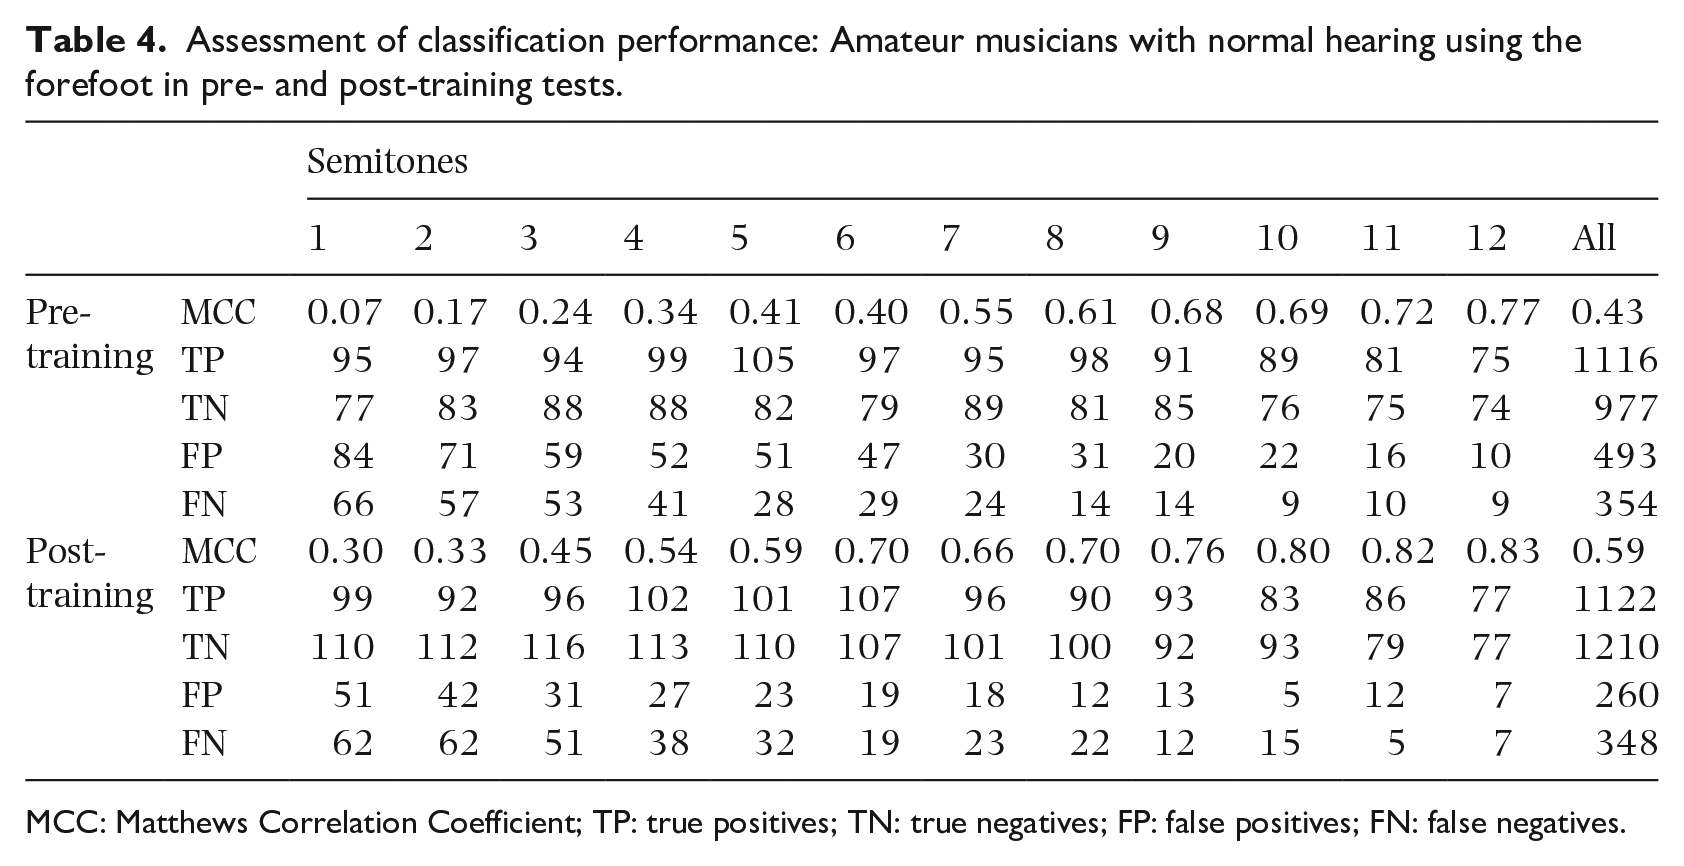
MCC: Matthews Correlation Coefficient; TP: true positives; TN: true negatives; FP: false positives; FN: false negatives.
For the fingertips of participants with normal hearing, an independent samples t-test indicated no significant difference between the percentages of correct scores of professional musicians (n = 8), and amateur musicians (n = 7) in the pre- (p = 0.73) and post-training (p = 0.28) tests. Similarities between amateur and professional musicians were evident in the analysis of the confusion matrices. When considering all semitones, MCC was 0.54 and 0.55 for amateur and professional musicians respectively in the pre-training test, and 0.62 and 0.63 in the post-training test.
For all musicians with normal hearing using the fingertip (n = 15) and forefeet (n = 7) in the pre- and post-training tests there was a significant positive correlation (p < 0.001) between interval size in semitones and correct scores; hence, as the interval size increased, the number of correct scores increased. For the pre- and post-training tests respectively, the Spearman correlation coefficients were r = 0.68 and r = 0.84 for fingertips and r = 0.75 and r = 0.71 for forefeet; these all indicate large-sized effects. These findings were supported by the increase in MCC as the interval size increased (Tables 3 and 4).
For the fingertips of all musicians with normal hearing (n = 15), the improvement for all intervals (mean: 4.6%, SD: 11.4%) from pre- to post-training tests was significant (dependent t-test, p < 0.001, t(179) = −5.339, r = 0.744). In the post-training test the median correct score was ⩾70% for intervals of 3–12 semitones with the highest score being 100% for 12 semitones. After training, the median correct scores for intervals of 1, 2, 3, 5, 7 and 9 semitones increased by between 2.2% and 8.8%, and decreased by 7.5% and 2.8% for four and six semitones respectively (see Figure 5). MCC values indicated a strong or very strong positive relationship for intervals of 4–12 semitones in pre-training tests, and intervals of 3–12 semitones in post-training tests.
For the forefeet of amateur musicians with normal hearing (n = 7), the improvement for all intervals (mean: 7.6%, SD: 10.9%) from pre- to post-training tests was significant (dependent t-test, p < 0.001, t(83)= −6.454, r = 0.693). In the post-training test the median correct score was ⩾70% for intervals of 3–12 semitones with the highest score being 95.8% for 12 semitones. After training, the median correct scores increased by between 3.1% and 19.4% for all intervals except 7 semitones where there was no change in the median (see Figure 5). The improvement from pre- to post-training tests was supported by the increase in MCC values (Table 4) with the largest increases occurring for intervals of 1–6 semitones. MCC values indicated a strong or very strong positive relationship for intervals of 5–12 semitones in pre-training tests, and intervals of 3–12 semitones in post-training tests.
Comparison of professional musicians with and without hearing impairments
The pre-training test using the fingertip can be used to compare professional musicians with a hearing impairment (n = 4) and those with normal hearing (n = 8) for which the percentage of correct scores are shown in Figure 6. Table 5 shows MCC, TP, TN, FP and FN for the group of four professional musicians with a hearing impairment in the pre-training test and for each individual musician (W, X, Y, Z), Figure 7 shows the percentage of correct scores for each semitone interval.
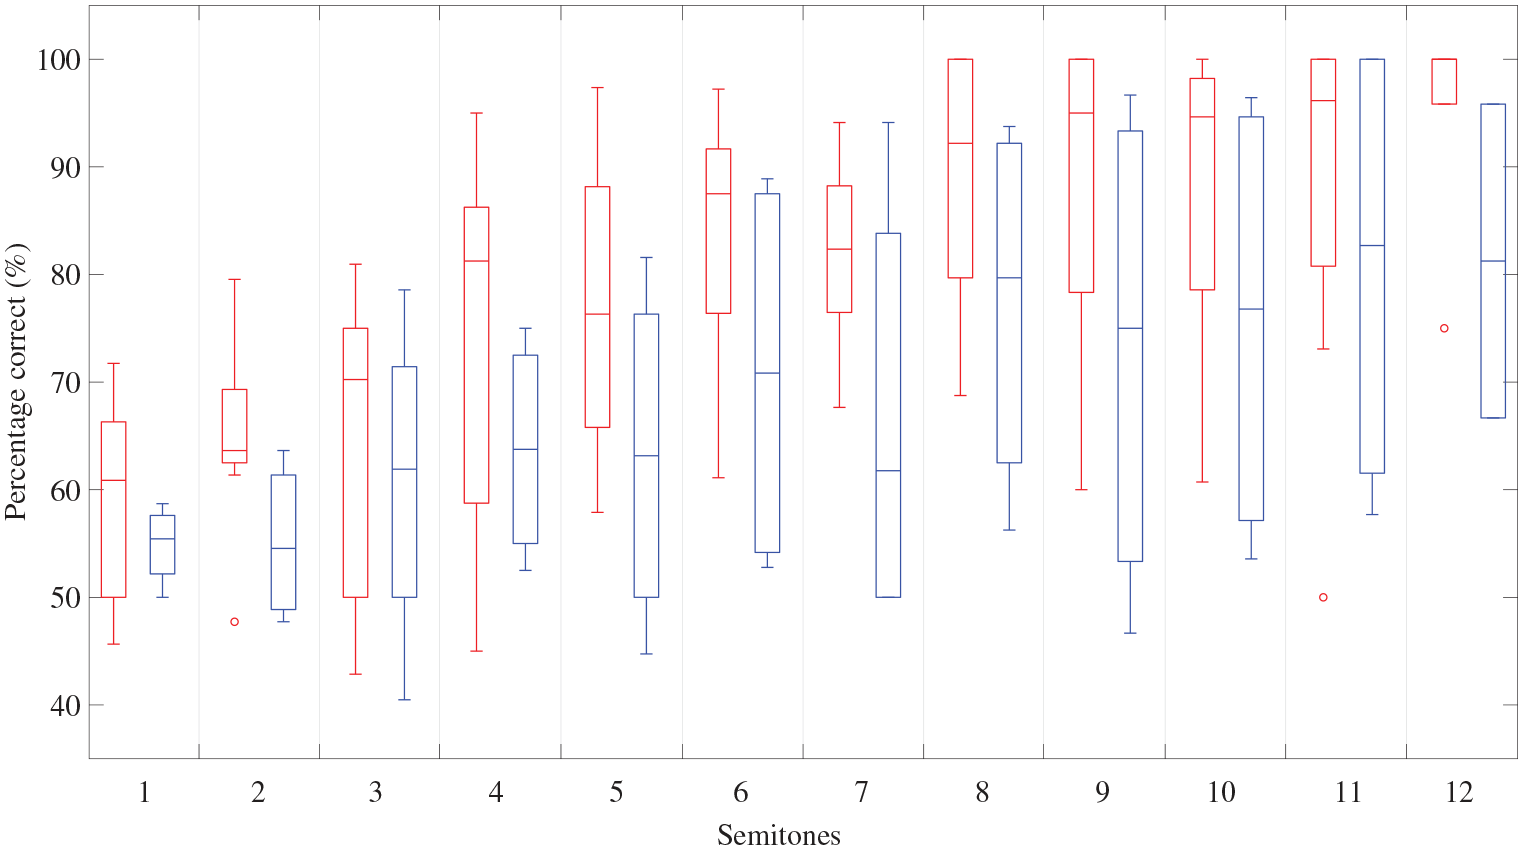
Percentage of correct scores in the pre-training test using the fingertip from professional musicians with normal hearing (left-hand box – coloured red online) and a hearing impairment (right-hand box – coloured blue online). The box plot representation of the data is the same as described in Figure 2.
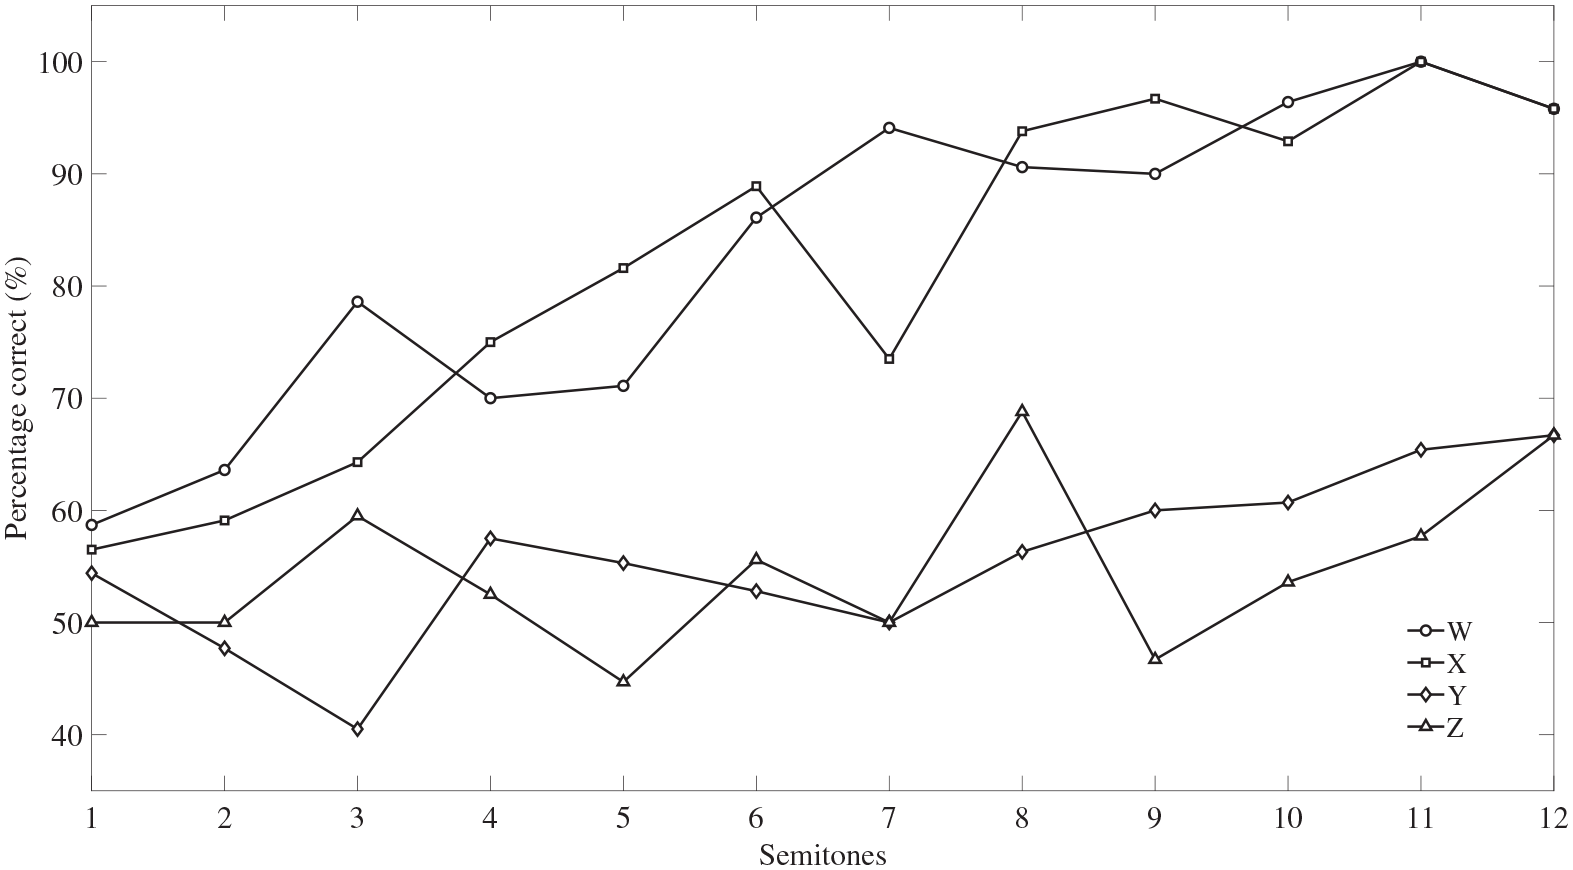
Percentage of correct scores in the pre-training test using the fingertip from the four professional musicians with a hearing impairment (W, X, Y, Z).
Assessment of classification performance: Professional musicians with a hearing impairment using the fingertip in the pre-training test.
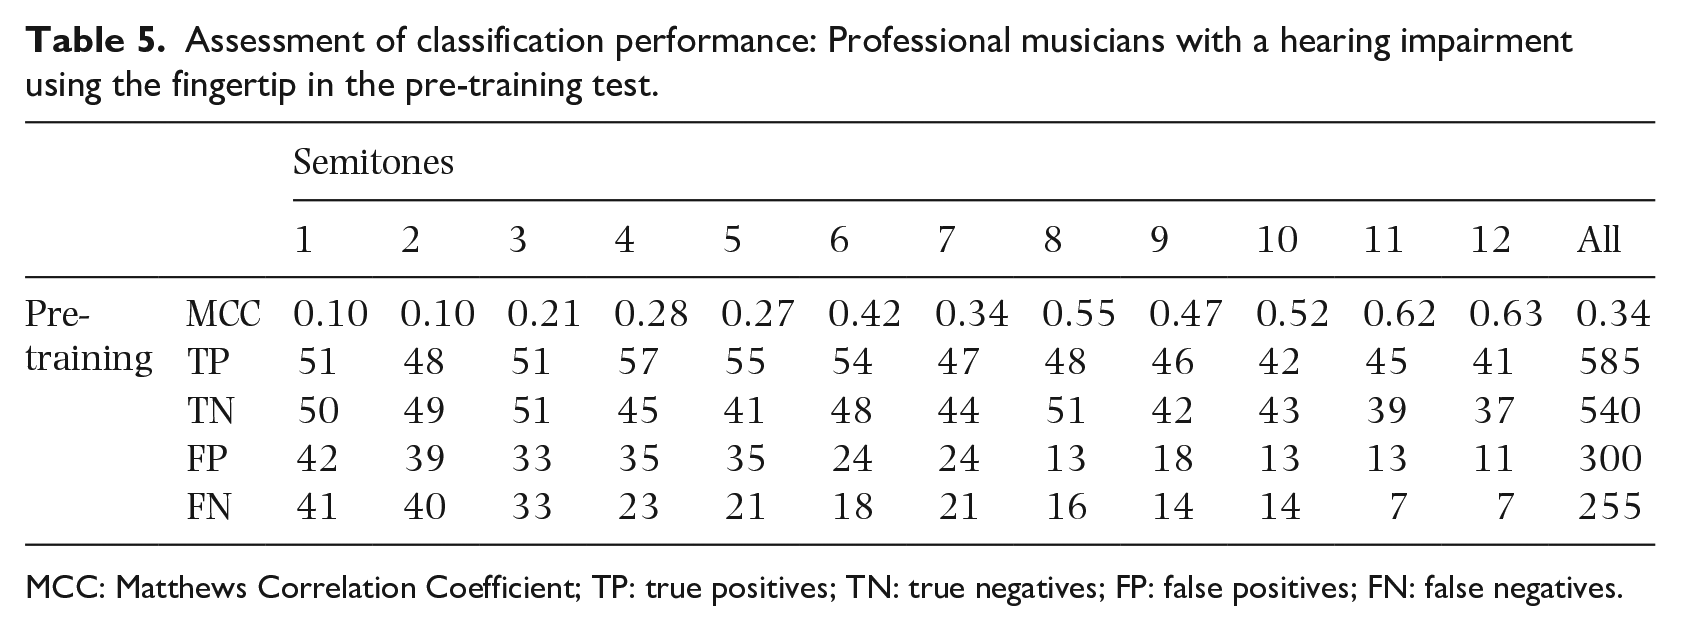
MCC: Matthews Correlation Coefficient; TP: true positives; TN: true negatives; FP: false positives; FN: false negatives.
The scores for professional musicians with a hearing impairment, Y and Z, were close to chance whereas W and X were similar to professional musicians with normal hearing (Figures 6 and 7). Consideration of all four professional musicians with a hearing impairment indicated that the median correct scores of the professional musicians with normal hearing were 14.4% higher, on average, than those of the professional musicians with a hearing impairment (range was 5.4% to 20.6%); this difference was significant (Mann-Whitney, p < 0.001, r = −0.294). However, this was mainly affected by the interval of 12 semitones because there were no significant differences between the two groups for intervals for 1–11 semitones (Mann-Whitney, 0.083 ⩽ p ⩽ 0.717), only for 12 semitones (p = 0.031, r = −0.623). For professional musicians with a hearing impairment, MCC indicated a weak positive relationship for intervals of 1–5 semitones, a moderate positive relationship for 7 semitones and a strong positive relationship for intervals of 6 semitones and 8–12 semitones.
Effect of interval direction
For the seven amateur musicians with normal hearing, correct scores using the fingertip were significantly higher for descending intervals (Median = 86.2%) than ascending intervals (Median=78.4%) in the pre-training test (Wilcoxon signed rank, z = −4.180, p < 0.001, r = −0.322) but there was no significant difference between scores for ascending and descending intervals in the post-training test (z= −0.412, p = 0.683). For the eight professional musicians with normal hearing, correct scores using the fingertip were significantly higher for descending intervals (Median = 90.0%) than ascending intervals (Median =81.1%) in the pre-training test (z = −3.087, p = 0.002, r = −0.223) and for descending intervals (Median = 91.5%) compared to ascending intervals (Median = 84.4%) in the post-training test (z = −2.607, p = 0.009, r = −0.188).
For the four professional musicians with hearing impairments, correct scores using the fingertip were significantly higher for ascending intervals (Median=68.7%) than descending intervals (Median = 63.4%) in the pre-training test (Wilcoxon signed rank, z = −2.966, p = 0.002, r = −0.303). The scores of participants Y and Z were close to chance but for the other two participants, W and X, the correct scores were found to be significantly higher for ascending intervals (Median = 92.3%) than descending intervals (Median = 83.3%) (z = −2.939, p = 0.002, r = −0.416).
For the seven amateur musicians with normal hearing, correct scores using the forefoot were significantly higher for ascending (Median = 80.6%) than descending intervals (Median = 70.7%) in the pre-training test (Wilcoxon signed rank, z = −4.305, p < 0.001, r = −0.332) but significantly higher for descending (Median = 84.0%) than ascending intervals (Median = 78.6%) in the post-training test (z = −2.821, p = 0.004, r = −0.218).
Discussion
Relative pitch discrimination and training
It was hypothesised that training would improve performance and this was supported by the results. For musicians with normal hearing, training increased the median correct score for all intervals from 82.4% to 88.2% for fingertips and from 75.5% to 82.4% for forefeet. The relatively high success rate before training can be considered in the context that infants with normal hearing have a grasp of relative pitch in the auditory domain from the age of six months (Plantinga & Trainor, 2005; Trehub et al., 1984). However, the fact that all participants played a musical instrument and/or sang in a choir or vocal group is another potential factor. For fingertips and forefeet, the training sessions helped to reduce the variability between participants and bring them towards a similar ability. This can be seen by comparing the scores in the pre- and post-training tests (see Figures 3 and 4) where the relatively large interquartile range was significantly reduced after training (except for the interval of two semitones).
The pre- and post-training tests using the fingertips and forefeet of musicians with normal hearing show that larger intervals are easier to identify than smaller intervals; this has also been observed by others (e.g., see Egloff et al., 2018; Senkow et al., 2018). After training, they obtained median scores greater than 70% (and a reduced interquartile range) using fingertips or forefeet for intervals of 3–12 semitones. In the post-training test, larger intervals were identified more reliably than smaller intervals; the lowest median correct score was for a semitone and was 60.9% and 63.0% for fingertips and forefeet, respectively. The semitone interval was the most common interval in the training sessions, and while training produced an improvement in the median correct score of 15.2% for the forefoot, it was only 2.2% for the fingertip. On the basis of Bensmaïa et al.’s (2005) findings, it was expected that intervals of one, two and three semitones would be difficult if not impossible to perceive using vibrotactile feedback as they lie below the predicted Weber fraction of 0.22. The results confirm that one semitone is difficult whereas intervals of two and three semitones can be perceived by the majority of participants after training.
For musicians and non-musicians with normal hearing, Egloff et al. (2018) tested ascending intervals of 1, 2, 3, 4, 5 and 7 semitones on the fingertip for notes between C2 and G2 (rather than C3 and B4 in this article). When their results are compared with the same ascending intervals for musicians with normal hearing using the fingertip in the current article, the average correct scores were within ≈13% and ≈5% for the pre- and post-training tests, respectively. For the fingertip this indicates the potential availability of a wide range of notes, from C2 to B4, over which the ability in relative pitch is similar. It is known from the work of von Békésy (1957) and Geldard (1960), however, that some control of the amplitude of the stimulus above threshold is needed if frequency is to be discriminated, otherwise intensity cues could be used by the participants. Some caution is therefore needed in considering the data from Egloff et al. (2018) because the median vibrotactile threshold on the fingertip decreases by 12.0 dB between C2 and G2 (see Figure 2(a)) and no attempt was made to control the intensity above threshold. This is in contrast to the present study where the range of notes was chosen between C3 and B4 because the threshold is relatively flat and the median threshold varies by at most 4.6 dB (see Figure 2(a)). If it is found to be beneficial to limit the range of notes to those used in our research, then it should be feasible to use real-time signal processing during musical practice or performance to pitch shift any lower or higher notes into this range.
Comparing the post-training tests for musicians with normal hearing using the fingertip and forefoot, the median scores for fingertips were, on average, 2.5% lower than forefeet for intervals of 1–6 semitones, and 5.6% higher for intervals of 7–12 semitones. It is therefore possible that those who play a musical instrument may not gain the heuristic knowledge of pitch discrimination during their lifetime that would give an advantage to the fingertip over the forefoot. Future work could investigate the psychophysical reasons for these differences.
The experiments used a 1s note duration (e.g., a crotchet beat at 60 bpm) which is relatively long when considering a wide range of musical styles. However, Egloff et al. (2018) used a 250 ms note duration which would correspond to a crotchet beat at 240 bpm or a quaver beat at 120 bpm, or a semiquaver beat at 60 bpm. The current study (fingertips and forefeet) and the study by Egloff et al. (2018) (fingertips) both assessed relative pitch using frequencies that optimally activate the Pacinian mechanoreceptors (although the notes were different). The similarity in percentage correct scores for ascending intervals on fingertips in both studies is encouraging because it suggests that relative pitch does not become significantly more difficult to assess when using a shorter note duration of 250ms. A potential issue with Pacinian mechanoreceptors is that as the note duration is reduced from 1s there will be an increase in the vibrotactile threshold. This is predicted by Zwislocki’s theory of temporal summation, although Verrillo (1965) has shown that the increase in the threshold is unlikely to be more than 2 dB for a 250 ms duration, and this increase can be considered as negligible.
Comparison of professional musicians with and without hearing impairments
For intervals above five semitones, the interquartile range for the percentage correct scores in the pre-training test was larger for participants with a hearing impairment than with normal hearing (see Figure 6). This is due to the variation in the scores for the group of participants who were professional musicians with a hearing impairment. The total percentage of correct scores was 80.5% and 78.8% for participants W (non-congenital, profound hearing loss) and X (congenital, severe hearing loss). However, the percentage correct was close to chance at 54.5% and 54.0% for participants Y (congenital, profound hearing loss) and Z (non-congenital, profound hearing loss) respectively. This variation between the four participants is not explained by the degree of hearing loss or whether the deafness was congenital. While all the participants could feel the vibration it is possible that the presentation level for the two participants who performed close to chance was not 10 dB above their individual threshold; however, as noted previously it was not feasible to increase the vibration level in case it increased the health risk.
The scores obtained by participants W and X were similar to the pre-training percentage of 82.4% from participants with normal hearing who were also professional musicians. This indicates that relative pitch perception using vibrotactile feedback is feasible for some people with a severe or profound hearing loss. This might be due to increased attention to the vibration or neural plasticity as suggested by Levänen and Hamdorf (2001) in their study on enhanced tactile sensitivity with congenitally deaf participants.
Effect of interval direction
When amateur or professional musicians with normal hearing used the fingertip in the pre-training test, there was evidence that correct scores were higher for descending rather than ascending intervals. However, in the post-training test this was not evident for amateur musicians and whilst correct scores were still higher for descending intervals with professional musicians it was a small size effect. Amateur musicians with normal hearing using the forefoot obtained higher correct scores for ascending intervals in the pre-training test (medium size effect) and for descending intervals in the post-training test (small size effect). It is concluded that whilst some musicians will find it slightly easier to identify one interval direction in the vibrotactile domain, this is likely to change as they become more familiar with the task, for example, through training.
By contrast, professional musicians with hearing impairments using the fingertip obtained higher correct scores for ascending rather than descending intervals and this was a medium size effect when only considering the two participants (W and X) whose correct scores were not close to chance.
Previous work by Egloff et al. (2018) considered only ascending intervals but the finding that ascending and descending intervals can differ indicates the potential importance of considering both directions when testing relative pitch.
Limitations and future work
A limiting factor was the small number of professional musicians (n = 4) who were deaf and who were available to take part in this project. In addition, these participants lived sufficiently far from the laboratory that they were not able to carry out all of the 16 training sessions face-to-face. Due to the variations in hearing loss (e.g., unilateral/bilateral, conductive/sensorineural/mixed/auditory neuropathy spectrum disorder, congenital/non-congenital) experienced by members of the deaf community with and without musical training it might be beneficial to run future studies across several countries so that large homogeneous test groups can be formed. It would also be necessary to install the equipment in or near the homes of the participants so that regular training sessions could be carried out over an extended period of time, possibly with a trained professional rather than an automated system running these sessions. For such a study it would be appropriate to measure individual thresholds to ensure that stimuli are presented at the prescribed level above threshold.
To extend the understanding of what is achievable with music performance using vibrotactile stimuli, future work could investigate relative pitch using (a) tones with durations corresponding to a range of musical notes over a range of tempos – to identify the shortest duration that is feasible, (b) different durations between notes – to identify any issues with masking, (c) notes between C1 and C3 – to extend the range of notes beyond this study, (d) presentation levels above measured thresholds for the individual participants with equal numbers of male and female participants and (e) the perception of dyads and chords – to assess the feasibility of presentation at a single point on the body or whether multiple areas might be necessary.
Since carrying out the experiments reported in this article, the equipment has been installed at the Royal School for the Deaf Derby (UK) where it has been used by the music teacher with primary and secondary pupils to study pitch and how to find, compose and play pitched melodies (Hopkins et al., 2020). This indicates that there is potential for future pedagogical research on using vibrotactile equipment in music education.
Conclusions
Experiments on basic relative pitch in the vibrotactile mode have established the musical intervals that can be identified on the fingertip and forefoot over a two-octave range of notes from C3 to B4 when presented above the average detection threshold with a specific set of contactors. There was no significant difference between the relative pitch discrimination ability of professional musicians with and without hearing impairments, in pre-training using the fingertips, for stimuli consisting of intervals between one and 11 semitones. There was no significant difference between amateur and professional musicians with normal hearing in the pre- and post-training tests using the fingertips. For these musicians with normal hearing there was a high success rate for relative pitch discrimination (ascending and descending) with or without training. However, training also helped to reduce the within-group variance for musicians with normal hearing. After training, they obtained median scores greater than 70% using both fingertips and forefeet for intervals of 3–12 semitones.
These findings demonstrate the potential for musicians to perceive pitch cues that could be used in group performance. This supports anecdotal evidence on the importance of vibration when playing music from some professional musicians with a hearing impairment (Fulford et al., 2011). Considering these results alongside those from Egloff et al. (2018) indicates that perception of relative pitch on glabrous skin is feasible for intervals of 3–12 semitones over a range of notes from C2 to B4 and a range of note durations. The current work indicates that notable improvements can be achieved in a series of short, simple training sessions. However, a more rigorous form of training could be developed that focused on the interval of a tone as this is likely to be on the cusp of feasibility with Pacinian mechanoreceptors on glabrous skin. In this study we were only able to test four professional musicians with a severe or profound hearing loss. Two of the participants performed similarly to professional musicians with normal hearing, while the other two performed close to chance. Due to the highly variable nature of the musical training and experience of people with hearing impairments, training sessions may need to be tailored to the individual. Future studies would benefit from a larger cohort of participants with a severe or profound hearing loss.
Footnotes
Acknowledgements
The authors are grateful to the anonymous reviewers and to Andrea Schiavio, who fulfilled the role of Acting Editor-in-Chief for this article.
Funding
The authors disclosed receipt of the following financial support for the research, authorship, and/or publication of this article: This research was supported by the Arts and Humanities Research Council (AHRC) [Grant number AH/H008926/1, 2010 – 2013].