
Abstract
This paper offers a series of characterizations of prototypical musical timbres, called Timbre Trait Profiles, for 34 musical instruments common in Western orchestras and wind ensembles. These profiles represent the results of a study in which 243 musician participants imagined the sounds of various instruments and used the 20-dimensional model of musical instrument timbre qualia proposed by Reymore and Huron (2020) to rate their auditory image of each instrument. The rating means are visualized through radar plots, which provide timbral-linguistic thumbprints, and are summarized through snapshot profiles, which catalog the six highest- and three lowest-rated descriptors. The Euclidean distances among instruments offer a quantitative operationalization of semantic distances; these distances are illustrated through hierarchical clustering and multidimensional scaling. Exploratory Factor Analysis is used to analyze the latent structure of the rating data. Finally, results are used to assess Reymore and Huron’s 20-dimensional timbre qualia model, suggesting that the model is highly reliable. It is anticipated that the Timbre Trait Profiles can be applied in future perceptual/cognitive research on timbre and orchestration, in music theoretical analysis for both close readings and corpus studies, and in orchestration pedagogy.
Researchers have been probing timbre’s multidimensional perceptual space for several decades, beginning in the 1970s and including such landmark studies as Wessel (1973), Grey (1977), Kendall and Carterette (1991), and McAdams et al. (1995). While interest in timbre linguistics has been evident since that time (e.g., von Bismarck, 1974; Faure et al., 1996; Kendall & Carterette, 1993a, 1993b; Pratt & Doak, 1976), timbre’s multidimensional semantic space has drawn increasing interest from scholars, particularly in recent years (e.g., Elliott et al., 2013; Reymore & Huron, 2020; Traube, 2004; Wallmark, 2014; Wallmark, 2019; Zacharakis et al., 2014, 2015). The linguistics of timbre and timbre semantics have been referred to as equivalent subjects, although consideration of the linguistics of timbre as a branch of timbre semantics opens conceptual space for the study of non-linguistic communication of semantics—for example, via cross-modal matching. Specifically, the linguistics of timbre is concerned with how timbral meaning and experience are verbally communicated. Initial research offers converging evidence that timbral vocabularies can hold intersubjective reliability and are constrained by discrete conceptual schemas (e.g., Reymore & Huron, 2020; Wallmark, 2019), particularly within musical/cultural discursive communities. 1 This perspective on timbral vocabulary is developing in contrast to traditional views, which, as noted by Wallmark and Kendall (2018), have branded the practice of timbre description as vague, imprecise, and/or unsystematic.
Timbre linguistics research often focuses on timbre qualia (Saitis & Weinzierl, 2019), or what-it-is-like to experience different timbres. While the term qualia comes from philosophy (e.g., Chalmers, 1996; Dennett, 1993), in the past two decades, music cognition has adapted the term in relation to the phenomenal experience of music or musical elements (e.g., Arthur, 2018; Dowling, 2010; Hansberry, 2017; Huron, 2006; Shepard, 2009). Arthur (2016) argues that individuals with shared experiences of particular musical qualia are able to use language to index these experiences. Reymore and Huron (2020) introduced a 20-dimensional linguistic model reflecting Western musicians’ conceptions of qualia associated with typical instrument sounds through verbal descriptions. This model, built with the intention that it could be used in music theoretical analysis, was empirically derived through a multi-stage study. An initial timbre lexicon was generated through interviews with musicians in which they were asked to imagine and describe a series of musical instrument timbres; content analysis of the transcripts yielded 77 categories. To reduce the dimensionality of the model, participants in a subsequent rating task imagined the timbres of the 20 instruments previously described in the interviews, judging each on the 77 categories using seven-point rating scales. Interpretation of Principal Component Analyses and supplementary polls resulted in the final 20-dimensional model of musical instrument timbre qualia, reproduced in Table 1.
20-dimensional model of musical instrument timbre qualia; reproduced from Reymore and Huron (2020). Dimension descriptions were derived from component loadings of the Principal Component Analyses and contain between one and seven adjectives; the authors also offer shorthand labels for these dimensions, reported in the righthand column; these are intended to facilitate discussion.

The 20-dimensional model offers an unusually high number of timbre dimensions; previous timbre studies, including those using dissimilarity ratings, those using rating scales, and those using combined methods, often report between three and five dimensions (e.g., von Bismarck, 1974; Elliott et al., 2013; Kendall & Carterette, 1991; Kendall & Carterette, 1993a & 1993b; Kendall et al., 1999; McAdams et al., 1995; Pratt & Doak, 1976; Zacharakis et al., 2014, 2015). Reymore and Huron’s model is distinct from this previous work in that terms were generated from the content analysis of interviews. The authors consider that three to five dimensions may be sufficient in some contexts, but in many situations of everyday musical life, such low dimensionality would be inadequate. In the interest of comparing their results to past research, Reymore and Huron (2020) built a three-dimensional model with their rating data, finding it to be comparable to the commonly derived brightness-roughness-fullness model (for an overview, see Saitis & Weinzierl, 2019). In this case, however, the model only explained 39% of the variance. By comparison, much more variance was explained in previous models of similar dimensions, such as those of von Bismarck (1974) and Kendall and Carterette (1993a; 1993b), where variance explained by 2–4 factors is typically greater than 80% or 90%.
The goal of the current study was to create a set of tools for music analysis, specifically by mapping how different musical instruments tend to be circumscribed conceptually within Reymore and Huron’s 20-dimensional model. Accordingly, the current study generates verbal profiles, referred to hereafter as Timbre Trait Profiles (TTPs), by applying the 20-dimensional model to musical instruments commonly used in Western large ensembles. The methodology used to create the TTPs is similar to that of Reymore and Huron (2020), although the list of adjectives rated by participants is shorter—here a list of 20 rather than 77—and the collection of instruments rated is larger. Specifically, participants imagined the sounds of various musical instruments and used the 20-dimensional model to rate each timbre. The results, which summarize how imagined instrument timbres vary on 20 semantic dimensions, present general overviews or character sketches of the instruments based on musicians’ conceptions of prototypical sounds.
Typical timbres produced by a given musical instrument result from an instrument’s physics and acoustical features. These acoustical features, either individually or in combination, may contribute in part to the determination of an instrument’s semantic affordances via cultural or ethological pathways. That is, some instruments seem better suited to convey certain meanings than others. For example, Hailstone et al. (2009) found that affect recognition of melodies was influenced by pairing the melodies with particular instruments. Huron et al. (2014) observed that participants’ judgments of an instrument’s capacity for sadness were correlated with acoustic properties known to contribute to sad prosody in speech. Schutz et al. (2008) investigated a corpus of music for xylophone, an instrument which is acoustically limited to produce short durations and a brighter timbre and therefore may be limited in its semantic affordances due to its inability to mimic sad speech prosody. They found that there are disproportionately fewer minor-key (nominally sad) works in the tonal literature for xylophone, suggesting an influence of the instrument’s semantic affordances on compositional practice.
The construct of personality can serve as a useful method for understanding the contributions, implications, and limitations of Timbre Trait Profiles. In the field of psychology, personality assessments help researchers and practitioners to “examine individual differences in response styles, unravel the origins of distinctive behavior patterns. . .[and] discern an individual’s frame of mind and behavioral tendencies” in order to “reach relevant conclusions and make useful recommendations” (Weiner & Greene, 2017, p. xiii). The current research shares similar goals in relation to musical instruments: Timbre Trait Profiles provide a tool for future research to investigate how semantic affordances shape compositional practice and listener experience. Personality descriptors are likely to apply to a person’s typical behavior, although people naturally vary in how strongly they express different personality traits in different contexts. In parallel, consider the example of the piccolo, which has a Timbre Trait Profile with an especially high rating on sparkling, shimmering, brilliant, bright (sparkling/brilliant). This relatively high rating does not imply that the piccolo manifests as equally sparkling/brilliant in every context: its sound may be perceived as especially sparkling/brilliant when playing an exuberant, percussive melody in the high register at a forte dynamic and much less so when playing legato, sustained tones at a piano dynamic in the low register. Yet it may be useful to describe the piccolo as a sparkling/brilliant instrument in a similar way to how it may be useful to describe a person as bubbly, dour, or even-keeled.
Timbral variability within musical instruments is outside the scope of the current study but could be addressed in future research using similar methodologies. Sounds produced by many instruments are affected by the manipulation of multiple parameters, including but not limited to pitch/register, dynamics/intensity, duration, and articulation (Siedenburg & McAdams, 2017). McAdams and Goodchild (2017) make the point that each instrument does not have a single timbre but can produce a “constrained universe of timbres” (p.129). Timbres—and corresponding timbre qualia—are known to vary with pitch (Siedenburg & McAdams, 2017), and these variations are also complicated by the specificities of a given instrument type (e.g., Drabkin, 2001). However, these and other variations notwithstanding, there are also timbral constants that are evident. That is, there is something clarinetish about a clarinet sound, enough so that we can learn to identify a large range of sounds that a clarinet can make as coming from a clarinet. Sandell and Chronopoulos (1996) proposed the term macrotimbre to describe the formal unity of timbres associated with a single source, inclusive, for example, of variation in timbre across an instrument’s range. Soden (2020) adapts this idea, using instead the term metatimbre, for the purpose of describing collections of related timbres including—but not limited to—those produced by a single instrument. The method for building the Timbre Trait Profiles takes a top-down approach to macrotimbre, or instrument metatimbre, by using auditory imagery of instrument timbre qualia prototypes to examine the big picture, as it were, offering broad, general impressions of each instrument’s timbral character.
The Timbre Trait Profiles presented in this paper may prove useful in compositional pedagogy, music theoretical analysis, and future empirical studies of timbre. For example, Timbre Trait Profiles may serve as the basis for orchestrational recommendations by suggesting musical circumstances in which a given instrument is likely to flourish or to struggle, valuable information for the practices of composition and orchestration. In analysis, the profiles provide a means for the theorist to quantify moments where musical instruments are employed prototypically and where the written music requires instruments to act against their semantic affordances, perhaps undermining listener expectations of an instrument’s timbral character. Such an analytical approach may have particular relevance to developing an understanding of timbre’s contribution to musical meaning. Orchestrational analysis may also benefit from information about the semantics of prototypical instrument sounds. Additionally, these results may be helpful for future timbre experiments; for example, the profiles could help inform stimuli selection, or the reported distance metrics may offer an appropriate operationalization of timbral contrast.
First, this article reports the results of a rating task in which musician participants rated 34 common Western large ensemble instruments on the 20 dimensions of Reymore and Huron’s model. These results are used to generate the Timbre Trait Profiles, which are illustrated using radar plots and summarized using verbal snapshot profiles. An examination of Euclidean distances among instruments, visualized with hierarchical clustering and multidimensional scaling, offers a third perspective. Additionally, Exploratory Factor Analysis (EFA) is used to analyze the latent structure of the data. Finally, results of the current study are used to assess the 20-dimensional timbre qualia model’s between-subject reliability through comparison with the results of the 77-category rating task reported in Reymore and Huron (2020).
Method
Participants
The current study follows the methodology of Reymore and Huron (2020) in using imagined sounds as stimuli. The authors contended that when the goal is to collect information about types rather than tokens, imagined sounds are more likely to provide insight into prototypical instrument sounds than any particular recording of an instrument. Imagined rather than recorded sounds were used because the target for the ratings was an instrument’s prototypical sound rather than any specific instantiation. Previous work suggests that people compare imagined timbres similarly to perceived timbres (Halpern et al., 2004), and Tużnik et al. (2018) found that electrophysiological measurements reflected differences in imagined timbres. Huron (2006) observed that when asked to imagine specific musical sounds, people tend to imagine the most commonly occurring elements (for example, when asked to imagine a chord, musicians tended to imagine a major chord in root position, the most common chord in Western music). For further background on the motivation and rationale for using imagined stimuli, see Reymore and Huron (2020).
The use of imagined stimuli meant that participants had to be familiar with the instruments being judged and able to vividly imagine the sounds produced by these instruments. Thus, recruitment was directed toward musicians, particularly those with experience in large ensembles containing a variety of instruments (e.g., orchestra, wind ensemble). Recruitment took place through (1) the Internet via listservs and social media (n = 204) and (2) the Ohio State University School of Music participant pool (n = 39), which consists of second-year undergraduate students pursuing a music major, for a total of 243 participants. Participants recruited via the Internet took the survey in a location of their choice while those recruited from the participant pool were tested individually in an Industrial Acoustics Corporation sound attenuation room. All participants took the same Qualtrics survey via web browser.
Participants self-reported their level of musical sophistication using a single-question measure taken from the Ollen Musical Sophistication Index (Ollen, 2006; see also Zhang & Schubert, 2019). Three participants identified as non-musicians but reported six or more years of regular musical practice; these data were included in analysis (see Supplementary Material for further detail). On average, participants were 32.8 years old (range = 18–77, SD = 13.8) and reported 21.2 years of regular musical practice (range = 1–67, SD = 13.8).
Procedure
Participants were asked to imagine the sounds of and subsequently characterize common Western instruments according to the 20-dimensional timbre qualia model. This task was descriptive and normative and no a priori hypothesis was tested; rather, the goal of the study was to generate Timbre Trait Profiles that can be used in future empirical research and analysis of works written for Western large ensembles. The 34 instruments rated in the study, listed in Table 2, represent standard instruments of the orchestra and wind ensemble.
The 34 musical instruments rated in the current study.

Participants were provided with the full dimension descriptions (Table 1, left column) and asked to rate how well each dimension described the instrumental sound they were imagining by using a seven-point scale ranging from 1 (does not describe at all) to 7 (describes extremely well); midpoints were not labeled. Instructions for the rating task are provided in the Supplementary Material. For each target instrument, participants rated the familiarity of the instrument. Data were only collected for instruments for which a participant reported moderate familiarity or better. Next, they were instructed to imagine the instrument playing a single, sustained (if applicable) sound and to rate the vividness with which they were able to do so. Instructions requested that the participants imagine a professional sound rather than that of a beginner or amateur. No data were collected if a participant rated the vividness of their imagined sound below 4 on the seven-point scale. Finally, participants were asked to re-imagine the sound and to make ratings on the 20 dimensions. To avoid an excessively long study, participants were asked to rate a subset of 11 randomly selected instruments to complete the survey, a task which took around a half hour.
Data Quality Check
Although the survey skipped instruments with which a participant was not at least moderately familiar or could imagine at least moderately vividly, it is still possible that poor-quality data could result from participant misconceptions of the instrument or the sound. It was decided a priori that outliers would be excluded using the same exclusion criteria applied in Reymore and Huron (2020). Specifically, for each set of ratings for a given instrument, paired correlations were calculated with all other sets of ratings for that instrument. If a participant’s set of ratings for a given instrument exhibited an average correlation of less than r = .25 with other sets of ratings for that instrument, this set of ratings for that instrument was excluded from further analysis. Note that only sets of instrument ratings failing to meet the average correlation threshold were excluded; that is, not all instrument ratings from the participant were discarded. However, also following Reymore and Huron (2020), it was predetermined that no more than 25% of instrument-participant judgments would be eliminated and that at least 20 judgments would be available for each instrument. When necessary for a given instrument, the correlation criterion of r = .25 would be weakened in increments of 0.05 in order to satisfy either or both of these conditions. This step became necessary for four of the 34 instruments in the current study.
Following the data quality check, a total of 165 (6.9%) of 2,377 instrument judgments failed to achieve the criteria, slightly higher than but still comparable to the 4.5% exclusion rate reported in Reymore and Huron (2020). After the exclusion process, 2,212 judgments remained. Overall, the average interrater correlation across all participants and all instruments after data exclusion was r = .48, again comparable to the average interrater correlation reported in Reymore and Huron (2020), r = .50. Average interrater correlation for individual instruments ranged from r = .28 (tenor saxophone) to r = .74 (cymbals).
After the elimination of outliers, the average number of sets of ratings for each instrument was 65 (SD = 13; range = 35–88; see Supplementary Material). Discrepancies in the number of ratings among instruments are related not only to the elimination of rating sets that did not meet the data quality criteria, but also to participant familiarity with the instruments (participants skipped instruments that did not meet the familiarity or vividness criteria) and to participants who ended the experiment early. The number of rating sets is relatively low (under 50) for the E♭ clarinet, English horn, baritone saxophone, and contrabassoon, suggesting that these instruments were less familiar or less vivid for participants. Indeed, prior to the data quality check, instruments with the lowest average familiarity ratings were E♭ clarinet, soprano saxophone, and contrabassoon, while instruments with the lowest average vividness were E♭ clarinet, viola, and xylophone. The most familiar and the most vivid instruments for participants on the whole were piano, violin, and flute. Familiarity and vividness were correlated at r = .71, comparable to the correlation of .70 observed in Reymore and Huron (2020).
Results
Means and medians for 34 instruments on each of the 20 dimensions are provided in the Supplementary Materials; this dataset represents the quantitative Timbre Trait Profiles. Note that in reporting and making use of mean ratings, the data are considered to be interval data; an assumption is made that the points on the seven-point scale were considered equidistant by participants. In describing the data in the Supplementary Materials, median is reported as an alternate measure of central tendency. To summarize the findings, Table 3 lists each of 20 dimensions along with the instrument that was most highly rated, on average, on that dimension, along with mean ratings.
Highest-rated instruments by dimension; instruments were rated on each dimension using a scale from 1 (does not describe at all) to 7 (describes extremely well).

The highest-rated means are greater than 4.5 for each dimension, suggesting that participants generally agreed each dimension was applicable to at least one instrument. Table 4 shows an alternative summary of the data by listing each of the 34 rated instruments along with their top descriptor and the corresponding mean.
Top descriptors by instrument (instruments listed in score order); instruments were rated on each dimension using a scale from 1 (does not describe at all) to 7 (describes extremely well).

Rumbling/low is the highest-rated dimension for six instruments, more than any other dimension. Percussive, sparkling/brilliant, and pure/clear are also relatively frequent as top descriptors, occurring for four instruments each.
Analysis
Following the calculation of summary statistics for the rating data, a number of analytical approaches were applied in order to visualize the results and to explore the underlying structure of the data. First, I describe the process of visualizing the Timbre Trait Profiles with radar plots and explain the accompanying snapshot profiles. Next, Euclidean distances among instruments are used to illuminate the results from three different angles: as indices of semantic distances, with hierarchical clustering, and with multidimensional scaling. Approaching the data from yet another perspective, I then calculate the semantic exclusivity for each instrument, a measure adapted from Lynott and Connell’s (2009) notion of modal exclusivity. Finally, the underlying structure of the data is assessed via Exploratory Factor Analysis (EFA). Following these analyses, the data are used to assess the model in terms of correlations among dimensions, relative applicability of descriptors, and rating reliability.
Radar Plots and Snapshot Profiles
Complete visualizations and summary snapshot profiles for the 34 Western musical instruments that were rated in the current study are included in the Supplementary Materials. Rating means are illustrated using radar plots, which allows for quick visual assessment of the profiles and comparison among different instruments. Each radar plot is accompanied by a snapshot table of the six most highly rated dimensions, on average, for each instrument, ordered by rating value from highest to lowest, and the lowest three dimensions. Examples of radar plots are provided in Figure 1; a sample snapshot profile for the B♭ clarinet is given in Table 5.
Snapshot profile for the B♭ clarinet (top six most highly rated descriptors). Means are reported on a rating scale from 1 (does not describe at all) to 7 (describes extremely well).

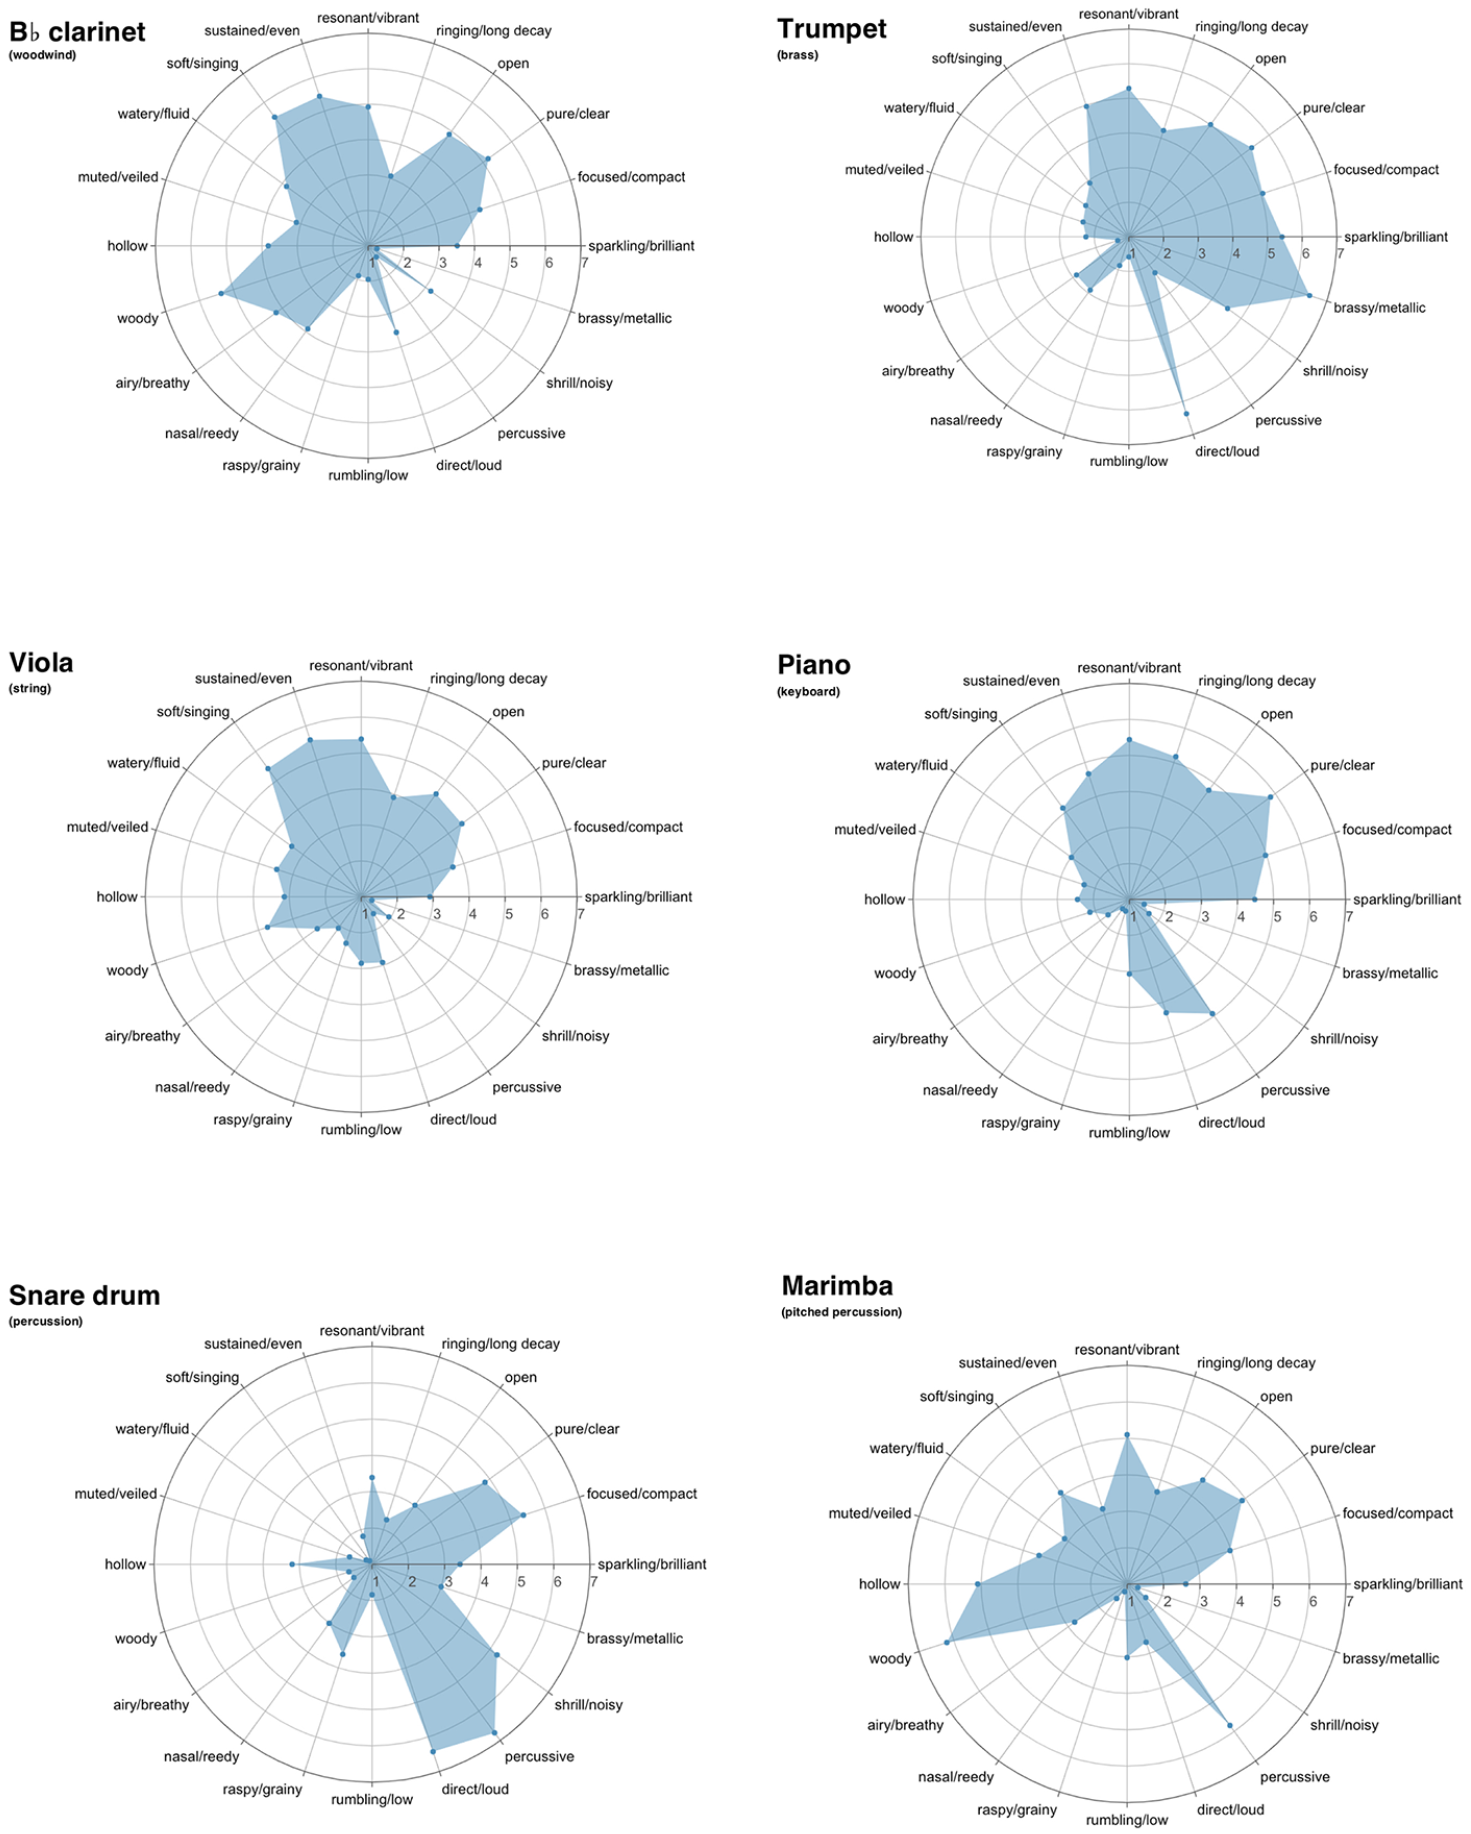
Example visualizations of Timbre Trait Profiles. Points on each radius mark the mean rating for the corresponding dimension. Visual and snapshot profiles for each of the 34 instruments are included in the Supplementary Material.
The primary goal for visualizing the TTPs was to create a thumbprint of an instrument’s semantic descriptions. This thumbprint would be as distinct as possible and represent the data in such a way that gross differences and similarities among profiles of different instruments are as apparent as possible. Radar plots are advantageous in this respect because each plot creates a single, unique shape that can be compared quickly via visual inspection.
One important consideration in creating visualizations is the order of the dimensions along the circumference of the radar plot. If the goal is to emphasize similarities and differences among instruments, an optimal solution might be to maximize similarities between adjacent dimensions. Such an approach simplifies the resultant shapes and thus renders them easier to visually compare, and accordingly, a solution was chosen that orders dimensions based on correlation strength. 2 For this purpose, a greedy algorithm was used to locally optimize correlations between pairs of adjacent dimension labels. The process started with the two dimensions with the highest correlation. The next dimension in the series was chosen by looking up which dimension had the next-highest correlation with the second element of the pair, and so on. While the greedy algorithm does not ensure an optimal solution, 3 it provides an easily calculated path through the dimensions which prioritizes high correlations between adjacent dimensions. With a circular map, this type of approach likely results in discontinuity between the end and beginning of the sequence. In practice, the only option left for the 20th dimension, after following through with the algorithm, was percussive, which did not positively correlate with its suggested neighbors. To address this issue, percussive was placed strategically in the circle so that all adjacent pairs were positively correlated (with respect to the full dataset) and so that correlations between pairs were locally maximized.
Verbal snapshot profiles, such as Table 5, provide the top six highest-rated descriptors and the bottom three lowest-rated descriptors for each instrument. Timbre Trait Profiles are likely often as descriptive of what an instrument is not as of what it is, an important consideration in determining future applications of the Timbre Trait Profiles. The piccolo, for example, is notably not rumbling/low, with a mean of only 1.10 on a scale of 1–7. Numerically, its not-rumbling/low-ness at 1.10 is even more characteristic than the top-rated dimension, sparkling/brilliant, which has a mean of 6.07. That is, the mean rating for rumbling/low is only 0.10 away from the minimum value of 1, but the mean rating for sparkling/brilliant is 0.93 away from the maximum value of 7. For these reasons, I have included not only the top six but also the bottom three descriptors for each instrument in the snapshot profiles. Still, the complete quantitative profiles provide the most comprehensive descriptions of the instruments. The radar plots also give a more complete summary impression of the TTPs than the snapshot profiles, as they visualize all 20 terms.
On visual inspection of the plots, it is evident that instruments generally have distinctive profiles; yet instrument family resemblances among the profiles are also apparent. For example, the radar plots for string instruments are visually similar. In the snapshot profiles, top descriptors for all four strings include resonant/vibrant, open, and sustained/even. Violin, viola, and cello additionally share in common pure/clear and soft/singing. Double bass and cello share rumbling/low as part of their profiles. Double bass is distinguished from the other strings by a high average rating on woody, the violin on sparkling/brilliant, and the viola on ringing/long decay. These types of similarities and overlaps are also apparent among the brasses and among the woodwinds.
A three-peaked signature combination of high ratings on resonant/vibrant, pure/clear, and open is notable among many of the instruments. This pattern is especially pronounced in higher register instruments, including the piccolo, flute, oboe, E♭ and B♭ clarinets, trumpet, violin, and viola, but is also readily apparent in some of the mid- to low- instruments, including French horn and cello. This combination also surfaces in vibraphone, piano, and harp, among others.
Euclidean Distances
Euclidean distances between pairs of instruments in the 20-dimensional semantic space have the potential to provide useful measures for future research as operationalizations of semantic distances. In theorizing orchestration practices, for example, semantic distances between instruments may play a role in how composers create timbral echo effects or timbral transformations of a motive or rhythm throughout a piece. For example, a gradual timbral transformation might be better accomplished through small steps in the semantic space while an effect of stark contrast might be easily realized through the juxtaposition of timbres that are semantically distant. Such investigations could be carried out not only through music-theoretical analysis, but also through behavioral experiments in which orchestration is manipulated via semantic distance and predictions are made about listener interpretation or affective response. Apart from theorizing existing practices, semantic distances could also serve as the basis for artistic experiments in orchestration.
Average Euclidean distances for each instrument suggest which instruments have timbres that are generally more closely related with the other 33 instruments and which stand out as most distinct in timbre description. Instruments with the lowest average Euclidean distances included the alto saxophone, viola, violin, tenor saxophone, and soprano saxophone, suggesting that these timbres tend to share similarities with many of the other tested instruments. Instruments with the highest average distances include crash cymbals, wood block, contrabassoon, snare drum, and bass drum. These timbres are the most distinct relative to the rest of the group. In general, percussion instruments have higher average Euclidean distances; this is consistent with the observation that while instruments within families (e.g., strings, brass) often tend to have similar timbres, percussion timbres are notably varied. Table 6 summarizes the Euclidean distances by showing the most similar instrument to each rated instrument (see Supplementary Material for complete distance matrix).
Euclidean distances in the 20-dimensional semantic space between each instrument, its nearest neighbor, and the instrument from which it is furthest.

Hierarchical clustering provides a means of visualizing relationships among the instruments based on Euclidean distances. The hclust() function from the stats package in R (R Core Team, 2020; version 4.0.0), which uses Ward linkage with Euclidean distance, was used to produce Figure 2.

Hierarchical clustering of 34 instruments from ratings of the timbre qualia dimensions.
At the level of two clusters, instruments are somewhat loosely grouped into percussion and non-percussion instruments, with the exceptions of the bass drum, timpani, and vibraphone. Harpsichord is grouped with the percussion instruments, while the piano and harp are not, and so this percussion-grouping interpretation is to some extent dependent on one’s classification of harp, piano, and harpsichord, which share features of both string and percussion families. Notably, the piano, harp, and vibraphone form a higher-level cluster together. One interpretation of the three-cluster solution could be Percussion, High instruments, and Low instruments, although the bass drum and timpani reside with the low instruments rather than percussion, suggesting that dimensions related to pitch, like rumbling/low—and perhaps also to brightness, like sparkling/brilliant—are what separated these instruments out from the rest of the percussion instruments. With increasingly fine-grained solutions, pitch—or perhaps more specifically, position within orchestral register—seems to continue to be an important factor in the way smaller clusters are parsed, with clusters tending to contain instruments that play in approximately similar registers.
The nearest neighbors suggested by this model are generally from the same family (woodwind, brass, percussion). Some exceptions are apparent, such as piccolo paired with trumpet and flute paired with violin, but similarities are apparent within such pairings (e.g., piccolo and trumpet are both piercing and projecting, violin and flute are both melodious and singing). Clustering carried out by Wallmark (2019) based on descriptions of instruments found in orchestration treatises suggested that descriptive lexicons for some instruments seem to be more family-dependent than others; this also appears to be applicable to the data from the current study.
Multidimensional scaling (MDS) provides a second way of modeling the data using Euclidean distances. MDS was performed for the purpose of visualizing relationships among the instruments, using the smacof() function from the smacof package in R (de Leeuw & Mair, 2009). Normalized Stress-1 values for 2D, 3D, 4D, and 5D solutions were .206, .114, .031, and .022, respectively, suggesting an optimal 4D solution. However, in the interest of enhancing visualization and interpretability, the 3D solution is presented below (Figure 3). The dimensions arising from both the 3D and 4D solutions are not clearly interpretable, however, the 3D solution intriguingly illustrates grouping by instrument family. For example, brass instruments appear to be grouped higher on the z dimension and lower on the x dimension, which separates them from other instruments. While the territories of each of the instrument families overlap, the families seem to consistently occupy a particular area of the three-dimensional space. Note that the harp and two keyboards, which have properties of both string and percussion instruments, also appear to occupy a kind of intermediate space in the 3D MDS solution between string and percussion groups.
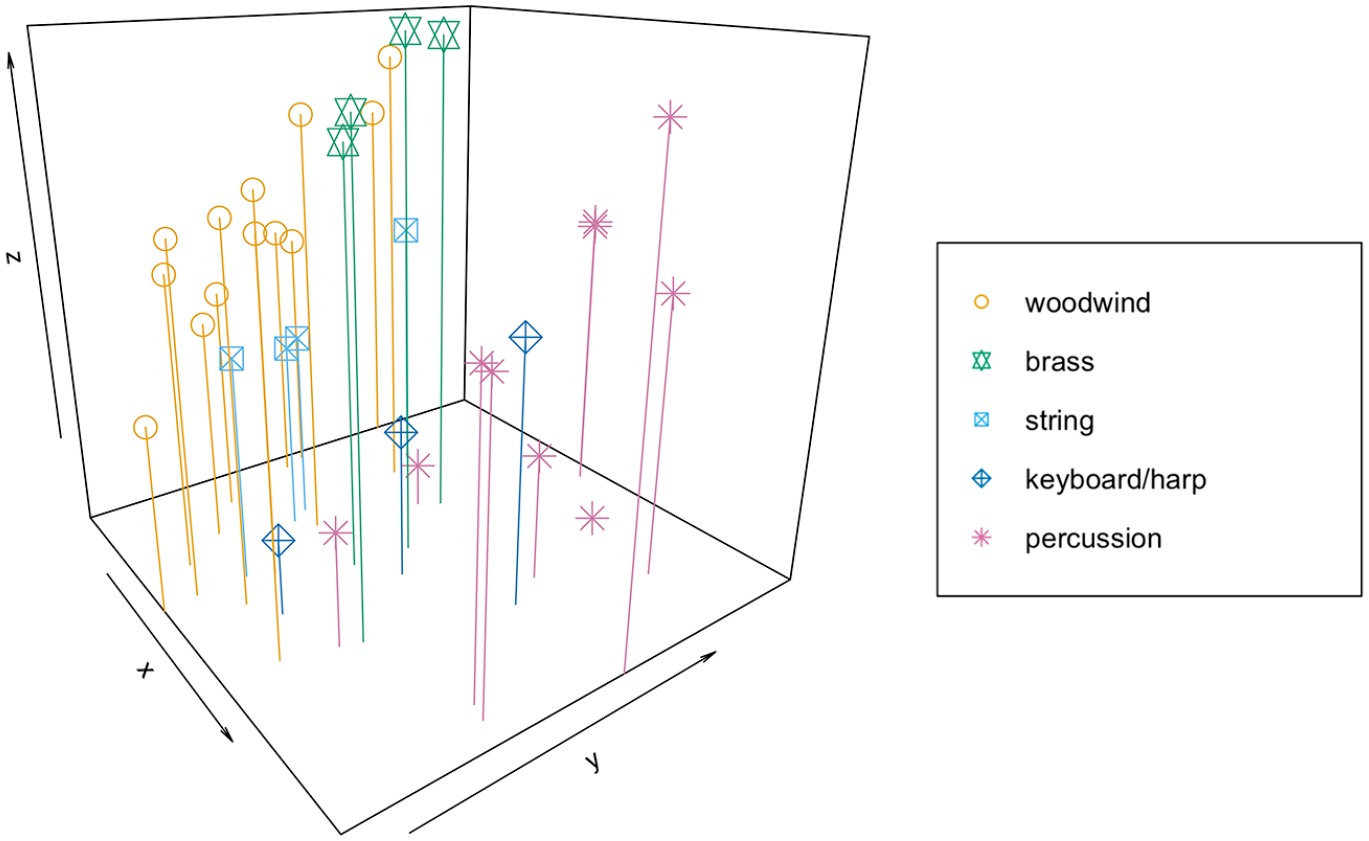
Multidimensional scaling of musical instruments in three dimensions; instrument family is indicated by both color and shape. For additional visualizations, see Supplementary Materials.
Semantic Exclusivity
Following a reviewer suggestion, a measure of semantic exclusivity was adapted from the concept of modal exclusivity introduced by Lynott and Connell (2009), in which participants rated a set of adjectives on how strongly each property was experienced via five modalities (visual, haptic, auditory, olfactory, and gustatory). In that study, modal exclusivity, defined as the range of values divided by the sum, provided a measure of how unimodal each property is. This yields a series of scores from 0 to 1 or 0% to 100%. Here, for each instrument’s vector of mean ratings on the 20 scales, semantic exclusivity was calculated as the range of values divided by the sum. Instruments with closer-to-equal means on all semantic scales will have lower values; for example, if an instrument had the same mean rating for all 20 scales, the semantic exclusivity score would be 0%. Higher values indicate that an instrument’s identity is more tightly tied to one or just a few dimensions. For example, if an instrument had a mean rating of 0 on all scales except one with a mean rating of 5, exclusivity would be 100%, demonstrating a strong connection between the instrument and the scale with the non-zero mean rating. Because this exclusivity measure requires that there is a possibility of a mean value of zero in order to achieve 100% exclusivity, I subtracted 1 from each rating before proceeding with the calculation—that is, the range of semantic scale scores was shifted from 1–7 to 0–6. Semantic exclusivity measures, reported in Table 7 below in ascending order, ranged from 6.2% to 13.8%. The tenor, alto, and baritone saxophones scored lowest on semantic exclusivity; that is, their semantic profiles are relatively more distributed across all scales. The wood block, snare drum, and bass drum scored highest on semantic exclusivity; that is, one or a few scales are particularly pertinent for these instruments. The mostly highly rated dimension for wood block and snare drum was percussive, while the top dimension for bass drum was rumbling/low.
Semantic exclusivity scores for the 34 rated musical instruments. For each instrument’s vector of mean ratings on 20 semantic dimensions, exclusivity was calculated as the range of values divided by the sum.

Exploratory Factor Analysis
Exploratory Factor Analysis (EFA) was performed in order to assess possible latent structure within the 20-dimensional space. 4 The Kaiser-Meyer-Olkin (KMO) statistic was calculated; the overall measure of sampling adequacy was .75, and Bartlett’s test of sphericity was significant, suggesting that EFA was appropriate for the dataset.
Eigenvalue and knee plot rules of thumb, which are common heuristics for determining the number of factors to retain, suggested retaining between four and six factors. Four factors explained 72% of variance; five factors explained 80%, and six explained 87%, with a clear drop-off in additional variance explained after six factors. The six-factor model was chosen both because it provides a plausible underlying structure of the current data and because it is comparatively more interpretable than models with fewer factors. The first factor seems to refer to material or instrument family, providing a kind of spectrum from woodiness to brassiness, where hollow and muted are associated with woodiness and sparkling/brilliant is associated with brassiness. The second factor relates to the envelope of the sound, with opposite loadings for percussive and sustained/even, where percussive likely insinuates a sharp attack and potentially also a fast decay, and where sustained/even suggests an attack that does not stand out and a relatively longer sound. The third factor contains strong loadings from open, resonant, and ringing/long. Open seems to primarily relate to the middle or body of the sound while ringing/long seems to relate to a sound’s decay or ending; resonant might be descriptive of both the body and decay of an envelope. Conceptually, these factors relate to what could be called the presence of a sound. The fourth factor represents sonic clarity, with high loadings from focused/compact and pure/clear. The fifth factor contains strong or moderate loadings from nasal/reedy, airy/breathy, raspy/grainy, and shrill/noisy, each of which seem to relate to noise or texture in a sound. Finally, the sixth factor appears to be primarily connected to intensity through the direct/loud dimension, though this factor also includes a notable contribution plausibly related to pitch, via rumbling/low. Table 8 shows the loadings for the six-factor EFA model; Table 9 lists correlations among factors.
Results of Exploratory Factor Analysis (EFA). Eigenvalues > 1; total variance explained by these six factors is 87%. Loadings ≥ .45 and ≤ −.45 are indicated in bold and with asterisks.

Correlations among EFA factors.

Model Assessment
In the following sections, the results of the study are used in three different ways to assess the original 20-dimensional model. The correlation matrix of ratings and the usefulness of specific descriptors are examined to determine whether dimensionality might be productively reduced in future applications of the model. Next, a measure of reliability is made by comparing current results with those from Reymore and Huron (2020) in the cases where instruments were used in both studies.
Dimensionality
In developing the timbre qualia model, Reymore and Huron (2020) selected 20 dimensions as a compromise between competing goals of maximizing variance explained and maintaining a practical number of dimensions for use in future empirical studies and music analysis. The task of rating instruments on 20 dimensions proved a reasonable one for the participants in the current study, as evidenced by the number of participants who completed the study as well as by participant feedback. However, the question remains as to whether 20 dimensions are optimal. The correlation matrix for the ratings collected in the current study (see Supplementary Material) provides pertinent information: while it is expected that there are likely weak to moderate correlations among dimensions, ideally, no two dimensions should be strongly correlated. A strong correlation between two dimensions would suggest that the model’s dimensionality should be reduced by collapsing these dimensions. A priori, a strong correlation was defined as one with an absolute value of r = .70 or greater.
Correlations were calculated and Holm-corrected using the rcorr() function from the Hmisc package (Harrell, 2020) in R (R Core Team, 2020; version 4.0.0). Of the 190 unique correlations among 20 dimensions, 26 are non-significant. The strength of 15 of the correlations ranged from an absolute value of r = .30–.39; 11 correlations ranged in absolute value from r = .40–.50. The absolute values of all other 133 correlations were less than r = .30. The average correlations of each dimension (calculated from the absolute values of the individual correlations) with the other 19 dimensions ranged from r = .11 (focused/compact) to r = .22 (soft/singing and sparkling/brilliant). No pairwise correlations were greater than or equal to the a priori criterion of the absolute value of r = .70, so no further reduction of dimensionality is recommended based on this metric.
To further explore the possibility of dimension reduction, Principal Component Analysis (PCA) was performed on the data. The results were highly similar to those of the EFA and interpretably equivalent, though the six-component model explained relatively less variance (65%), and thus did not offer a clear dimension reduction strategy.
Consideration of Descriptor Inclusion
Out of the 34 instruments, 27 include resonant/vibrant among their six top-rated descriptors, and 21 include pure/clear, suggesting that these are highly desirable timbral characteristics among Western ensemble instruments. Many instruments’ snapshot profiles also included either sustained/even (18) or percussive (12). The only dimension not included in any instrument’s top six descriptors was watery/fluid. On the one hand, if resonant/vibrant was commonly rated highly enough to be in the top six descriptors for almost all instruments, we might question its usefulness as a timbre descriptor for music analytical purposes. On the other hand, if watery/fluid was not included as a top six descriptor for any instrument, its usefulness might also be in question.
In the case of resonant/vibrant, all but three instruments received a mean rating greater than 4 (the midpoint of the scale); the average rating for resonant/vibrant across all instruments was relatively high at 4.99, with a range of means from 2.80 (wood block) to 6.19 (cello). However, even though resonant/vibrant does not demonstrate as much variance as some of the other dimensions, it is clear that it is an especially important part of the cognitive profiles of many of the instruments. Importantly, the relative lack of a resonant/vibrant quality can be especially characteristic for an instrument; for example, the wood block stands out for having relatively less of a resonant/vibrant quality in comparison to the other Western instruments tested. A similar argument can be applied to pure/clear (M = 4.68), for which means range from 2.27 (contrabassoon) to 6.11 (triangle): the lack of the pure/clear quale is one of the ways in which the contrabassoon is distinctive.
Watery/fluid has both a relatively low overall average (M = 2.84) and a relatively low maximum value (4.69, the flute), suggesting that participants found this dimension to be less applicable to the tested instruments compared to the other dimensions. Yet, while the average ratings on this dimension sit lower than for other dimensions, the range of values (min = 1.20, max = 4.69) is comparable to other dimensions. As in the previously described cases, the descriptor seems to prove useful for distinguishing certain instruments, such as flute, harp, and vibraphone, which received the three highest ratings, as the rest of the instruments received mean ratings below 4.0, 19 of which were below 3.0.
In sum, although certain dimensions may appear to be over-utilized (e.g., resonant/vibrant and pure/clear) and others under-utilized (e.g., watery/fluid), further consideration reveals that data for these dimensions remain uniquely informative for a subset of instruments. Consequently, no recommendations are made for dimensionality reduction based on assessment of the frequency of descriptor applicability.
Reliability
Seventeen instruments were rated according to both the 77-category model in Reymore and Huron (2020) and the final 20-dimensional model in the current study. This overlap offered the opportunity to examine external reliability of the 20-dimensional model through comparison of the mean ratings for the 17 instruments included in both studies. These instruments were not rated on exactly the same categories/dimensions in both studies. However, because the 20 dimensions of the final model were derived from Principal Component Analyses of ratings that used the 77-category model, it is possible to examine the correspondence between a given dimension of the 20-dimensional model and the average rating of that dimension’s ancestor categories from the previous 77-category model. The term “ancestor categories” is used here to indicate categories that loaded strongly onto the components from which the 20 dimensions were derived, based on the analysis of data from Reymore and Huron (2020). For example, one dimension of the 20-dimension model is soft/singing. Based on component loadings in the prior Principal Component Analyses, this dimension was interpreted as primarily a combination of four categories from the 77-category model: Soft/smooth, Singing/voice-like, Sweet, and Gentle/calm. If the timbre qualia model is reliable, for any given instrument that was rated using both of these models, the average mean rating for a dimension in the 20-dimensional model should be comparable to the aggregate average mean rating of the relevant ancestor categories.
Because the final 20 qualia dimensions were derived from principal components, the ancestor categories do not load equally onto their corresponding descendant dimensions, suggesting that one might use a weighted average of the ancestor categories based on the strength of the loadings. However, Reymore and Huron (2020) did not derive the final timbre qualia model from a single Principal Component Analysis but rather from a consideration of several (highly similar) analyses and additional supplementary polls among musicians that helped determine which components were most relevant to timbre qualia description. Consequently, the reliability check compared unweighted averages of ancestor category ratings to dimension ratings.
One caveat in considering this comparison as a measure of reliability is that while participants were recruited separately for this study and for the rating study in Reymore and Huron (2020), there was some overlap in the methods of recruitment. Thus, overlap in the participant pools for these two studies is possible, which has the potential to inflate the observed correlations between the two studies.
Complete correlations between actual and predicted ratings by instrument and by dimension are provided in the Supplementary Materials. For the 17 instruments rated in both studies, the aggregate correlation between the predicted mean and actual mean instrument ratings is quite strong at r = .96, providing evidence that the 20-factor model holds external reliability as a way of characterizing timbre, at least for the 17 instruments used in both studies and among Western musicians. Considering correlations as they pertain to individual instruments, the lowest correlation is r = .91 for the alto saxophone, and the highest is r = .99 for the wood block.
The aggregate average correlation between predicted mean and actual mean values for all dimensions is r = .95. Correlations range from r = .79 for hollow to as high as r = .99 for direct/loud, percussive, and sparkling/brilliant, with all dimensions except for hollow at r = .89 or higher. The correlation for hollow, while still strong at r = .79, is relatively lower than for the other dimensions. 5 Such high correlations are surprising, given the inexact mapping of ancestor to descendant categories, but suggest that the descendant categories are good representations of the ancestor categories and that the prototypical sounds that participants were imagining were similar across studies. Although these results do not establish the reliability per se of the 20-dimensional model, they nevertheless indicate high consistency in the responses. Overall, the model appears to have high reliability with respect both to how dimensions are used in rating and to how instruments are characterized.
Discussion
The 20-dimension model of timbre qualia developed in Reymore and Huron (2020) was used in a rating study to characterize the qualia of 34 common Western musical instruments, resulting in a series of Timbre Trait Profiles. These TTPs provide information on which of the 20 dimensions participants considered, on average, to be most descriptive of each instrument: for example, the most highly rated dimension for the trumpet was brassy/metallic, and the most highly rated dimension for the English horn was soft/singing. The results also identify which of the 34 target instruments participants considered on the whole to be most characteristic of each qualia dimension. For example, the instrument with the highest rating on sparkling/brilliant was the triangle, and the instrument with the highest rating on woody was the marimba. In addition to providing a summary of the most and least applicable dimensions by instrument, the snapshot profiles help illustrate the ways in which some potentially opposing timbre qualia dimensions work together as features of the same instrument. The English horn provides one example: it was rated highly on two potentially conflicting dimensions, having received high average ratings on both resonant/vibrant and muted/veiled. The vibraphone demonstrates that an instrument can be rated highly on both the percussive and soft/singing dimensions, likely due in part to its sustaining power, which is unusual among percussion instruments.
Many of the terms found in the top six descriptors for each instrument overlap with Wallmark’s (2019) account of the most frequent descriptors for instruments found in a corpus study of orchestration treatises. For example, the top six descriptors for the Timbre Trait Profile of the piccolo include sparkling/brilliant (complete set of terms: sparkling, brilliant, bright), shrill/noisy (shrill, harsh, noisy), and pure/clear (pure, clear, clean); among the adjectives that Wallmark lists as most frequently associated with the piccolo are bright, brilliant, shrill, and clear. The contrabassoon’s top-rated descriptors include rumbling/booming (rumbling, booming, deep, thick, fat, heavy) and nasal/reedy (nasal, reedy, buzzy, pinched, constrained), and the frequent descriptions from Wallmark (2019) include deep, heavy, thick, nasal, and buzzing. Almost all instruments catalogued by Wallmark contain overlap of at least a few exact terms with highly rated terms in the TTPs, but even more terms appear to be similar or synonymous. For example, the words penetrating, obtrusive, and piercing most closely map to the direct/loud dimension, and the instruments frequently described by those words in the orchestration treatises include direct/loud among their top descriptors.
Comparing the profiles visually demonstrates similarities among various subsets, notably among the string instruments and among the four saxophones. Some pairs of instruments with perceptually similar timbres, such as the bass drum and timpani or triangle and glockenspiel, yield markedly similar radar plots. Further information can be gleaned from the Euclidean distances, which can serve as operationalizations of semantic distances between instruments. In addition to identifying the instruments that are most similar with regard to the 20 qualia dimensions, the Euclidean distances also identify those instruments that might be deemed most semantically contrasting. For example, the instrument with the lowest mean Euclidean distance from the other 33 instruments was the alto saxophone, suggesting that its linguistic timbre characterization is on average more similar to other instruments; the crash cymbals demonstrated the highest average distance, suggesting that its descriptive profile is on average more different from the other instruments. A hierarchical clustering model and three-dimensional MDS model were constructed to visualize such relationships among instruments. The three-dimensional MDS model is particularly intriguing in that, while the dimensions are not interpretable, instruments from the same instrument families occupy particular portions of the timbre space, with overlap among families.
In general, the various ways of analyzing distance metrics suggest that the linguistic profiles of percussion instruments are distant from the non-percussion instruments; the crash cymbals and wood block in particular are especially distant on average from other instruments. The percussion instruments also tend to be higher on semantic exclusivity. Indeed, average semantic distance from other instruments correlates with higher exclusivity (r = .77). That is, those instruments that are on average more semantically different from other instruments in the set also tend to have profiles that cling more tightly to one or more dimensions. As an example, the wood block has the highest average distance and second-highest semantic exclusivity: dimension mean ratings for this instrument are for the most part either high or low (as evidenced by the radar plot’s particularly spiky shape), where high ratings on dimensions including percussive and woody are likely driving its exclusivity. In their study on perceptual modalities, Lynott and Connell (2009) found exclusivity values ranging from 9.6% to 98% with a mean of 46.1% (SD = 16.9%); the values reported here (6.2–13.8%, M = 9.2%, SD = 1.6%) are much lower and in a smaller range. This suggests that participants often found many of the scales to be at least somewhat applicable to each instrument, but the overall lower range may also be related to the relatively higher number of scales in the current study.
Conceptually at least, the idea that exclusivity is relatively low overall among instruments used in Western large ensembles is compatible with traditional/historical aesthetic priorities of the Western orchestra, where although individual timbres are essential for color, blend between and among instruments is often highly prioritized and is central to creating the complete palette of orchestral colors. For example, consider an instrument that is exceptionally perceptually distinctive relative to the instruments of the Western orchestra, such as the kazoo, for which blending with traditional orchestral instruments would present a challenge in most cases. The kazoo would also likely score relatively highly on semantic exclusivity—we might anticipate that it would receive very high ratings on nasal/reedy (which includes the word buzzy) and shrill/harsh/noisy but score low on most other dimensions. This possible link between perception and semantic exclusivity suggests the consideration that, although orchestral instruments are timbrally diverse, they may be relatively homogenous when considered against all potential musical timbres. Note that the percussion instruments with the most distinct timbres (via semantic distance) are also timbres with generally less capacity to blend and are often used as effect instruments (e.g., wood block, snare drum, bass drum). The above observations are intended to speculate about potential relationships among semantic exclusivity, distance, and blend, but further research is needed to understand the nature of these relationships, if they exist. Other factors are likely also at play in determining exclusivity values: for example, it should also be noted that contrabassoon and double bass, two especially low, foundational instruments, also have relatively high semantic exclusivity scores—in this case, the exclusivity is likely driven by the rumbling/low dimension, which seems to be conceptually particularly relevant for these instruments.
Exploratory Factor Analysis was used to examine the latent structure of the data. Common factors emerging from previous timbre studies often have often included variations on brightness, roughness, and fullness, such as the semantic dimensions of Luminance, Texture, and Mass from studies by Zacharakis et al. (2014; 2015, see also Zacharakis and Pastiadis, 2016). However, the EFA of the current data does not appear to conform to this pattern. For example, the sparkling/brilliant dimension of the 20-dimensional model, which includes the term bright, does not emerge as a primary factor; it instead loads with moderate strength (−.45) onto the component that primarily focuses on Material (brassy and woody) and loads with weaker but non-negligible strength across four of the other components. Rumbling/low, which in the previous study (Reymore & Huron, 2020) explained the most variance, loads most strongly onto the Intensity dimension, along with direct/loud, but is also distributed with moderate strength across several components; of the 20 dimensions, this is the closest correlate to the fullness or mass dimensions observed in previous work.
Intriguingly, although by no means an exact mapping, the EFA suggests a latent structure which does bear some resemblance to the five-dimensional model proposed by Elliott, et al. (2013). Their model was developed using a three-pronged approach with MDS of dissimilarity judgments, discriminant function analysis of semantic ratings, and spectrotemporal analysis. Notably, although their stimuli set was recorded and the current set was imagined, both used stimuli from Western orchestral instruments (though our set did not include historical instruments). The first dimension reported in Elliott et al. (2013) is labeled as hard, sharp, high-frequency energy balance, which may be to some extent similar to the Intensity component of the current study, which loads primarily onto direct/loud. Their second dimension, varying level, dynamic, vibrato, ringing release, seems related to the dimension in the current study that I have labeled Presence, which includes a strong loading from ringing/long. The third dimension, noisy, small instrument, unpleasant shares the element of noise with the Texture component but not the negative valence or size. Closest in meaning seem to be Elliott et al.’s fourth and fifth dimensions, where steady pitch, compact, pure maps to Clarity (and perhaps somewhat to Envelope as well, which includes sustained/even) and no semantic label; brass, not reeds seems to correspond to the Material component.
The current results were used to assess the 20-dimensional timbre qualia model by considering possibilities for dimensionality reduction, whether any descriptors merited exclusion from the model based on their applicability, and whether the model is reliable across studies. In the end, no recommendations were made for changes to the model in future research.
In addition to the correlation matrix, Principal Component Analysis was considered as a means of dimensionality reduction. Dimensionality reduction may be useful in experimental situations where 20-dimensional ratings may not be feasible. As in Reymore and Huron (2020), relatively higher numbers of components were necessary to obtain comparable variance levels found in previous studies. A six-component model explaining 65% of the variance, suggested by common heuristics, was explored, suggesting a set of components that I interpreted as Material, Clarity, Presence, Envelope, Texture, and Intensity. However, it does not appear that this PCA solution would be especially helpful in selecting a reduced subset of features to use in a future experiment that might be limited by time constraints. It should be noted that correlations among dimensions and the underlying structure of a rating set will be influenced by the timbres that are included in the stimuli set, whether imagined or recorded. Based on experience thus far using the full model with various stimuli sets, both imagined and recorded, I recommend that if reduction of the 20-dimensional model is necessary for practical purposes, the best approach is to first run a pilot study with the desired stimuli set and to let analysis of those results guide the choice of dimensions. If this is not feasible, the correlations and other data reported in this paper may serve as a guide (for example, the soft/singing and watery/fluid dimensions often seem appear close to each other, so it may be appropriate in some cases to collapse the two or to use only soft/singing).
Timbre Trait Profiles may prove useful in analyzing musical passages and provide insight into orchestration practices. Exploratory work in this area is reported in Reymore (2020). For example, the TTPs provide a novel way of discussing the relationships among linguistic characterizations of a group of instruments playing together in an ensemble; the use of consistent vocabulary among all instruments allows an analyst to pinpoint what semantic qualities one instrument offers that another does not. As another example, averages for each of the dimensions in a given combination of instruments can be computed beat by beat, whereby graphical representations can be produced to illustrate the development of semantic dimensions throughout the course of a piece, and passages or formal sections may be characterized by the semantics of their instrumentation.
While the Timbre Trait Profiles provide characterizations of prototypical instrumental timbres, further detail could be obtained from subsequent studies, especially regarding within-instrument variability in timbre. As previously mentioned, one limitation in the application of the Timbre Trait Profiles to music analysis is that these are characterizations of prototypical, imagined sounds and are thus generic representations; they do not capture an instrument’s variabilities on the dimensions as products of loudness/intensity, duration, articulation, or pitch height/register, and they do not account for extended techniques or factors such as the use of mutes. A comprehensive picture of how the TTP of each instrument varies on each of the factors mentioned would require a large amount of data. If it were the case that all instruments on all dimensions varied predictably and consistently as intensity, pitch height, articulation, etc. were manipulated, the task would be manageable, though still involved. It seems likely that simple rules might govern some of the relationships between dimensions and musical parameters. For example, it is reasonable to predict that as intensity/loudness increases on any instrument, ratings of direct/loud would increase. Similarly, we might anticipate that as pitch increases, ratings of rumbling/low would decrease. However, even if these general trends are true across instruments, the details of these relationships might differ, perhaps demonstrating a steeper increase in some instruments than others. Dimensions can vary in non-linear ways across pitch or intensity and might do so differently for different instruments (Reymore, in revision). Future research should also test to what extent TTPs reflect listener perception of instantiated timbre.
Another outstanding question is how semantic dimensions of component instruments relate to simultaneous combinations of instruments. For example, we do not know whether the simultaneous performance of two instruments rated highly on sparkling/brilliant necessarily produces a sparkling/brilliant combined sound. What is the result, as another example, of combining a soft/singing instrument with a low rating on direct/loud and a direct/loud instrument with a low rating on soft/singing? It is unlikely that this would result in a sound in which the values have been averaged, that is, a sound with moderate properties for both direct/loud and soft/singing. Instead, we might anticipate that the more direct/loud instrument becomes perceptually dominant.
This question is further complicated by the different ways in which instruments are combined in orchestration. McAdams et al. (in preparation; see also McAdams, 2019) describe a taxonomy of orchestration effects in relation to auditory grouping principles, proposing that auditory grouping principles determine to what extent we might perceive two timbres as blended or segregated. The way in which two parts are composed and the consequent auditory grouping will likely have an effect on how the timbre qualia dimensions interact in combinations of different instruments. For example, cues such as onset synchrony, harmonicity, timbral similarity, and parallel change in amplitude and frequency, all of which are compositional choices, influence whether two instrument sounds will be perceived as blended or separate. The same two instruments may be perceived as blended in one passage and separate in another. Even in cases where a blend is achieved, McAdams et al., following Sandell (1991), identify two types of blend: timbral emergence, in which a new timbre arises from a blend, and timbral augmentation, in which a dominant instrument is colored by the timbres of one or more other instruments. Such considerations should be taken into account during research concerning the emergent qualia dimensions of simultaneous instrument sounds.
While future research can help to augment the Timbre Trait Profiles with respect to instrument blends and within-instrument timbre, they currently offer insight into the conceptualization of prototypical instrument sounds and the ways in which these conceptualizations are communicated through the language of the 20-dimensional timbre qualia model of Reymore and Huron (2020). In this study, participants were able to use a shared vocabulary to provide consistent and reliable characterizations. These characterizations furthermore offer a set of tools for future research: the quantitative Timbre Trait Profiles, the visualizations, and an operationalization of semantic differences among instruments. I suggest that these tools may be able to provide insights into questions of orchestration, specifically addressing how instruments of similar or differing profiles tend to be used in combination or contrast to delineate musical structures and shape expression in Western ensemble music.
Supplemental Material
sj-docx-1-msx-10.1177_10298649211001523 – Supplemental material for Characterizing prototypical musical instrument timbres with Timbre Trait Profiles
Supplemental material, sj-docx-1-msx-10.1177_10298649211001523 for Characterizing prototypical musical instrument timbres with Timbre Trait Profiles by Lindsey Reymore in Musicae Scientiae
Footnotes
Acknowledgements
I would like to thank the reviewers for their careful reading, helpful feedback, and excellent suggestions for further analyses, including the EFA, MDS, and analysis of semantic exclusivity
Data Availability Statement
Declaration of Conflicting Interests
The author declared no potential conflicts of interest with respect to the research, authorship, and/or publication of this article.
Funding
The author(s) disclosed receipt of the following financial support for the research, authorship, and/or publication of this article: Open-access publication of this article was funded through the Canadian Research Knowledge Network (CRKN).
Supplemental material
Supplemental material for this article is available online.
Notes
References
Supplementary Material
Please find the following supplemental material available below.
For Open Access articles published under a Creative Commons License, all supplemental material carries the same license as the article it is associated with.
For non-Open Access articles published, all supplemental material carries a non-exclusive license, and permission requests for re-use of supplemental material or any part of supplemental material shall be sent directly to the copyright owner as specified in the copyright notice associated with the article.