
Abstract
Background:
Sepsis patients with insufficient tissue perfusion and hypoxia should be identified and resuscitated immediately. Recently, venous-to-arterial carbon dioxide pressure changes and the arteriovenous oxygen content difference ratio (Pcv-aCO2/Ca-vO2) as a predictor of tissue perfusion recovery and poor prognosis.
Objectives:
Pcv-aCO2/Ca-vO2 is a substitute for respiratory entropy, the elevation of which indicates a lack of tissue perfusion. Pcv-aCO2/Ca-vO2 can be used as an indicator to predict the prognosis of patients with sepsis or septic shock, but its prognostic value has not been fully evaluated. Here, we have performed a meta-analysis to assess its predictive value for mortality.
Methods:
Meta-analysis of Observational Studies in Epidemiology group guidelines were followed for this meta-analysis. We searched the comprehensive electronic databases of PubMed, EMBASE, Web of Science, and Cochrane libraries from inception to March 2019, using the terms including “venous-arterial,” “carbon dioxide,” “Shock, Septic,” and related keywords. The Newcastle-Ottawa scale was used for quality evaluation of the literature. A meta-analysis was performed using RevMan 5.3 and Stata 14.0 software to evaluate the effects of Pcv-aCO2/Ca-vO2 on short-term mortality, sequential organ failure assessment, and acute physiology and chronic health evaluation scores in patients with sepsis or septic shock.
Results:
The final analysis included 13 clinical studies involving a total of 940 subjects. The results of the meta-analysis showed that non-surviving patients had higher Pcv-aCO2/Ca-vO2 than survivors after fluid resuscitation (standardized mean difference = 0.68, 95% confidence interval = 0.24–1.12) and blood samples taken 6 h after resuscitation showed a greater risk of mortality (risk ratio = 1.89, 95% confidence interval = 1.48–2.41) and sequential organ failure assessment scores (mean difference = 1.58, 95% confidence interval = 0.88–2.28, P < 0.01) in patients with high Pcv-aCO2/Ca-vO2. These differences were statistically significant.
Conclusion:
This meta-analysis indicates that Pcv-aCO2/Ca-vO2 has predictive value for mortality in patients with sepsis or septic shock. Further studies are now required to determine the optimal threshold for predicting sepsis mortality.
Prospero Registration:
The protocol for this systematic review was registered on PROSPERO (CRD 42019128134).
Introduction
Sepsis is defined as life-threatening organ dysfunction caused by dysregulation or infection. 1 Septic shock is a branch of sepsis with circulatory, cellular, and metabolic abnormalities that is associated with a higher risk of death than sepsis alone.1,2 The primary management of septic shock patients is to correct hypoxemia and establish venous access for the early use of fluid replacement and antibiotic treatment. 3 In recent years, sepsis associated mortality has decreased4–6 but remains prevalent. In recent studies, sepsis-related mortality was reported as ⩾ 10%, and the mortality associated with septic shock was ⩾ 40%. 1 An array of indicators can predict the prognosis of these patients. In daily care, metabolic variables such as lactic acid and central venous oxygen saturation (ScvO2) are often used as substitutes for tissue hypoxia. Current resuscitation strategies rely on the rapid normalization of these parameters. Recently, venous-to-arterial carbon dioxide changes and the arteriovenous oxygen content difference ratio (Pcv-aCO2/Ca-vO2) is also an indicator. 7 The relevant calculations of this value including:
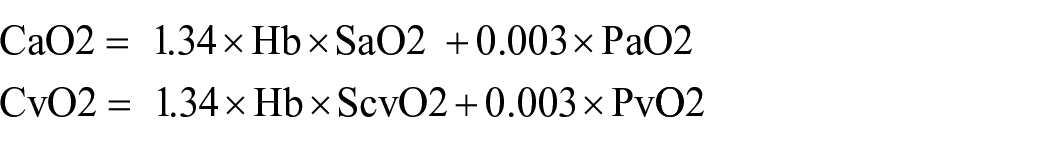
Pcv-aCO2/Ca-vO2 reflects the levels of respiratory entropy according to the Fick equation. 8 The literature found that compared with lactic acid, Pcv-aCO2, and ScvO2, elevated Pcv-aCO2/Ca-vO2 in patients with septic shock is an accurate marker of global anaerobic metabolism, and high ratios are associated with poor prognosis.9 –11 Changes in Pcv-aCO2/Ca-vO2 are more sensitive, so it becomes an attractive monitoring indicator. Gao et al. 12 believed that compared with the single application, the combined application of Pcv-aCO2/Ca-vO2 and lactic acid clearance can dynamically evaluate tissue perfusion to achieve precise treatment and improve patient prognosis. However, select studies have reported a lack of association of Pcv-aCO2/Ca-vO2 with patient mortality.13,14 A randomized controlled trial found that Pcv-aCO2/Ca-vO2 guided resuscitation did not improve the prognosis of patients with sepsis or septic shock. 15 Here, we performed a systematic review and meta-analysis to assess the prognostic value of Pcv-aCO2/Ca-vO2 in patients with sepsis or septic shock.
Material and methods
Literature search and study selection
This meta-analysis was conducted according to the Guidelines of the Meta-analysis of Observational Studies in Epidemiology group (MOOSE). Two researchers (WM and LTY) independently searched four databases including PubMed, EMBASE, the Web of Science and The Cochrane Library from inception to March 2019. The search terms included “venous-arterial,” “carbon dioxide,” “Shock, Septic” and related keywords. No restrictions on regions, publication types or languages were observed. According to the different databases, the terms were combined with keywords or free words for retrieval. References of all relevant articles were hand searched to uncover other potentially eligible studies.
Studies that met the following criteria were included: (1) observational studies (including prospective and retrospective studies); (2) sepsis or septic shock patients1,16 (⩾ 18 years old); (3) the primary endpoint of the study: association of death with Pcv-aCO2/Ca-vO2 levels. Exclusion criteria included: letters, commentaries, case reports, conferences, abstracts, expert opinions, in vitro studies, animal experiments, and editorials. Studies in which the full text was unavailable or the original study data could not be converted were also excluded.
Data extraction and quality assessment
The two investigators (NZ and ZJZ) screened the studies according to title and abstract. For articles that met the inclusion criteria, the full texts were read and data were extracted according to previous data extraction terms. If disagreements occurred, differences were resolved by discussion, and the third reviewer (WM) judged the differences for which no solution was reached. When necessary, the original author of the article was contacted to obtain supplementary data. Continuous variables in the article, if not expressed as mean ± standard deviation, but expressed as the median and interquartile range, were converted by Luo et al. 17 and Wan et al.’s 18 methods. Extracted information included: first author name, year of publication, study design, patient’s number, study population characteristics, levels of Pcv-aCO2/Ca-vO2, reported outcomes, and information to assess the risk of bias.
Two authors (WM and NZ) used the Newcastle-Ottawa scale (NOS) 19 to conduct risk bias assessments and quality assessment of the included articles without interference. Assessments consisted of three factors: representation of the study subjects, comparability between study groups, and the evaluation of outcome events. Risk scores for the scale ranged from 0–9. Studies with scores ⩾ 6 were considered low-risk. Differences were resolved through consultation with a third reviewer (LTY).
Statistical analysis
We performed quantitative analysis of the included studies when sufficient similarities were identified. Meta-analysis of the extracted data was analyzed using RevMan5.3 software provided by the Cochrane Collaboration and stata14.0. In other cases, descriptive analysis was used. For the categorical variables, the risk ratio (RR) was selected as the effect indicator, and the standardized mean differences (SMD) were used as the effect indicator of the continuous variable. 20 Prior to the meta-analysis, heterogeneity between the studies was assessed by the X2 and I2 statistic. If no heterogeneity was observed (P > 0.1, I2 < 50%), a fixed-effect model for meta-analysis was performed. If heterogeneity was identified between studies (P < 0.1, I2 ⩾ 50%), a random effects model was used for meta-analysis. Based on the characteristics of the included data, subgroup and sensitivity analysis were performed to eliminate heterogeneity and to calculate the combined effects. Funnel plots and the Egger et al.’s 21 tests were used to detect publication bias.
Results
Study selection
A total of 334 articles were retrieved from the initial screening. The screening flow chart is shown in Figure 1. Duplicated literatures were removed. The abstracts and titles were screened according to inclusion and exclusion criteria, and 20 articles were obtained. Following the analysis of full texts, six studies were excluded as the outcome data failed to meet the inclusion requirements. A single study was excluded as it described before–after study data. Finally, the meta-analysis included 13 studies7,10,12 –14,22 –28 consisting of 940 participants.
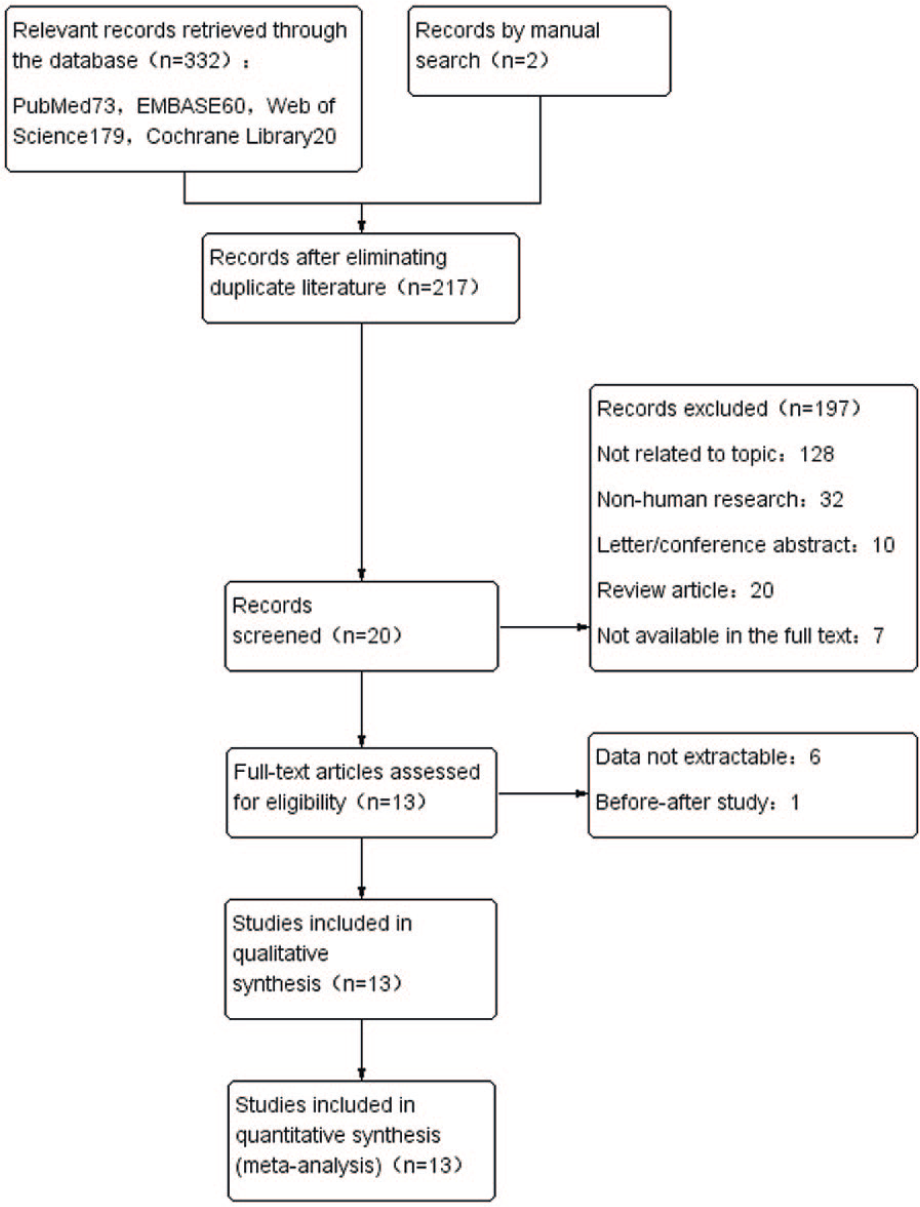
Flow chart of the literature selection process.
Quality assessment results
The NOS scores of the 13 studies are shown in Table 1. Scores ranged from 5 to 8 points. The overall quality of the studies was moderate, with two studies13,28 having scores of 5, three studies10,22,23 with scores of 6, five studies7,14,24 –26 with scores of 7, and three studies12,27,29 with scores of 8. Since all subjects were diagnosed with sepsis or septic shock at the time of enrollment, no studies had scores of 4. No studies scored 9.
The NOS scores of the 13 studies.
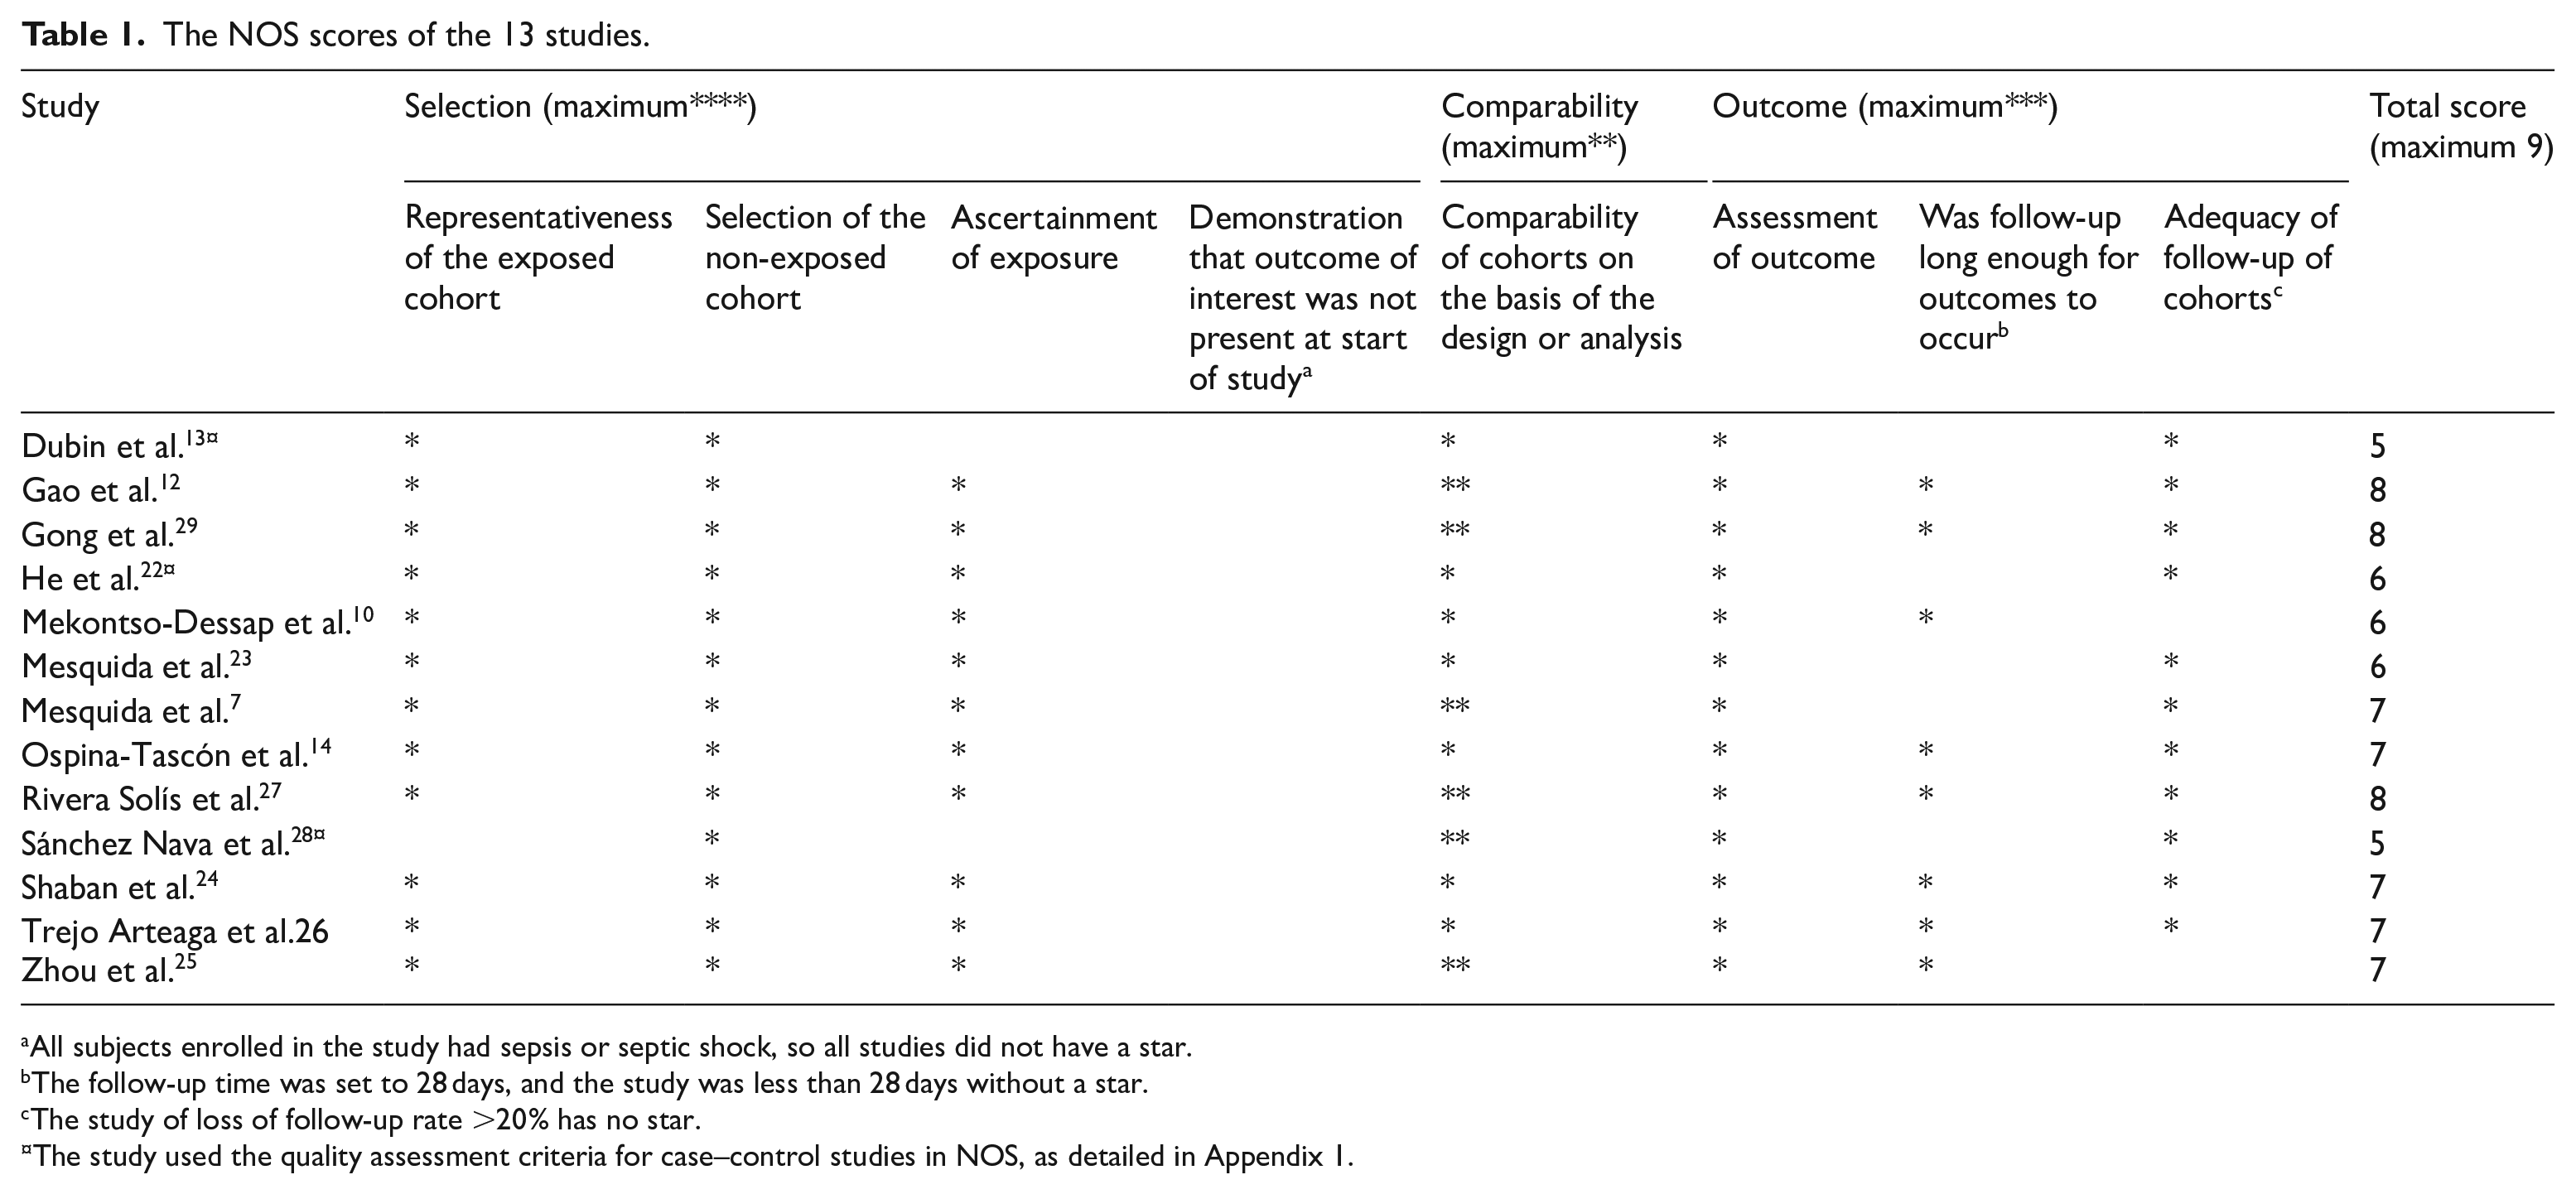
All subjects enrolled in the study had sepsis or septic shock, so all studies did not have a star.
The follow-up time was set to 28 days, and the study was less than 28 days without a star.
The study of loss of follow-up rate >20% has no star.
The study used the quality assessment criteria for case–control studies in NOS, as detailed in Appendix 1.
Publication bias was explored using the Egger et al.’s 21 test and funnel plots (P < 0.1 indicated significant bias; Figure 2). The included studies respectively contained Pcv-aCO2/Ca-vO2 levels for survivors and non-survivors (Figure 2(a)) and 28-day mortality in patients with high Pcv-aCO2/Ca-vO2 and low Pcv-aCO2/Ca-vO2 values (Figure 2(b)). The funnel plots and Egger’s test revealed no significant publication bias (P = 0.191), (P = 0.05).
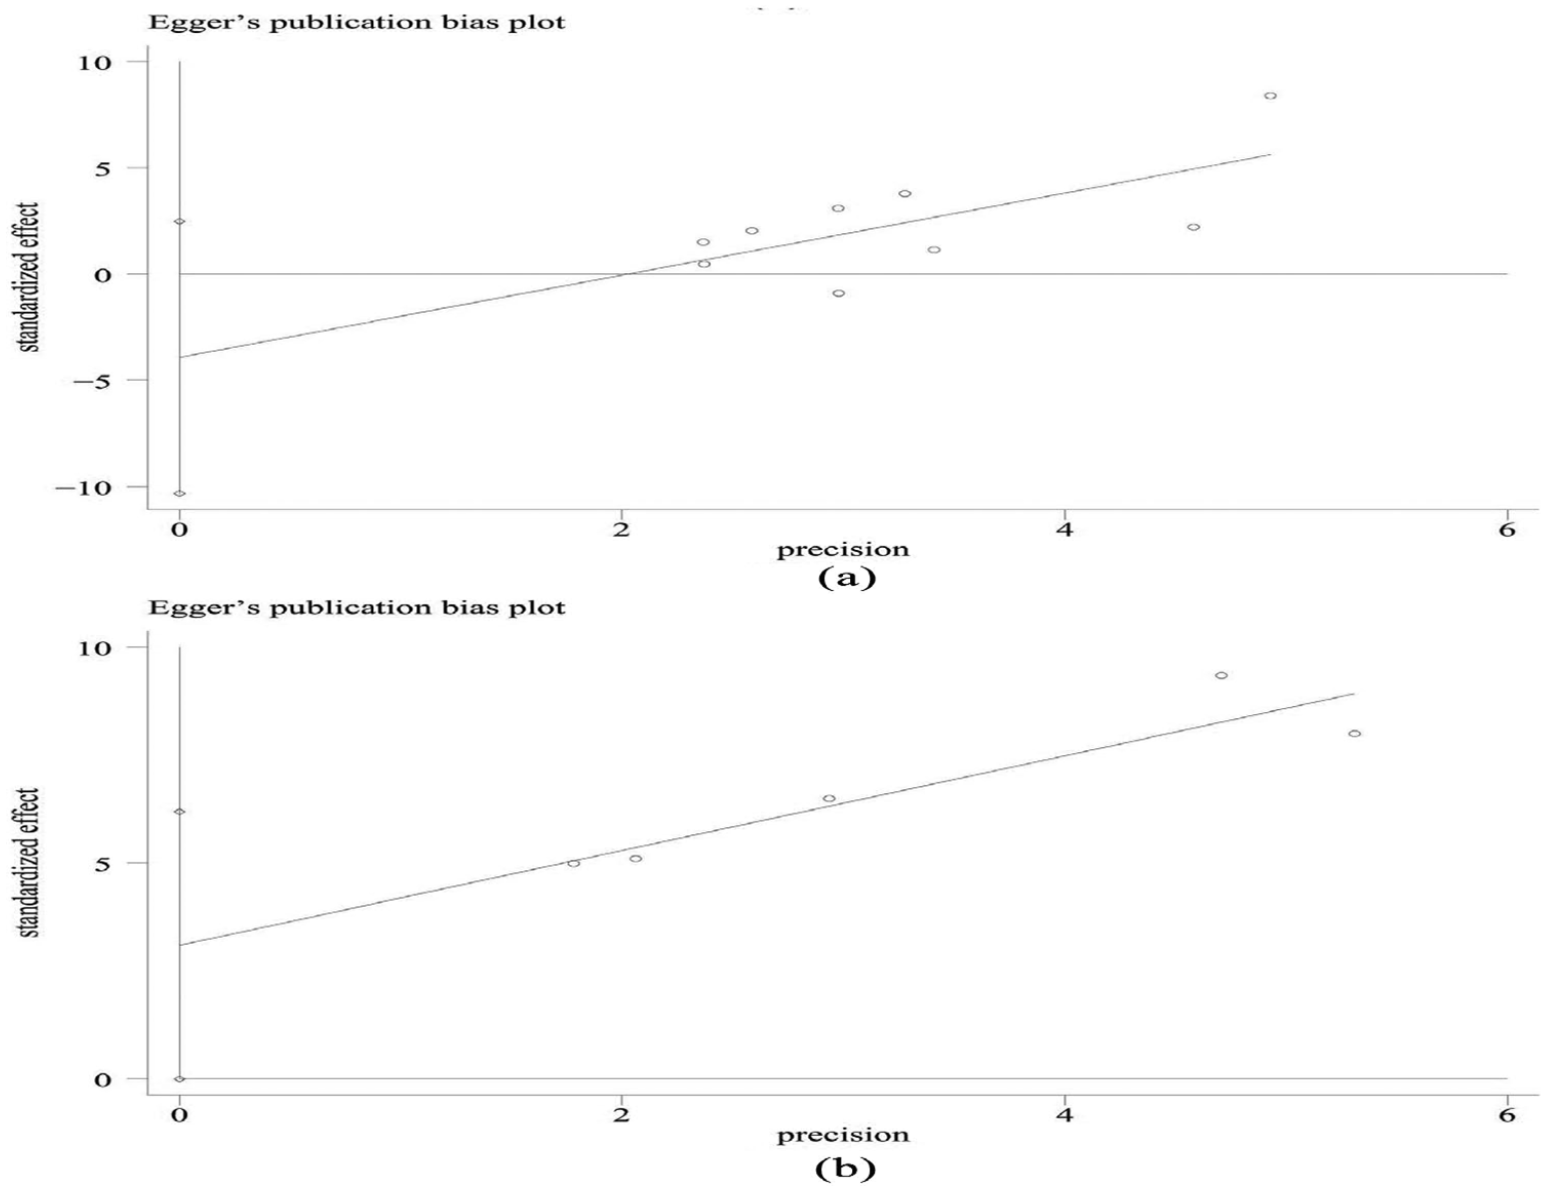
(a) Included studies containing Pcv-aCO2/Ca-vO2 levels for survivors and non-survivors and (b) included articles containing 28-day mortality in patients with high Pcv-aCO2/Ca-vO2 and low Pcv-aCO2/Ca-vO2.
Study characteristics
The characteristics of the 13 included studies are shown in Table 2. Of the 940 patients, 442 were males, 274 were females, with gender not reported for 224 subjects.10,14 A single study 26 was obtained by searching the relevant literature. Other studies7,10,12 –14,22 –25,27 –29 were sourced from databases. All studies had English abstracts, 12 of which were published from 2015 to 2018.7,12 –14,22 –29 Three studies were published in Spanish,26 –28 two were published in Chinese,12,29 and eight were published in English.7,10,13,14,22 –25 The included studies were all observational, of which six were retrospective10,12,23,25,28,29 and seven were prospective.7,13,14,22,24,26,27 Excluding the study by Dubin and Mekontso-Dessap, the subjects were from intensive care units (ICU). Of the 13 standards-compliant studies, six used the 2013 guidelines to diagnose sepsis and septic shock,12,14,22,23,25,29 and one used the 2016 version 7 which was unavailable in other studies. All subjects in these 10 studies were patients with sepsis or septic shock, of which 45.3% were pulmonary infections, with abdominal infections accounting for 23.0%. The source of urinary tract, blood flow, and soft tissue infections were 11.4%, 7.4%, and 4.8%, respectively.7,12 –14,22,23,25,27 –29 The other studies included other shock types including hemorrhagic and cardiogenic shock (Table 2), septic patients accounted for 63.6% of these study cohort.10,24,26 The follow-up time differed between studies. Two studies were followed up for 30 days,10,27 six studies were followed for 28 days,12,14,24 –26,29 four studies followed the ICU stay,7,22,23,28 and one was followed up in hospital. 13 Of the 13 studies, nine extracted the mean ± standard deviation of Pcv-aCO2/Ca-vO2 of surviving and non-surviving patients (Figure 3). A total of five studies extracted patient mortality data based on the cut-off value (Figure 4). We analyzed these two data sets independently.
Characteristics of the included literature.
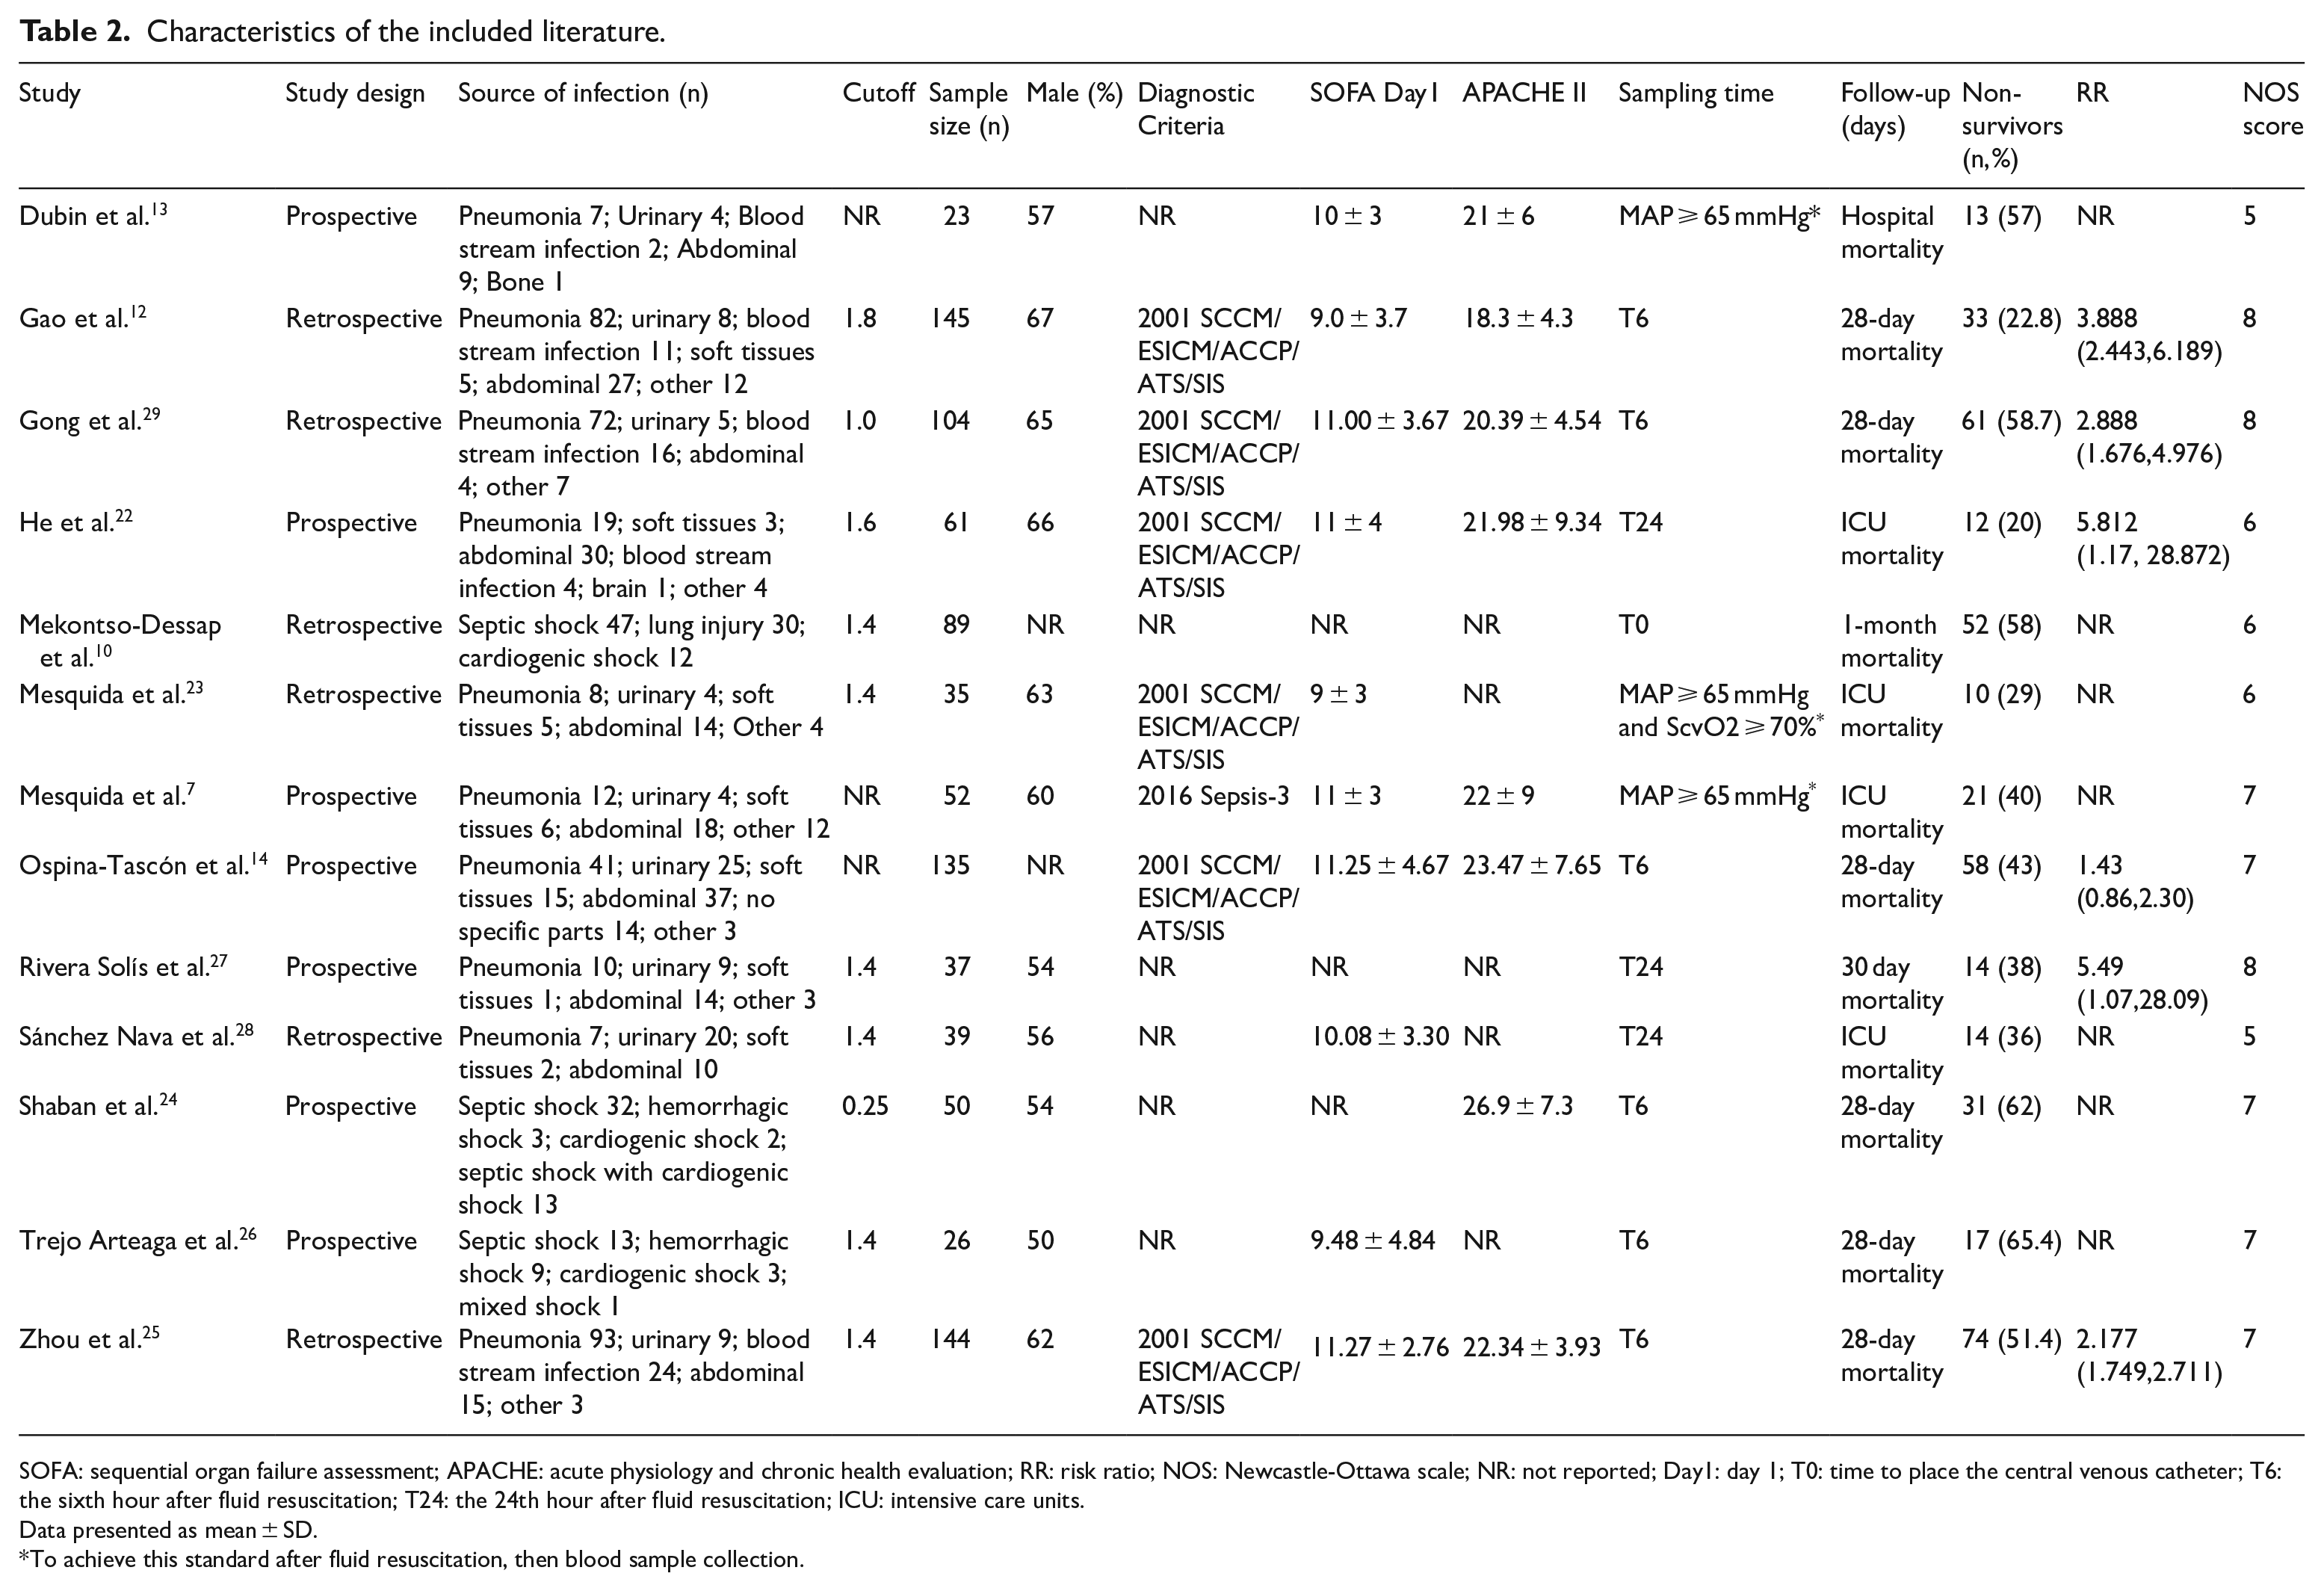
SOFA: sequential organ failure assessment; APACHE: acute physiology and chronic health evaluation; RR: risk ratio; NOS: Newcastle-Ottawa scale; NR: not reported; Day1: day 1; T0: time to place the central venous catheter; T6: the sixth hour after fluid resuscitation; T24: the 24th hour after fluid resuscitation; ICU: intensive care units.
Data presented as mean ± SD.
To achieve this standard after fluid resuscitation, then blood sample collection.
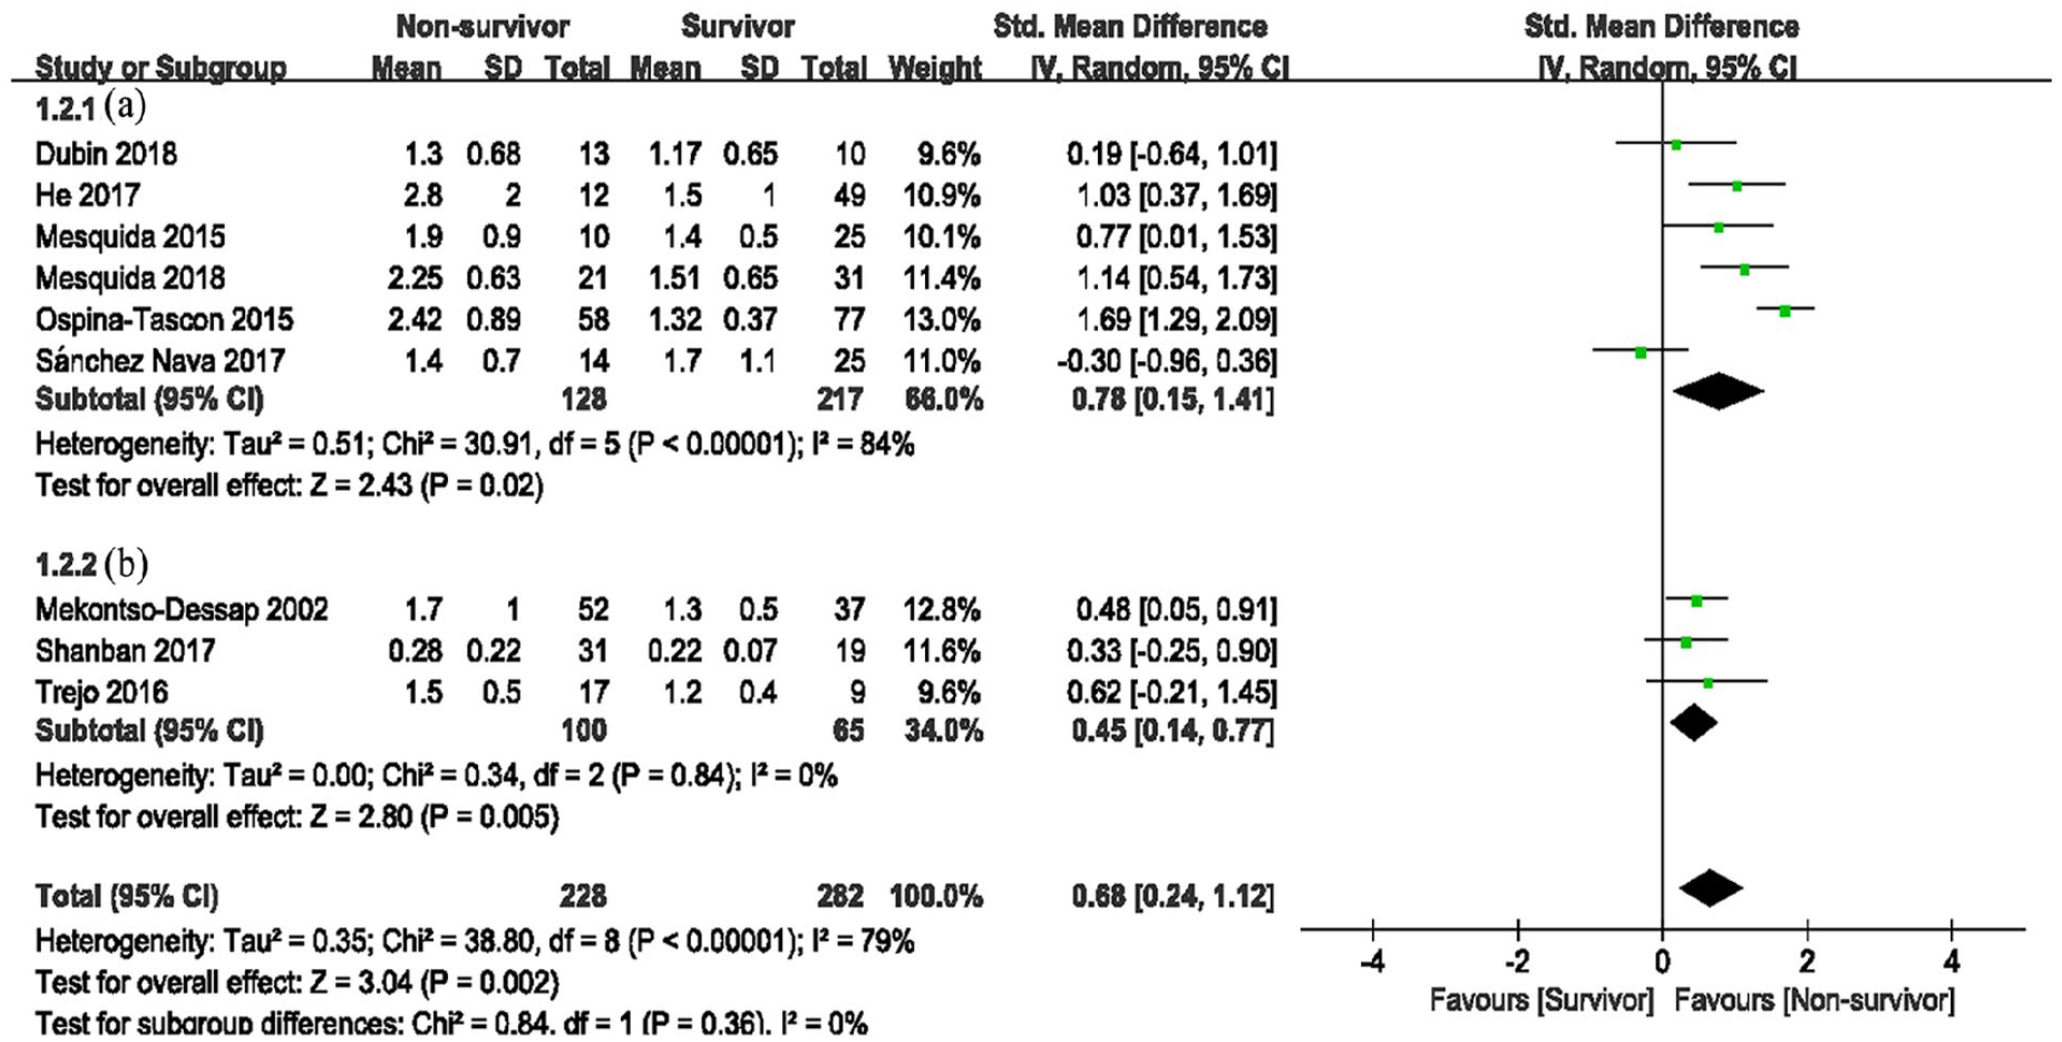
Pcv-aCO2/Ca-vO2 levels in survivors and non-survivors (a: subjects were all sepsis or septic shock patients; b: subjects included other types such as cardiogenic shock).
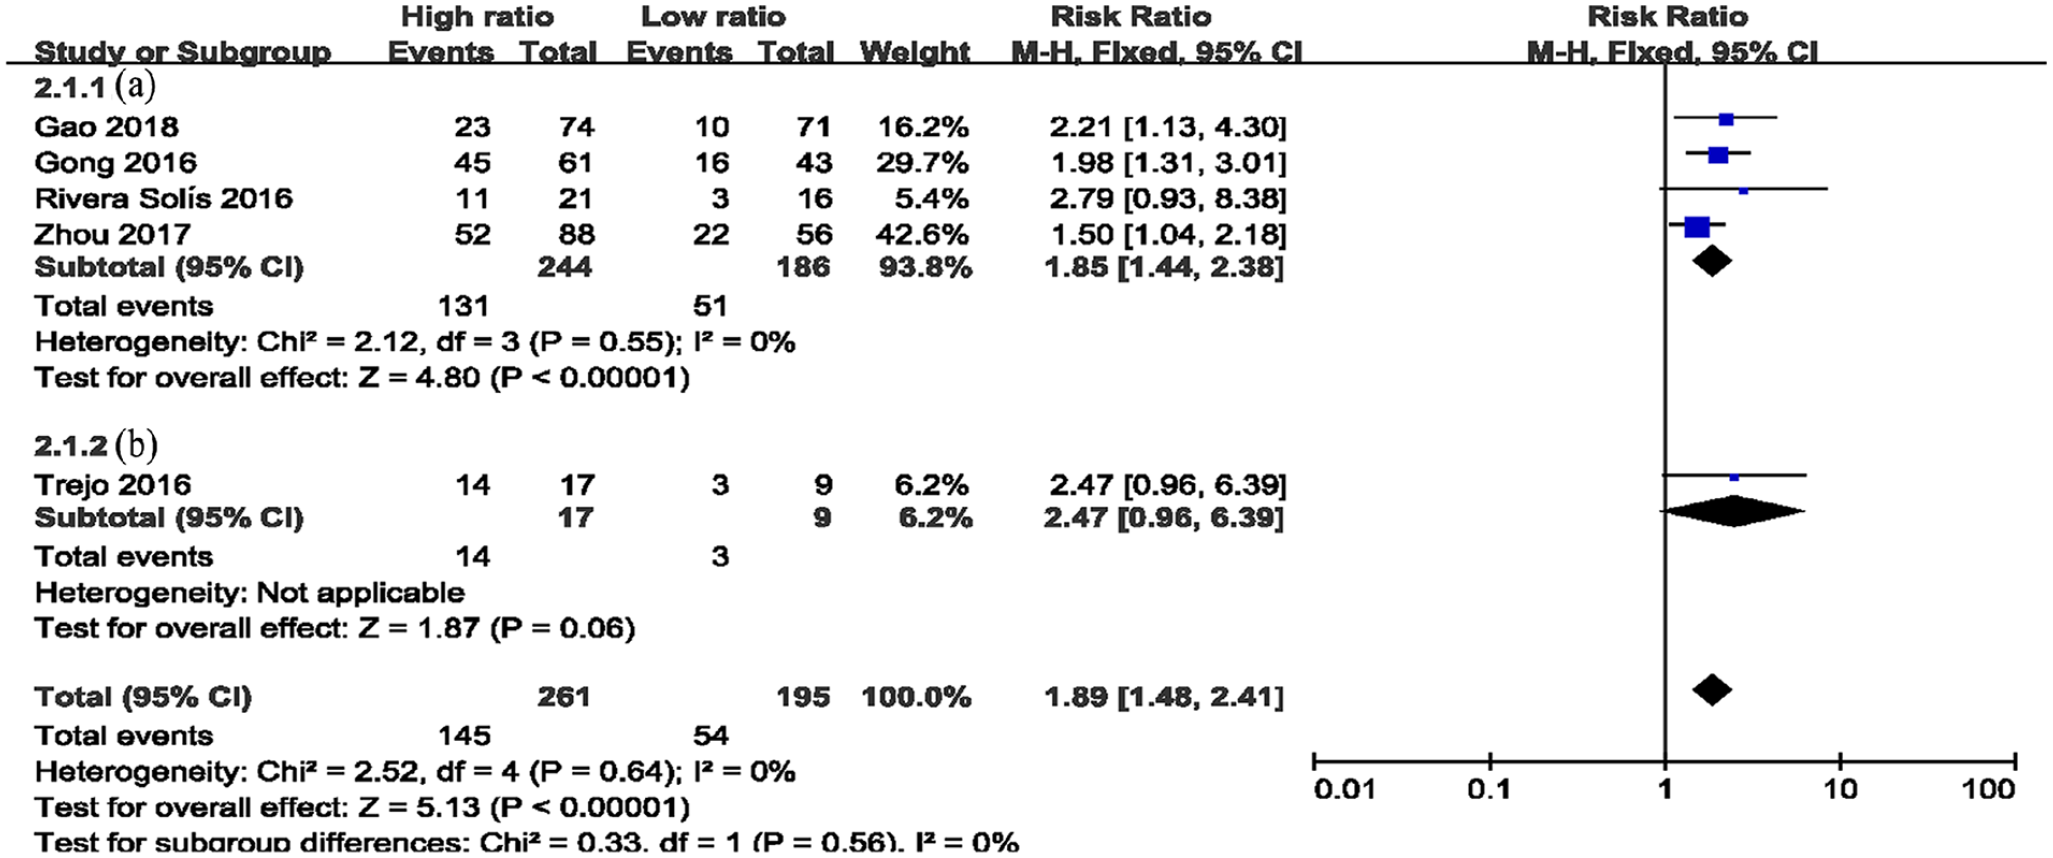
Mortality in patients with high Pcv-aCO2/Ca-vO2 (high ratio) and low Pcv-aCO2/Ca-vO2 (low ratio) (a: subjects were all sepsis or septic shock patients; b: subjects included other types such as cardiogenic shock).
Results of the included studies
Pcv-aCO2/Ca-vO2 levels in survivors and non-survivors
A total of 510 patients from nine studies were analyzed,7,10,13,14,22 –24,26,28 including 282 survivors and 228 non-survivors (Figure 3). Heterogeneity between the results were 79%, and the random effects model was used for analysis. Meta-analysis showed higher Pcv-aCO2/Ca-vO2 in non-surviving patients with sepsis or septic shock (SMD = 0.68, 95% confidence interval (CI) = 0.24–1.12, Z = 3.04, P = 0.002; Figure 3). Subgroup analysis was performed according to patient type. All patients in group A had sepsis or septic shock,7,13,14,22,23,28 and group B included other types including cardiogenic shock.10,24,26 The pooled SMD of the random effects model (I2 = 84%, P < 0.001) in group A was 0.78 (0.15–1.41; Figure 3A) and 0.68 in group B (0.24–1.12, I2 = 0, P = 0.84, Figure 3B). Upon exclusion of the Ospina-Tascon study, the heterogeneity became 49%. As the source of heterogeneity was variable, representative methods provided by the article differed from other studies, with median and interquartile spacing.
Mortality in patients with high Pcv-aCO2/Ca-vO2 (high ratio) and low Pcv-aCO2/Ca-vO2 (low ratio)
Five studies compared 28-day mortalities in patients with different Pcv-aCO2/Ca-vO2 ratios12,25 –27,29 consisting of a total of 456 patients (261 in the high-ratio group and 195 in the low-ratio group; Figure 4). No heterogeneity was observed between the studies (I2 = 0, P = 0.64). The two groups were combined using a fixed-effects model. The results showed that the 28-day mortality rates in the high-ratio group were higher, and the differences were statistically significant (RR = 1.89, 95% CI = 1.48–2.41, P < 0.01; Figure 4).
SOFA and APACHE II scores in patients with high vs low Pcv-aCO2/Ca-vO2
Three studies reported the effects of Pcv-aCO2/Ca-vO2 levels on the first day SOFA and APACHE scores12,25,29 that included 393 patients (Figure 5). The meta-analysis showed that the differences between APACHE II in the two groups were not statistically significant (MD = 0.50, 95% CI = −4.42 to 5.42, P = 0.84), and the heterogeneity between the studies was large (I2 = 97%, P < 0.01; Figure 5(b)). The sources of heterogeneity were subjective according to scoring processes or time. The SOFA scores on the first day showed statistically significant differences between the groups (MD = 1.58, 95% CI = 0.88–2.28, P < 0.01) and the heterogeneity was mild (I2 = 21%, P = 0.28; Figure 5(a)).
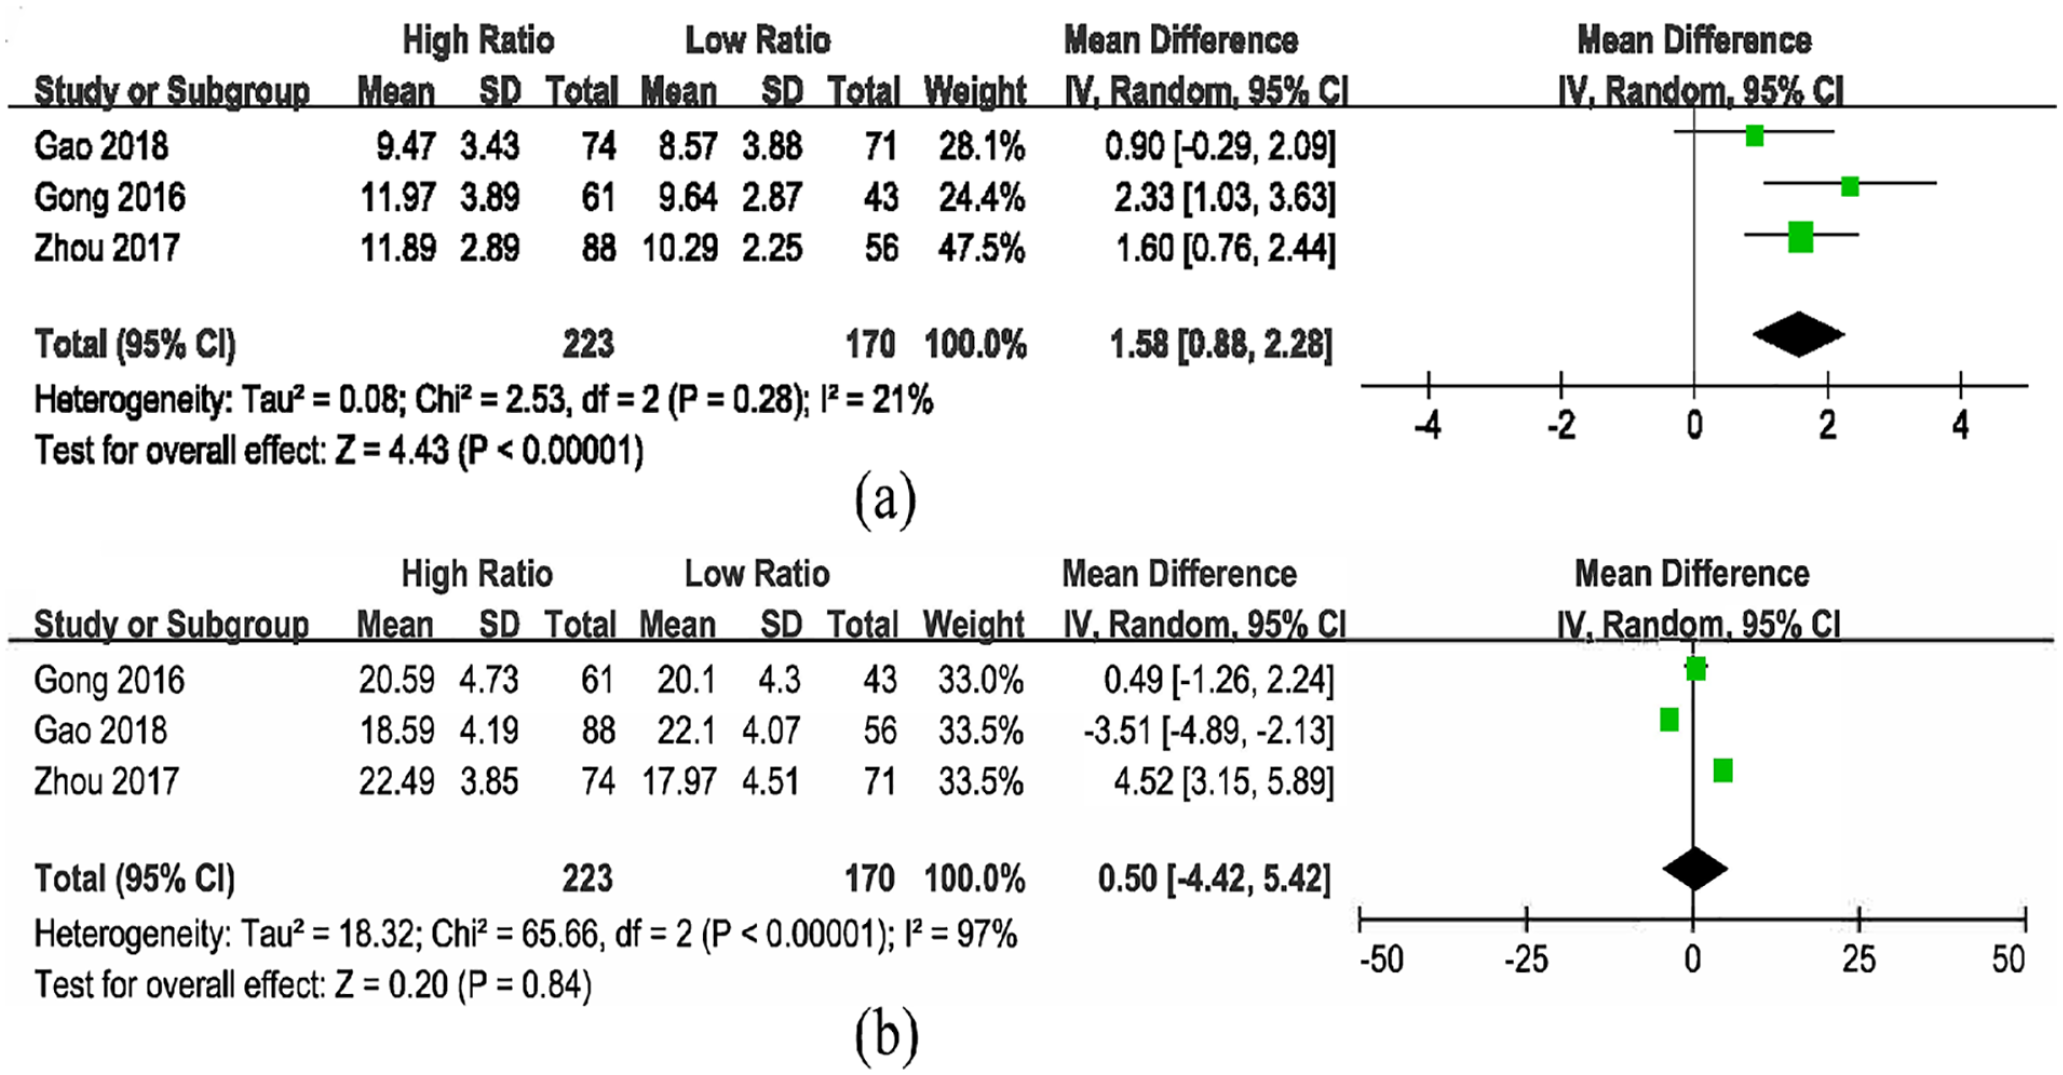
(a) SOFA scores in patients with high vs low Pcv-aCO2/Ca-vO2 and (b) APACHE II scores in patients with high vs low Pcv-aCO2/Ca-vO2.
Discussion
This was the first meta-analysis to demonstrate the value of Pcv-aCO2/Ca-vO2 in predicting mortality in sepsis patients in the ICU. Non-surviving patients had higher Pcv-aCO2/Ca-vO2 values following measures to ensure fluid resuscitation and the maintenance of a stable circulatory system at the time of admission (SMD = 0.68, 95% CI = 0.24–1.12). Blood samples from 6 h after resuscitation showed a higher risk of death (RR = 1.89, 95% CI = 1.48–2.41) and higher SOFA scores (MD = 1.58, 95% CI = 0.88–2.28, P < 0.01) in patients with high Pcv-aCO2/Ca-vO2 levels.
Insufficient tissue perfusion and hypoxia at the cellular level in patients with sepsis are important indicators of mortality. Patients with these characteristics should be immediately identified and resuscitated. Previous studies are based on central venous oxygen saturation (ScvO2), blood lactate levels and central venous-arterial carbon dioxide partial pressure differences (Pcv-aCO2) as a predictor of tissue perfusion recovery and poor prognosis.30,31 Using ScvO2 to predict patient prognosis is less accurate, as when ScvO2 reaches normal levels, patients maintain insufficient tissue perfusion and poor prognosis. Hyperlactemia suggests that the patients have insufficient tissue perfusion or hypoxia at the cellular level, but under the influence of liver dysfunction or drugs, the body is not hypoxic and hyperlactemia will occur. A lag in the increase of lactic acid is also observed.32,33 Central venous and arterial carbon dioxide partial pressure differences (Pcv-aCO2) are widely used because as they are simple and easy to measure.34,35 However, although tissue perfusion is sufficient, Pcv-aCO2 will continue to increase due to the Haldane effect. 36 It is possible that Pcv-aCO2 is normal in patients with high cardiac output and significant hypoperfusion, such as sepsis, as sufficient blood flow exists to remove CO2 in the tissue. The value of the Pcv-aCO2/Ca-vO2 index in the assessment of tissue hypoperfusion and poor prognosis in patients with sepsis is currently under investigation.
CO2 is a byproduct of oxygen metabolism. In aerobic conditions, the levels of CO2 produced in the body should not exceed the amounts consumed of O2. In patients with sepsis, the tissues were hypoperfused and the cells are hypoxic. During this time, the global oxygen supply (VO2) is reduced, the VCO2 due to aerobic metabolism is reduced, and the VCO2 due to anaerobic metabolism is increased. The magnitude of the decrease in VCO2 is smaller than the decrease in oxygen consumption, thus the VCO2/VO2 > 1. According to the Fick equation, the ratio of the differences in CO2 content between mixed venous and arteries to the differences in arteriovenous oxygen content (Cv-aCO2/Ca-vO2) reflect the body’s respiratory entropy (VCO2/VO2). 8 However, the complexity of the formula for the calculation of CO2 limits its clinical application. Clinically, central venous blood samples were used instead of mixed venous blood samples, and the Pcv-aCO2/Ca-vO2 is substituted for Cv-aCO2/Ca-vO2. In studies from Mekontso-Dessap et al. 10 in 2002, the Pcv-aCO2/Ca-vO2 ratio was a more reliable global anaerobic metabolism marker than other O2- and CO2-derived parameters. The change in Pcv-aCO2/Ca-vO2 in patients with septic shock is more sensitive than lactate, and the sensitivity and specificity for identifying hypoxia are higher. According to the VCO2/VO2, Gong et al. 29 believed that the Pcv-aCO2/Ca-vO2 ratio > 1 is perceived as abnormal. The study from Monnet et al. 37 showed that a Pcv-aCO2/Ca-vO2 ⩾ 1.8 can predict increases in oxygen consumption in fluid responders, the critical values in the studies by Gao et al. 12 was dependent on this. Mesquida et al. 23 and Mekontso-Dessap et al. 10 obtained cut-off values based on the receiver operating characteristic (ROC) curve, when Pcv-aCO2/Ca-vO2⩾1.4, the patient’s lactate clearance rates decreased and the survival times were shorter. Four studies later conducted based on the cutoff of 1.4 reported that the mortality rates of patients increased when this ratio increased.25 –28 In the subgroup analysis of mortality, SOFA, and APACHE II, we divided patients into high and low Pcv-aCO2/Ca-vO2, but did not specify specific cut-off values. Although the best clinical observations and critical values are uncertain currently, the most frequently used and most valuable Pcv-aCO2/Ca-vO2 threshold in the included studies was 1.4. The most common sampling time in literatures was 6 h after fluid resuscitation and blood pressure maintenance in patients with septic shock (Table 2).12,14,24 –26,29 The authors did not specifically explain the reasons for the time points selected. It is likely that according to resuscitation guidelines, the initial recovery time for patients with septic shock is 6 h, and so most authors choose this time point. A single study concluded that for patients undergoing cardiac surgery, monitoring this indicator 2 h after surgery is more meaningful. Whether this time point is important for septic shock patients remains undefined. 38
Meanwhile, we found that Pcv-aCO2/Ca-vO2 was also higher in non-survivors compared to survivors, not only during septic shock, but in patients with other types of shock including cardiogenic shock. However, the lack of studies and small sample size question these conclusions10,24,26 (Figure 3). The study by Du et al. suggests that Pcv-aCO2/Ca-vO2 represents postoperative global anaerobic metabolism and predictive responses to oxygen delivery (DO2) challenge in patients undergoing cardiac surgery, while Abou-Arab et al. obtained the opposite conclusion through experimentation.38–40 Recent studies published in 2019 proposed that Pcv-aCO2/Ca-vO2 is an important predictor of postoperative major organ morbidity and mortality in patients undergoing cardiac surgery, and that the ratio may represent a useful resuscitation target. 41 The role of Pcv-aCO2/Ca-vO2 in other critically ill patients requires further validation studies. Three studies,12,25,29 including Zhou and colleagues used lactic acid, Pcv-aCO2/Ca-vO2, and lactic acid in combination with Pcv-aCO2/Ca-vO2 to construct ROC curves that were used to predict 28-day mortality in patients with septic shock. The area under the curve (AUC) of the combined application of Pcv-aCO2/Ca-vO2 and lactic acid was more accurate than lactic acid or Pcv-aCO2/Ca-vO2 alone. Rivera Solís et al. 27 reported that after resuscitation, patients with ScvO2 < 70% and a ratio > 1.4 have a higher mortality rate. To-date, as accurate indicators of tissue perfusion and hypoxia are lacking, in critically ill patients, clinicians should pay attention to this indicator combined with lactic acid clearance and central venous blood oxygen saturation. This can minimize any influencing factors to achieve early resuscitation, and to judge the effects of early resuscitation treatment.
This meta-analysis has inherent limitations. The included studies were sparse and the majority of articles had small sample sizes, questioning the credibility of the conclusions. In addition, the rates of false positive results were higher, leading to study bias. The research environment of the studies included in this article was based on those of the ICU. For patients with sepsis in other environments, the conclusions require confirmation. Based on our current data, we only provided commonly used cut-off values for this indicator at 1.4, with the usual sampling time point being the 6th hour after admission for treatment. It is therefore difficult to propose the optimal cut-off values of Pcv-aCO2/Ca-vO2 that can predict poor patient prognosis.
In conclusion, Pcv-aCO2/Ca-vO2 is a predictor of poor prognosis in patients with sepsis or septic shock. For patients with severe sepsis or septic shock, active and effective fluid resuscitation should be performed as soon as possible. On the basis of the MAP, ScvO2 and lactate clearance rates reaching baseline standards, further Pcv-aCO2/Ca-vO2 assessments are required to guide fluid resuscitation and improve the patient’s prognosis.
Footnotes
Appendix 1
Acknowledgements
The authors gratefully acknowledge the help provided by Dr Dongyue Wang of the image processing. Thanks, are also due to Dr. Chao Xu, who gave them much valuable advice in the early stages of this work.
Author contributions
M.W. helped design the study, perform the data analysis, resolve discussion and write the manuscript. T.L. helped design the study, perform the data analysis and interpret the data.
Z. N. helped resolve discussion and modify the grammar and content of the manuscript. J.Z. helped resolve discussion and modify the grammar and content of the manuscript. D.Q. helped design the study and write the manuscript.
Declaration of conflicting interests
The author(s) declared no potential conflicts of interest with respect to the research, authorship, and/or publication of this article.
Funding
The author(s) received no financial support for the research, authorship, and/or publication of this article.