
Abstract
Objectives:
To systematically review the diagnostic utility of the respiratory variation of the inferior vena cava diameter measured using ultrasonography for predicting fluid responsiveness in adult patients and compare the three commonly used equations, inferior vena cava distensibility, inferior vena cava collapsibility and inferior vena cava variability.
Methods:
We searched PubMed, Scopus, Web of Science and Cochrane library, and included studies investigating the diagnostic accuracy of the respiratory variation of the inferior vena cava measured using ultrasonography compared to a reference standard for measuring cardiac output after a fluid challenge for fluid responsiveness, and stratified participants as fluid responsive or not. We included studies conducted in the emergency department or intensive care unit. We excluded studies on paediatric, prehospital, cancer, pregnant, dialysis patients or healthy volunteers.
Results:
We retrieved 270 records and excluded 171 because of irrelevance, patient population or publication type. We screened the abstracts of 99 studies and then the full texts of 42 studies. Overall, 21 studies with 1321 patients were included, of whom 689 (52%) were fluid responsive. The mean threshold value for positive inferior vena cava distensibility, inferior vena cava collapsibility and inferior vena cava variability was 17%, 35% and 12%, respectively. The heterogeneity between studies was high. Bivariate diagnostic random-effects meta-analysis was used to calculate the summary receiver operating characteristics curves. The overall accuracy, sensitivity and specificity of respiratory variation of the inferior vena cava diameter were 0.85, 0.72 and 0.81, respectively. The accuracy of inferior vena cava distensibility and inferior vena cava collapsibility was similar. The diagnostic utility of respiratory variation of the inferior vena cava diameter was lower but not statistically significant in mechanically ventilated patients compared with spontaneous breathing for predicting fluid responsiveness.
Conclusion:
The respiratory variation of the inferior vena cava diameter has moderate diagnostic utility for predicting fluid responsiveness independent of the equation used.
Introduction
In hemodynamically unstable critical care patients, intravenous fluids are administered to increase cardiac output (CO), tissue perfusion and systemic blood pressure.1,2 However, there seems to be a threshold where more fluid administration does not increase the stroke volume (SV), and harmful effects, such as pulmonary or peripheral oedema, are observed.1,2 This concept is called fluid responsiveness (FR), and static and dynamic measures were introduced to estimate whether a patient is fluid responsive. Dynamic measures represent changes in CO, SV, or similar parameters after a manoeuvre, such as passive leg raise (PLR) or positive pressure breaths. In PLR, the lower extremities were elevated to transfer pooled blood to the central compartment to increase preload, where an increase in any hemodynamic measure suggests FR.
Right atrial and central venous pressures tend to change with respiration, and those changes also change the diameter of the inferior vena cava (IVC). The respiratory variation of IVC can be measured using ultrasonography (US) at the bedside, which may help estimate the patient’s FR. Previous studies assessing the diagnostic accuracy of the respiratory variation of the IVC used different static or dynamic measures as the reference standard, used different thresholds, were conducted on remarkably different patient populations, and reported the results of three equations with the same numerator that is normalised to slightly different denominators. Therefore, the meta-analysis of those studies showed considerable heterogeneity with mixed results. Thus, we aimed to systematically review the diagnostic utility of the respiratory variation of the IVC measured using USG for FR in adult patients and compare the utility of inferior vena cava distensibility (IVCd), inferior vena cava collapsibility (IVCc) and inferior vena cava variability (IVCv) equations.
Methods
This study complied with the recent update of the preferred reporting items for systematic review and meta-analysis of diagnostic test accuracy studies (PRISMA-DTA) and PRISMA-DTA for abstracts. 3 The study and search protocols were not registered or published. Written informed consent was not necessary because patient data were excluded.
Criteria for study selection
Types of studies
We included prospective observational diagnostic accuracy studies with a reference standard for measuring CO after a fluid challenge and those stratifying participants into FR and non-FR. We reported the number of true positive (TP), false positive (FP), false negative (FN) and true negative (TN) patients, sensitivity or specificity of IVCd ((Dmax − Dmin)/Dmin), IVCc ((Dmax − Dmin)/Dmax) or IVCv ((Dmax − Dmin)/(Dmax + Dmin)/2) indexes measured using USG for predicting FR, where Dmax is the maximal and Dmin is the minimal IVC diameter. We considered studies published in peer-reviewed journals in English and excluded studies with a case–control design.
Participants
We included studies conducted in the setting of an emergency department (ED) or intensive care unit (ICU), involving adult (age ⩾18 years) participants of any sex. Moreover, studies involving both mechanically ventilated (MV) and spontaneously ventilating patients were included. We excluded studies including the paediatric population, prehospital setting, patients with cancer, pregnant patients, patients on dialysis or healthy volunteers.
Index tests
We included studies that measured the IVC diameter in M-mode from the subxiphoid view, from the longitudinal axis. The maximum allowed time between IVC US and the fluid challenge was 30 min. We excluded studies measuring IVC from mid-axillary views or with a lateral approach and calculated area or cross-sectional diameters. We also excluded studies with missing equations used for calculating the IVCv index. Blinding of the sonographers to the SV, CO or velocity–time integral (VTI) change was not always feasible and practical. Therefore, we graded this point during the quality assessment.
Target condition and reference standards
We included studies that reported FR with the change in SV, stroke index (SI), CO or cardiac index after a fluid challenge or PLR, with any of the following well-established techniques: transthoracic echocardiography (TTE), transpulmonary thermodilution (TPTD), arterial pulse waveform analysis (APWA), bioreactance (BR), pulse contour analysis (PCA) or transoesophageal echocardiography (TEE). We expected considerable heterogeneity in defining FR a priori.
Search methods for identification of studies
Electronic search
We searched The Cochrane Database for Systematic Reviews, the National Institute for Health and Care Excellence (NICE) and Epistemonikos for existing reviews based on methods outlined elsewhere. 4 We searched the MEDLINE, Embase and Web of Science databases from their start to June 2020 using the Medical Subject Headings (MeSH) and natural language words for IVC, FR/challenge and ultrasound.
The search query used for PubMed was as follows: ((‘vena cava, inferior’[MeSH Major Topic] OR ‘inferior vena cava’[Title/Abstract]) AND (((‘fluid responsiveness’[Title/Abstract] OR ‘volume expansion’[Title/Abstract]) OR ‘fluid challenge’[Title/Abstract]) OR ‘preload assessment’[Title/Abstract])) AND (‘ultrasonography’[MeSH Major Topic] OR (‘ultraso*’[Title/Abstract] OR ‘sonogr*’[Title/Abstract])).
Searching other resources
We reviewed the reference sections of the relevant original articles and reviews for footnote chasing. We excluded reviews, editorials, case reports, letters to the editors, correspondences, conference abstracts, non-English studies and non-human studies.
Data collection and analysis
We collected the data as described in The Cochrane Handbook for Systematic Reviews of Diagnostic Test Accuracy guidelines. 5
Study eligibility and quality assessment
Initial searches at the above databases were exported to a reference manager file and imported to the online systematic review search app Rayyan QCRI. 6 The duplicates were checked and automatically removed. Subsequently, we screened the title and abstracts of the batch for publication type, population and relevance (E.U.A. and H.A.). After the screening, we retrieved the papers’ full text to evaluate their eligibility (E.U.A. and H.A.). We resolved disagreements on study eligibility by discussion. We exported our final list of studies to RevMan 5. Figure 1 shows our process flow.
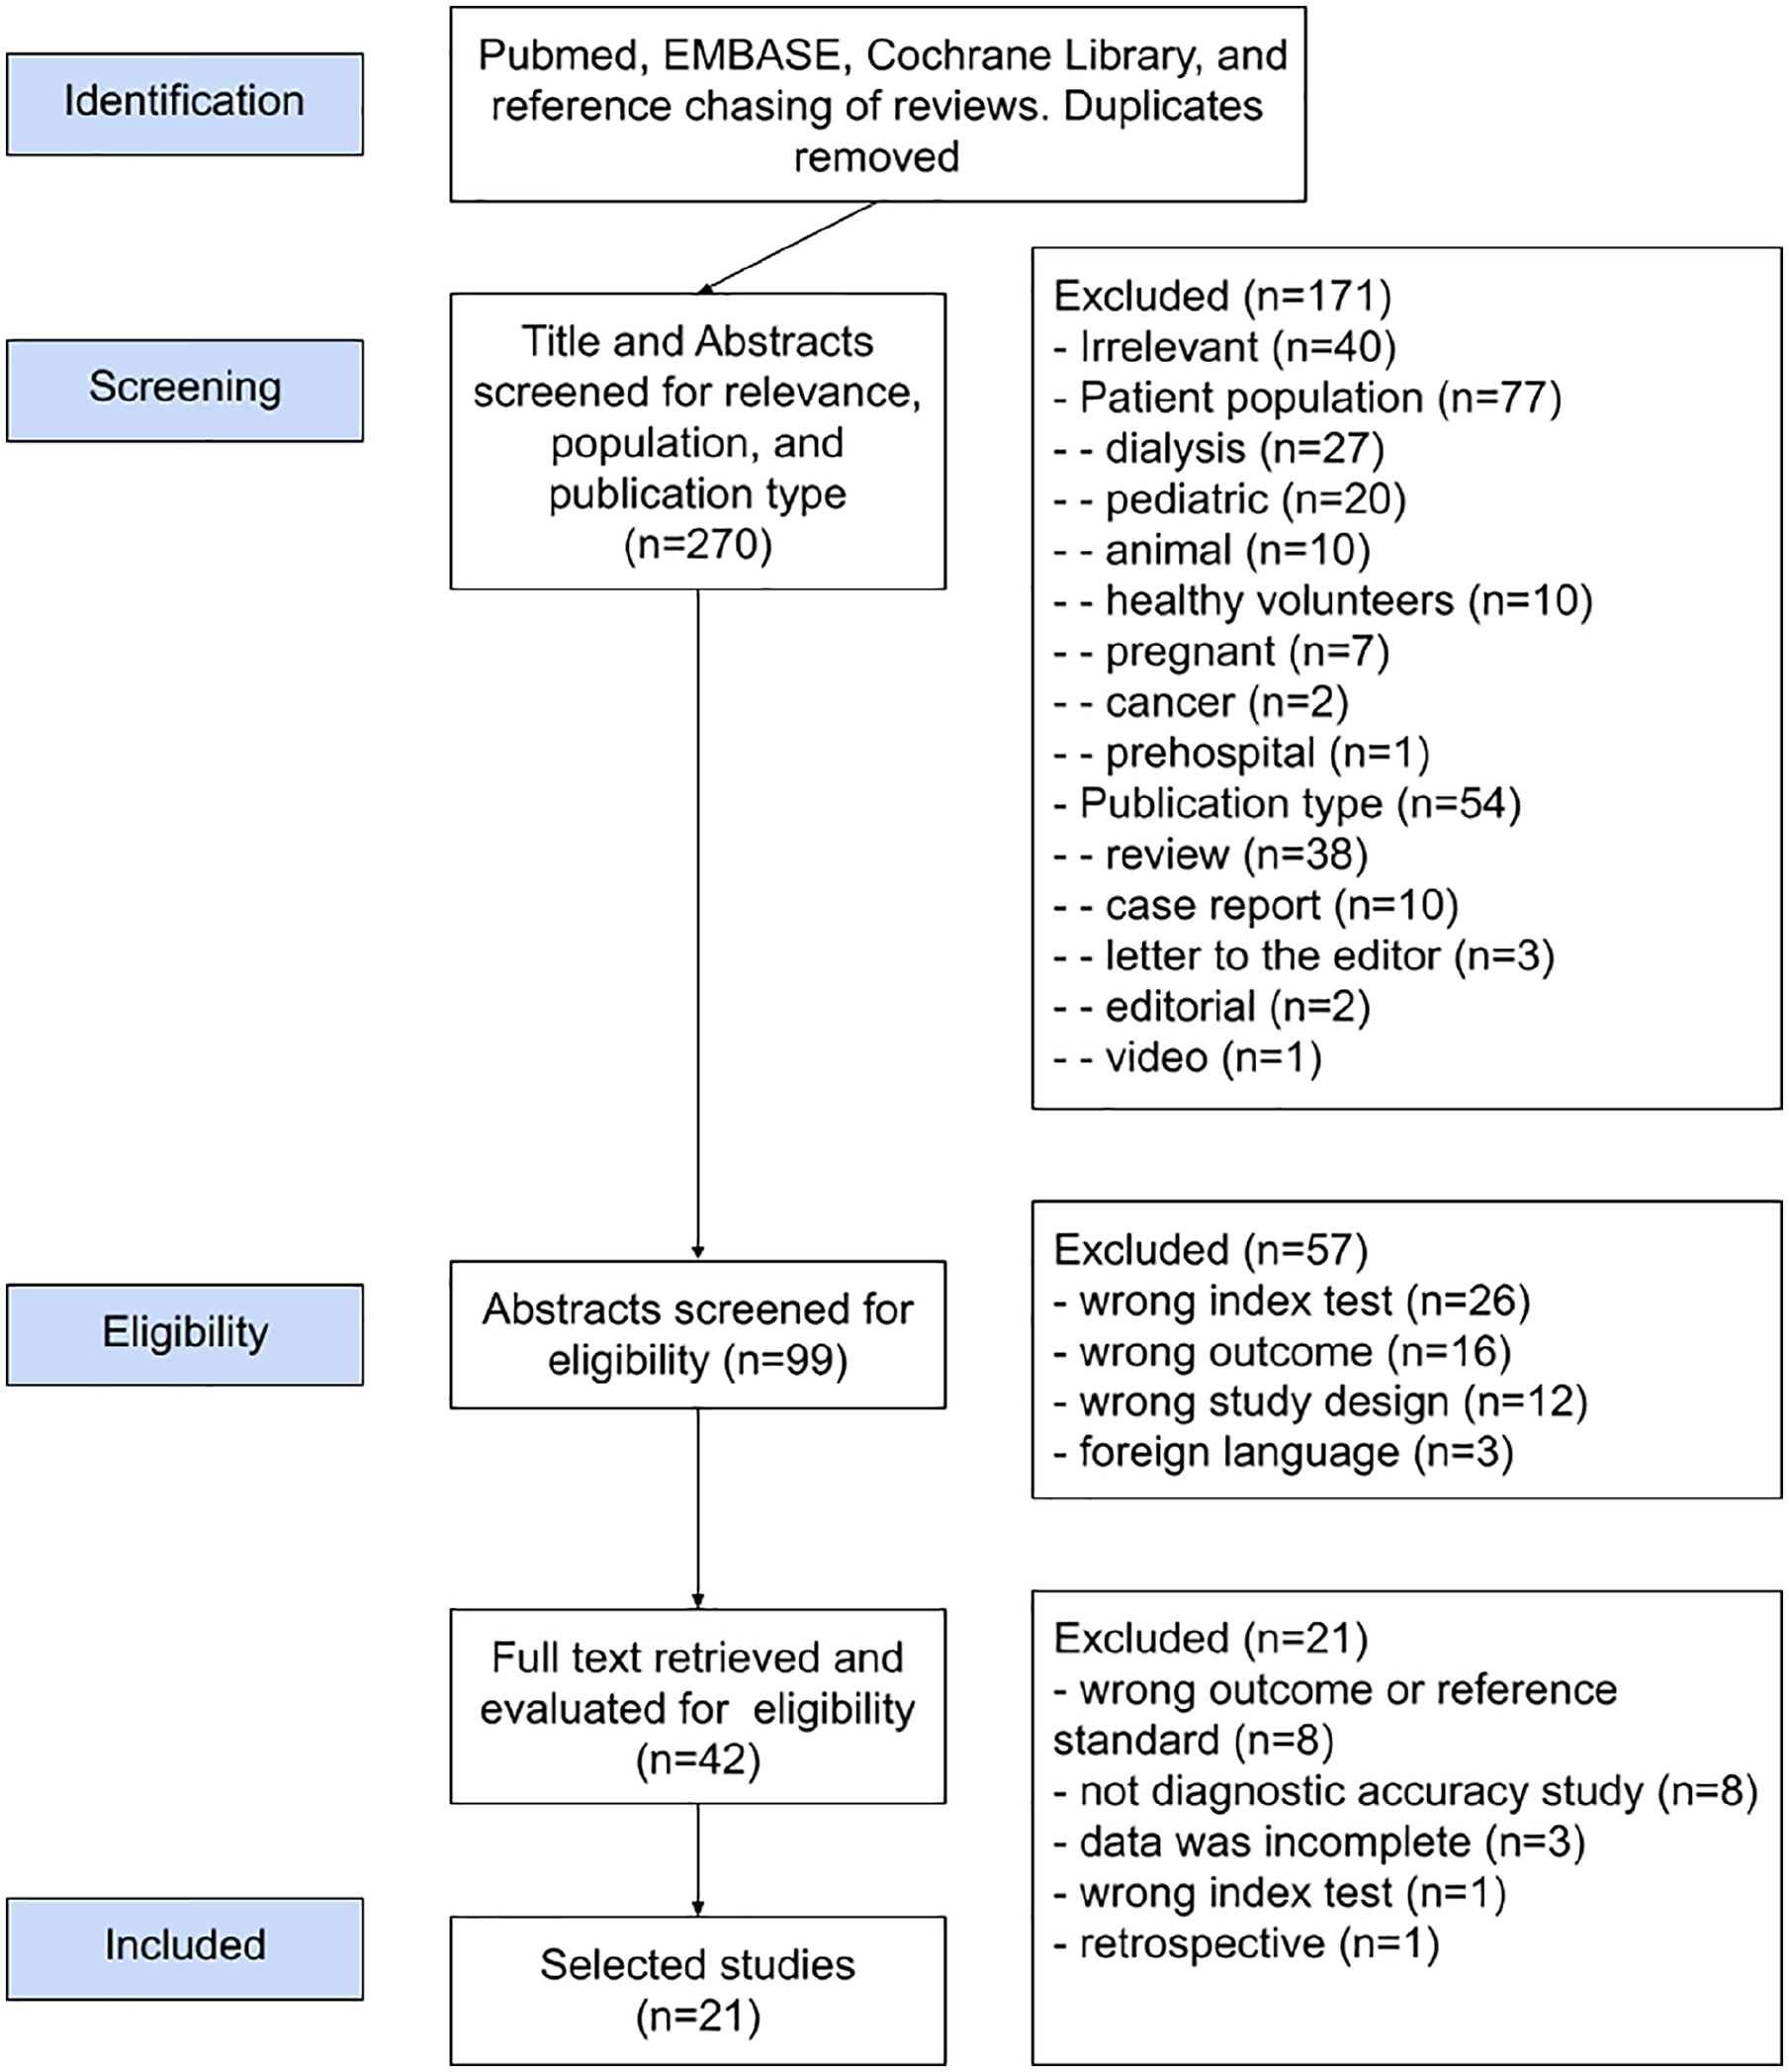
Flow chart of the systematic review process.
Data extraction and management
We collected data on four domains into an electronic spreadsheet: (1) study characteristics: title, authors, country, publication year, design, language, setting and number of centres; (2) patient population: total number of patients, and number of patients in the study and control groups, the age range of the study population, ventilation status (spontaneous or mechanical ventilation), tidal volume and positive end-expiratory pressure (PEEP) if MV was used; (3) index test: IVC formula, calculated or pre-defined cut-off value; (4) reference test: definition of FR, the pre-defined threshold for FR, the metric and device used, PLR or fluid challenge, volume and composition of the fluid; (5) outcomes: area under the curve (AUC) of receiver operating characteristics (ROC) for FR at the defined threshold value of the index test with TP, TN, FP, TN values, sensitivity and specificity.
Assessment of methodological quality
We evaluated the design and reporting quality of all included studies using the Quality Assessment of Diagnostic Accuracy Studies-2 (QUADAS-2).7,8 We recorded our evaluations in an excel template that we downloaded from the RobVis tool website. 9 Subsequently, we used RevMan 5 to create the risk of bias and applicability concerns graphs (Figure 2).
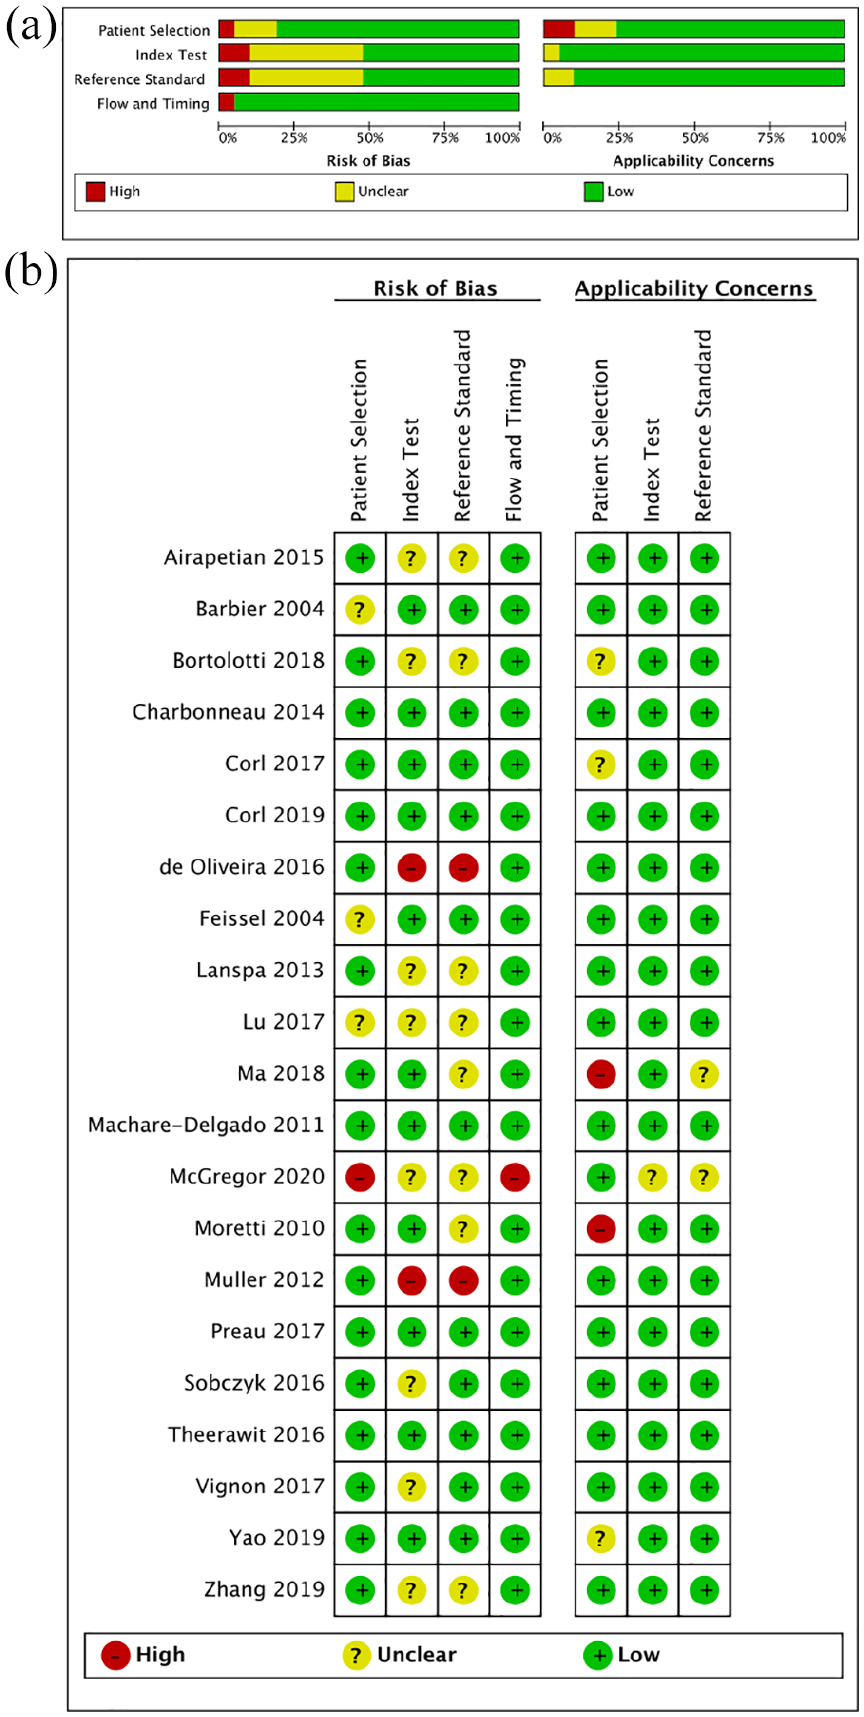
Risk of bias and applicability concerns: (a) graph and (b) summary: review authors’ judgements about each domain presented as percentages across included studies.
Statistical analysis and data synthesis
We calculated the summary statistics for diagnostic accuracy from TP, TN, FP and TN values. We created the probability plot, forest plots, Deek’s funnel plot and Fagan nomogram with the Stata statistical software’s midas function. We performed a bivariate diagnostic random-effects meta-analysis described by Reitsma et al. 10 to calculate the summary receiver operating characteristic (SROC) curves and plotted them with their associated confidence regions and summary points. During this review, we used RevMan 5 (computer program) (Version 5.4, Copenhagen: The Nordic Cochrane Centre, The Cochrane Collaboration (2014)), RStudio (R Core Team, Vienna, Austria; https://www.R-project.org/) and Stata (StataCorp LLC, TX, USA) for the statistical analyses. Statistical significance was considered when two-tailed p < 0.05.
Investigations of heterogeneity
We expected significant heterogeneity due to differences in study populations, settings, variation in IVC measurement method, threshold values, and variation in the reference standard, and its threshold value for defining FR. We evaluated the heterogeneity using Cochrane’s Q test, bivariate version of the Higgins’ I2, reported with each forest plot, and considered significant when Q < 0.1 and I2 > 50%.
Sensitivity analysis
We created a probability-modifying plot, a graphical sensitivity analysis of predictive value across a prevalence continuum defining low- to high-risk populations (Figure 3(a)).
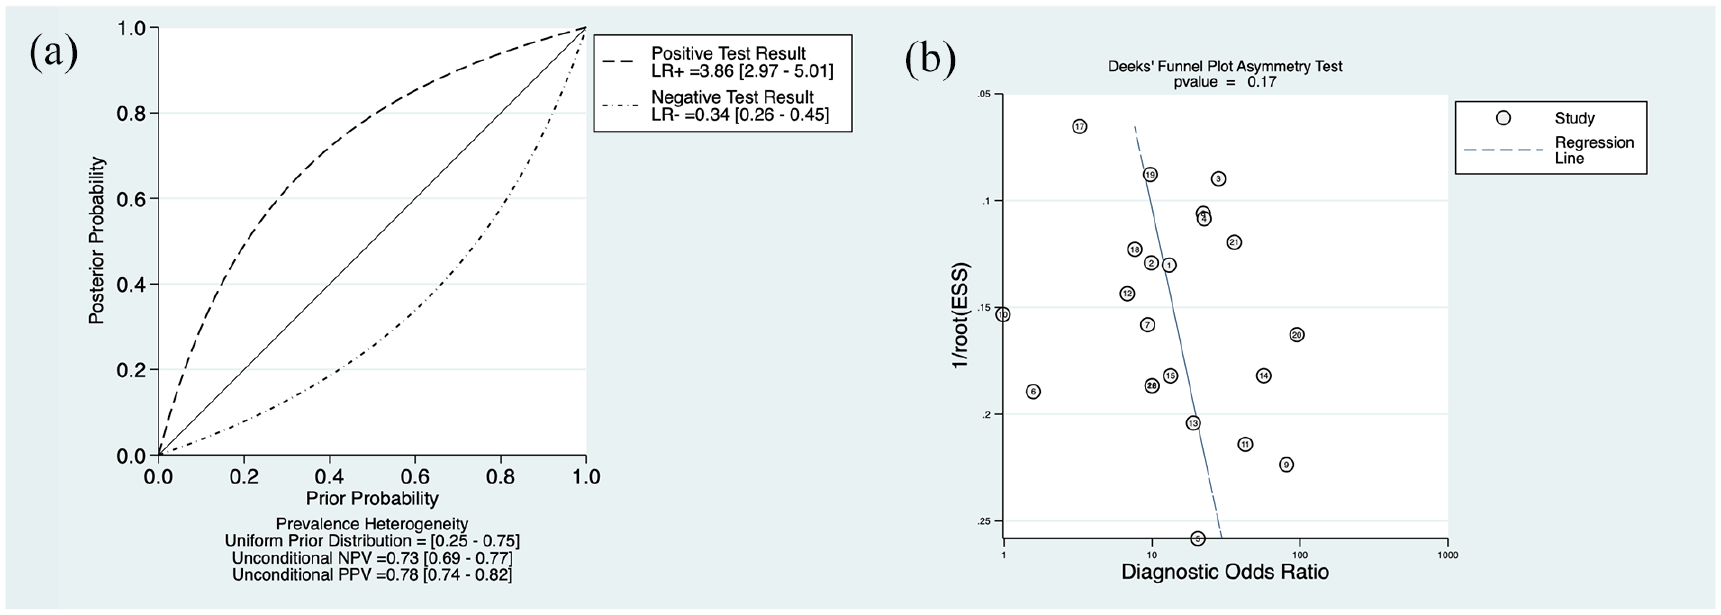
(a) The probability-modifying plot. (b) Deek’s funnel plot for the assessment of publication bias.
Assessment of reporting bias
We used Deek’s version of the funnel plot to evaluate reporting bias. We graphed the regression of diagnostic log odds ratio against 1/sqrt (effective sample size), weighting by effective sample size, where p < 0.10 for the slope coefficient indicating significant asymmetry and no significant asymmetry (Figure 3(b)).
Results
Search results
We retrieved 270 records from the databases’ initial search and reference chasing and excluded 171 records due to irrelevance, wrong patient population or publication type. Figure 1 shows the study selection process. We screened the abstracts of 99 studies and full texts of 42 studies for eligibility. After excluding 78 more studies, 21 studies fulfilled all inclusion criteria and were included in the analysis.
The methodological quality of the included studies
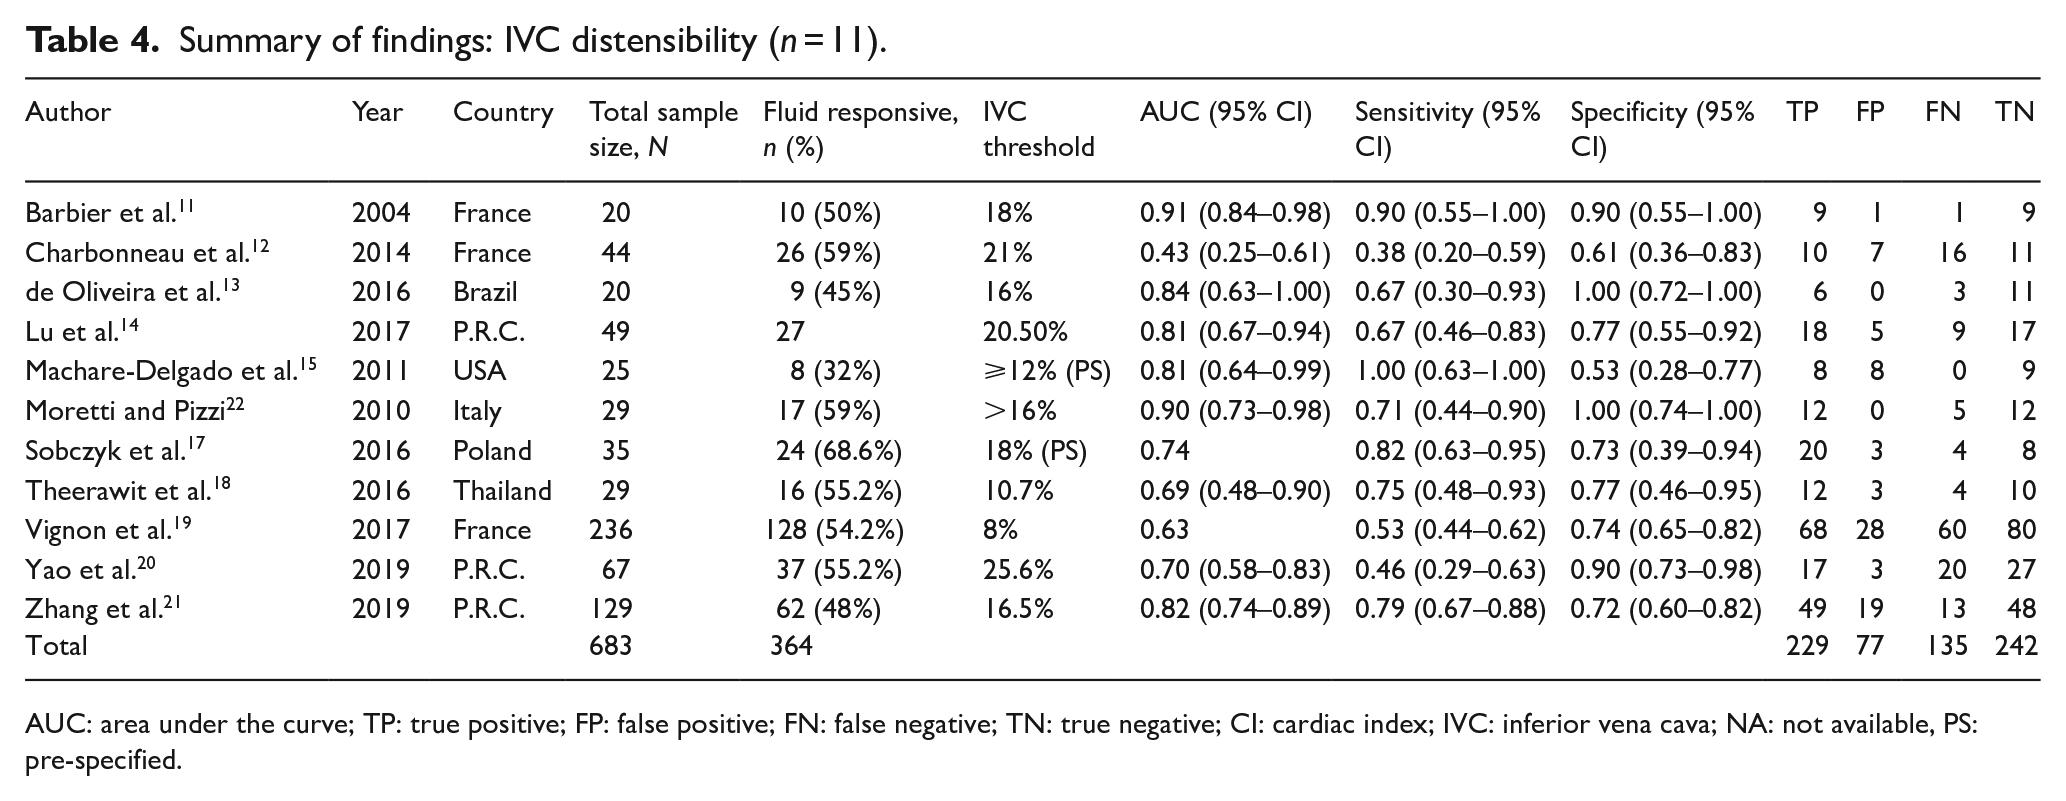
Tables 1–3 show the main characteristics of the included studies. We grouped studies according to the equation used. Of the 21 studies, 11, 8 and 3 studies reported IVCd, IVCc and IVCv index, respectively. One study was conducted in the operating room (OR), one in the ED and the rest in the ICU. Only one study included patients aged >14 years; the rest included adults only. Moreover, 8 and 13 studies included sedated patients on MV and those with spontaneous breathing. The calculated threshold values of the IVC indexes for FR varied among studies. The site of IVC diameter measurement, fluid challenge volume and content was also variable among studies. The reference standard tests for FR were SV, stroke volume index (SVI), stroke volume variation (SVV), CO, cardiac index (CI) or VTI. In 13 studies, the reference standard was measured using TTE, and FR was defined as an increase of >10%–15% following fluid challenge or PLR. In the remaining studies, the reference standard tests were measured using PCA, APWA, BR or TPTD with variable thresholds. A threshold of 15% and 10% for FR was accepted in 11 and 10 studies, respectively.
Characteristics of studies included in the meta-analyses: IVC distensibility (n = 11).
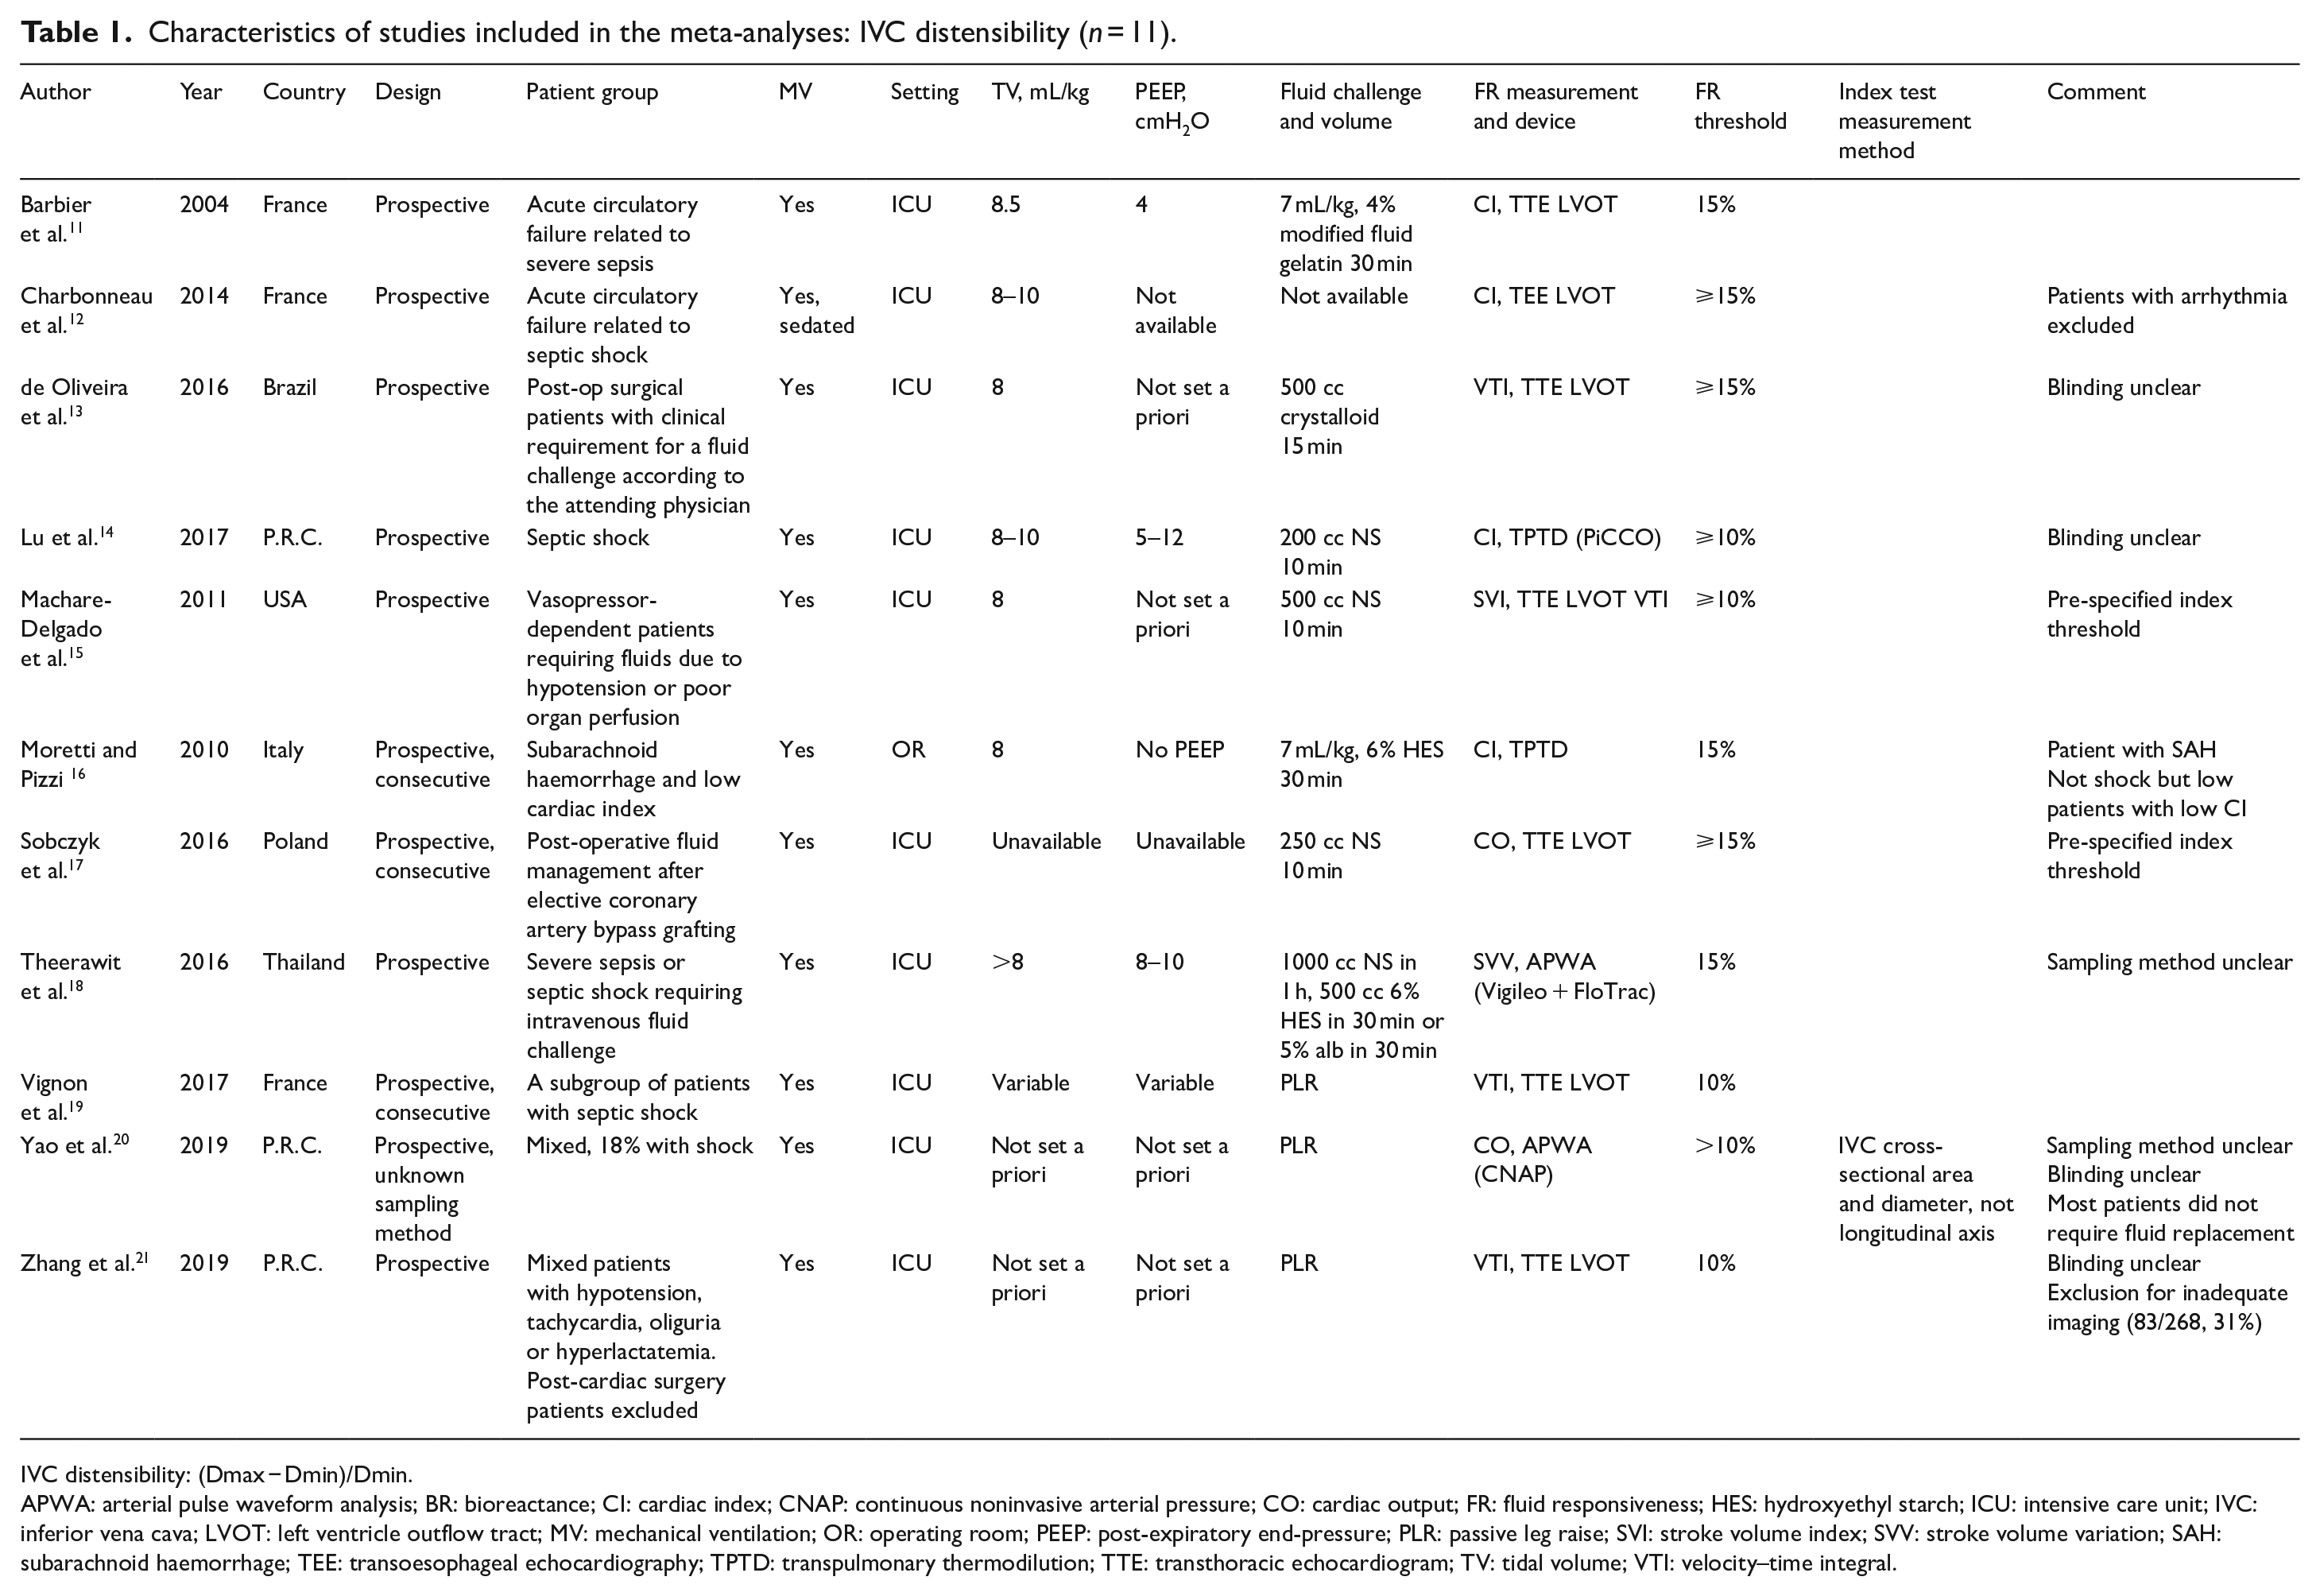
IVC distensibility: (Dmax − Dmin)/Dmin.
APWA: arterial pulse waveform analysis; BR: bioreactance; CI: cardiac index; CNAP: continuous noninvasive arterial pressure; CO: cardiac output; FR: fluid responsiveness; HES: hydroxyethyl starch; ICU: intensive care unit; IVC: inferior vena cava; LVOT: left ventricle outflow tract; MV: mechanical ventilation; OR: operating room; PEEP: post-expiratory end-pressure; PLR: passive leg raise; SVI: stroke volume index; SVV: stroke volume variation; SAH: subarachnoid haemorrhage; TEE: transoesophageal echocardiography; TPTD: transpulmonary thermodilution; TTE: transthoracic echocardiogram; TV: tidal volume; VTI: velocity–time integral.
Characteristics of studies included in the meta-analyses: IVC collapsibility (n = 8).
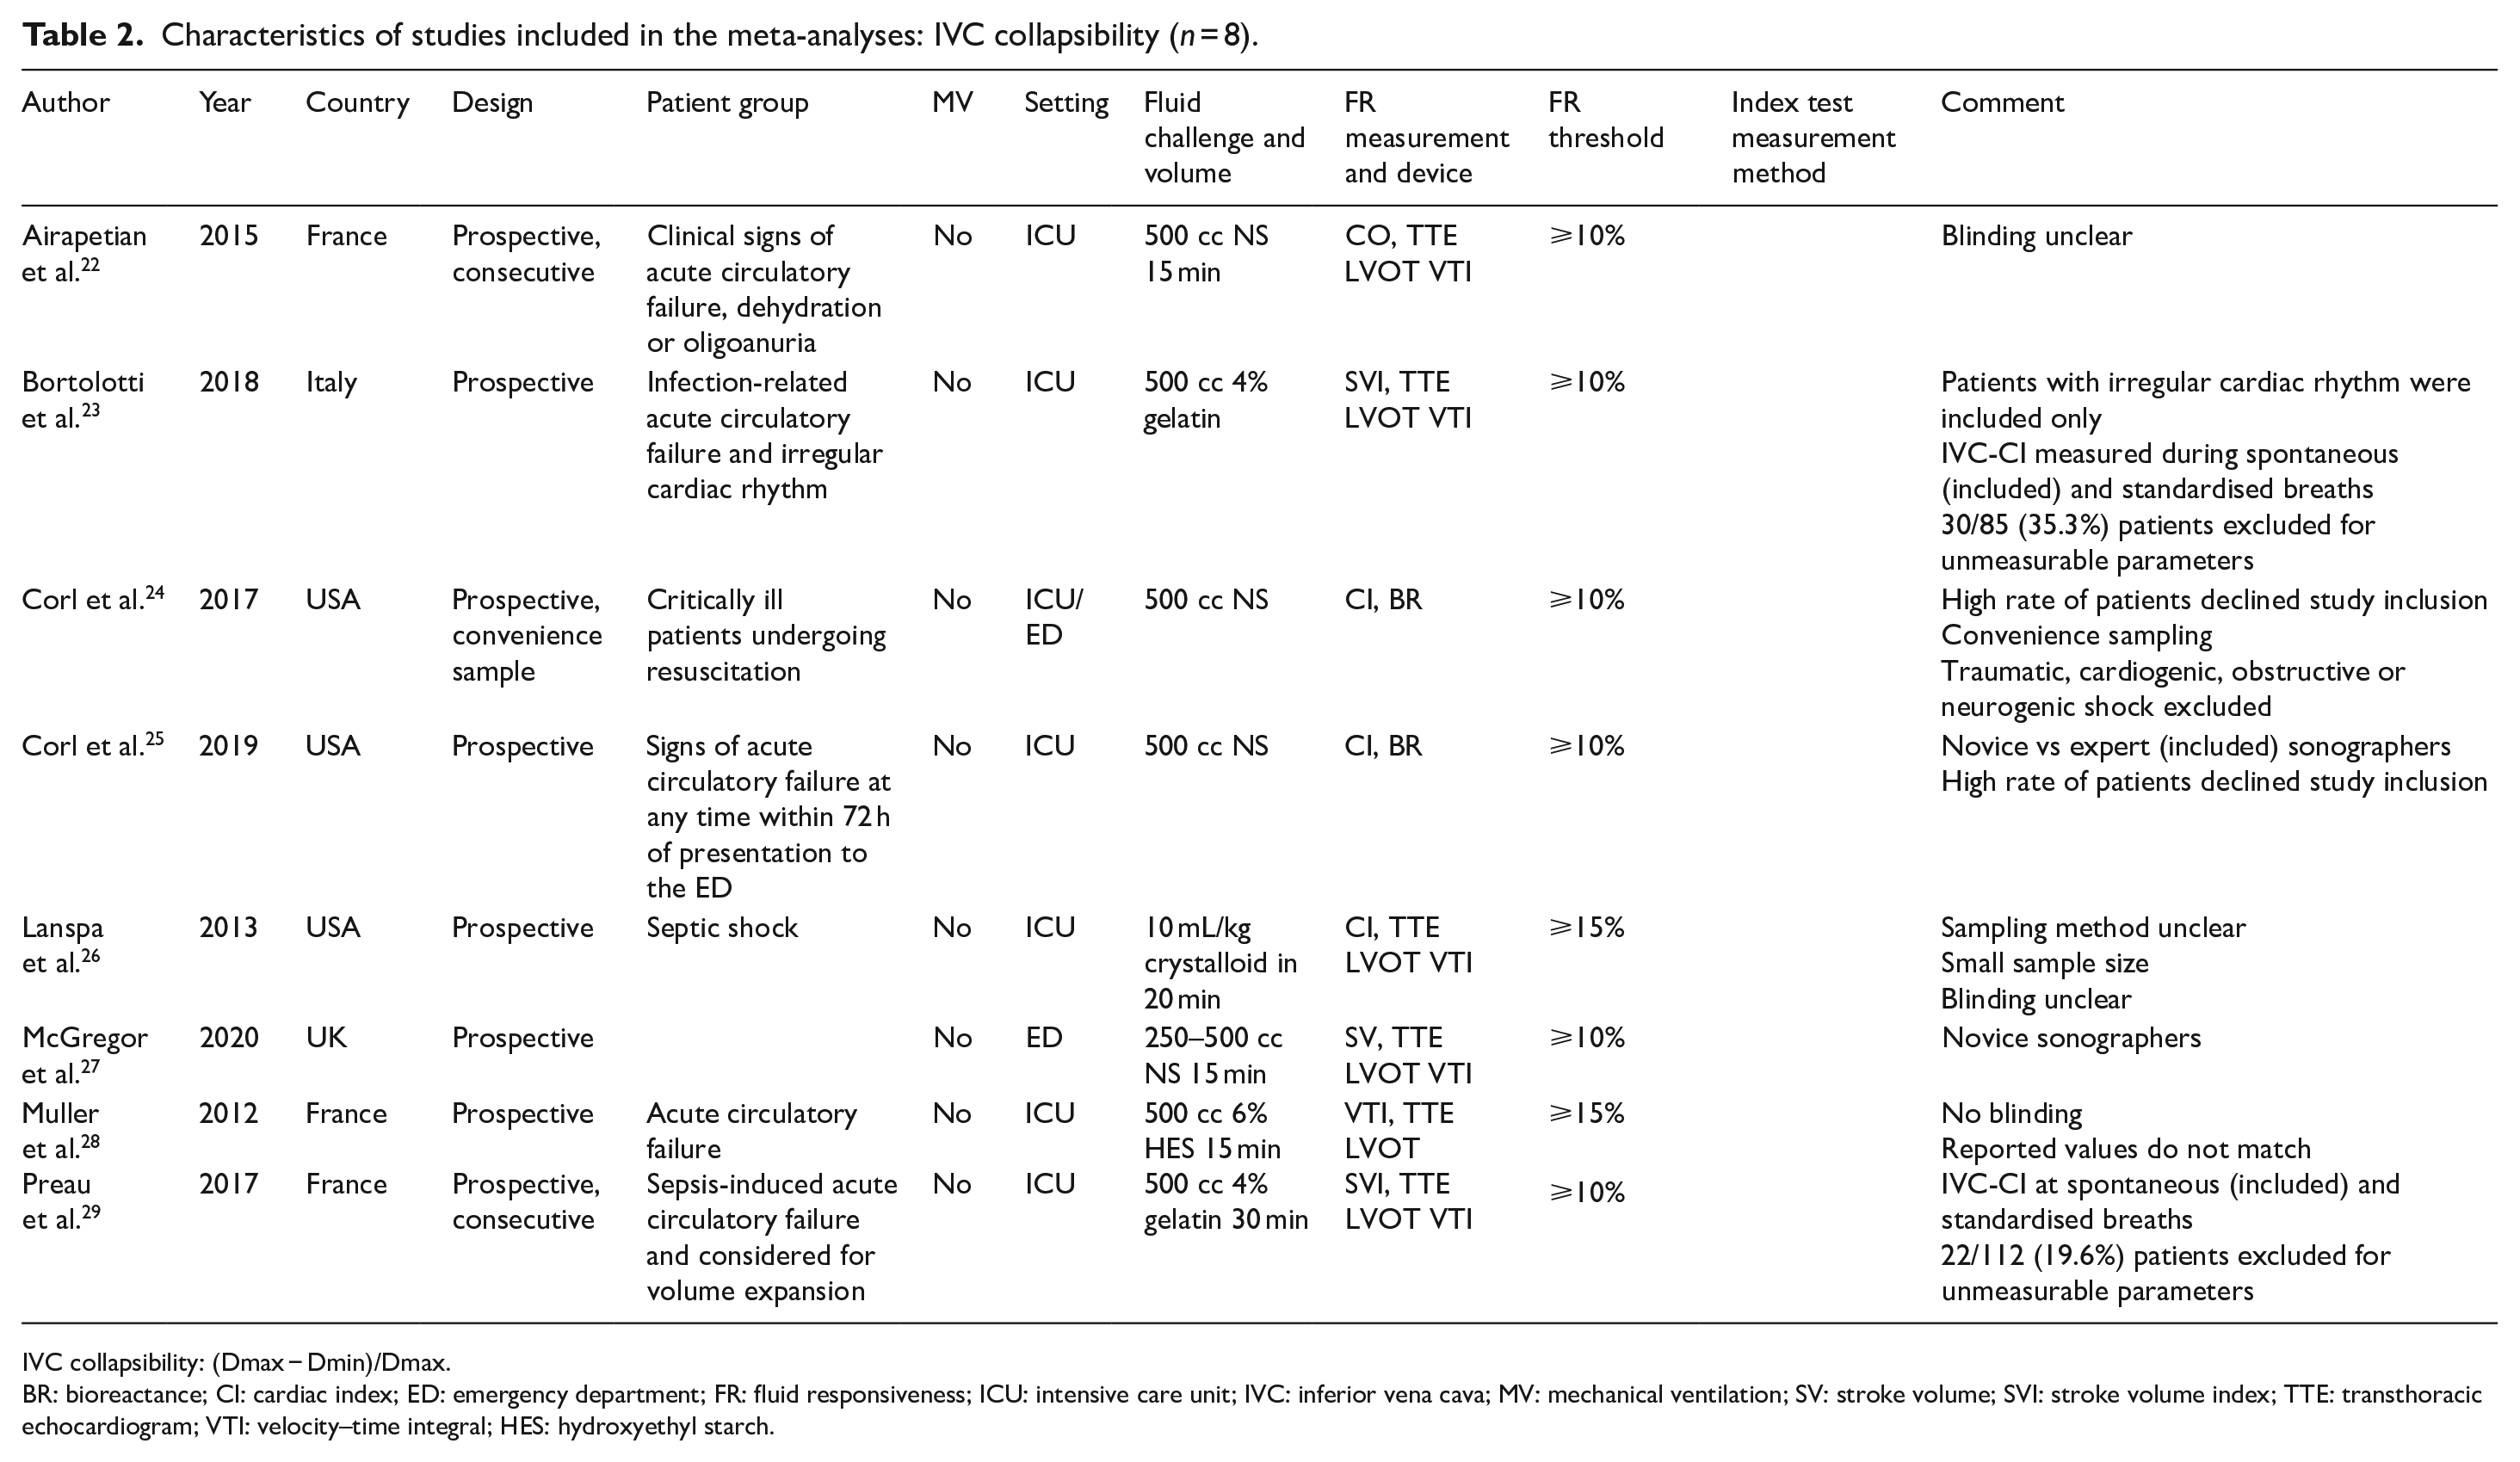
IVC collapsibility: (Dmax − Dmin)/Dmax.
BR: bioreactance; CI: cardiac index; ED: emergency department; FR: fluid responsiveness; ICU: intensive care unit; IVC: inferior vena cava; MV: mechanical ventilation; SV: stroke volume; SVI: stroke volume index; TTE: transthoracic echocardiogram; VTI: velocity–time integral; HES: hydroxyethyl starch.
Characteristics of studies included in the meta-analyses: IVC variability (n = 3).
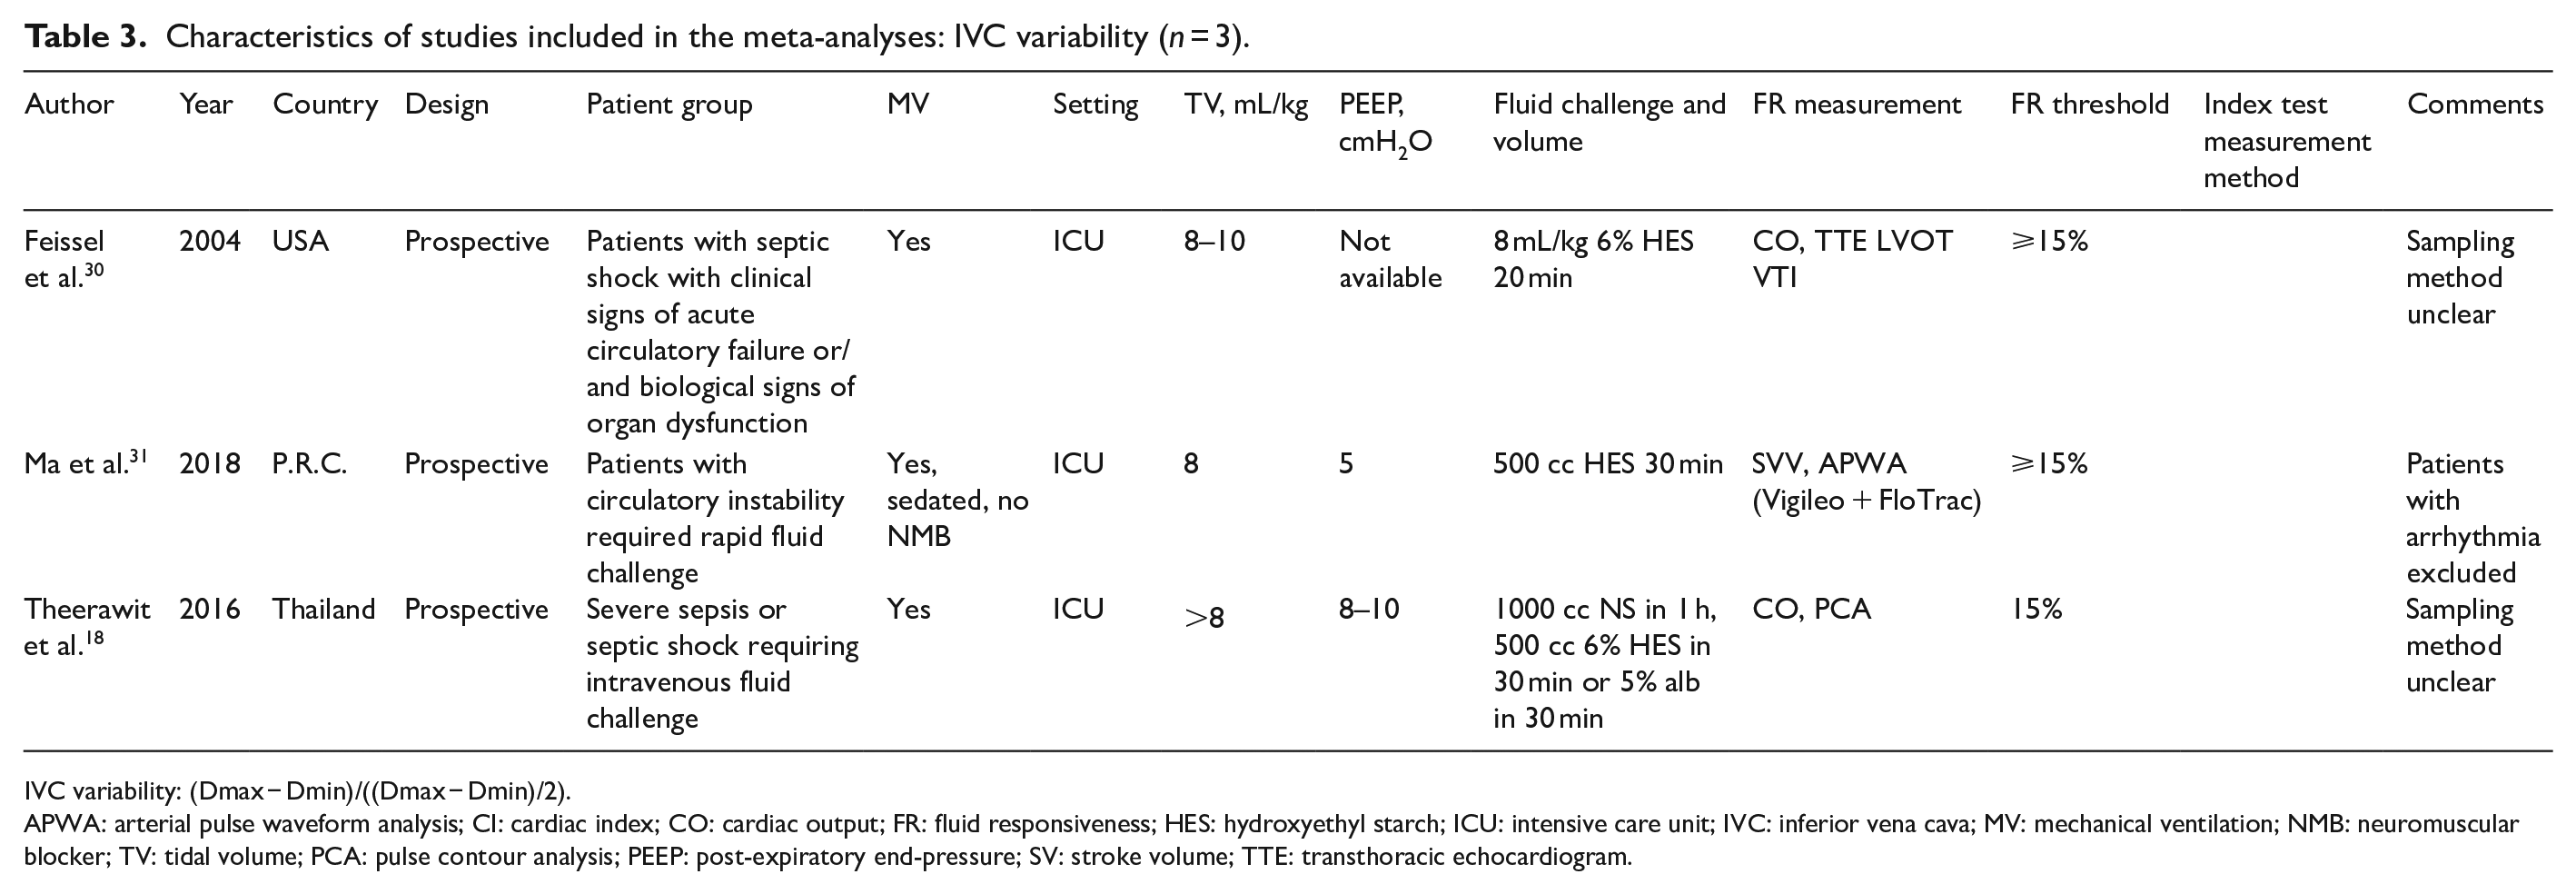
IVC variability: (Dmax − Dmin)/((Dmax − Dmin)/2).
APWA: arterial pulse waveform analysis; CI: cardiac index; CO: cardiac output; FR: fluid responsiveness; HES: hydroxyethyl starch; ICU: intensive care unit; IVC: inferior vena cava; MV: mechanical ventilation; NMB: neuromuscular blocker; TV: tidal volume; PCA: pulse contour analysis; PEEP: post-expiratory end-pressure; SV: stroke volume; TTE: transthoracic echocardiogram.
The quality of the included studies was assessed using QUADAS-2 (Figure 2). All studies met the inclusion criteria for the index test, reference standard and patient population. The duration between the index and reference tests was within the acceptable range, and both the index and reference tests were performed in all included patients. Information on the consecutive or random sampling of the participants was consistently missing in almost all studies. Information regarding the blinding of the performers and interpreters of the index and reference tests were either missing or unavailable in most studies. Inter- and intra-observer variability in the index test and the reference test was also poorly reported.
Findings
Overall, 21 studies with 1321 patients were included, of whom 689 (52%) were fluid responsive (Tables 4–6). The mean threshold values for a positive index test were 17%, 35% and 12% for IVCd, IVCc and IVCv, respectively.
Summary of findings: IVC distensibility (n = 11).
AUC: area under the curve; TP: true positive; FP: false positive; FN: false negative; TN: true negative; CI: cardiac index; IVC: inferior vena cava; NA: not available, PS: pre-specified.
Summary of findings: IVC collapsibility (n = 8).
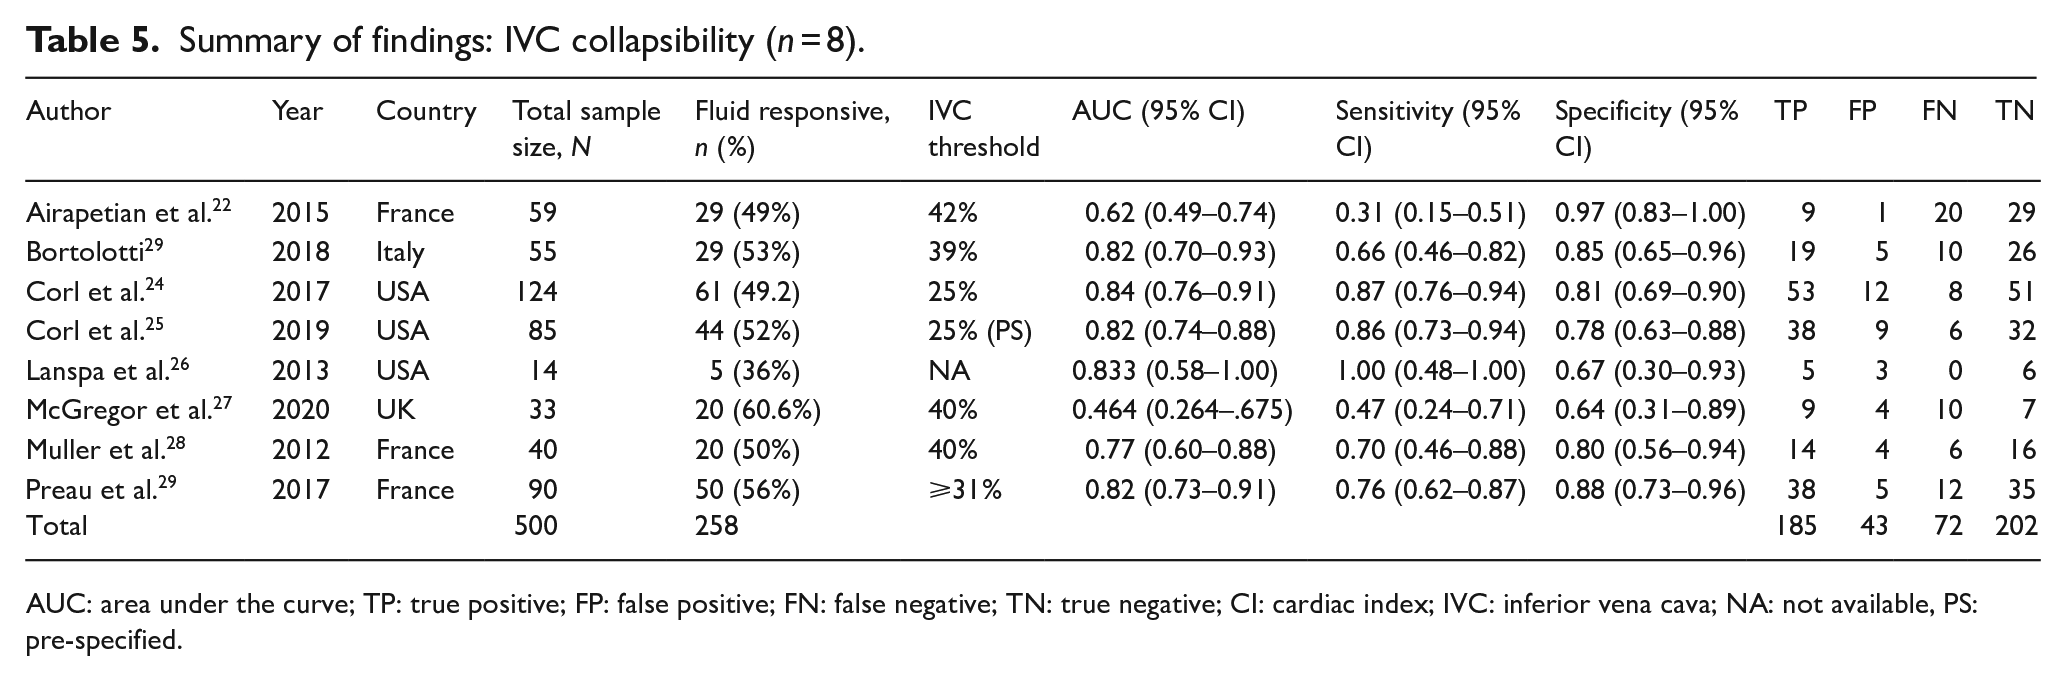
AUC: area under the curve; TP: true positive; FP: false positive; FN: false negative; TN: true negative; CI: cardiac index; IVC: inferior vena cava; NA: not available, PS: pre-specified.
Summary of findings: IVC variability (n = 3).
AUC: area under the curve; TP: true positive; FP: false positive; FN: false negative; TN: true negative; CI: cardiac index; IVC: inferior vena cava; NA: not available, PS: pre-specified.
The overall diagnostic accuracy (AUC of the SROC curve) of the respiratory variability of the IVC diameter was 0.85 (95% confidence interval (CI) = 0.81–0.87) with sensitivity and specificity of 0.72 (95% CI = 0.64–0.79) and 0.81 (95% CI = 0.76–0.86), respectively (Figure 4(a)). The diagnostic accuracies of IVCc and IVCd were 0.86 (95% CI = 0.83–0.89) and 0.81 (95% CI = 0.77–0.84), with sensitivities of 0.73 (95% CI = 0.56–0.85) and 0.69 (95% CI = 0.57–0.79), and specificities of 0.83 (95% CI = 0.77–0.88) and 0.78 (95% CI = 0.68–0.85) (Figure 4(b) and (c)). The 95% confidence contours of the SROC curves of the distensibility and collapsibility indexes were overlapped, suggesting similar diagnostic accuracies. Because only three studies reported IVCv, creating an SROC curve was not possible.
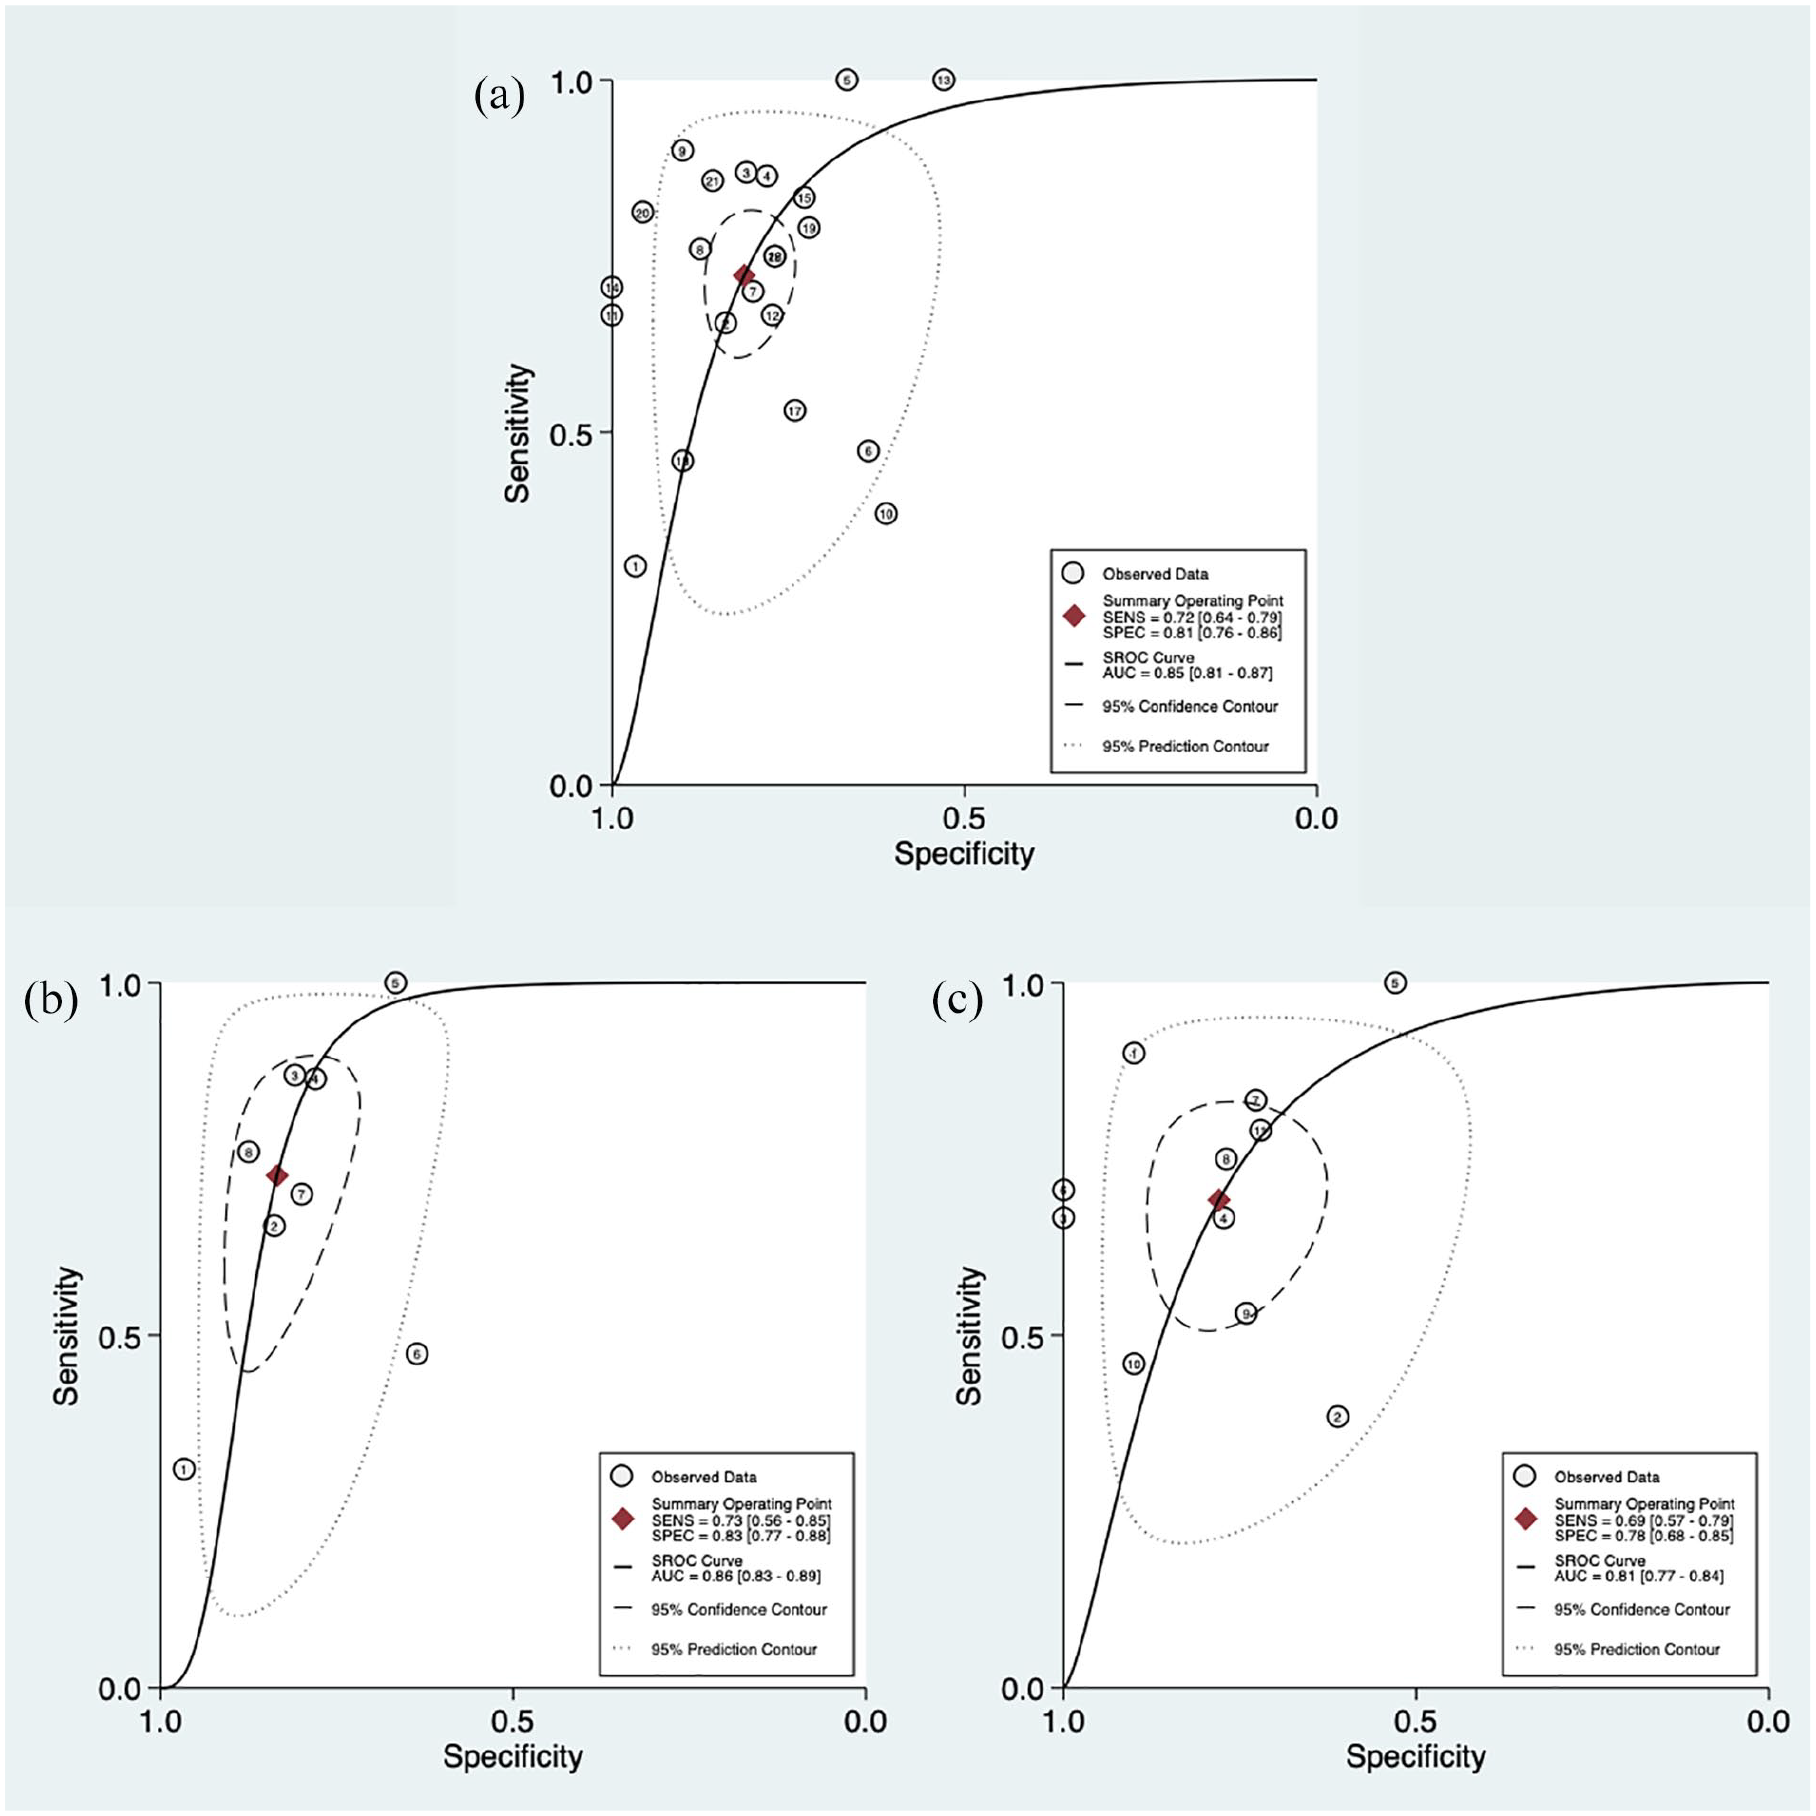
Summary ROC plot of tests with summary point and confidence regions: (a) all studies, (b) studies of IVC collapsibility and (c) studies of IVC distensibility. Circles represent each study included in the meta-analysis.
The forest plot of the pooled sensitivity and specificities (Figure 5) and positive and negative diagnostic likelihood ratios (DLRs) (Figure 6) were presented according to the equations. The pooled positive and negative DLRs of the IVC diameter were 3.86 (95% CI = 2.97–5.01) and 0.34 (95% CI = 0.26–0.45), respectively, suggesting moderate diagnostic utility for predicting the presence of FR. The heterogeneity between studies was low for positive likelihood ratios but high for negative likelihood ratios.
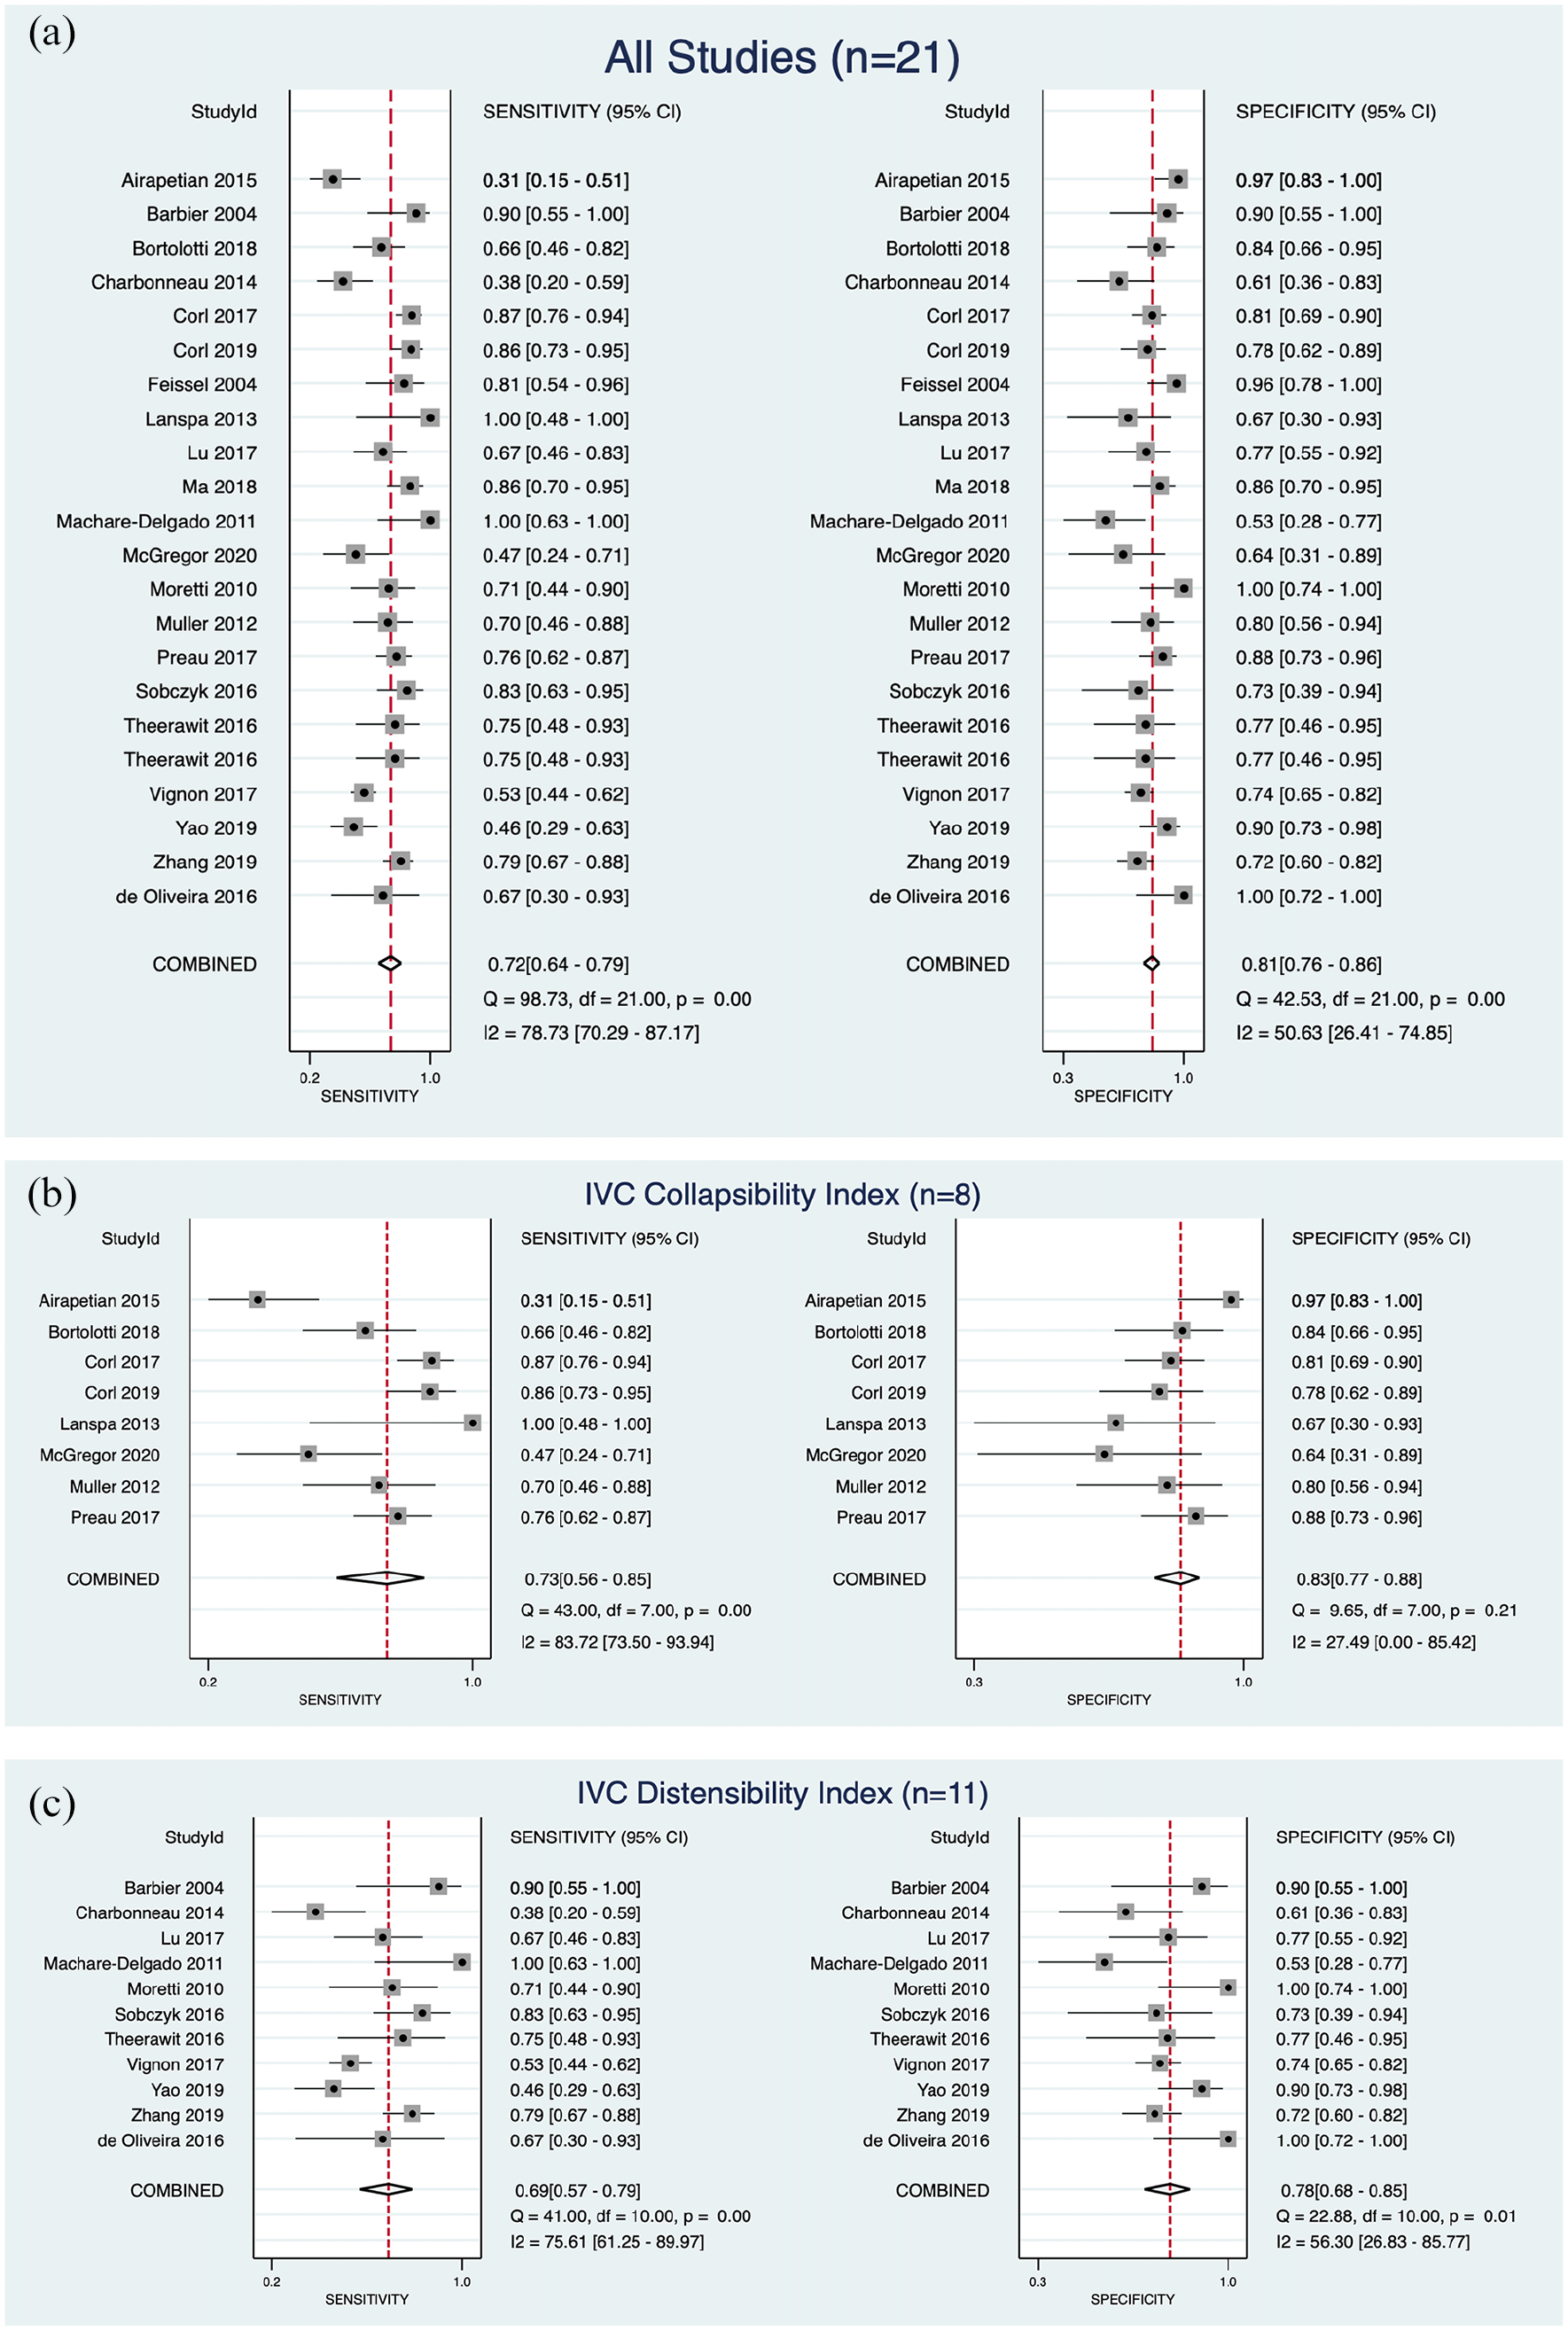
Forest plot of the pooled sensitivity and specificities: (a) all studies, (b) studies reporting IVC collapsibility and (c) studies reporting IVC distensibility.
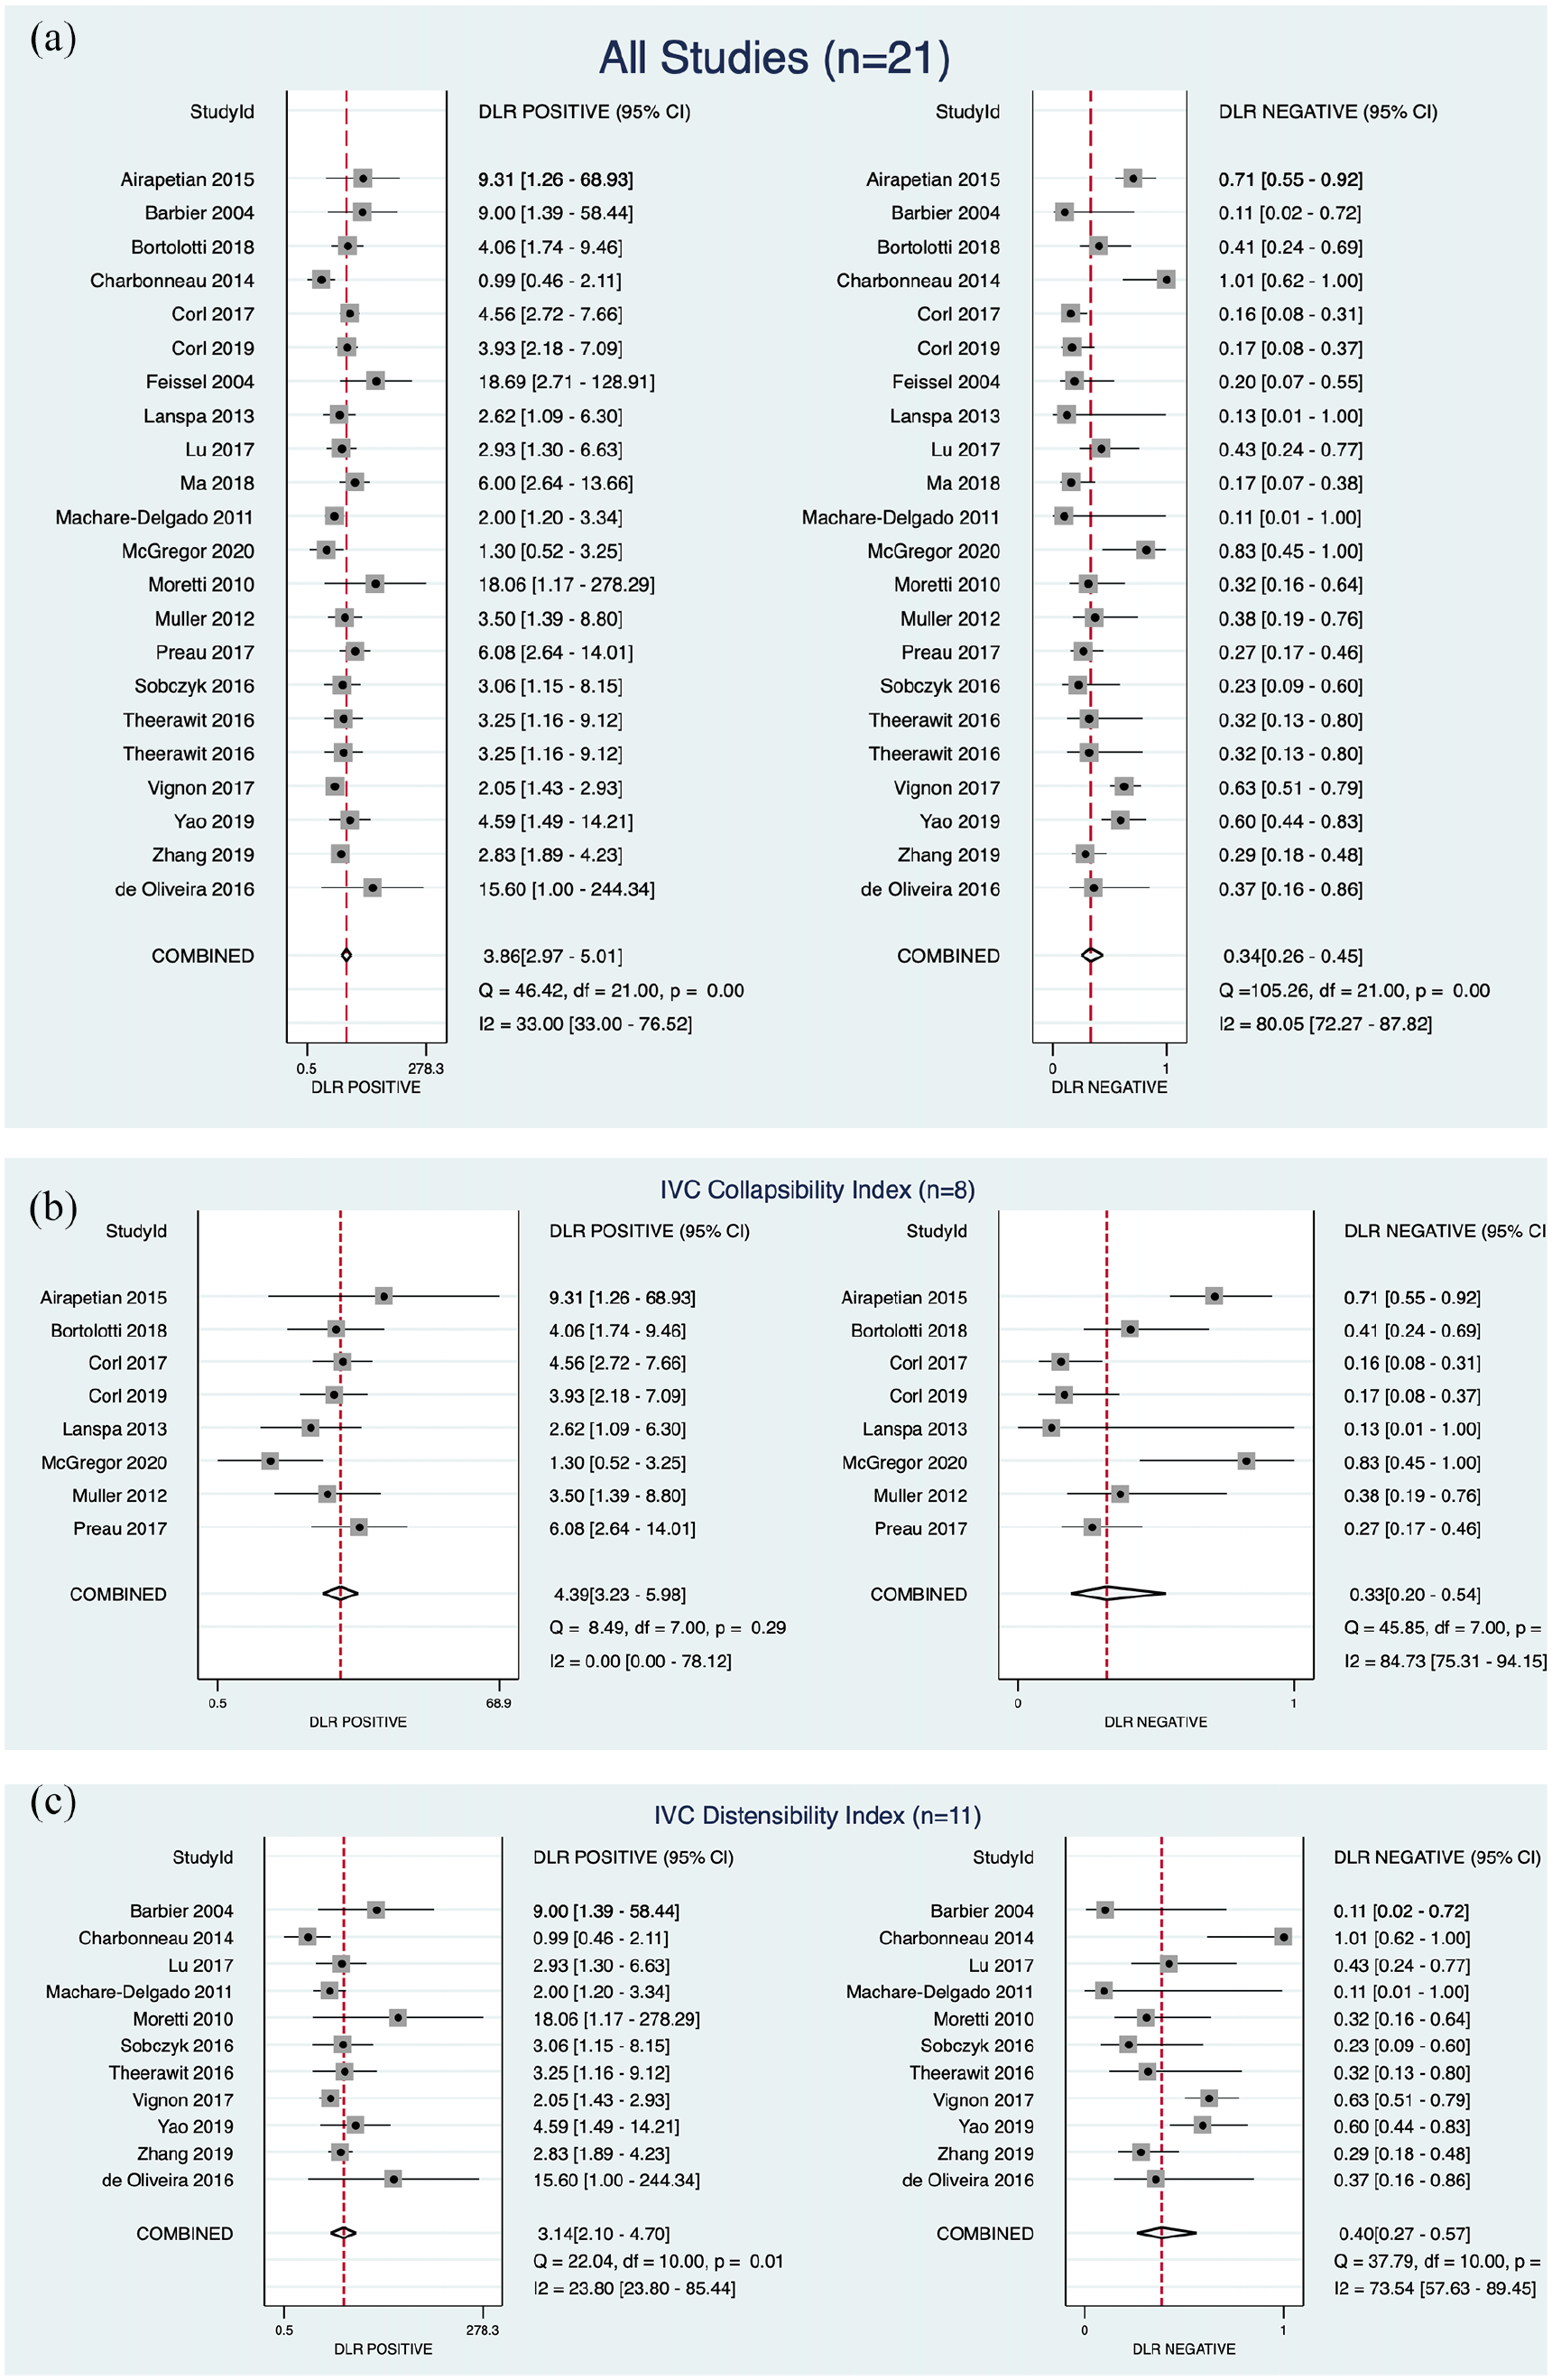
Forest plot of the pooled positive and negative diagnostic likelihood ratios: (a) all studies, (b) studies reporting IVC collapsibility and (c) studies reporting IVC distensibility.
Meta-regression analysis showed no significant difference between the sensitivity and specificities of subgroups according to the setting (ED, ICU) or ventilation (spontaneous, MV). The clinical utility of the respiratory variation of the IVC diameter was graphed for the pre-test probability of 25% in the Fagan nomogram in Figure 7. In a patient with a pre-test probability of 25%, the post-test probability of FR would be 56% and 10% in the presence or absence of IVCv, respectively.
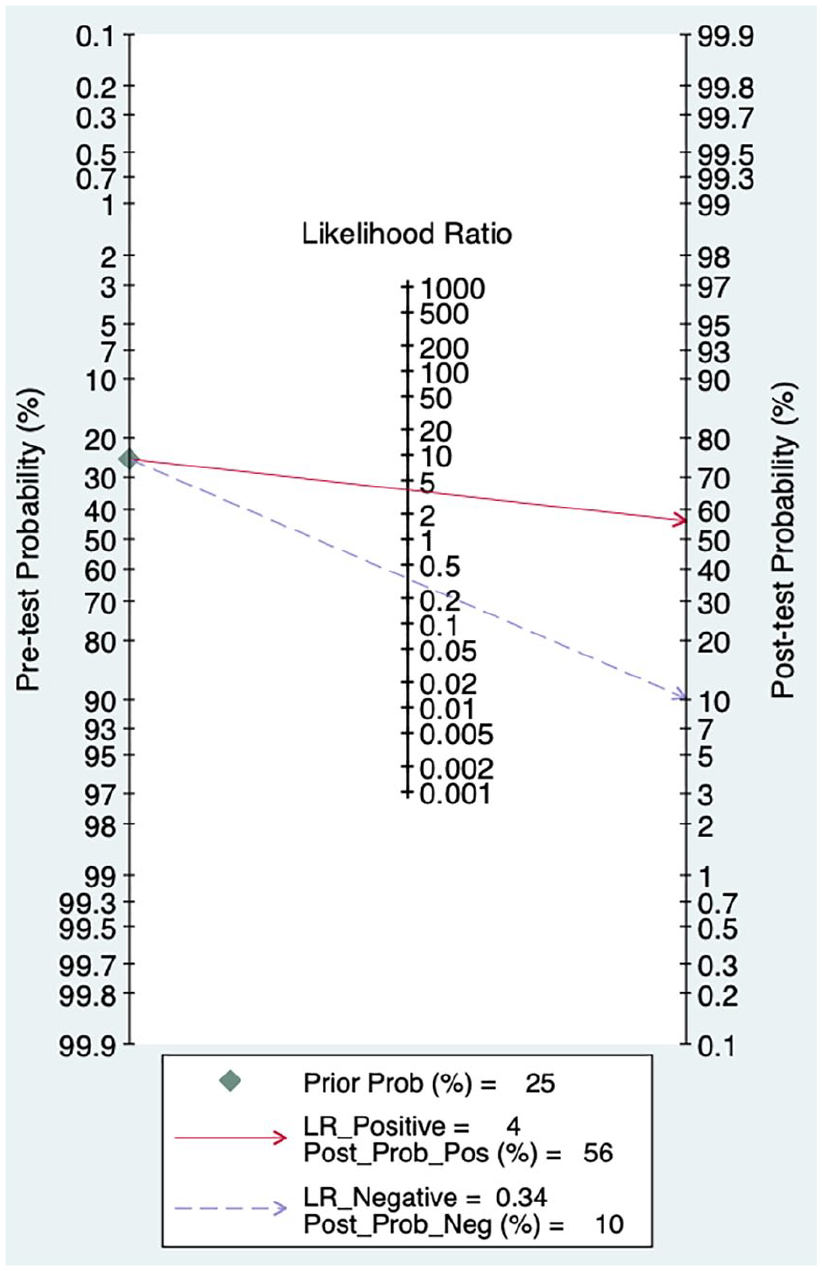
Fagan nomogram.
Summary of main results
This meta-analysis including 21 studies with 1321 patients showed that the respiratory variation of the IVC diameter had moderate diagnostic utility for predicting FR, regardless of the equation used. We did not find any significant difference in the subgroups because all confidence regions were overlapped, and only three studies were included in the IVCv domain. For IVCc, positive DLR was homogeneous among studies included. The heterogeneity of the included studies was high.
Discussion
One of the essential tasks of providers is predicting the FR of critical care patients in the ED or ICU. Therefore, those indexes still have great value in practice. Studies on the use of respiratory variability of the IVC diameter for predicting FR concluded discordant results despite the increase in their methodological quality and sample size in recent years. 32 The respiratory variation of the IVC diameter had a moderate diagnostic utility to predict FR. There were paucity of data regarding the selection of the optimal equation to calculate the variability of the IVC diameter. The diagnostic utilities of different equations did not differ significantly.
Several systematic reviews and meta-analyses were conducted on the diagnostic accuracy of IVC indexes to predict FR. In 2012, Mandeville and Colebourn 33 conducted a meta-analysis to evaluate the use of TTE in assessing dynamic markers of preload to predict FR in critically ill adult patients. They used broader selection criteria. Therefore, their study set was heterogeneous, including studies evaluating different measurement methods for FR, including IVC indexes. They concluded that meta-analysis cannot be performed because of the heterogeneity of the studies, as expected. 33 In 2014, Zhang et al. 34 conducted a meta-analysis focused on the diagnostic accuracy of the respiratory variation in IVC diameter as measured by bedside USG in predicting FR in critically ill patients. They included eight studies involving 235 patients, which comprised 6 of the 21 studies in our set. They concluded that the IVC diameter measured using USG is of great value in predicting FR, particularly in patients on controlled MV and in patients resuscitated with colloids. However, their study was limited by the small sample sizes of the included studies. In 2017, Long et al. 35 updated the systematic review to 17 studies involving 533 patients. They reported the pooled sensitivity and specificity of 0.63 (95% CI = 0.56–0.69) and 0.73 (95% CI = 0.67–0.78), respectively, with a pooled area under the receiver operating characteristic (AUROC) of 0.79. They conducted a subgroup analysis and found that respiratory variation in IVC diameter was a better predictor of FR in MV patients. In 2018, Si et al. 36 performed a similar meta-analysis by focusing on patients receiving MV. They included 12 studies involving 753 patients and performed subgroup analysis in the patient group ventilated with tidal volume (TV) ⩾8 mL/kg and PEEP ⩽5 cmH2O. They reported the AUC of the SROC curve of the IVC diameter to predict FR in all patients on MV of 0.85 (95% CI = 0.81–0.86), sensitivity of 0.73 (95% CI = 0.60–0.84) and specificity of 0.82 (95% CI = 0.69–0.91). They concluded that the respiratory variability of the IVC diameter had limited ability for predicting FR in distinct ventilator settings, especially in patients with TV <8 mL/kg or PEEP >5 cmH2O, and suggested that intensivists must be cautious when using respiratory variability of IVC diameter in those patients. In another meta-analysis published in 2018, Huang et al. 37 focused on patients with circulatory shock receiving MV for the first time. They included six studies involving 603 patients. They concluded that the respiratory variability of IVC diameter performed moderately well in predicting FR with an AUC of SROC, sensitivity and specificity of 0.82 (95% CI = 0.79–0.85), 0.69 (95% CI = 0.51–0.83) and 0.80 (95% CI = 0.66–0.89), respectively. Currently, Orso et al. 32 evaluated the accuracy of the ‘caval index’ assessed using USG in predicting FR and included 20 studies involving 1709 cases. They reported that the pooled AUC, logarithmic diagnostic odds ratio, sensitivity and specificity were 0.71 (95% CI = 0.46–0.83), 2.02 (95% CI = 1.29–2.89), 0.71 (95% CI = 0.62–0.80) and 0.75 (95% CI = 0.64–0.85), respectively. 32 The studies included in their meta-analysis were significantly different in their reference standard.
The pooled diagnostic utility estimates in this meta-analysis were quite similar to the previous studies. Our findings of the pooled positive and negative DLR of 3.86 and 0.34 suggest that respiratory variation in IVC diameter had moderate diagnostic utility for predicting the presence or absence of FR in adults.
We found that the diagnostic utility of the respiratory variability of IVC diameter for predicting FR was lower but not statistically significant in MV patients compared with those with spontaneous breathing. IVCc cannot be used for MV patients; therefore, studies on spontaneously breathing patients exclusively used the IVCc index. However, IVCd and IVCv were used for MV patients. Therefore, it was unclear if this difference was related to the index, methodological bias or real difference. This was similar to the findings of the latest review by Orso et al. in 2018. 32 They proposed the lower extent of the changes in IVC diameter in MV patients as a reason for more approximation errors as an explanation.
We tried to decrease the heterogeneity of studies using explicit criteria for the selection of studies. We excluded studies on pregnant, paediatric or cancer patients, on dialysis patients or healthy volunteers, and in prehospital settings, which were proposed as possible covariates in previous studies. However, we still observed considerable heterogeneity among the reported diagnostic utility metrics of the included studies. The clinical variability of the critically ill patients is high; therefore, final considerations in this study may be unreliable, although we used robust statistical methods (particularly, a Bayesian method through a hierarchical approach) to overcome this limitation.
Conclusion
This meta-analysis showed that the respiratory variation of the IVC diameter had moderate diagnostic utility for predicting FR, regardless of the equation used to calculate the IVCv, with pooled positive and negative DLR of 3.86 and 0.34, respectively.
Footnotes
Acknowledgements
No assistance in the preparation of this article is to be declared.
Author contributions
E.U.A. contributed to the conceptualisation, methodology, investigation, data curation, writing – original draft, writing – review and editing software, supervision and project administration. H.A. contributed to the methodology, formal analysis, investigation, resources, data curation, writing – original draft, writing – review and editing software and visualisation.
Declaration of conflicting interests
The author(s) declared no potential conflicts of interest with respect to the research, authorship and/or publication of this article.
Funding
The author(s) received no financial support for the research, authorship and/or publication of this article.
Availability of data and materials
The data sets generated and/or analysed during this study are available from the corresponding author.
Informed consent
Informed consent is not needed for systematic reviews.
Ethical approval
Ethical board approval is not needed for systematic reviews.
Human rights
This systematic review is performed under respectful conditions for human rights.