
Abstract
Background:
Sepsis is a dangerous disease with rapid development and high mortality rate, which is an important cause of death for critically ill patients. Therefore, timely and accurate assessment of patients’ condition is beneficial to improve prognosis and reduce mortality.
Objective:
This study was designed to investigate the potential correlation between red blood cell distribution width and 28-day prognosis of patients with sepsis.
Methods:
A prospective observational study enrolling 236 patients with sepsis or septic shock was performed at our hospital. All cases were divided into survival versus non-survival group on 28th day after diagnosis. The two groups were compared for general condition, underlying diseases, quick Sequential Organ Failure Assessment, Acute Physiology and Chronic Health Evaluation II score, C-reactive protein, procalcitonin, and red blood cell distribution width at admission.
Results:
The red blood cell distribution width level in non-survivors was higher than that in survivors (16.3 ± 2.8 vs 15.2 ± 1.7, p = 0.013). Cox regression analysis indicated that red blood cell distribution width was an independent predictor for 28-day mortality (hazard ratio: 1.311, 95% confidence interval: 1.119–3.011, p = 0.018). The red blood cell distribution width cutoff value of red blood cell distribution width for 28-day mortality was 16.1%, while patients with lower red blood cell distribution width levels had a better prognosis as demonstrated by Kaplan–Meier survival curves (log-rank = 7.398, p = 0.007). Unlike the septic shock group, in the sepsis group, the red blood cell distribution width level was higher in the non-survival group compared to the survival group (15.82% ± 0.93% vs 15.01% ± 0.89%, p < 0.001).
Conclusion:
Increased red blood cell distribution width may be an important predictor of disease progression and prognosis in patients with sepsis and septic shock. In the sepsis group, higher red blood cell distribution width levels predict poor prognosis.
Introduction
The red blood cell distribution width (RDW), a parameter reflecting the heterogeneity of red blood cell volume, usually works jointly with mean corpuscular volume (MCV) to determine the cause of anemia. 1 The RDW has been playing a critical role in diagnosing and differentiating anemia in clinical practice. 2 Recent studies have shown that RDW is associated with the prognosis of several diseases, such as coronary disease,3,4 hypertension, 5 stroke, 6 liver diseases,7,8 acute pulmonary embolism, 9 acute kidney injury, 10 and pulmonary hypertension. 11 Some studies also found that RDW is closely related to the prognosis of patients with sepsis and septic shock, 12 and Ku et al. 13 found that RDW is closely related to the prognosis of patients with Gram-negative bacterial infection. However, the mechanisms of increased RDW in these patients are unclear and may be related to inflammatory response. 14 For example, the RDW is increased with inflammatory markers, such as tumor necrosis factor-α (TNF-α) and interleukin-6. 15 These cytokines promote the elevation of RDW probably by suppressing the maturation and reducing the half-life of red blood cell.16–18 We hypothesize that RDW, as an inflammatory marker, may be associated with mortality of sepsis patients and thus evaluate the value of RDW in predicting 28-day mortality.
Patients and methods
Clinical data collection
This is a prospective, single-center cohort conducted at the emergency room (ER)–rescue room in a large university hospital. The diagnostic criteria for sepsis and septic shock are based on the Third International Consensus (Sepsis-3, 2016). 19 The qSOFA (quick Sequential Organ Failure Assessment) score is a newly presented definition of sepsis at the sepsis-3 consensus. This score assesses patient’s physical signs, with the following index each counted as one point: (1) respiratory rate ⩾ 22/min, (2) change in mental status, and (3) systolic blood pressure ⩽ 100 mm Hg. A qSOFA score of ⩾2 was reported to be related to poor prognosis of sepsis. 19 In this study, the patients were diagnosed with sepsis/septic shock and admitted to the ER–rescue room between April 2017 and May 2018. The exclusion criteria were as follows: age less than 18 years, blood diseases, liver diseases (such as hepatitis, fibrosis, and cirrhosis), chronic renal diseases, dialysis of uremia, surgical trauma, autoimmune diseases, tumors, pregnancy, and receiving hormone therapy. Data were collected during each patient’s first visit to ER–rescue room. All patients were followed up for 28 days after admission. Telephone follow-up was conducted for patients who leave the hospital within 28 days. The study was approved by the ethics committee of Beijing Chaoyang hospital, and each patient or family member included in this study signed an informed consent. Our cohort study followed the relevant Equator network guideline (Strengthening the Reporting of Observational Studies in Epidemiology [STROBE] Statement).
Basic data such as age, gender, height, weight, site of infection, and acute physiology and chronic health status II (APACHE II) score were collected for each patient within 24 h of admission. Patient’s underlying diseases such as pulmonary diseases, cardiovascular diseases, diabetes mellitus, and cerebrovascular diseases were also recorded upon the arrival at the ER–rescue room. In the qSOFA score, patients with a Glasgow Coma Scale (GCS) score of ⩽13 are considered to have a change in mental status.
The following indicators were measured within 24 h of those patients’ initial arrival in the ER–rescue room: blood routine examination, arterial blood gas analysis, biochemical test, procalcitonin (PCT), C-reactive protein (CRP), as well as pathogen detection of blood, urine, and sputum. The RDW was measured by an automatic blood analyzer (XN-9000; Sysmex, Japan). The CRP was measured by an automatic specific protein analyzer (PA-990; Lifotronic, Shenzhen, China). The PCT was measured with a mini-VIDAS immunoassay analyzer (BioMerieux, Italy). The normal range of RDW in our hospital was set up at 10%–15%.
Statistical analysis
The SPSS software (version 24.0; SPSS Inc, Chicago, IL, USA) was used for statistical analysis. The data conforming to normal distribution were expressed as mean ± standard deviation (SD), and those not conforming to normal distribution were expressed as median (25%–75%). All numeric variables were compared by Mann–Whitney U tests. χ2 or Fisher’s exact probability test was used to compare categorical variables. Potential prognostic risk factors were analyzed by Cox regression analyses. Risk factors were included in multivariable models based on literature review, expert opinion, and univariate analyses. The receiver operating characteristic (ROC) curve of risk factors of death was plotted. The area under the curve (AUC) was calculated by using MedCalc software (version 18.2.1; MedCalc Software, Ostend, Belgium).
Results
Patient characteristics
This study investigated 300 patients with suspected sepsis. Of whom, 64 cases were not initially enrolled in the cohort (17 cases were excluded due to incomplete test results and could not be diagnosed as sepsis; 47 cases were determined not to be sepsis based on test results and sepsis definitions and were therefore not included in the cohort). Of the remaining 236 patients, 190 (80.5%) and 46 (19.5%) patients were diagnosed with sepsis and septic shock, respectively. The selected patients included 138 males and 98 females aged between 44 and 95 years . The 28-day mortality rate was 31.4% (74/236). In our cohort, 51.7% (122/236) of the patients had chronic obstructive pulmonary disease (COPD), 37.3% (88/236) had cardiovascular disease, 40.7% (96/236) had diabetes, and 31.8% (75/236) had cerebrovascular disease. There was no significant difference in mortality among patients with different infection sites. The mortality rate in the septic shock group was much higher than the sepsis group (56.5% vs 25.3%, p < 0.001). Systolic blood pressure was much lower in the non-survival group than in the survival group. The levels of PCT, CRP, lactate, and RDW were significantly higher in the non-survival group than in the survival group (Table 1).
Baseline characteristics of the study population.
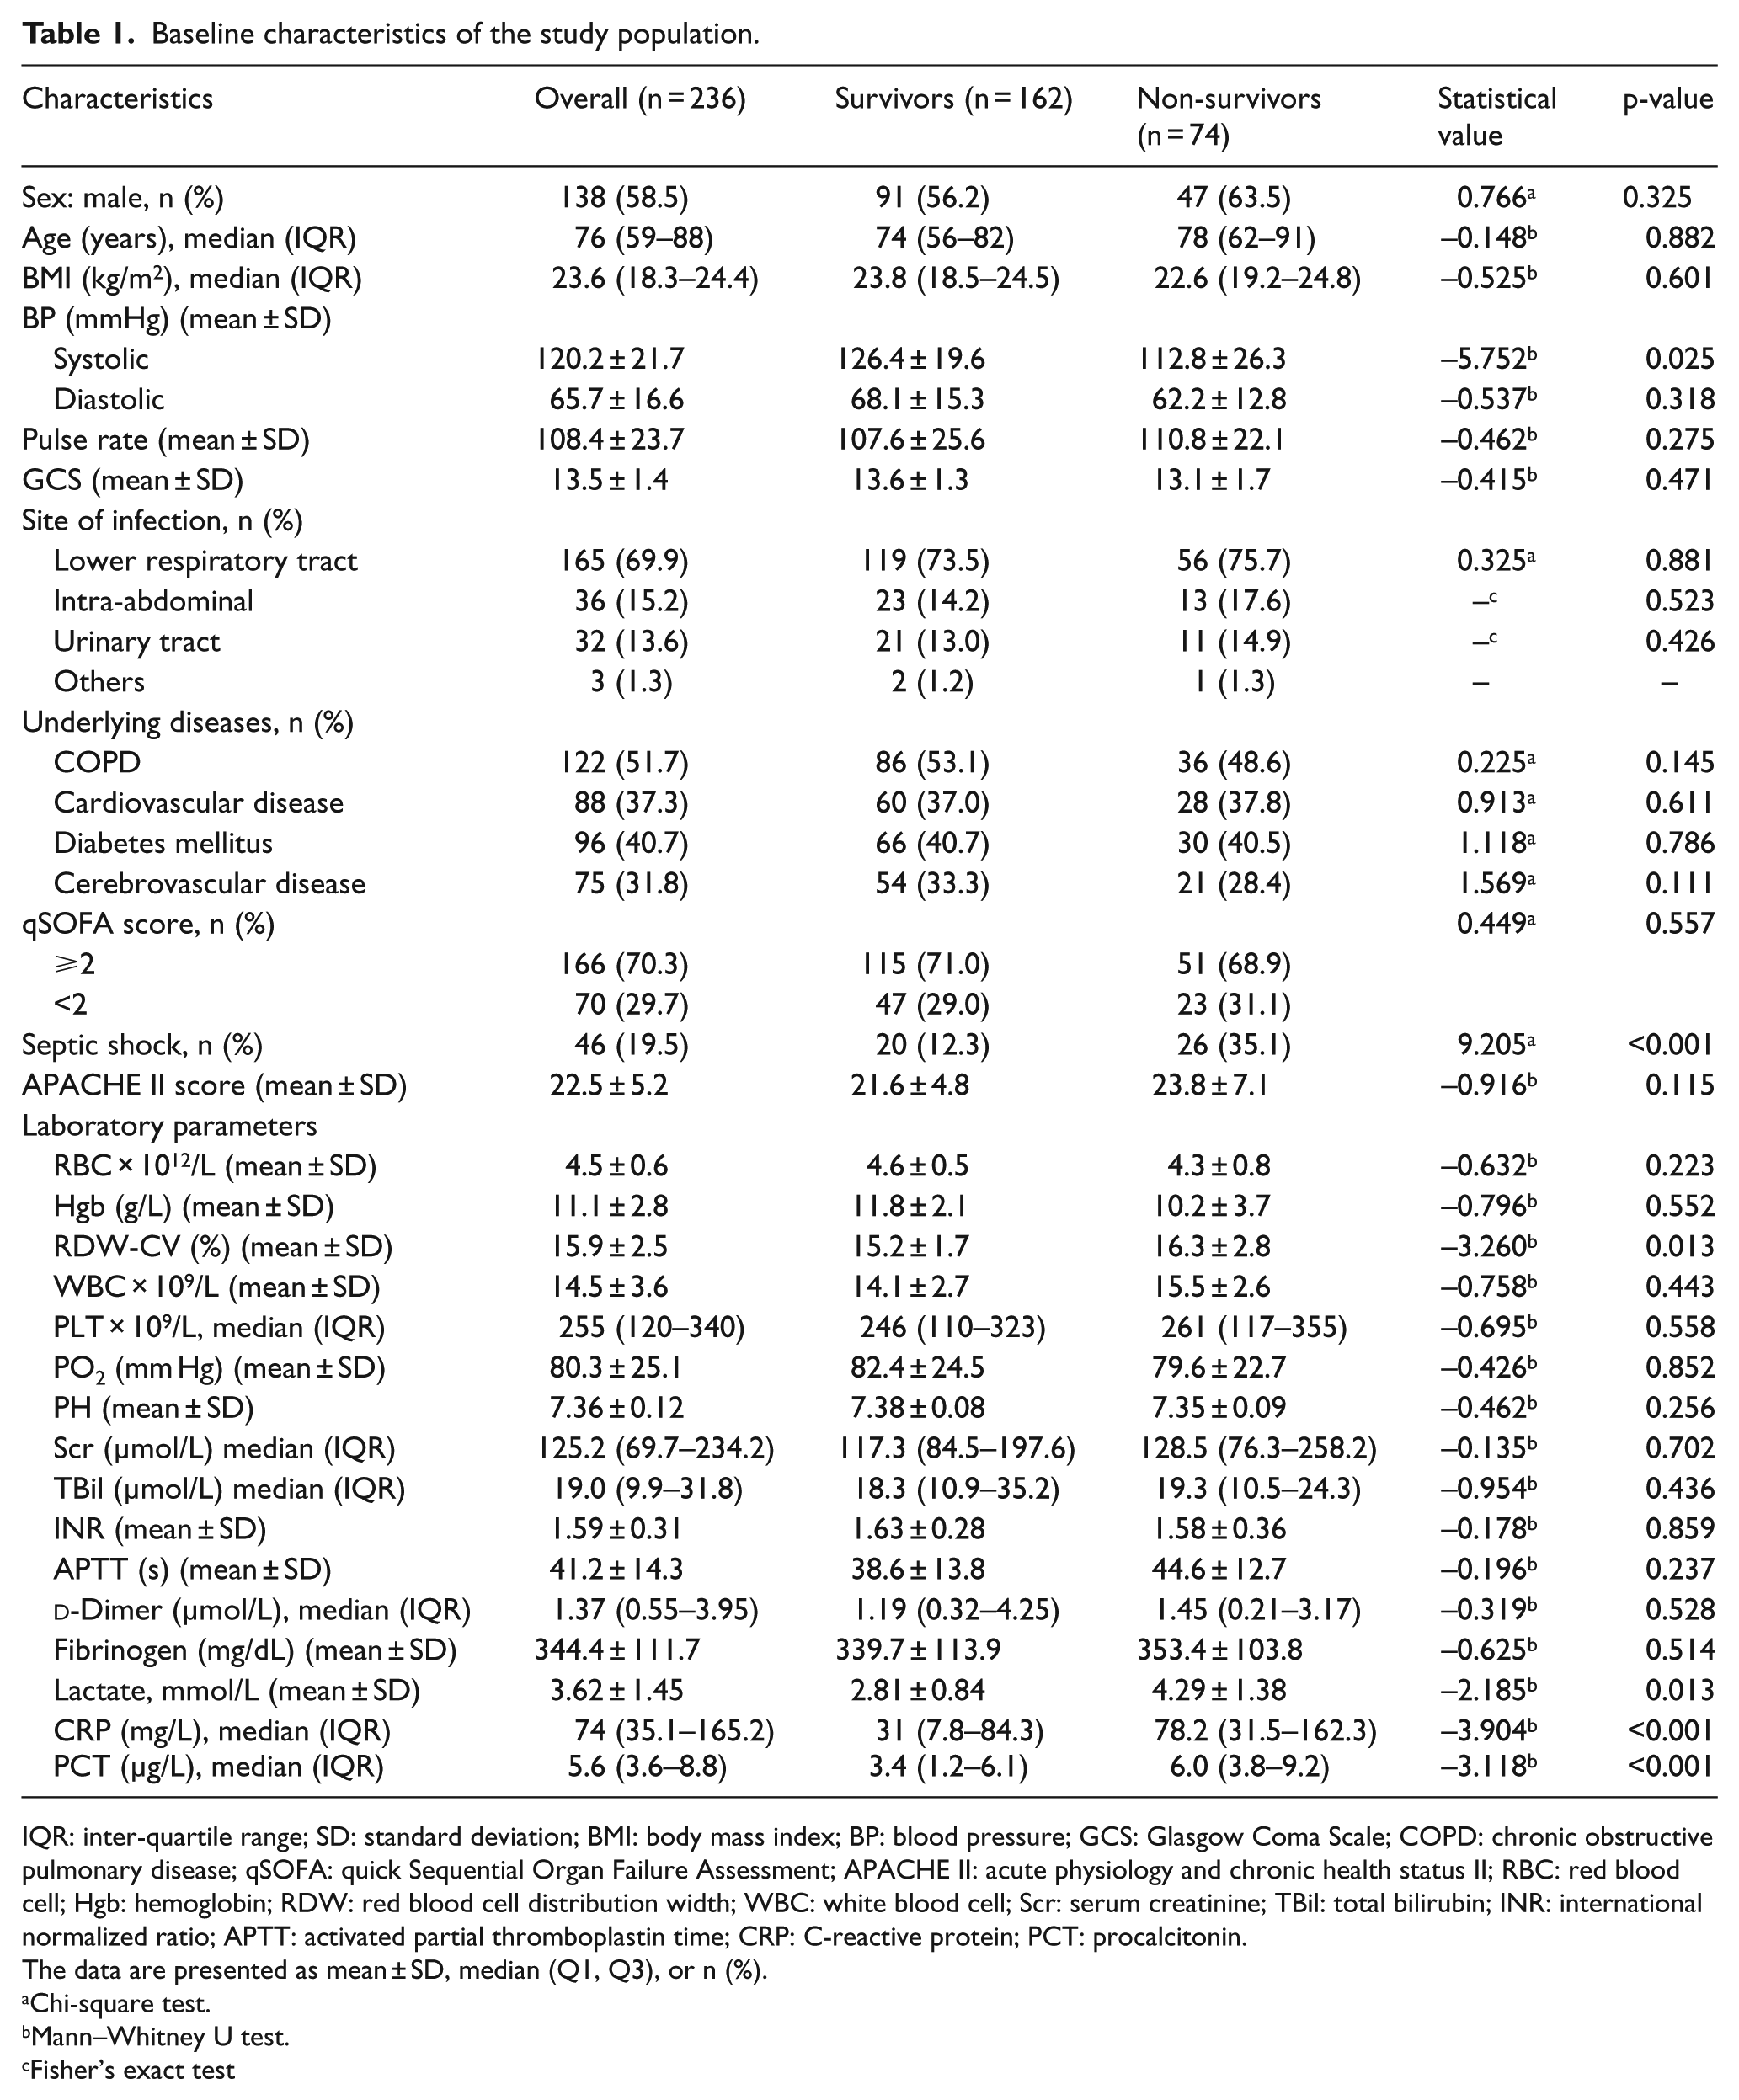
IQR: inter-quartile range; SD: standard deviation; BMI: body mass index; BP: blood pressure; GCS: Glasgow Coma Scale; COPD: chronic obstructive pulmonary disease; qSOFA: quick Sequential Organ Failure Assessment; APACHE II: acute physiology and chronic health status II; RBC: red blood cell; Hgb: hemoglobin; RDW: red blood cell distribution width; WBC: white blood cell; Scr: serum creatinine; TBil: total bilirubin; INR: international normalized ratio; APTT: activated partial thromboplastin time; CRP: C-reactive protein; PCT: procalcitonin.
The data are presented as mean ± SD, median (Q1, Q3), or n (%).
Chi-square test.
Mann–Whitney U test.
Fisher’s exact test
Analysis of relevant variables using Cox regression
Diagnosis of septic shock, higher RDW, lactate, and PCT levels was closely related to 28-day mortality. Cox regression models identified RDW as an independent factor of 28-day mortality (hazard ratio (HR):1.311, p = 0.018), after adjusting for PCT, lactate, and septic shock (Table 2).
Cox regression analysis of the risk factors for 28-day mortality.
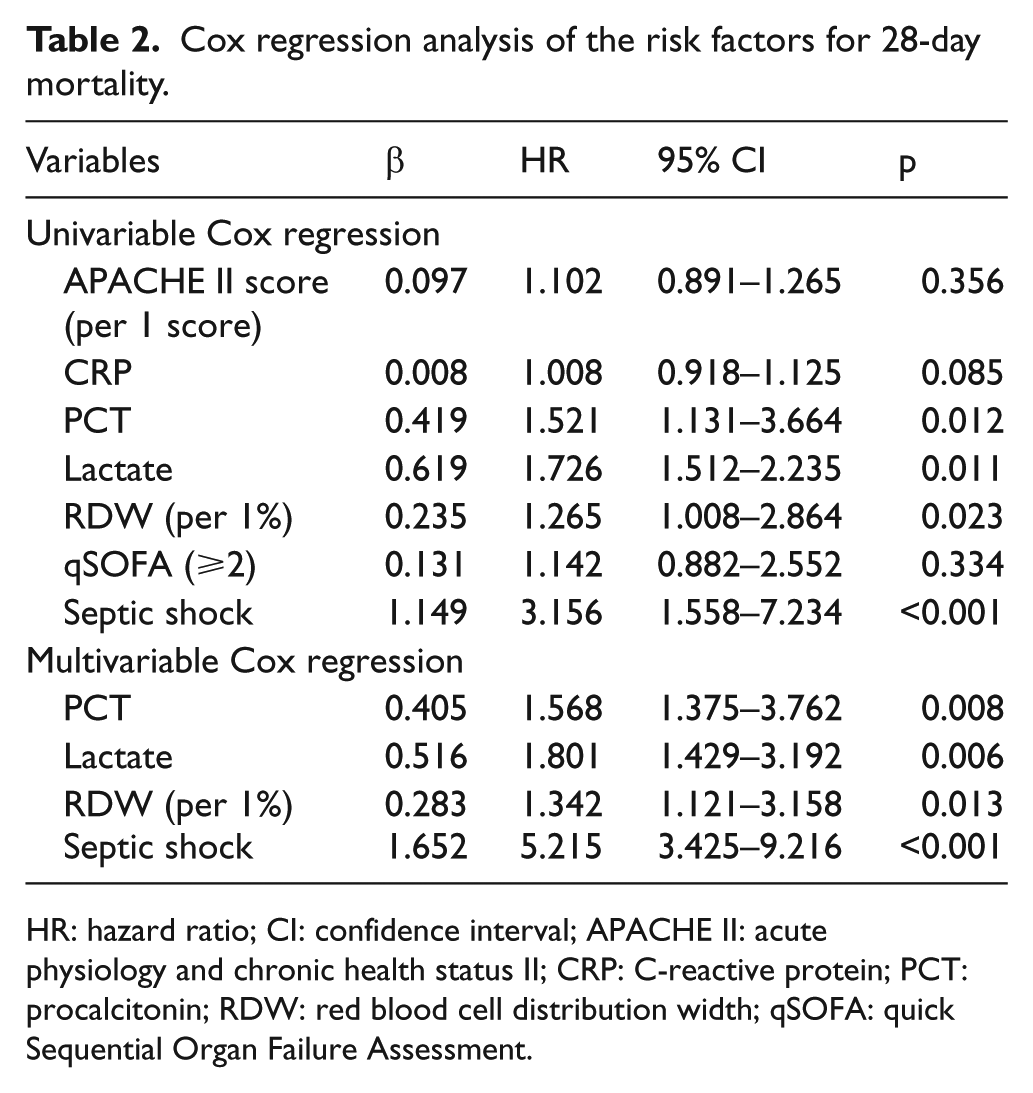
HR: hazard ratio; CI: confidence interval; APACHE II: acute physiology and chronic health status II; CRP: C-reactive protein; PCT: procalcitonin; RDW: red blood cell distribution width; qSOFA: quick Sequential Organ Failure Assessment.
Comparison of PCT and RDW
The ROC curves of 28-day mortality by PCT and RDW are presented in Figure 1. The cutoff value, AUC, positive predictive value (PPV), negative predictive value (NPV), specificity, and sensitivity are shown in Table 3. The cutoff value of RDW calculated by MedCalc software was 16.1% (Table 3). The AUC of qSOFA was 0.53, which indicated that qSOFA’s prediction of 28-day mortality is not satisfactory. The AUC of PCT was comparable to that of RDW (0.768 vs 0.727) (p = 0.473, Z = 0.717).
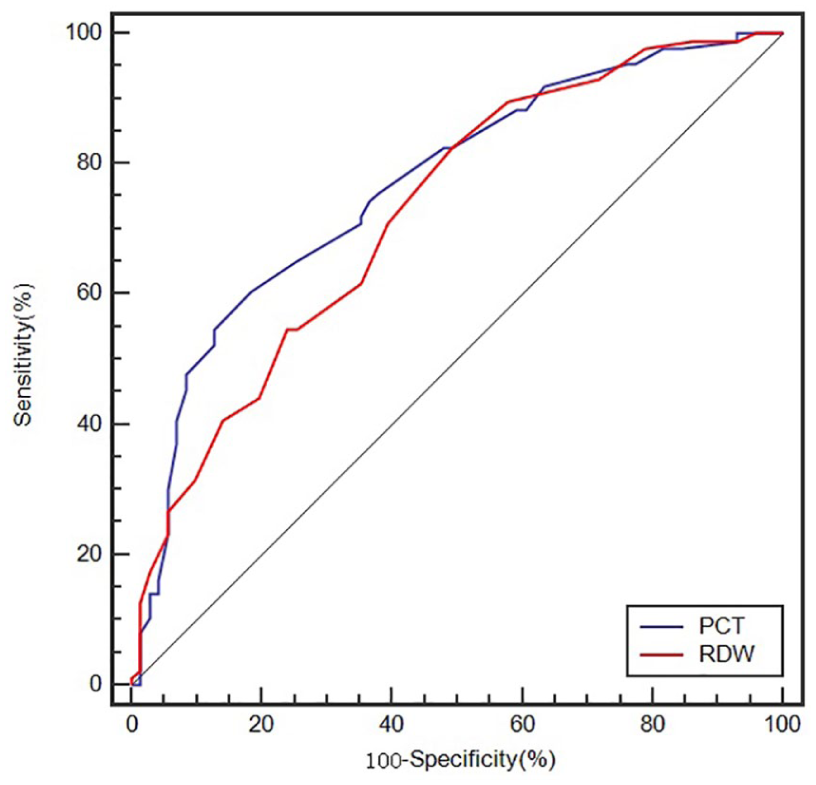
ROC curves of RDW and PCT for 28-day mortality.
Statistical data of ROC curve among PCT, RDW, and qSOFA in predicting 28-day mortality.
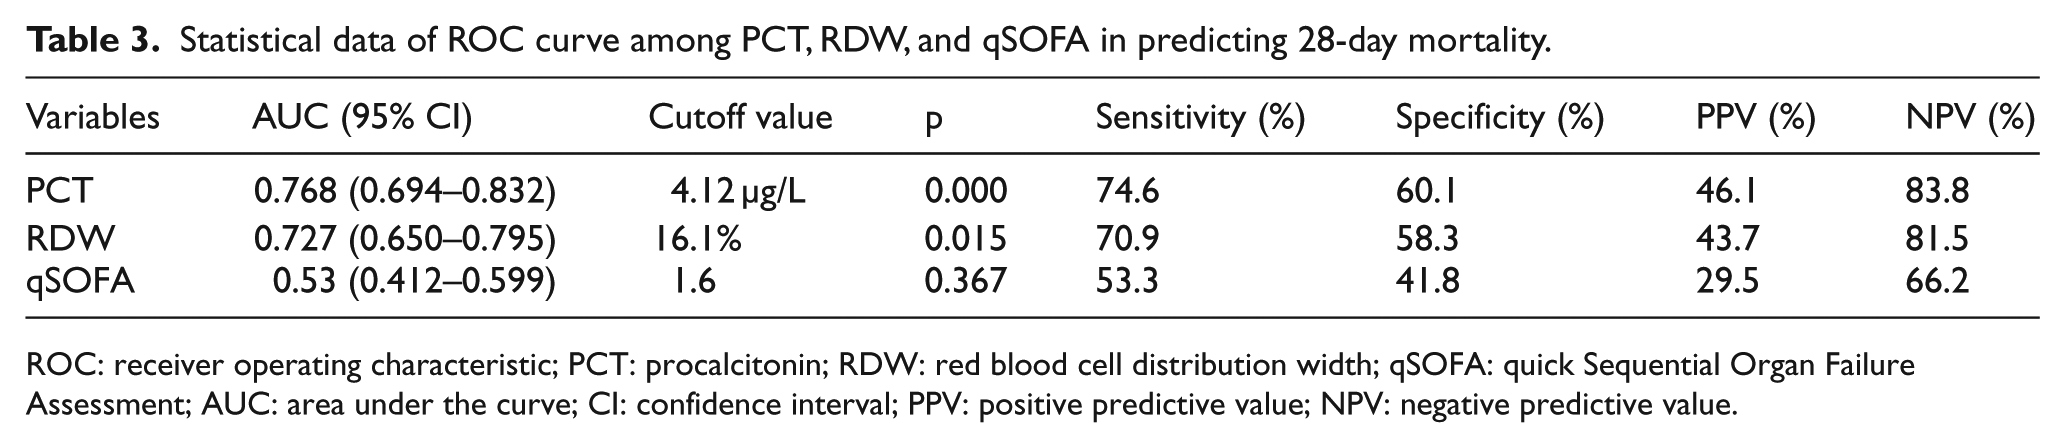
ROC: receiver operating characteristic; PCT: procalcitonin; RDW: red blood cell distribution width; qSOFA: quick Sequential Organ Failure Assessment; AUC: area under the curve; CI: confidence interval; PPV: positive predictive value; NPV: negative predictive value.
Kaplan–Meier survival curve analysis
Using the cutoff value determined by the ROC curve, Kaplan–Meier survival curves of RDW were established. The K–M analysis indicated that patients with RDW < 16.1% had a better chance of 28-day survival than those with RDW ⩾ 16.1% (log-rank = 7.398, p = 0.007) as shown in Figure 2.
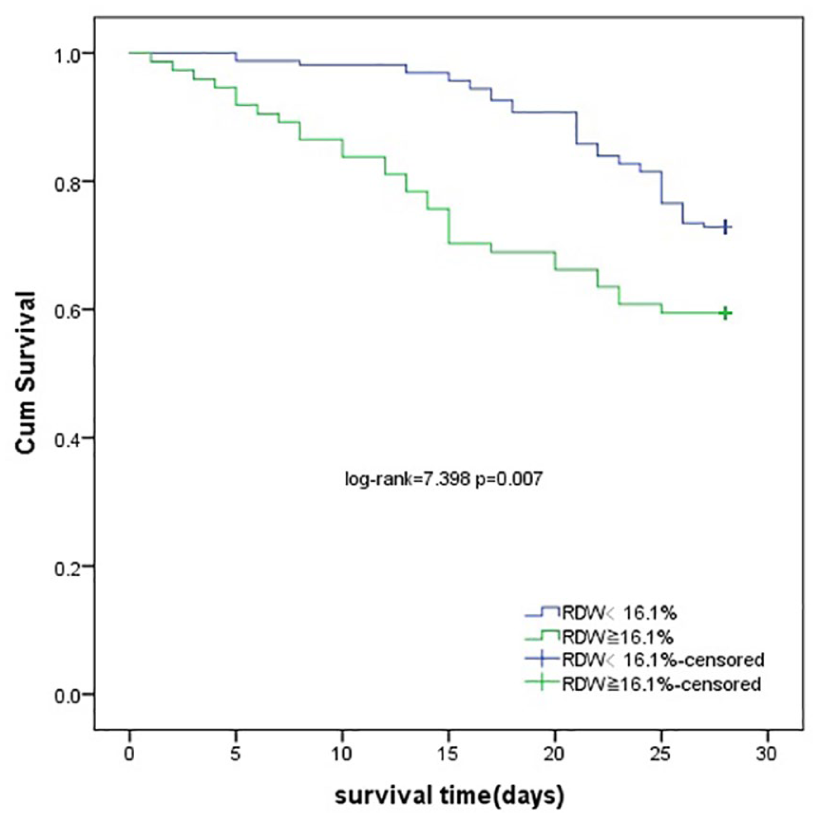
Survival curves by different RDW levels.
Subgroup analysis
Of the 236 patients, 46 patients were diagnosed with septic shock. The RDW level in the septic shock group was much higher than in the sepsis group (16.59% ± 1.16% vs 15.21% ± 0.96%, p < 0.001). For patients with septic shock, survivors tended to have lower RDW levels than non-survivors (16.32% ± 1.02% vs 16.80% ± 1.23%, p = 0.162). For patients with sepsis, survivors had significantly lower RDW levels than non-survivors (15.01% ± 0.89% vs 15.82% ± 0.93%, p < 0.001).
As shown in Figure 3, Cox regression models were applied in subgroup analyses. Multivariate Cox regression indicated RDW as an independent risk factor of 28-day mortality for patients with sepsis (HR: 1.403, 95% confidence interval (CI): 1.226–3.586, p = 0.009) after adjusting for PCT, but not for those with septic shock (HR: 1.025, 95% CI: 0.951–1.132, p = 0.622).
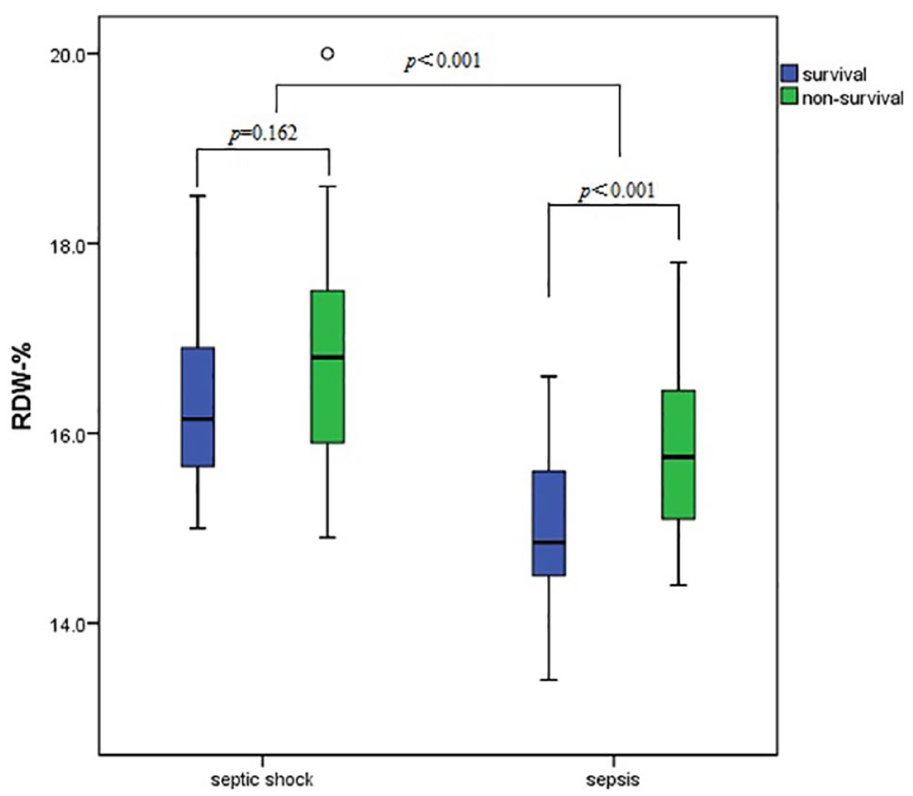
Correlation of RDW levels with 28-day mortality by subgroups.
Discussion
Sepsis is an important cause of death with rapid progression and a high mortality rate in critically ill patients. Therefore, timely and accurate evaluation of the patient’s condition is beneficial to improve prognosis and reduce mortality. 20 In this study, the enrollment criteria of patients with sepsis were consistent with the Third International Consensus, 19 and the treatment procedures were according to the 2016 international guidelines for the management of sepsis and septic shock. 21 In this study, the patients with a qSOFA ⩾ 2 had a comparable 28-day mortality rate to those with a qSOFA < 2. Thus, qSOFA score may not be ideal to predict 28-day mortality, as reported by Wang et al., 22 which challenged the guideline using qSOFA as a poor outcome index.
CRP and PCT are widely used to detect infection in clinical practice. 23 , 24 Increased levels of PCT, CRP, and RDW were associated with clinical outcome of sepsis/septic shock in our research. RDW and PCT levels were independent predictors of 28-day mortality. The predictive ability of RDW was similar to PCT. Zhao et al. 25 suggested PCT but not CRP as an independent predictor of 28-day mortality.
Recent studies have shown that an increased level of RDW may reflect the severity of systemic inflammatory response. 13 We also found in the literature that interleukin-6, CRP, TNF-α, and other inflammatory markers were significantly increased in patients with sepsis. 26 A possible mechanism is that inflammatory response affects the production of red blood cells through hyposecretion and/or increased destruction of erythropoietin, reduction of iron bioavailability, and increase in erythrocyte apoptosis. 15 In addition, oxidative stress, renal insufficiency, and malnutrition can also lead to increased RDW. 27 Taken together, we found that increased RDW might indicate that patients with sepsis had severe inflammatory response.
In this study, the RDW level in patients with septic shock was much higher than those with sepsis, which indicated that the RDW level increased with disease progression. For patients with sepsis, the RDW level was much higher in non-survivors. So, RDW might help discriminate 28-day mortality and assess the prognosis of sepsis as a commonly applied laboratory test.
This study has several limitations. First, the RDW, PCT, and CRP were chosen due to wide application and lower cost. Blood samples were taken when the patient first visited the ER–rescue room; however, the samples might not be taken at the same time for each patient. Second, the levels of folate, iron, and vitamin B12, which may have significant influence on the RDW level, were not tested in this study. Third, the number of cases included in our single-center study was relatively small, especially for patients with septic shock.
Conclusion
The results of this study support that RDW may be used to evaluate the prognosis of patients with sepsis and septic shock. In the sepsis group, higher RDW levels predict poor prognosis.
Footnotes
Acknowledgements
We hereby confirm that (1) the manuscript is original, (2) all the authors were active participants, (3) we wish to submit the manuscript for publication in Hong Kong Journal of Emergency Medicine, and (4) the manuscript is not currently under consideration for publication in another journal.
Declaration of conflicting interests
The author(s) declared no potential conflicts of interest with respect to the research, authorship, and/or publication of this article.
Funding
The author(s) received no financial support for the research, authorship, and/or publication of this article.
Availability of data and materials
If necessary, please contact
Informed consent and ethical approval:
The study was approved by the ethics committee of Beijing Chao-yang hospital, and each patient or family member included in this study signed an informed consent.