
Abstract
Background:
Generally, in traumatic patients, uncontrolled bleeding leads to shock and ultimately death. So, any early detection of shock can reduce the likelihood of a patient’s death. At present, the precise method for estimating the body’s need for fluids is to measure central venous pressure (CVP). However, this method is invasive and time consuming.
Objective:
This study aimed to predict the central venous pressure value and range of trauma patients through non-invasive parameters such as caval index, lactate clearance, base excess and shock index.
Methods:
A prospective observational study was performed in 100 trauma patients. Written informed consent was obtained from patient(s) or relatives for their anonymized information to be published in any article.
Results:
It indicated that parameters such as caval index (at a proposed cutoff point of 35%), lactate clearance (at a cutoff point of 6%) and base excess (at a proposed cutoff point of 6 mmol/L) are approximately of the same level of accuracy for estimating the central venous pressure range, while parameter shock index (at a cutoff point of 1.25) is of the least level of accuracy to predict the central venous pressure range. Results also showed that among all proposed predictive models for estimating the central venous pressure value, which were on the basis of either non-linear regression or artificial neural network, the most accurate model was the one on the basis of the artificial neural network. Among parameters lactate clearance, base excess and shock index used to form the artificial neural network-based model, parameters base excess and lactate clearance were of the highest and lowest level of importance, respectively.
Conclusion:
Among all proposed models and non-invasive parameters to predict the central venous pressure range, CVPLC model (at a cutoff point of 9), which is a non-linear regression model and is in terms of parameter lactate clearance, was the most accurate model.
Keywords
Introduction
Generally, in traumatic patients, uncontrolled bleeding leads to shock and ultimately death. Traumatic deaths usually occur within the first 6 h and can often be prevented. So, any early detection of shock can reduce the likelihood of a patient’s death. In an emergency department (ED), physical examination and vital signs are not enough for detecting potential shock. 1 At present, the precise method for estimating the body’s need for fluids is to measure central venous pressure (CVP) by inserting a catheter in the upper vena cava through the internal jugular vein or subclavian. New research studies have shown the efficiency of this method to determine vascular volume and response to resuscitation.2,3 However, this method is invasive and time-consuming. 2 Furthermore, this method has several side effects (e.g. vascular rupture) 2 and restrictions (e.g. need for having experienced staffs).4,5
So far, four non-invasive parameters have been proposed by previous researchers to estimate the CVP range indirectly. The parameters are caval index (CI),6–8 base excess (BE), 9 lactate clearance (LC)10–13 and shock index (SI). 14 CI represents the change in the diameter of the inferior vena cava (IVC) during a respiratory cycle, measured by ultrasound once at the inspiration end and again at the expiration end. The value of this index is between 0% and 100%, and a value higher than 50% means that the patient’s intravascular fluid deficit is high. 15 In the study of Brennan et al., 16 which was performed on patients with stable hemodynamic conditions, a CI of 40% was found to be equivalent to a CVP of 10 mmHg. Although there is still no accepted cutoff for this issue, SI is defined as the ratio of the number of heart rates (HRs) to the systolic blood pressure (SBP), and its normal value is between 0.5 and 0.7. 14 Increase in SI is associated with progressive bleeding, and an SI of more than 1 is a high shock and mortality indicator.17,18 Birkhahn et al. 19 believed that the SI parameter is far more beneficial than the HR or blood pressure changes to predict the shock. LC is determined from ABG according to the initial lactate and secondary lactate (2 h after resuscitation). If the lactate level is not reduced by 10%–20% 2 h after resuscitation, more attention is needed to improve systemic perfusion, and fluid therapy should continue until the level of lactate reaches below 2 mmol/L.20–22
As mentioned in the previous paragraphs, determination of the invasive parameter CVP in shock patients is a challenging task. However, so far, numerous studies have been carried out to find out a non-invasive parameter as a representative of the CVP range, but the level of accuracy of such parameters is still unclear. Furthermore, it seems that a reliable equation in terms of each non-invasive parameter or their combinations to estimate the CVP value is missing. Hence, to diminish such lack of information, the research program reported herein was undertaken. For this purpose, for 100 trauma patients, who were all reported to utilize central venous catheter, ultrasonography and required laboratory test were conducted and the values of parameters CVP, CI, LC, BE and SI were calculated. Using these data, as the first step, the correlation between the invasive parameter CVP and non-invasive parameters CI, LC, BE and SI was calculated. Then, the level of accuracy of these parameters at their available cutoff points (COPs) was investigated through sensitivity, specificity, accuracy values and fragility curves. In the second step, in order to enhance the accuracy of non-invasive parameters to predict the CVP range, a new COP for each non-invasive parameter was proposed and their reliabilities were further investigated through fragility curves. In the third step, using non-linear regression analyses and artificial neural network (ANN), non-linear models to predict the CVP value were proposed. Then using these models, appropriate COPs for each non-linear model to predict the CVP range were proposed and reevaluated using fragility curves. At the end, the most accurate model for predicting the CVP value and range was proposed.
Methods
The current research is a prospective observational study and was conducted at Bahonar Academic Hospital, level II trauma center, in southeastern Iran at the end of 2017. This study was approved by the ethics committee of Kerman University of Medical Sciences with the ethic code number of IR.KMU.REC.1393.587. To conduct this study, written informed consent was obtained from all patients or their relatives for participating in the study. The population of the study included 100 patients, all of whom were admitted to the ED. All these patients have three common features: (a) over the age of 18 years, (b) being alert (Glasgow Coma Scale [GCS] = 15) and (c) being at stages 1 and 2 of the hemorrhagic shock based on the American College of Surgeons classification, and following the Advanced Trauma Life Support (ATLS) and Basic Life Support (BLS) principles of the surgical service, they have indications of central venous catheter and intravenous fluid resuscitation. It should be noted that patients with history of renal failure, chronic heart failure, cor pulmonale, portal hypertension, pregnancy and those who received antihypertensive or inotrope drugs were excluded from this study. In addition, using ultrasonography, patients with a possible diagnosis of tamponade, pneumothorax or hemothorax and other shocks except the hemorrhagic shock were excluded.
After obtaining consent from the patients or their family members, the CVP, CI, SI, LC and BE values were calculated for each patient, and the sonography was performed by a well-trained physician and recorded in the checklist for each patient. CVP which was considered as the best indicator was determined by inserting a catheter in the superior vena cava through the internal jugular vein or subclavian. In order to calculate the CI value, the IVC diameter at the inspiration
Results
Hereafter for simplicity, the non-invasive parameters CI, LC, BE and SI are denoted as parameters Type (I). All analyses were carried out using Excel and MATLAB programs. Table 1 summarizes the values of mean (µ) and standard deviation (SD, σ) for all investigated parameters. As mentioned in section “Methods,” based on the classification of the American College of Surgeons, all patients under study were at stages 1 and 2 of the hemorrhagic shock, and following the ATLS and BLS principles of the surgical service, they had indications of central venous catheter and intravenous fluid resuscitation. Results indicated that for such patients the value of CVP is not a constant value and varies between 3 and 14 cmH2O such that the mean and SD values of this parameter are 8.9 and 3.4, respectively. In other words, parameter CVP is a random variable. Using normal probability paper, it was found that the distribution function of this parameter is normal. Figure 1 shows the cumulative distribution function (CDF) of parameter CVP. As this figure indicates that the probability of having a CVP value equal to or less than 8 is only 40%, the estimation of the CVP range only on the basis of the values of parameters HR and SBP and surgery visit can be significantly inaccurate and risky. This also indicates why previous research suggested the use of other additional parameters to predict the CVP range.
Mean (µ) and standard deviation (σ) values of all investigated parameters.
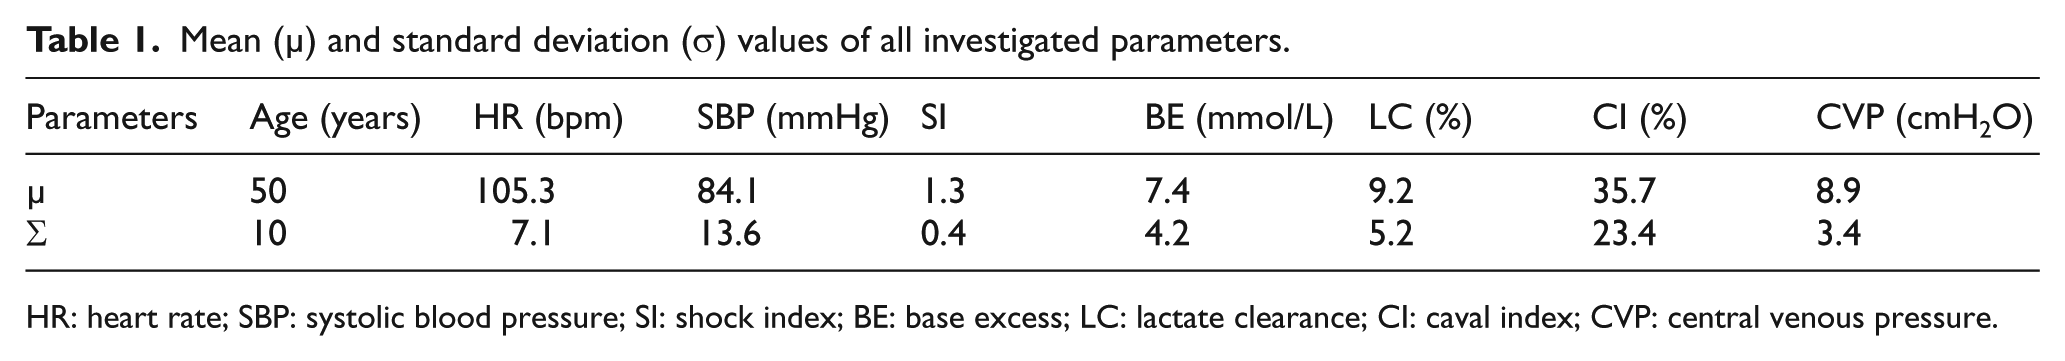
HR: heart rate; SBP: systolic blood pressure; SI: shock index; BE: base excess; LC: lactate clearance; CI: caval index; CVP: central venous pressure.
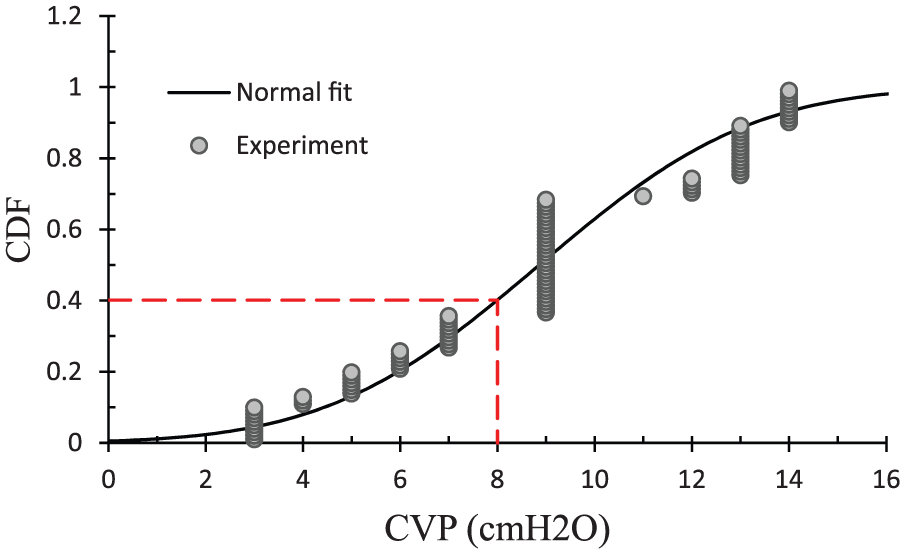
Fragility curve (CDF function) of parameter CVP.
Figure 2 shows the correlation between the invasive parameter CVP and all Type (I) non-invasive parameters. As this figure indicates that there is a strong correlation between the invasive parameter CVP and all the non-invasive parameters CI, LC, BE and SI, the coefficients of correlation R2 and Pearson (R2, Pearson) for these parameters are (0.499, –0.706), (0.628, –0.792), (0.73, –0.854) and (0.409, –0.639), respectively. With respect to these results, it can be concluded that parameter CVP has the highest and the lowest dependency to parameters BE and SI, respectively. However, the dispersion between parameters CVP and BE indicates that despite having a strong correlation between these two parameters, parameter BE is not the only parameter that affects the CVP value but also other parameters can more or less affect it.
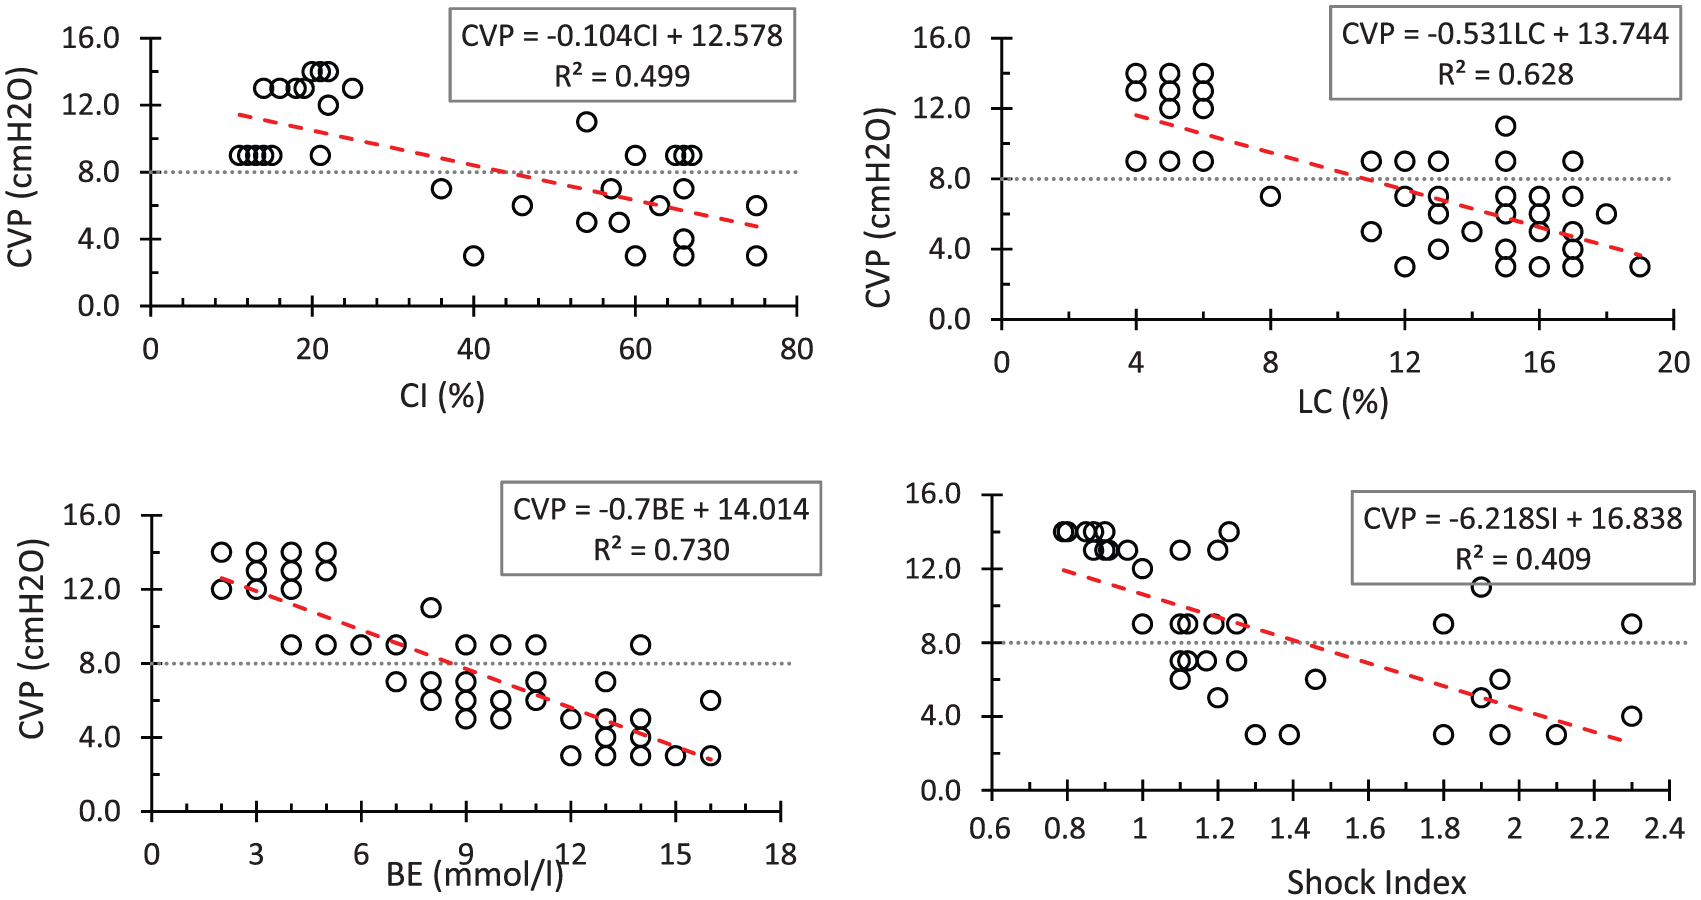
Variation in parameter CVP in terms of non-invasive parameters Type (I).
Furthermore, in this study, in order to have a better realization of results, all studied patients (100 patients) were divided into two main groups. Here, 36 and 64 patients were located in the high-risk group (CVP ≤ 8 cmH2O) and the low-risk group (CVP > 8 cmH2O), respectively. This classification was inspired by the study by Marx et al. 23 where for CVP ≤ 8 cmH2O, the patient is in a high-risk condition, while for other range of the CVP parameter, the patient can be considered to be in a more stable condition. (In the study by Magder and Bafaqeeh, 24 however, this limit was considered as 10 cmH2O.)
Table 2 summarizes the values of mean (µ) and SD (σ) for all investigated parameters in terms of two risk groups. From the parameter age point of view, there was no significant difference between two risk groups, while it was not the case from the vital sign parameters (i.e. parameters HR and SBP) point of view. The mean value of parameter HR in the high-risk group was significantly higher than that in the low-risk group, while the mean value of parameter SBP in the high-risk group was significantly lower than that in the low-risk group. In addition, the values of non-invasive parameters CI, LC, BE and SI in the high-risk group were significantly large when compared to those of the low-risk group.
Mean (µ) and standard deviation (σ) values of all investigated parameters in terms of two risk groups.
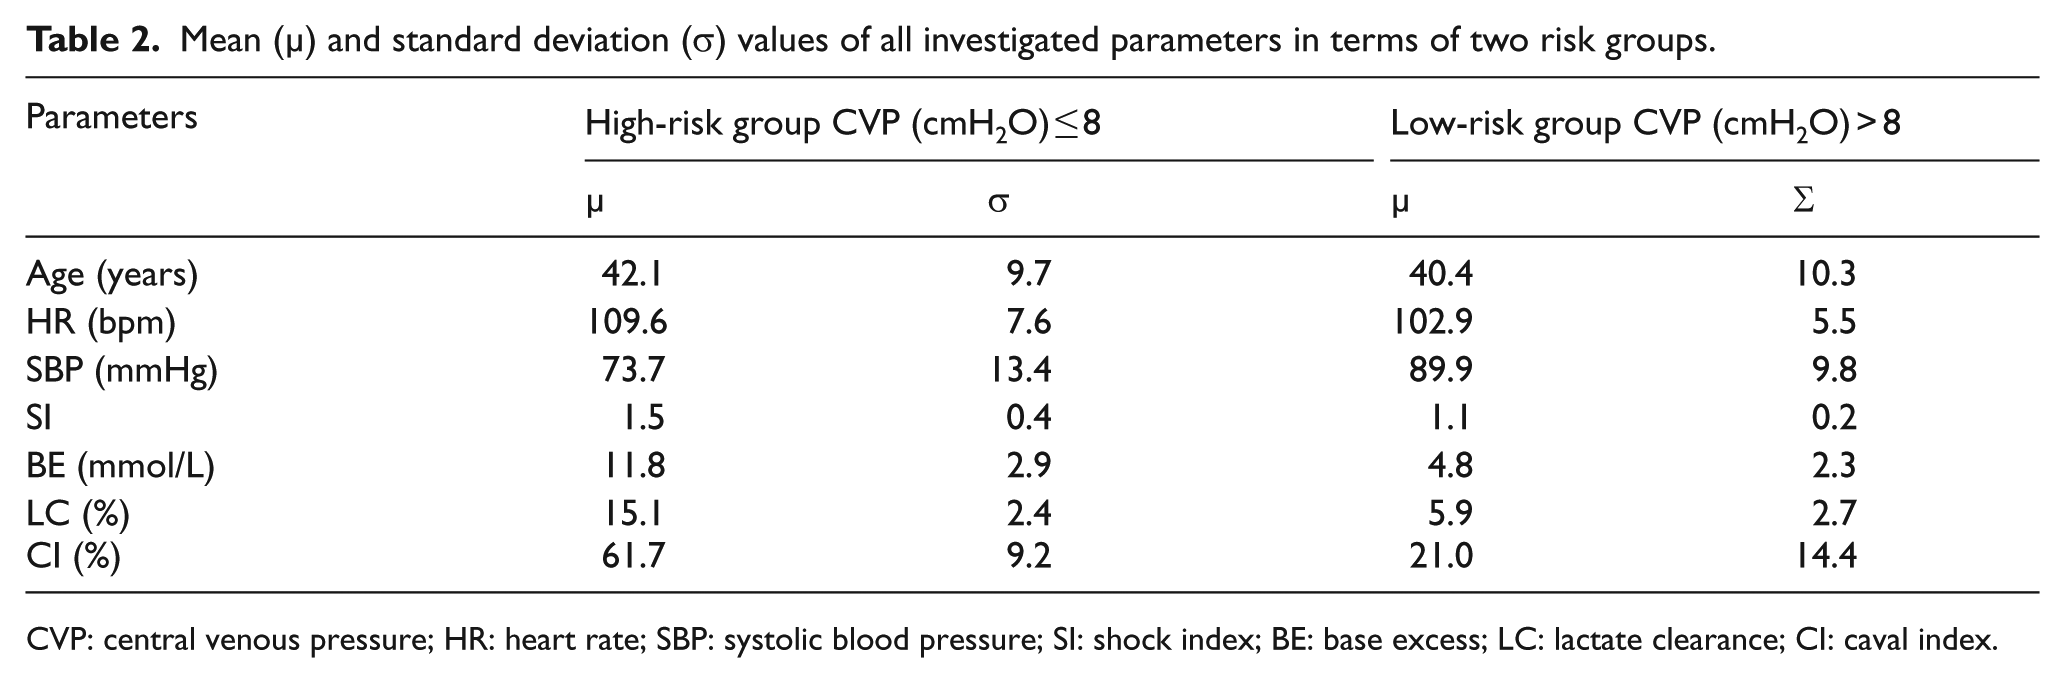
CVP: central venous pressure; HR: heart rate; SBP: systolic blood pressure; SI: shock index; BE: base excess; LC: lactate clearance; CI: caval index.
Discussion
Methods for predicting the CVP range
As mentioned earlier, at present, the most accurate method for estimating the body’s need for fluids in a traumatic patient is through determination of the CVP range. However, this method is invasive and has several side effects. For this reason, in this section, the capability of non-invasive parameters Type (I), parameters CI, LC, BE and SI, for predicting the CVP range is investigated.
One way to recognize the ability of a proposed parameter and its possible risks in comparison to an existing prequalified parameter (i.e. gold standard) is calculating the values of parameters sensitivity, specificity, accuracy, positive predictive value (PPV) and negative predictive value (NPV) of the proposed parameter at its predefined COP. In the studies carried out by previous researchers, the ranges of CI ≤ 20%, 25 CI ≤ 15%, 26 LC ≤ 6%,20–22 SI ≤ 114,17,18,19 and BE ≤ 4 mmol/L 9 were considered to be a representative of a high value of the CVP (i.e. CVP > 8), while the ranges of CI > 50%,15,27 LC > 6%,20–22 SI > 114,17,18,19 and BE > 4 mmol/L 9 were introduced to be equivalent to a low value of the CVP (i.e. CVP ≤ 8). The values of parameters sensitivity, specificity, accuracy, PPV and NPV corresponding to all non-invasive parameters CI, LC, BE and SI at their relevant COPs are summarized in Table 3. The results of this table indicate, at the specified COPs, among four parameters CI, LC, BE and SI, that the highest and lowest levels of accuracy corresponded to parameters LC (94% at COP of 6%) and SI (52% at COP of 1), respectively.
Results of statistical analysis corresponding to non-invasive parameters CI, LC, BE and SI at two different risk groups.
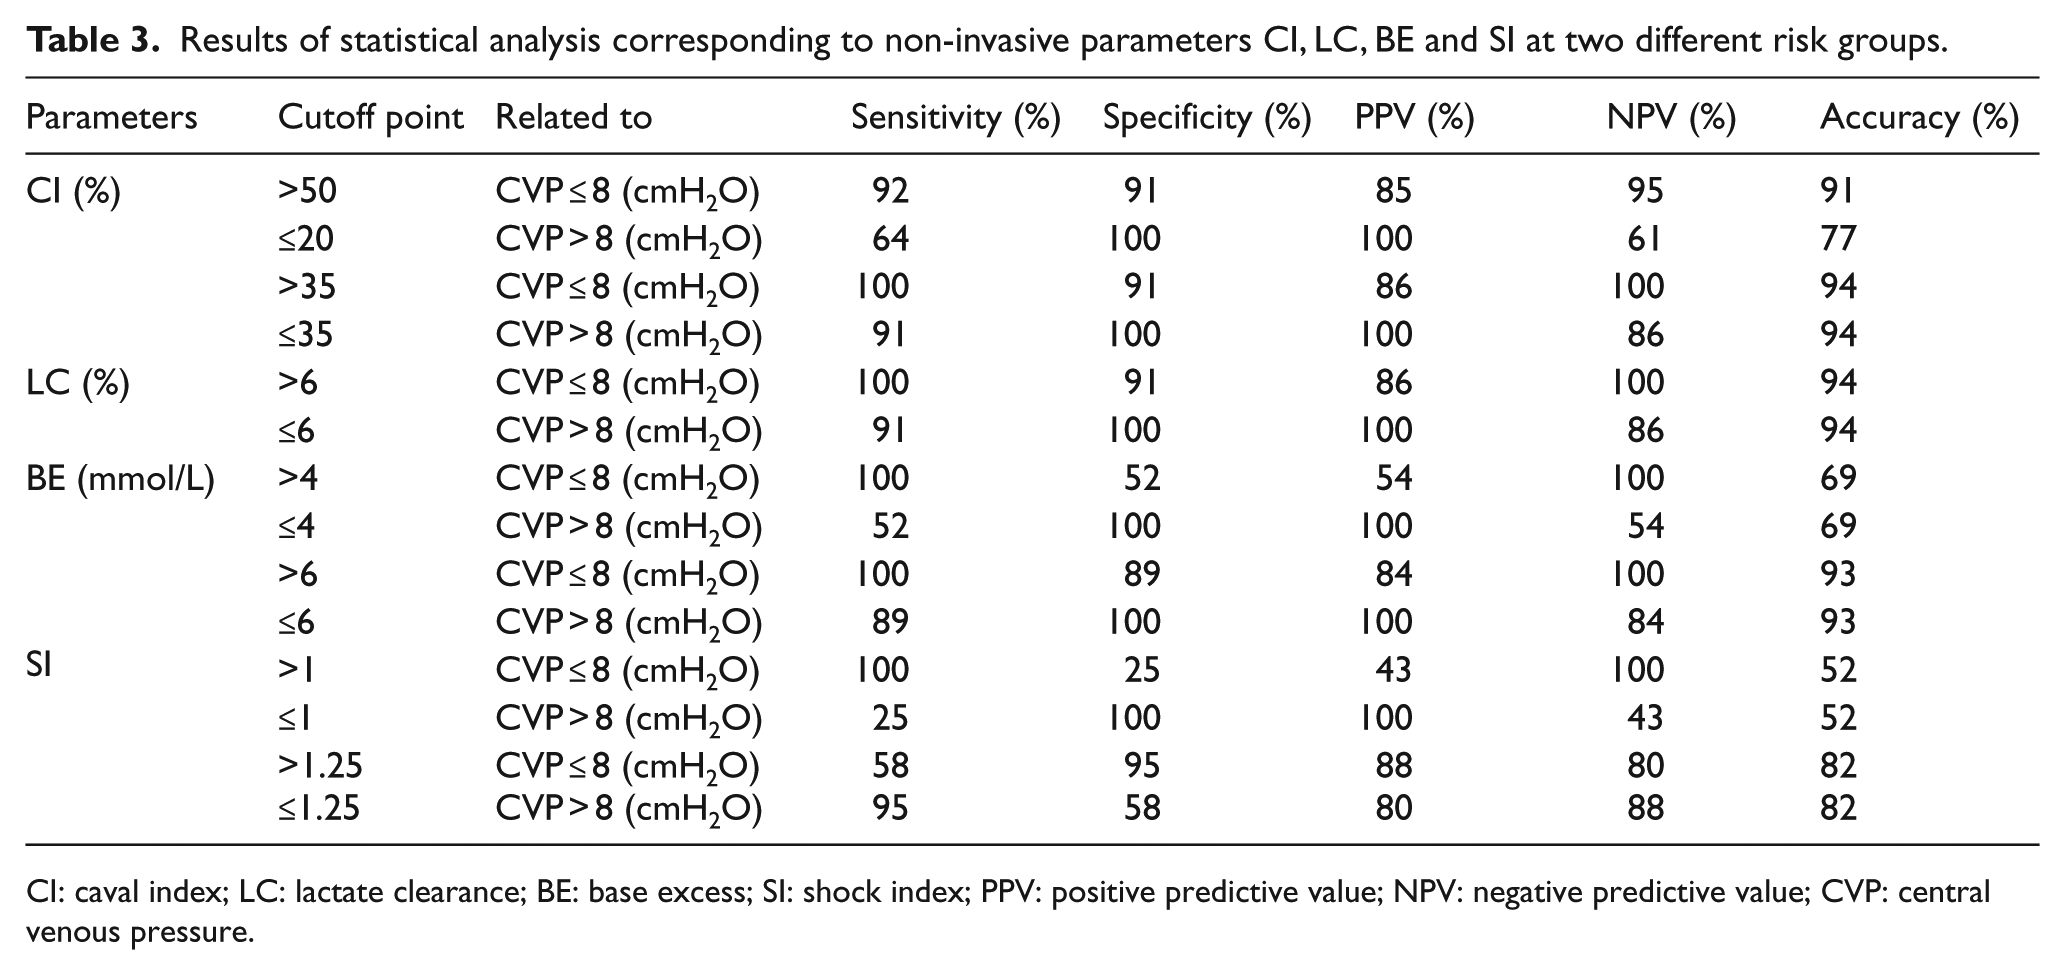
CI: caval index; LC: lactate clearance; BE: base excess; SI: shock index; PPV: positive predictive value; NPV: negative predictive value; CVP: central venous pressure.
In this study, using the obtained test results, new COPs corresponding to all parameters of Type (I) are proposed to enhance the level of accuracy of these parameters for estimating the CVP range. With respect to these results, it seems that for both risk groups (i.e. CVP ≤ 8 and CVP > 8), the best COPs corresponding to the parameters CI, BE and SI are 35%, 6 mmol/L and 1.25, respectively, because, in comparison to the previous COPs, at the proposed COPs the values of parameters accuracy, PPV and NPV have increased. However, this efficiency was not the same for these three parameters. Proposed COPs had the highest and the lowest impact on parameters SI and CI, respectively, such that the level of accuracy increased 68% for parameter SI, 3% and 22% for parameter CI at high-risk and low-risk groups, respectively. Also, the results of this study indicated that the best COP for parameter LC is still 6%.
Upon comparing the values of parameters sensitivity, specificity, accuracy, PPV and NPV with those of parameters CI, LC, BE and SI at previous and proposed COPs, it seems that to predict the CVP range, parameters CI (at COP of 35%) and LC (at COP of 6%) are equally of the highest level of accuracy and after those parameters BE (at COP of 6 mmol/L) and SI (at COP of 1.25) are in the next levels of accuracy, respectively.
In this study, the reliability of non-invasive parameters Type (I) at previous and proposed COPs for predicting the CVP range is more accurately assessed through fragility curves. Figure 3(a), (c), (e) and (g) shows the fragility curves of random variables CI, LC, BE and SI for both high-risk (CVP ≤ 8) and low-risk (CVP > 8) groups, respectively. All these curves were drawn by assuming that the distribution function of all random variables is Lognormal.
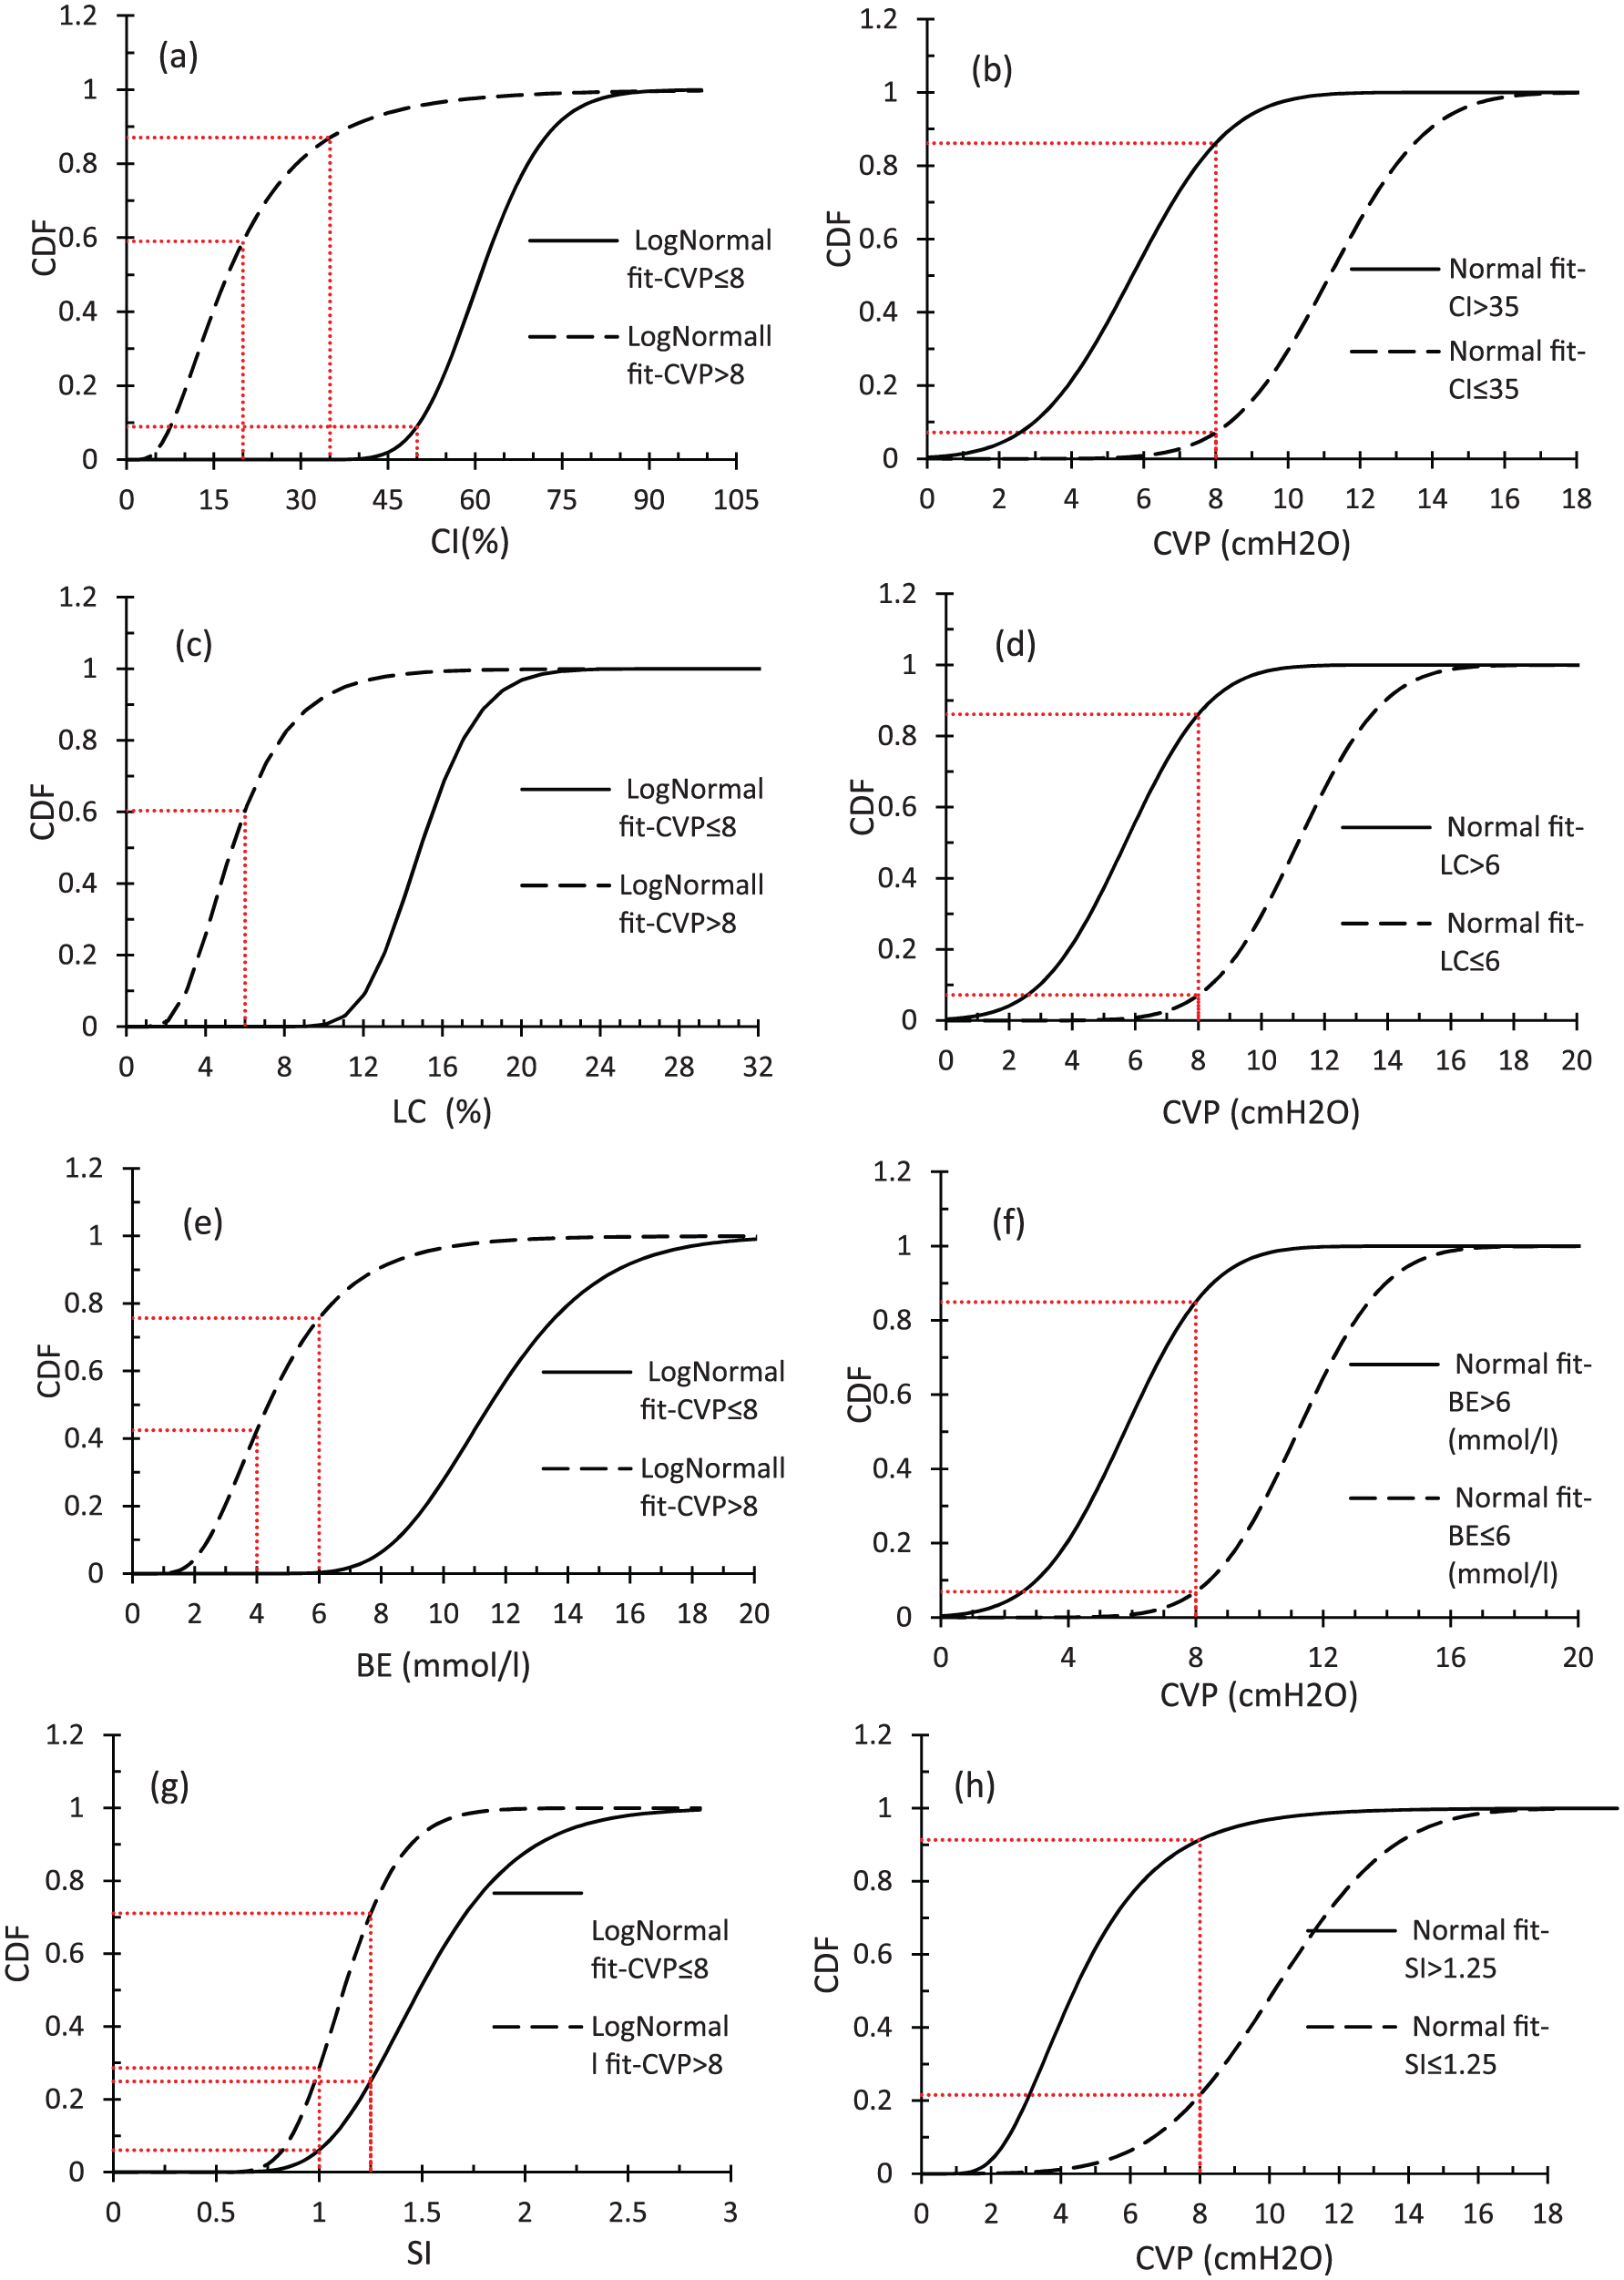
Fragility curves corresponding to parameters: (a) CI for two risk groups, (b) CVP for different ranges of parameter CI, (c) LC for two risk groups, (d) CVP for different ranges of parameter LC, (e) BE for two risk groups, (f) CVP for different ranges of parameter BE, (g) SI for two risk groups and (h) CVP for different ranges of parameter SI.
Figure 3(a) shows that for the high-risk group, the probabilities of having a CI value greater than 50% and 35% are 91.1% and 99.99%, respectively, and in the low-risk group, the probabilities of having a CI value equal to or less than 20% and 35% are 59% and 87%, respectively. These results clearly indicate that in comparison to the previous COPs (i.e. 50% and 20%), the proposed COP, 35%, is of higher level of accuracy. Figure 3(b) shows the fragility curves corresponding to the random variable CVP for both high-risk (CI > 35%) and low-risk (CI ≤ 35%) groups. As it can be seen from this figure, in the high-risk group (CI > 35%), the probability of having CVP ≤ 8 is 86%, and in the low-risk group (CI ≤ 35%), there is a 93% of chance for having CVP > 8. Regarding parameter LC, Figure 3(c) shows that for the high-risk and low-risk groups, the probabilities of having LC > 6% and LC ≤ 6% are 99.999% and 60%, respectively. In Figure 3(d), which shows the fragility curves of random variable CVP for both high-risk (LC > 6%) and low-risk (LC ≤ 6%) groups, in the high-risk group, the probability of having CVP ≤ 8 is 86%, and in the low-risk group, there is a chance of 93% for having CVP > 8. Regarding parameter BE, Figure 3(e) shows that for the high-risk group, the probabilities of having a BE value greater than 4 and 6 mmol/L are 99.99% and 99.7%, respectively, and in the low-risk group, the probabilities of having a BE value equal to or less than 4 and 6 mmol/L are 42.5% and 75.7%, respectively. Figure 3(f) shows the fragility curves corresponding to the random variable CVP for both groups. This figure indicates that in the high-risk group (BE > 6 mmol/L), the probability of having CVP ≤ 8 is 85%, and in the low-risk group (BE ≤ 6 mmol/L), there is a 93% of chance for having CVP > 8. Regarding parameter SI, Figure 3(g) shows that for the high-risk group, the probabilities of having an SI value greater than 1.0 and 1.25 are 94% and 75%, respectively, and in the low-risk group, the probabilities of having an SI value equal to or less than 1.0 and 1.25 are 28.7% and 71.1%, respectively. Figure 3(h) shows the fragility curves corresponding to the random variable CVP for both risk groups. This figure indicates that, in the high-risk group (SI > 1.25), the probability of having CVP ≤ 8 is 91%, and in the low-risk group (SI ≤ 1.25), there is a 78.4% of chance for having CVP > 8.
On the basis of the results presented in the previous paragraph, three comments can be remarked as follows: (a) parameters CI, LC and BE, which are approximately of the same level of accuracy, are more reliable than parameter SI to predict the CVP range; (b) in comparison to the previous COPs, the proposed COPs are more reliable and accurate; and (c) since the obtained probability values, even by considering the proposed COPs, are between 78% and 93%, prediction of the CVP range on the basis of direct use of the values of parameters Type (I) is accompanied with a noticeable uncertainty. At the end, it is worth to mention that all discussed methods in this section comparatively are able to predict the CVP range, but they are unable to predict the CVP value. In the next section, methods to estimate the CVP value are discussed.
Methods for predicting the CVP value
In this section, methods for predicting the CVP value are discussed into two subsections. As the simplest but probably not the most accurate method, the CVP value is predicted on the basis of each individual non-invasive parameter (see section “CVP value prediction on the basis of each individual non-invasive parameter”). In section “Development of ANN-based equation for predicting the CVP value,” the CVP value is predicted by a more accurate method through combining all or some of the individual non-invasive parameters. Two well-known methods of this category are least square (LS) and ANN methods. However, compared to the LS method, the method on the basis of the ANN is of much higher level of accuracy and consequently is used in this study.
CVP value prediction on the basis of each individual non-invasive parameter
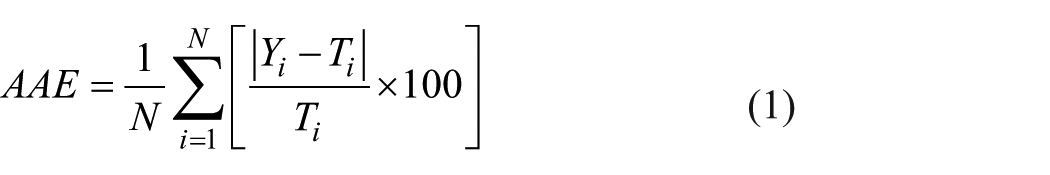
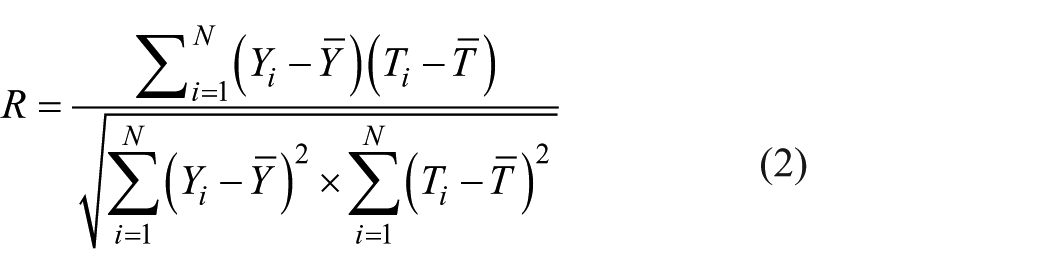
In this section, using the data presented in Figure 2 and curve fitting technique (i.e. non-linear regression), the most accurate model for predicting the CVP value on the basis of each individual non-invasive parameter CI, LC, BE and SI is derived. Three criteria were utilized to assess the performance of each proposed model. These criteria are correlation coefficients (R values), average absolute percentage error (AAE) and maximum absolute percentage error (MAE). The AAE and R were calculated using equations (1) and (2), respectively. In these equations,
Table 4 summarizes the proposed predictive models along with their performance measures using the curve fitting technique. As the results of this table indicate, on the basis of the value of parameter R, equations (3) (CVP on the basis of BE) and (6) (CVP on the basis of SI) are of the highest and lowest levels of accuracy with the R values of 0.87 and 0.69, respectively. However, for the best predictive model (i.e. equation (3)), the relevant R value and AAE seem to be acceptable but its MAE is somehow large (71%). This indicates the necessity of combining non-invasive parameters to predict the CVP value
Summary of performance measures.
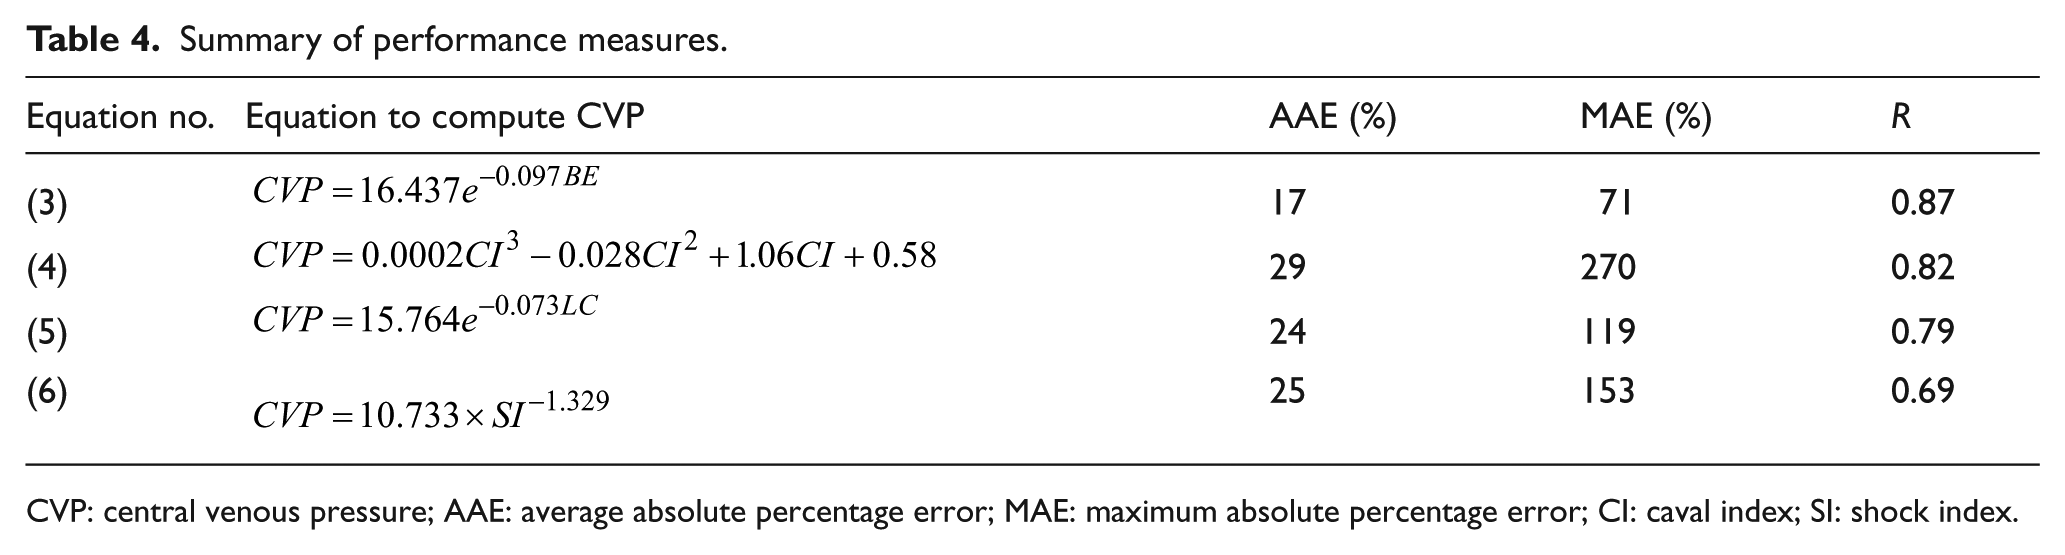
CVP: central venous pressure; AAE: average absolute percentage error; MAE: maximum absolute percentage error; CI: caval index; SI: shock index.
Development of ANN-based equation for predicting the CVP value
Formulation on the basis of ANN
ANN is a computing system which is inspired by natural nervous systems. A natural nervous system is composed of several natural neurons (or nodes) where they receive signals through synapses (or connections) and process them to obtain an output. In recent years, researchers have successfully employed ANN for developing the mathematical models to predict the behavior of systems in different applications.28–31 In this study, using the neural network toolbox in MATLAB, an ANN-based model was developed for predicting the CVP value. The model was made up of the following three layers: one input layer, one hidden layer and one output layer. Layers are made up of a number of interconnected nodes, which contain an activation function. Hence, nodes can be seen as computational units and connections determine the information flow between nodes. Patterns are presented to the network via the input layer, which communicates to the hidden layer where the actual processing is done via a system of weighted connections. The higher the weight of a node is, the stronger the input. The hidden layers then link to an output layer where the answer is output.
Most ANNs contain some form of “learning rule,” which modifies the weights of the connections according to the input patterns that it is presented with. Although there are many different kinds of learning rules used by neural networks, this demonstration is concerned only with one: the delta rule. The delta rule is often utilized by the most common class of ANNs called “backpropagation neural networks” (BPNNs). Backpropagation is an abbreviation for the backwards propagation of error. 32 With the delta rule, as with other types of backpropagation, “learning” is a supervised process that occurs with each cycle or “epoch” (i.e. each time the network is presented with a new input pattern) through a forward activation flow of outputs, and the backward error propagation of weight adjustments. 33 More simply, when a neural network is initially presented with a pattern it makes a random “guess” as to what it might be. It then sees how far its answer was from the actual one and makes an appropriate adjustment to its connection weights. This process can be graphically shown in Figure 4.
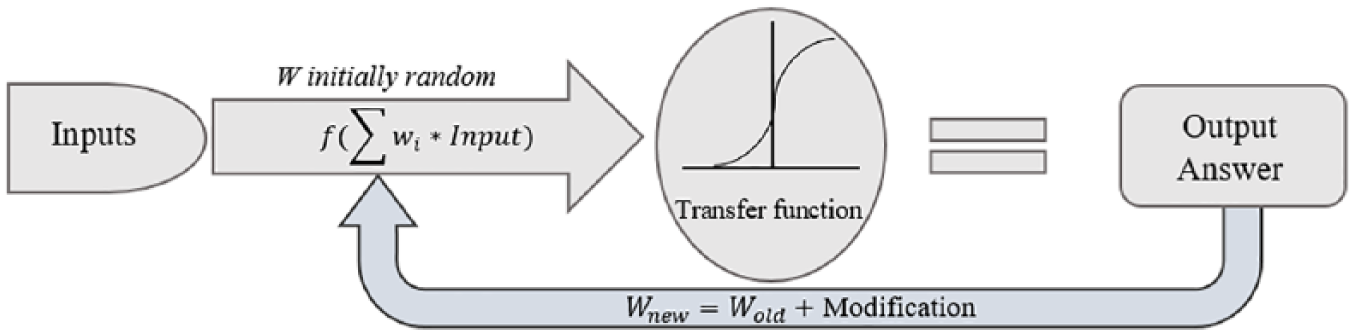
Backpropagation (BP) algorithm. 33
In this study, the authors used Levenberg–Marquardt (LM) algorithm 34 as the learning rule and feedforward backpropagation as network creation function. Two important advantages of feedforward neural networks are the reduction of computational effort and memory capacity needed to store the weights. 35 Generally, the LM algorithm needs less time and epochs for convergence, and it performs more efficiently compared to other learning rules, which in turn makes it ideal for training of different networks. 34 The LM algorithm is an approximation of Newton’s method, and it is very efficient for training networks that have up to a few hundred weights. In many cases, the Marquardt algorithm was found to converge when other backpropagation techniques diverged. 28 Once a neural network is “trained” to a satisfactory level, it can be used as an analytical tool on other data. In this case, the user no longer specifies any training runs and instead allows the network to work in forward propagation mode only to predict the output as follows.
At first, each input value is multiplied by the connected weight value and summed. Then, the result is added to a constant value. This constant value is named bias and is only connected to nodes in the hidden and output layers. The input into a node can be expressed by equation (7)

In this equation
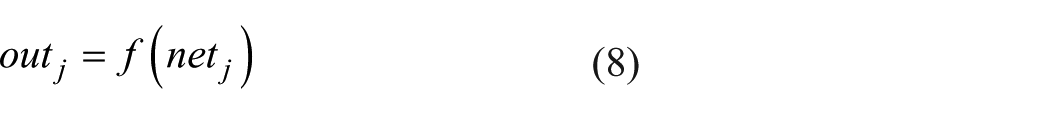
In this equation,

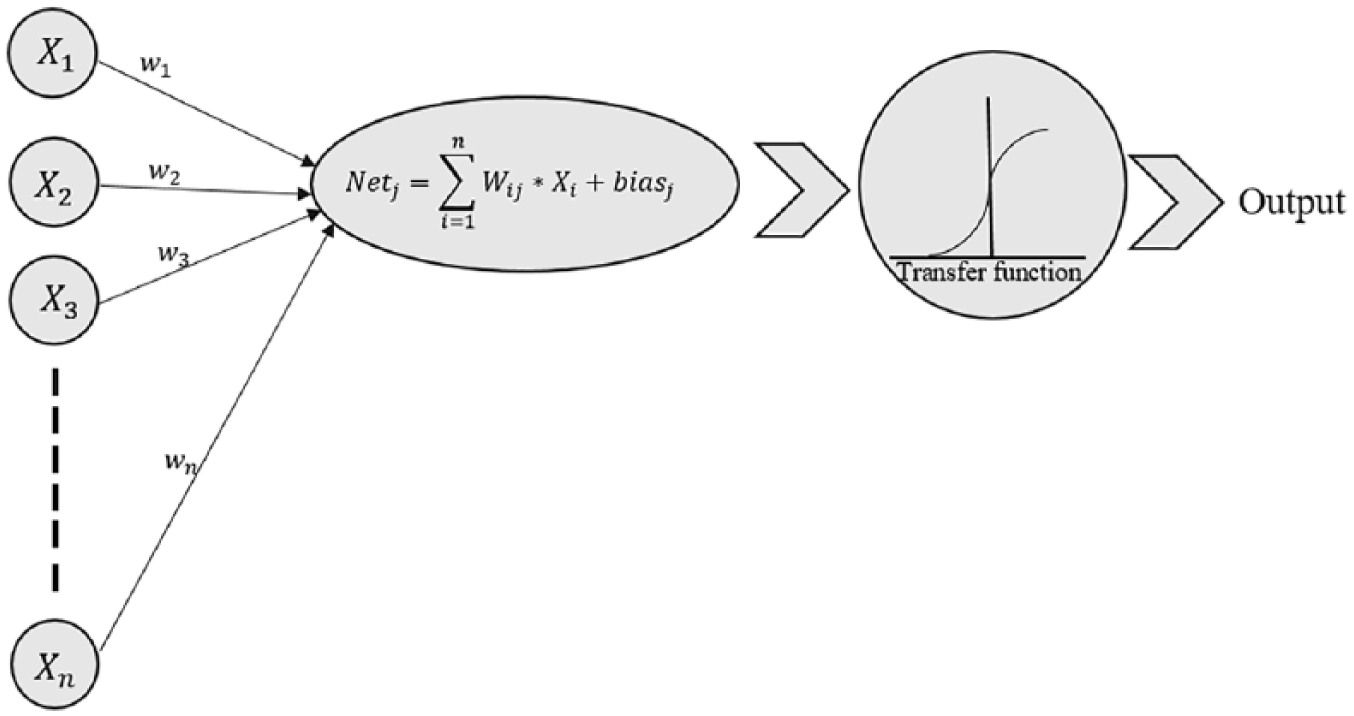
Simple artificial neural model.
In this study, the transfer or activation function used in the hidden layer was either LogSigmoid or TanSigmoid, while in the output layer, an identity transfer function was used. In addition, the early stopping technique
36
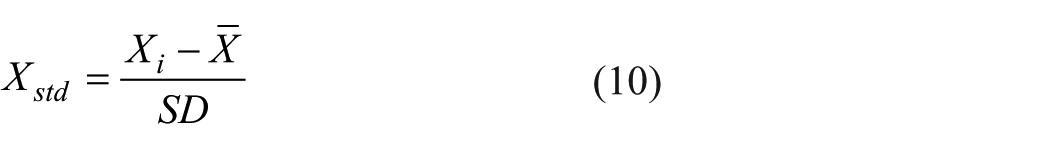
was utilized to resolve the overfitting problem during neural network training. In this study, 60%, 20% and 20% of the total data were selected randomly for training, validating and testing of the network, respectively. Furthermore, in order to speed up the learning process and to achieve more reliable ANN-based model, input and output parameters were standardized using equation (10). In this equation,
In section “Results,” it was shown that CVP is influenced by parameters HR, SBP, CI, LC, BE and SI. Hence, a maximum six-node input layer can be used to form the ANN. In this study, a parametric study was carried out in terms of the number and types of nodes in the input layer (between two and six nodes) to find out the optimum number of nodes in this layer. Based on this parametric study, the optimum number of nodes in the input layer which led to a high-performance network was three and the selected input parameters were LC, BE and SI. Note that based on the numerical results, the performance of the ANN model of four nodes in the input layer (CI, LC, BE and SI) was approximately same as the one of three nodes (LC, BE and SI) in the input layer. However, in this study, the one of three nodes in the input layer was selected since it seems that in an ED obtaining parameters LC, BE and SI are much easier than parameter CI. To obtain the value of CI, a sonography unit with a specialist is needed while it is not the case for obtaining parameters LC, BE and SI.
Note that the appropriate number of nodes in the hidden layer is also unknown. Hence, the number of these nodes was determined by a trial and error procedure to reach an acceptable network performance. In this study, several predicted models were examined using three optimum nodes in the input layer (i.e. LC, BE and SI) and varying the number of nodes in the hidden layer from 1 to 10 and changing the type of transfer function. Then, the performance of these predictive models was compared through their correlation coefficients (R values). For instance, this comparison in the case of having TanSigmoid transfer function in the hidden layer is shown in Figure 6. This figure indicates that the highest performance was achieved by having 10 nodes in the hidden layer with an R value of 0.931. Despite the fact that having a high number of nodes in the hidden layer can lead to a high level of accuracy, it finally makes the predictive model more complicated and more difficult to use. Hence, in this study in order to have a more practical mathematical formula with acceptable level of accuracy, one node with TanSigmoid transfer function with an R value equal to 0.901 was utilized to make up the hidden layer. The difference between the R values corresponding to the ANN-based models which have 1 and 10 nodes in their hidden layer is less than 4.5%.
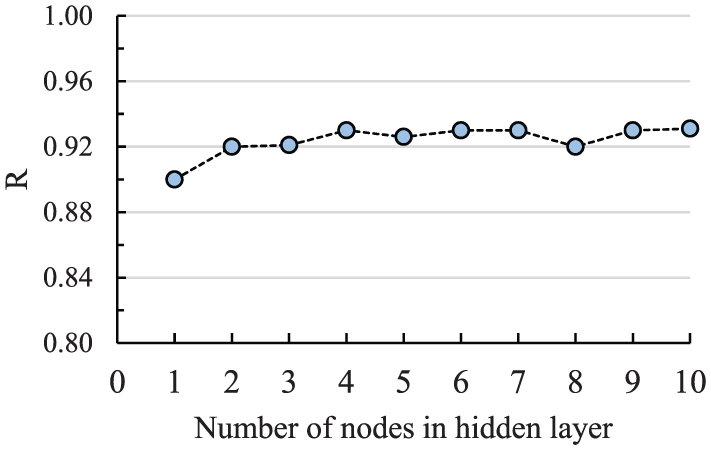
The relation between R and the number of nodes in the hidden layer.
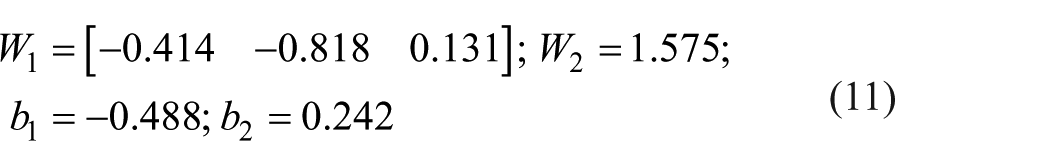
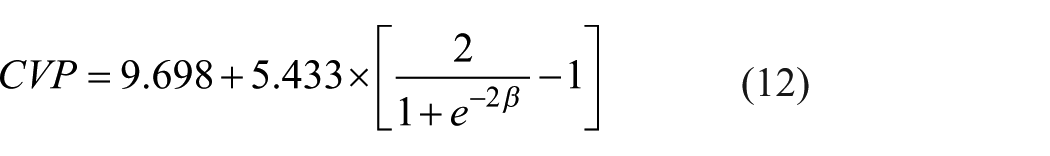
For the selected ANN network, the input layer weight matrix (W1), the hidden layer weight value (W2) and the hidden and the output layer bias (b1 and b2) are same as those presented in equation (11). Equations (12) and (13) show the proposed ANN-based model for predicting the CVP value. In these equations, the values of parameters CVP and LC are in percentage, and the absolute value of parameter BE is in mmol/L. For the proposed model, the values of R, AAE and MAE are 0.901%, 15.5% and 44.1%, respectively. Comparison of these performance measures with the ones of the best predictive model which was composed of only one non-invasive parameter (i.e. equation (3)) shows the efficiency of the ANN to improve the accuracy of the predictive model especially in terms of the parameter MAE

Sensitivity analysis on the basis of ANN
In this section, in order to find out the importance of each input parameter in the ANN-based model, a sensitivity analysis was conducted on the basis of the Garson 37 method. This method was also used by other researchers28–31 in different applications. In this method, the weights corresponding to the input-hidden and hidden-output of the trained ANN-based model are separated, and the absolute values of the weights are taken to compute the relative importance values. 38 For the proposed model, the importance of input parameters was measured and is graphically shown in Figure 7. This figure shows that, for the proposed model, parameters BE and LC are of the highest and lowest levels of importance, respectively.
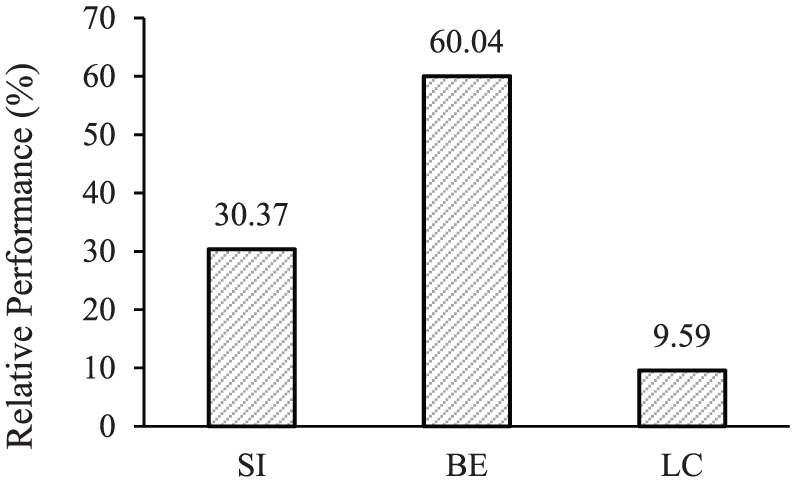
Relative importance values of the proposed ANN-based formula for CVP.
Comparison between the accuracy of predictive models for estimating the CVP range
Equations presented in sections “CVP value prediction on the basis of each individual non-invasive parameter” and “Development of ANN-based equation for predicting the CVP value” can also be used to estimate the CVP range through defining new parameters with appropriate COPs. Here, similar to the steps taken in section “Methods for predicting the CVP range,” first, for each newly defined parameter, an appropriate COP was determined by a trial and error procedure to reach the highest value of accuracy, sensitivity, specificity and largest PPV and NPV. Then, using fragility curves the reliability of these newly defined parameters at their relevant COPs were closely evaluated.
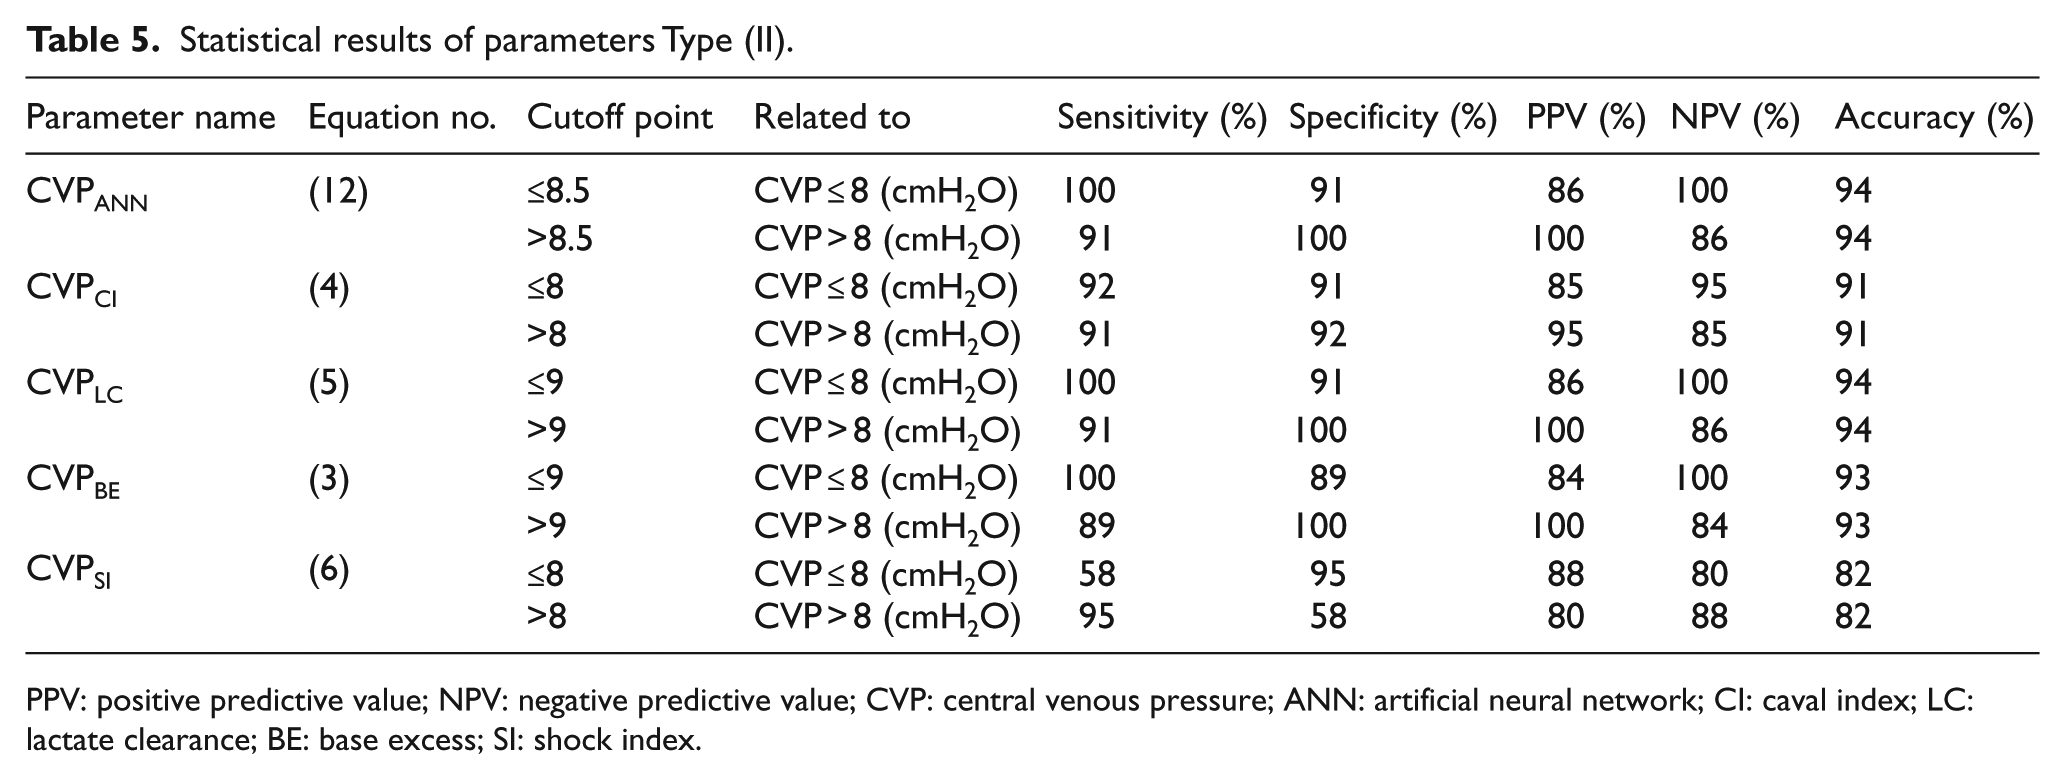
Table 5 summarizes these new alternative parameters and their relevant optimum COPs along with other statistical results. Hereafter, these parameters are denoted as parameters Type (II). Based on the results presented in this table, it can be concluded that among these five parameters, parameters CVPANN and CVPLC (at their relevant COPs) are equally of the highest level of accuracy with the accuracy of 94%. After that, parameters CVPBE, CVPCI and CVPSI can be considered as the most appropriate parameters to estimate the CVP range with the accuracy of 93%, 91% and 82%, respectively. Upon comparing these accuracy values with those presented in Table 3, it might be concluded that, at the proposed COPs, parameters of Type (I) and Type (II) are of the same level of accuracy to estimate the CVP range.
Statistical results of parameters Type (II).
PPV: positive predictive value; NPV: negative predictive value; CVP: central venous pressure; ANN: artificial neural network; CI: caval index; LC: lactate clearance; BE: base excess; SI: shock index.
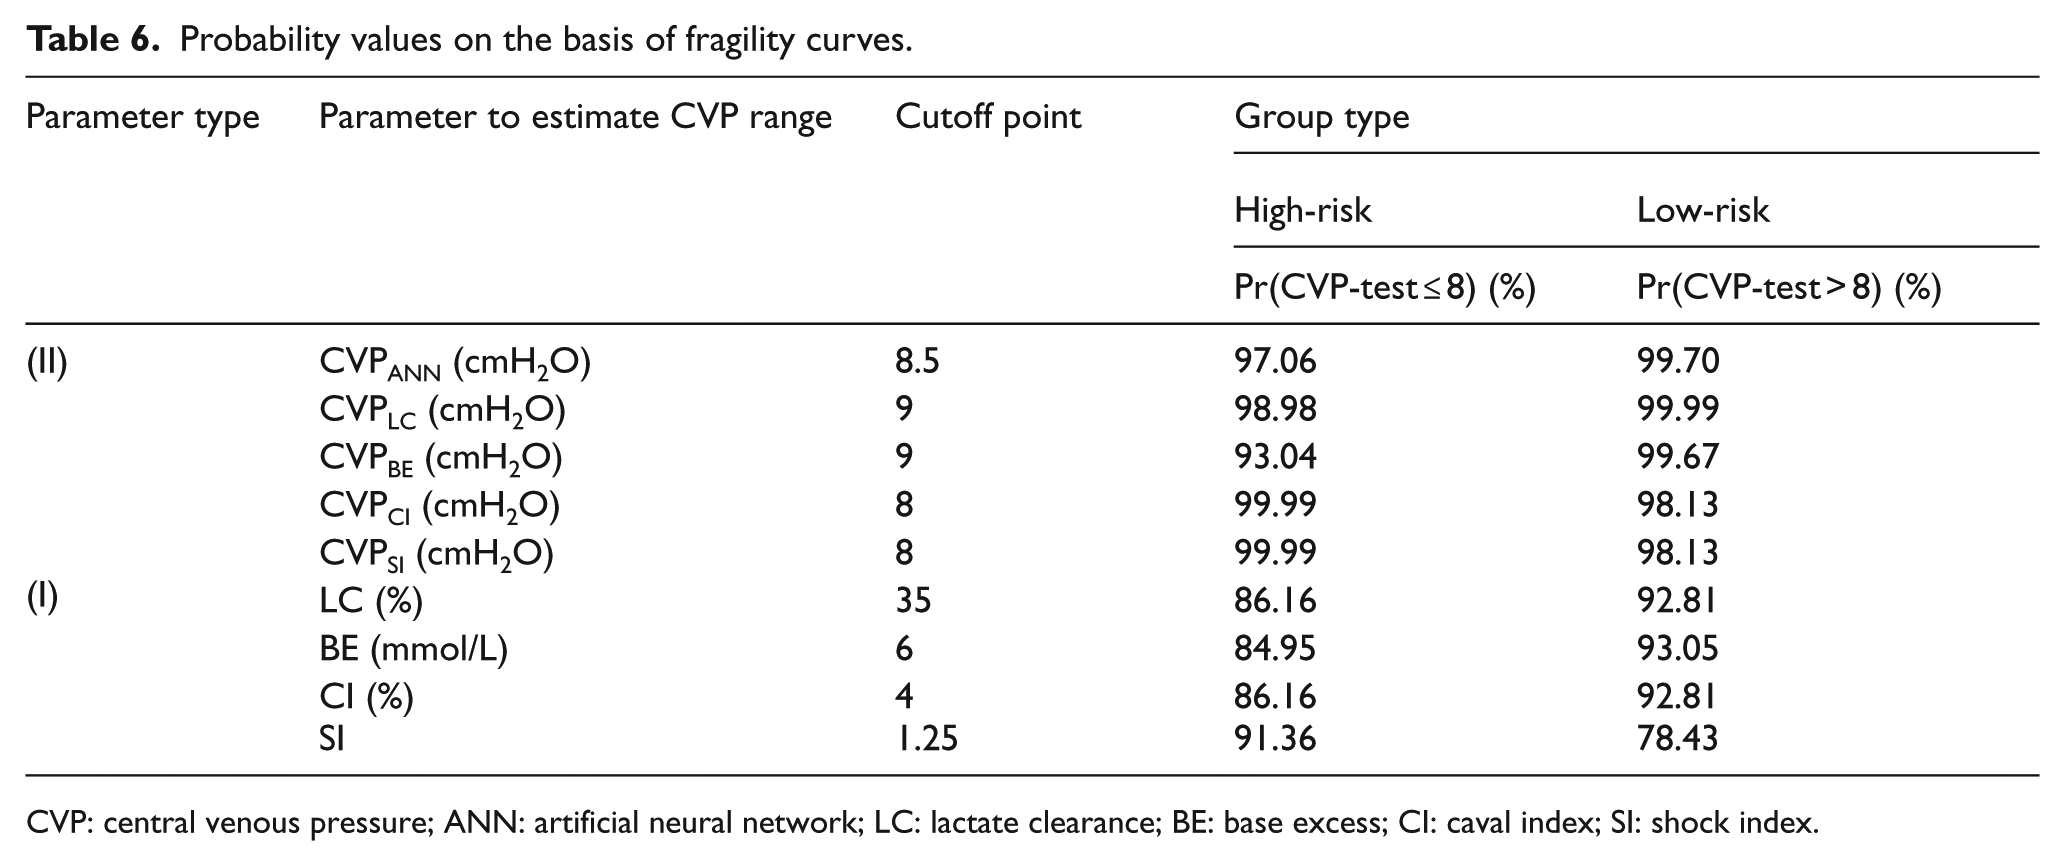
In order to more closely assess the reliability of parameters Type (II), fragility curves of the random variable CVP corresponding to each of these five parameters for both high-risk (≤COP) and low-risk (>COP) groups are drawn. For instance, Figure 8 shows these curves for different ranges of parameters CVPANN and CVPLC. Using these curves, the probabilities of having CVP ≤ 8 (cmH2O) and CVP > 8 (cmH2O) were calculated. These probabilities for both types of parameters at the proposed COPs are summarized in Table 6. As the results of this table indicate regardless of the group type (high-risk or low-risk), probability values of the parameters of Type (II), except for the CVPBE which is 93%, varied between 97.06% and 99.99%, while these probabilities for parameters of Type (I) are between 78.43% and 93%. These results clearly indicate that the parameters of Type (II) are more reliable than those of Type (I) to estimate the CVP range. By considering both methods of comparison presented in Tables 5 and 6, it might be concluded that the first, the second and the third most reliable parameters to detect the CVP range are CVPLC, CVPANN and CVPCI, respectively. However, as discussed in sections “CVP value prediction on the basis of each individual non-invasive parameter” and “Development of ANN-based equation for predicting the CVP value,” the most accurate equation to predict the CVP value is the one on the basis of the ANN (i.e. equation (12)) since in comparison to the others it has the highest value of the coefficient of correlation (R value) and the lowest value of parameters AAE and MAE.
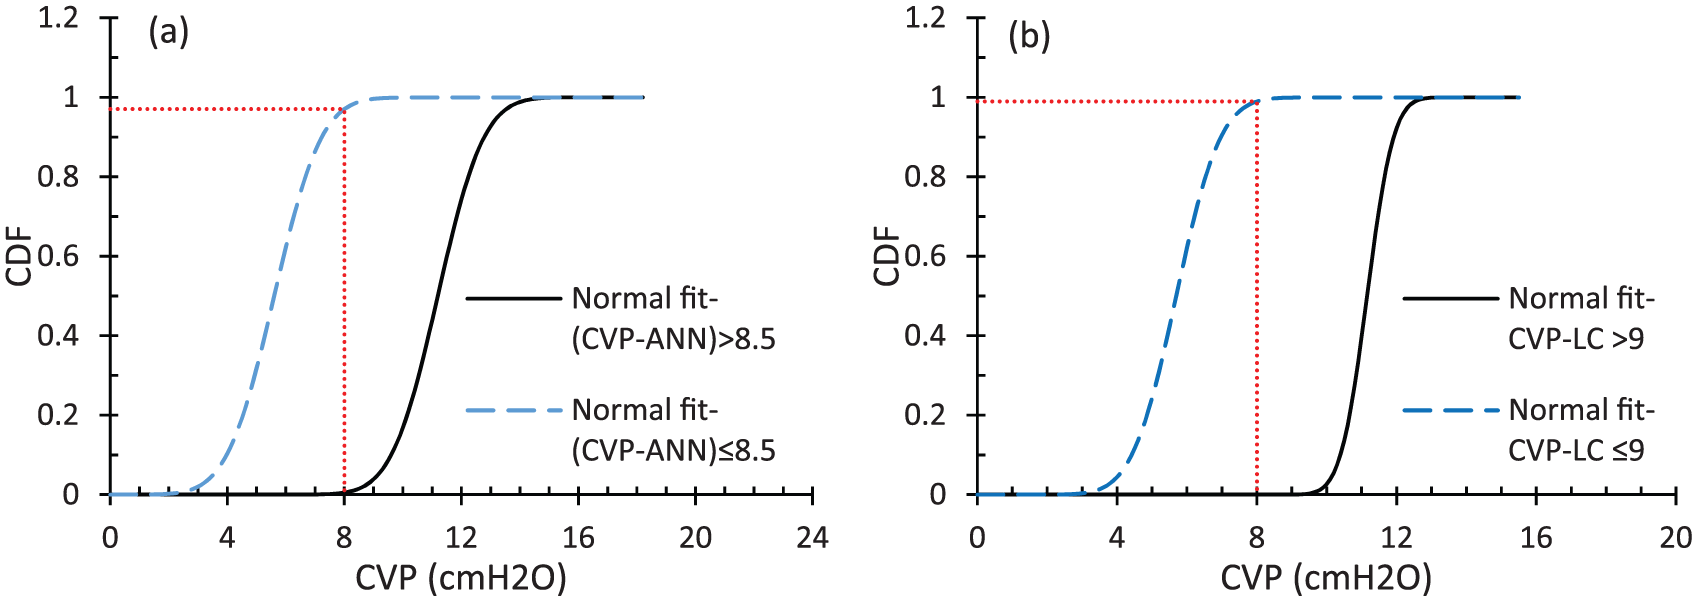
Fragility curve of random variable CVP corresponding to different ranges of parameters: (a) CVPANN and (b) CVPLC.
Probability values on the basis of fragility curves.
CVP: central venous pressure; ANN: artificial neural network; LC: lactate clearance; BE: base excess; CI: caval index; SI: shock index.
Clinical applicability of the results
When an emergency physician is faced with a traumatic patient who is at stages 1 and 2 of the hemorrhagic shock, the bleeding situation and consequently body fluid requirement of the patient may not be accurately detected only by clinical examinations and vital signs. In this case, CVP, which is the pressure measured in the central veins close to the heart, can be used to properly and indirectly estimate the blood volume. However, this method is invasive, time-consuming and may end up with several side effects. Hence, estimating the CVP using non-invasive parameters is recommended.
For this purpose, if an emergency physician is interested in the CVP range (less or greater than 8 cmH2O), it is recommended that this range should be estimated based on parameter CVPLC, which is only a function of non-invasive parameter LC (equation (5)), using COT of 9. The accuracy of this method is 94%. In contrast, when an emergency physician is interested in the CVP value (e.g. when following the response of a traumatic patient to fluid resuscitation is of interest), the use of following procedures is recommended. In the case of having limitations in time and laboratory facilities, CVP value can be quickly estimated using equation (3) which is only on the basis of non-invasive parameter BE. The mean absolute average error of this prediction is 17%. In order to enhance the reliability of this prediction and when aforementioned limitations are not existent, CVP value is recommended to be predicted using the ANN method (equation (12)) on the basis of non-invasive parameters BE, LC and SI. The maximum absolute average error of this method is significantly less than the one presented by equation (3), indicating the higher level of accuracy of the ANN method.
Conclusion
Based on the results obtained in this study, it can be concluded that evaluation of the CVP range (less or greater than 8 cmH2O) on the basis of only vital signs (i.e. HR and SBP) and surgical visit is very risky and inaccurate such that the probability of having a correct prediction was only 40%. Among all proposed predictive models for estimating the CVP value, the most accurate model was the one on the basis of the ANN (i.e. equation (12)) and the most reliable parameters to detect the CVP range is the CVPLC (equation (5)) at COP equal to 9.
Footnotes
Author contributions
S.M. and S.T. contributed to the conception and data collection. S.M. also contributed to manuscript writing. A.A.H. contributed to statistical analysis.
Declaration of conflicting interests
The author(s) declared no potential conflicts of interest with respect to the research, authorship and/or publication of this article.
Funding
The author(s) received no financial support for the research, authorship and/or publication of this article.
Availability of data and materials
All data, tables and figures used in the manuscript were prepared originally by the authors; if otherwise, the sources are cited. Furthermore, the authors can share any data and materials that are reported in the study.
Informed consent
Written informed consent was obtained from the patients or their family members.
Ethical approval
The study was approved by the ethics committee at Kerman University of Medical Sciences.
Human rights
This research does not harm human rights regarding Ethical Principles for Medical Research Involving Human Subjects.