
Abstract
Background:
Pulmonary embolism is a common disease with a high mortality risk. It has recently been reported that platelet indices may be diagnostic in pulmonary embolism.
Objective:
In this study, we aimed to determine the diagnostic value of platelet indices in acute pulmonary embolism.
Methods:
The study group was composed of 61 patients diagnosed with pulmonary embolism and a control group of 67 subjects without pulmonary embolism. Patient age, sex, leukocyte and platelet number, hemoglobin concentration (Hb), mean platelet volume, platelet distribution width, red blood cell distribution width, C-reactive protein, D-Dimer, and troponin I levels were retrospectively analyzed and compared between the two groups.
Results:
There was no significant difference between age and platelet number of pulmonary embolism and control group. In pulmonary embolism group, platelet distribution width level was significantly high (p = 0.002), whereas mean platelet volume level was significantly lower (p = 0.038). Receiver operating characteristic curve analysis revealed that a mean platelet volume cut-off of 9 fL had a sensitivity of 35%, a specificity of 89.55%, and area under the curve of 0.589 for pulmonary embolism, while a platelet distribution width cut-off of 12.8 fL had a sensitivity of 61%, a specificity of 71.64%, and area under the curve of 0.661. Platelet distribution width and D-dimer levels had a significant positive correlation with each other, whereas there was no significant correlation between mean platelet volume and D-dimer.
Conclusion:
Platelet distribution width values of the pulmonary embolism group were higher than those of control group. Although the area under the curve of platelet distribution width is slightly better than for platelet number or mean platelet volume, it does not seem that this parameter has better diagnostic accuracy than the other two.
Introduction
Pulmonary embolism (PE) is a common and potentially serious disease. The absence of a specific clinical characteristic or a reliable parameter of PE compels physicians to make a synthesis of clinical, biochemical, and imaging findings to confirm the diagnosis of PE. For this reason, research efforts are ongoing and additional diagnostic tests are sought. In recent years, platelet indices (platelet number (PLT), mean platelet volume (MPV), and platelet distribution width (PDW)) have been investigated extensively for their diagnostic and prognostic values in PE.1–3
The interaction of platelets with vessel wall and their subsequent contribution to atheroma formation and thrombosis are of pivotal importance in the etiology and pathogenesis of peripheral, coronary, cerebrovascular, and other vascular diseases. MPV and PDW are parameters of platelet activity that can be easily measured in a whole blood count. 4 It is thought that MPV is one of the most important parameters showing platelet activation. 5 Considering the role of thrombocyte activation, it also plays an important role in the pathophysiology of thrombosis because larger platelets are metabolically and enzymatically more active than smaller ones. As such, large platelets produce more prothrombotic substances such as thromboxane A2, serotonin, b-thromboglobulin, p-selectin, and glycoprotein IIIa.4,6 Hence, large platelets are more susceptible to adhesion and aggregation than smaller ones. 7 PDW is a parameter of platelet heterogeneity. It has been reported to be a more valuable marker than MPV for evaluating platelet activation. 1 Recent studies have explored the relationship between PDW and PE but no definite information is yet available in this regard.2,3
In our study, we aimed to determine the diagnostic value of platelet indices in diagnosing PE.
Materials and method
Patients and study design
This study involved 176 patients admitted to the Emergency Department with suspected PE and who underwent a thoracic computed tomography (CT) between 1 January 2013 and 31 November 2015. Patients with ICD-10 code for PE (I26) were identified from the Emergency Department database retrospectively from the computer. An ethics committee approval (No: 2015/347, Date: 12.11.2015) was obtained.
According to the results of thorax CT, patients with PE were included in the study group and patients without PE were included in the control group (CG).
Exclusion criteria included the following: congestive heart failure, hematological or oncologic disease, chronic infection, vasculitis, coronary artery disease, peripheral arterial disease, pregnancy, liver and kidney failure, and previous cerebrovascular disease.
In all, 32 patients with hematological and oncologic disease, 5 patients with chronic infection, and 11 patients with liver and kidney disease were excluded from the study. Study group was composed of 61 patients diagnosed with PE and the CG was composed of 67 subjects without PE.
The age and sex of the patients, leukocyte number, hemoglobin concentration, C-reactive protein (CRP), red blood cell distribution width (RDW), D-dimer, and troponin I concentrations and platelet indices (PLT, MPV, PDW) were recorded.
Laboratory examination
Hemoglobin concentration, leukocyte and PLTs, MPV and PDW were determined using an electronic cell counter (Beckman Coulter LH 780). Serum CRP level was measured by turbidimetric method (Roche 24 Cobas C 501). Serum D-dimer concentration (Aloe Triage Meter) and troponin I concentration (Roche Diagnostics Elecsys 2010) were measured on an immunoassay analyzer. The reference intervals of these values are shown in Table 1.
Comparison of clinical and laboratory characteristics of patients with PE and control group.
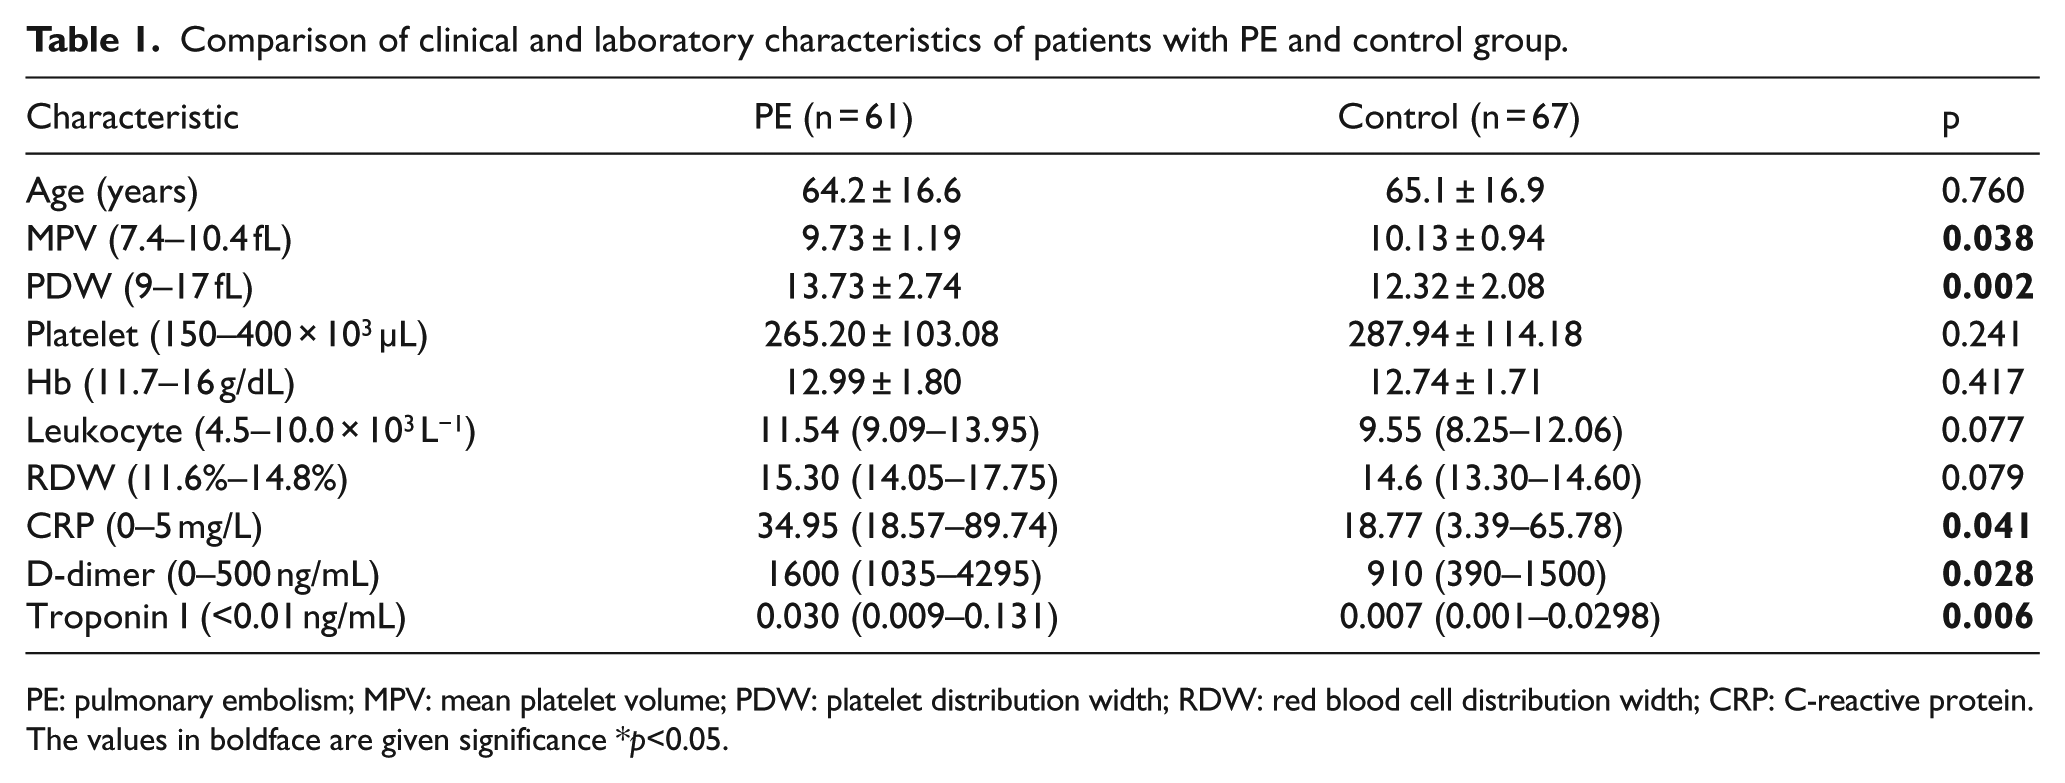
PE: pulmonary embolism; MPV: mean platelet volume; PDW: platelet distribution width; RDW: red blood cell distribution width; CRP: C-reactive protein.
The values in boldface are given significance *p<0.05.
Imaging protocol
CT images of the cases were taken in 64 × 0.5 mm collimation with a multi-slice CT device (Aquilion 64 Toshiba). Contrast injection was performed with an automated CT injector (Ulrich Missouri CT injection system). All patients were administered 150 mL of contrast, with an injection rate of 3.5 mL/s. Iopromide and iobitridol were used as non-ionic contrast in patients. All cases were evaluated by expert radiologists, and their reports were obtained retrospectively.
Statistical analysis
The normality of distribution of continuous variables was tested with the Shapiro–Wilk test. Independent samples t-test was used for normally distributed continuous variables and Mann–Whitney U test for non-normally distributed continuous variables. The descriptive statistics included minimum, maximum, mean, and standard deviation for normally distributed variables, and minimum, maximum, median, and 25–75 percentiles for categorical variables. Receiver operating characteristic (ROC) analysis was performed in order to examine diagnostic accuracy of platelet indices (PLT, MPV, and PDW), respectively. Spearman correlation coefficients were calculated for the relationship between continuous variables. Statistical significance was taken as p < 0.05.
Results
A total of 128 patients were enrolled in this study. The baseline clinical characteristics of the patients are shown in Table 1. There was no significant difference between the two groups with regard to mean platelet count (265.20 ± 103.08 in PE group and 287.94 ± 114.18 in CG; p = 0.241). The mean MPV value of the PE group was significantly lower than that of the CG (9.73 ± 1.19 fL and 10.13 ± 0.94 fL, respectively; p < 0.05). The mean PDW value in the PE group was higher than that of the CG (13.73 ± 2.74 fL and 12.32 ± 2.08 fL, respectively; p < 0.05; Table 1).
According to the ROC analysis, a cut-off value ≤9 was found for MPV, which predicted PE with a specificity of 89.55%, sensitivity of 35%, and area under the curve (AUC) of 0.589 (p = 0.0569; 95% confidence interval (CI): 0.508–0.684). A cut-off value of 12.8 was determined for PDW, which predicted PE with a specificity of 71.64%, sensitivity of 61.67%, and AUC of 0.661 (p = 0.0013; 95% CI: 0.572–0.743). A cut-off value of 254 × 103 µL was determined for platelet count, which predicted PE with a specificity of 56.72%, sensitivity of 62.30%, and AUC of 0.564 (p = 0.1851; 95% CI: 0.477–0.655; Table 2 and Figure 1).
Performance characteristics for platelet indices.
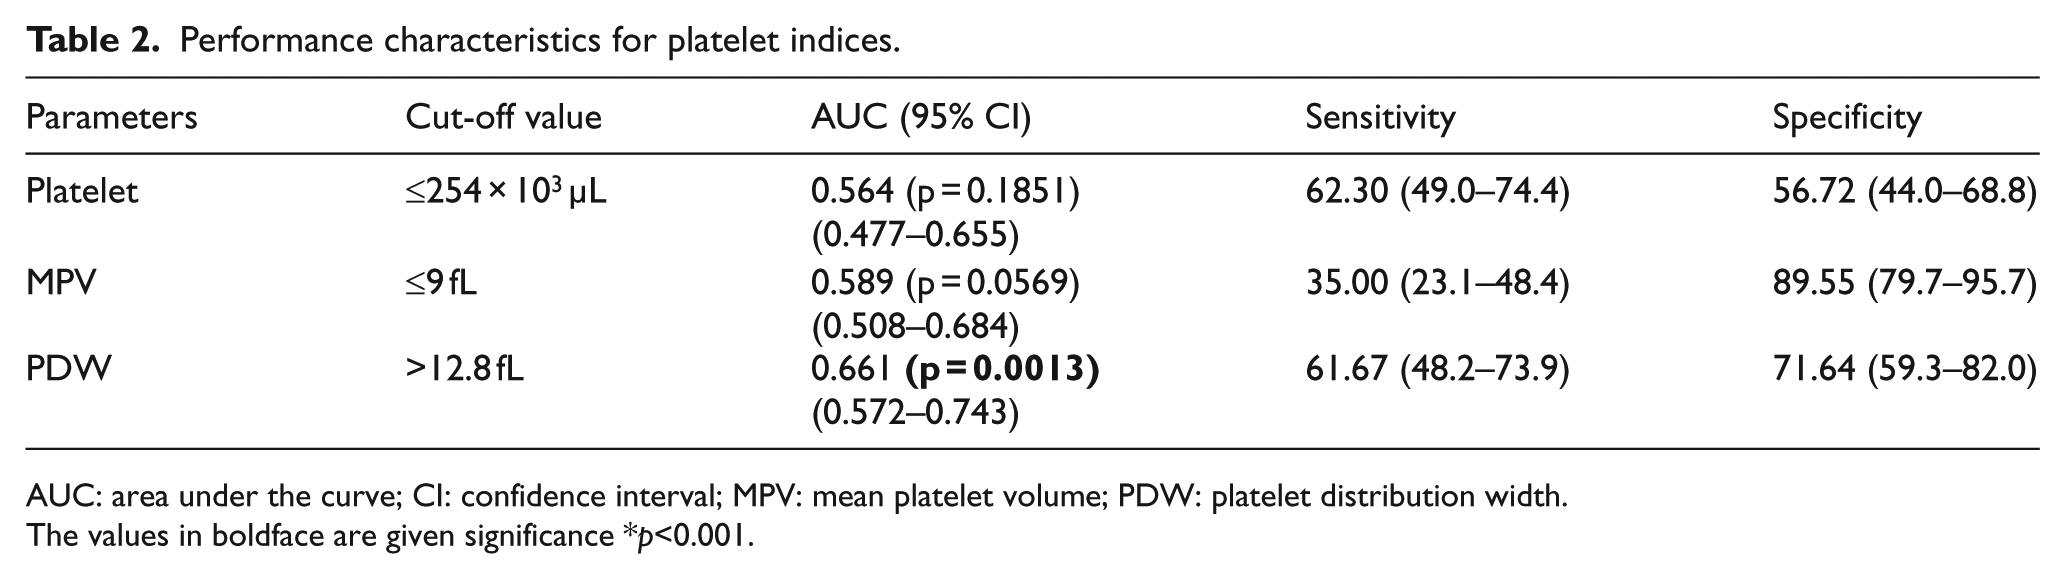
AUC: area under the curve; CI: confidence interval; MPV: mean platelet volume; PDW: platelet distribution width.
The values in boldface are given significance *p<0.001.
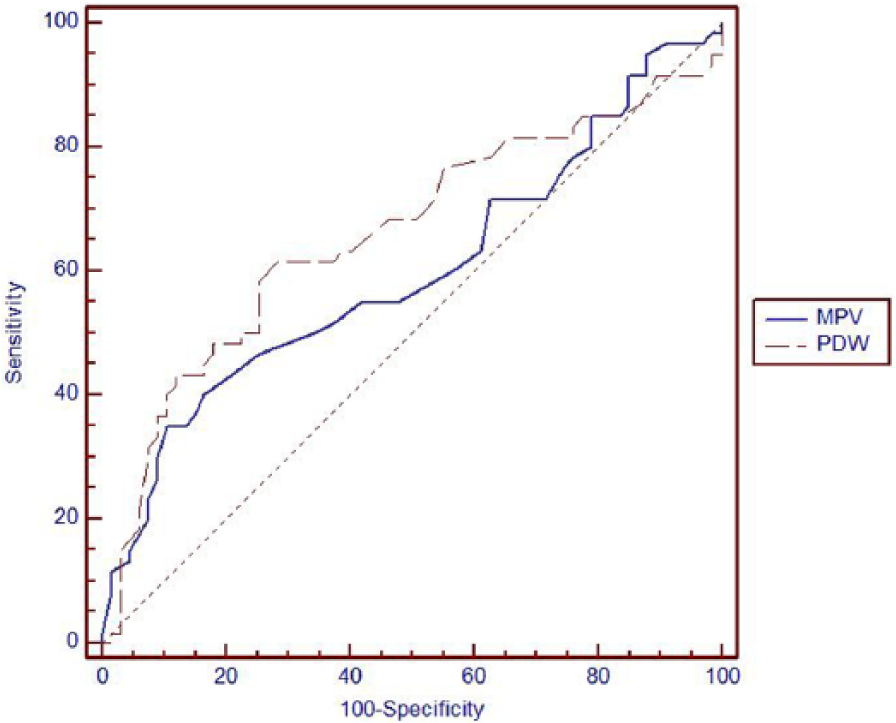
Receiver operating characteristic curve of MPV and PDW.
The correlation analysis to determine the relationship between PDW level and D-dimer revealed a significant positive correlation between the two (r = 0.522; p = 0.004). As the D-dimer value increased, the PDW value parallely increased (Table 3).
Spearman’s rank correlation coefficient analysis of the correlation between platelet count, MPV, PDW and D-Dimer in patients with PE.
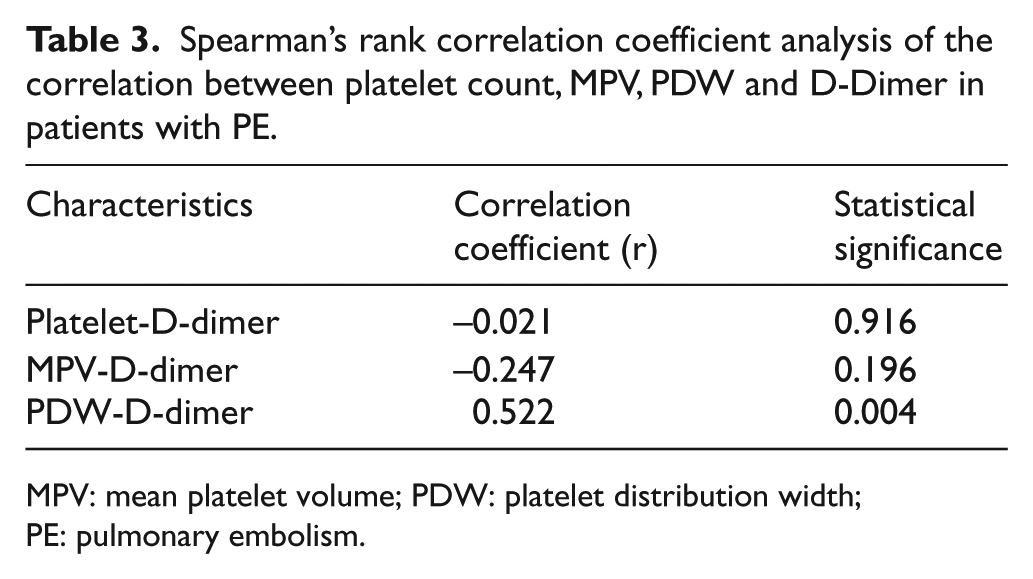
MPV: mean platelet volume; PDW: platelet distribution width; PE: pulmonary embolism.
Discussion
In this study, there was no significant difference between the platelet counts of the two groups. PDW levels were found to be significantly higher in patients with PE. The MPV values of the PE group were lower than those of the CG. However, according to the cut-off value determined by the ROC analysis, PLT, MPV, and PDW were not clinically used in the diagnosis of patients with suspected PE. But, AUC of PDW is slightly better than for PLT or MPV. A positive correlation was also found between PDW and D-dimer levels. There was no correlation between MPV and D-dimer with PE.
MPV is one of the most important parameters of platelet activation and is also routinely calculated in every routine blood count. 5 High MPV values have been considered as an independent risk factor for different clinical situations.8–10 In a limited number of studies, there have been conflicting results with respect to the correlation between PE and MPV. Some studies have reported that MPV is not significantly elevated in PE, while others found the opposite. Hilal et al. 11 and Kostrubiec et al. 12 compared the MPV levels between the PE and the CG, but no significant difference was found between the two groups. Varol et al. 13 and Huang et al. 3 reported that MPV values were higher in PE patients. Unlike the above-mentioned studies, the MPV values were significantly lower in the PE group of our study. However, considering the cut-off values, we found a low sensitivity and AUC for MPV to be used for diagnosing PE. MPV did not appear to be a useful diagnostic test for PE.
The platelets are one of the key elements of human blood. Platelets play a central role in the process of thrombus formation, atherogenesis, and the progression of atherosclerotic lesions. 4 Platelet counts have also been evaluated in the diagnosing and determining the prognosis of PE. However, in these studies, it was reported that there was no significant relationship between platelet count and PE.3,11,13 Similarly, in our study, we did not find a significant relationship between platelet counts and PE.
PDW is an index of platelet heterogeneity within the measured platelets. 1 Data concerning PDW in PE are limited. Several previous studies have investigated the relationship between PDW and PE, but no definitive information is yet available in this regard.2,3 Günay et al. 2 found a significant difference between the PDW values of patients with PE and the CG. Similarly, Huang et al. 3 showed that PDW was significantly higher in patients with acute PE compared with the CG. In our study, we noticed that PDW levels were significantly higher in the PE group. Considering a cut-off values of 12.8 fL for PDW, its sensitivity was 61%, specificity was 71.64%, and AUC was 0.661 for PE. PDW and D-dimer levels had a significant positive correlation, whereas there was no significant correlation between MPV and D-dimer; 95% CI is overlapping for all three platelet indices investigated (PLT, MPV and PDW). AUC of PDW is slightly better than for PLT or MPV.
According to our opinion, recent studies related to platelet indices, are interesting. However, the clinical use of platelet indices is controversial. In emergency department, there is a need for tests that have powerful discriminative features for the diagnosis of PE. High clinical suspicion, algorithmic approach, and D-dimer test are still important diagnostic approaches in these patients.
The limitations of the study are retrospective, single-centered, and the small number of patients. We did not evaluate the prognostic role of platelet indices in patients with acute PE.
In conclusion, PDW values of the PE group were higher than those of CG. Although the AUC of PDW is slightly better than that for PLT or MPV, it does not seem that this parameter has better diagnostic accuracy than the other two. New biomarker studies, which are powerful distinguishing features of PE in the future, may be promising.
Footnotes
Declaration of conflicting interests
The author(s) declared no potential conflicts of interest with respect to the research, authorship, and/or publication of this article.
Funding
The author(s) received no financial support for the research, authorship, and/or publication of this article.