
Abstract
Objective:
To assess the prognostic significance of urine paraquat concentrations of patients with acute paraquat poisoning on admission at the emergency department.
Methods:
Patients with acute paraquat poisoning admitted to the emergency department were recruited. Survivors and non-survivors were compared with regard to urinary paraquat concentration. The urinary level predictive of mortality was assessed by receiver operating characteristic curve. Risk factors of mortality were evaluated by regression analysis.
Results:
The overall mortality rate was 70.9% over the 28-day follow-up period. There was a significant difference in the urine paraquat concentrations recorded on admission between non-surviving and surviving patients (p = 0.022). Receiver operating characteristic curve analysis revealed that the area under the curve when applied to receiver operating characteristic of the admission urine paraquat concentrations for predicting mortality was 0.854 with a cut-off value of 34.5 µg/mL. The dose of paraquat ingested, arterial lactate, and urine concentration were independent risk factors predicting 28-day mortality. The time interval between ingestion and hemoperfusion, arterial lactate, and urine concentration of paraquat were independent risk factors predicting acute kidney injury, while the partial pressure of carbon dioxide (PaCO2) and urine concentration of paraquat were independent risk factors predicting acute lung injury.
Conclusion:
The urine concentrations of paraquat on admission at emergency department demonstrated predictive ability for the prognosis of patients with acute paraquat poisoning.
Introduction
Paraquat (1,1′-dimethyl-4,4′-bipyridinium dichloride, PQ) is a non-selective contact herbicide that is used widely worldwide.1–3 Although proven to be effective and safe when used properly in agriculture, PQ has attracted controversy because of its danger to human. Poisoning results in a high mortality rate (50%–90%). 4 While ingestion of >20 mL PQ with a 20% concentration can induce multi-organ failure, cardiogenic shock, and death within 1–4 days, the ingestion of smaller quantities (10–20 mL) may also initiate irreversible lung fibrosis and renal failure, resulting in death within several weeks. 5 Over the past 40 years, no effective treatment has been available. The mortality rate of PQ poisoning remains high.6–8
The presentations of acute PQ poisonings are often subtle. 3 A reliable predictor of prognosis would serve as an informative guide to treatment. Several parameters have emerged as prognostic indicators. Both the PQ level in the plasma and the quantity that was accidently consumed are considered as prognostic factors for identifying PQ poisoning.9–11 However, for a number reasons, the plasma level of PQ has been a less reliable clinical marker than expected. First, plasma PQ concentrations are not available in many hospitals because of limited medical resources, particularly in developing countries. Furthermore, the measured plasma PQ level does not necessarily represent the amount ingested or the body burden of PQ. In fact, the plasma level of PQ peaks early, usually within 1–2 h after ingestion, followed by a rapid decline due to PQ distribution from circulation to other body compartments. During this period, the plasma concentration varies greatly with even slight changes in the time interval since ingestion.10,12 Finally, the results of plasma PQ concentration cannot be used immediately in the emergency department (ED), which is mostly likely to be the first choice for treatment for most acute PQ poisoning patients followed ingestion.
For the prognosis of patients with acute PQ poisoning, several studies have reported that the Severity Index of Paraquat Poisoning (SIPP), Acute Physiology And Chronic Health Evaluation II (APACHE II), and Sequential Organ Failure Assessment (SOFA) scores may be beneficial to predict mortality, especially when a hospital does not have a facility to measure serum or urine PQ levels.13,14 Nevertheless, the APACHE II score does not include parameters reflecting liver damage which is a major complication of PQ poisoning. Furthermore, calculation of the APACHE II score is complex and not suitable for acute PQ poisoning patients in the ED. The SOFA score is calculated by summing the worst scores for each of the six of organ systems (cardiovascular, neurological, respiratory, renal, hepatic, and coagulation), but in our clinical experience with thousands of cases of acute PQ intoxication, it takes time for organ dysfunction to develop and may not yet have occurred in acute PQ poisoning patients upon their admission to the ED. Therefore, SOFA scores are also not suitable for the prediction of mortality due to acute PQ poisoning.
In alkaline media, PQ forms a stable, blue-colored radical ion in the presence of dithionite 15 that can be used to detect PQ in urine. The reaction is simple and rapid, and the dithionite test may be a useful bedside screening tool for acute PQ poisoning because of its convenience and reproducibility. Although this method was first proposed in 1970s, 16 to our knowledge, no previous study has assessed whether urine PQ concentration quantitatively detected by the dithionite test can predict the prognosis of patients with acute PQ poisoning. We hypothesized that the urine PQ level on admission to the ED is a potentially useful parameter to predict the prognosis of patients with acute PQ poisoning. The aim of this study was to determine the ability of the urine PQ level to predict death in ED patients with acute PQ poisoning.
Materials and methods
This single-center prospective cohort was approved by the Ethics Committee of the First Affiliated Hospital of China Medical University. The study was conducted from 1 January 2009 to 31 December 2013 in the ED. In this hospital, patients with acute poisoning received care in the ED instead of other departments. Patients who met the following criteria were enrolled: (1) patients admitting attempted suicide through the ingestion of PQ and (2) patients not admitting ingestion of PQ, but with positive urine sodium dithionite reactions and circumstantial evidence for PQ poisoning, such as an empty PQ container, a suicide note, and black-green residues on clothing or skin. Patients were excluded if they had (1) non-oral exposure; (2) aged ≤18 years; (3) other fatal drug poisonings; (4) a history of chronic kidney disease; (5) a history of receiving dialysis therapy prior to ED admission; (6) pre-existing diseases accompanied by hyperbilirubinemia, such as severe liver disease; (7) presenting to ED >4 h or urine for testing was collected >6 h after PQ ingestion; (8) contraindication or failure to insert a Foley catheter; (9) discharge against medical advice and a duration of treatment in ED of <48 h unless death; and (10) incomplete data or lost to follow-up. Patients were divided into survivors or non-survivors based on their status at the 28-day follow-up. The primary endpoint was survival to 28 days after ingestion regardless of death occurring at the hospital or after discharge. The secondary endpoints were acute lung injury (ALI) and acute kidney injury (AKI).
Upon admission, all patients received the following standardized medical emergency treatment. Detoxification of PQ was conducted by gastric lavage with a large amount of saline followed by administration of 250 mL 20% mannitol to patients admitted to the ED within 4 h of PQ ingestion to thoroughly remove the pesticide residue from their gastrointestinal tract. Other treatments included hemoperfusion; intravenous infusion of glucocorticoids, anti-free radical (such as vitamin C), liver- and kidney-protecting (such as glutathione), and water and electrolyte balance-maintaining agents; forced diuresis; and Chinese herbs (Xuebijing, a newly developed injection containing extracts of five traditional Chinese medicinal herbs).
Dithionite urine test for quantitative and qualitative urine PQ levels
The principle of the sodium dithionite test is the absorbance of PQ changes because of the blue-colored PQ free radical ion that is produced upon reaction with sodium dithionite under alkaline conditions.5,15 In our laboratory, an alkaline sodium dithionite solution was prepared by adding 100 mg of sodium dithionite to 10 mL of 2 M sodium hydroxide (the reagent is stable for approximately 2 h). Patient urine was prepared by placing 10 mL into a colorless tube, incubating at −20°C for 10 min, and centrifuging at 12,000 r/min for 5 min. Into 2 mL of the processed urine supernatant, 200 µL of the alkaline sodium dithionite solution was added. After fully mixing by shaking gently, 50 µL of the mixture supernatant was subjected to detection in an ultraviolet spectrophotometer. The other mixture was viewed against a white background for qualitative/semi-quantitative analysis.
In our preliminary experiment, a standard solution was prepared by adding 200 g of PQ to 1 L of distilled water. A volume of 5 mL of the standard solutions were aliquoted to 12 colorless tubes. The standard solution was diluted with healthy urine to prepare concentration mixtures. The target PQ concentrations were 100, 75, 50, 25, 12.5, 5, 2.5, 1, 0.5, 0.25, 0.1, and 0.01 g/L. We measured the mixtures as described above, using a wavelength of 396 nm for the detection of the blue-colored PQ. The absorbance (y) was associated with urinary PQ concentration (x), with a regression equation of y = 0.0795x + 0.0141 for urinary PQ concentration between 0.01 and 100 µg/mL. The correlation coefficient was 0.9995 and the recovery rate of this method ranged from 91.5% to 104.0%. The relative standard deviation (RSD) was 2.7%–4.5%, and the minimum limit of detection (LOD) was 0.01 µg/mL. The intra-day precision was less than 4.3% and the inter-day precision at all concentrations examined was less than 4.1%. Based on the absorbance of the tested sample and the formula above, urine PQ concentrations were calculated quantitatively.
Standards containing 0 and 1.0 mg PQ per liter of saline were used as the negative and positive controls. The qualitative results were considered positive when the urine tests yielded a blue color that was visibly darker than the positive control. For semi-quantitative analysis, the positive results were presented as grades 1–4: black (4+), deep blue (3+), light blue (2+), and barely distinguishable blue (1+). The results were reported as (±) when a faint blue color occurred and the intensity of the bluish color change was similar to that of the positive control. Two experienced observers interpreted the results to reduce the likelihood of subjectivity in their interpretation. The results were reported as the higher grade in cases of disagreement on positive urine test results. According to the preliminary experiment, the reproducibility of the urine sodium dithionite test was 97% for the positive cases and 93% for the negative or equivocal cases with a kappa score of 0.918, which supports the reliability of the test as a marker.
Data collection
When the patients arrived at the ED, a Foley catheter was inserted and all urine present in the bladder was collected into a container. Urine collected was immediately placed into another container and tested by the sodium dithionite reaction. Upon admission, a standardized questionnaire was completed, which included demographic variables such as initial vital signs, age, gender, and pre-existing diseases as well as specific questions about the PQ poisoning (amount of PQ ingested, time interval between ingestion and ED arrival). Blood samples for a complete blood count, blood chemistry, and arterial blood gas analysis were collected in the ED and every day for the first 7 days of hospitalization. Plasma PQ levels were measured in the ED by high-performance liquid chromatography (HPLC) starting in November 2012. Two well-trained physicians using a standard data collection form collected the data provided by the patients; the process was performed repeatedly and reviewed for accuracy by us. The ingested dose of PQ was estimated based on the following: (1) patient report on the ingested dose of PQ, defined one mouthful as 20 mL; (2) description from relatives regarding the amount of poison ingested; and (3) the amount of residual PQ in the container.
Definitions
ALI was defined according to the American-European consensus conference as the acute onset of bilateral pulmonary infiltrates, a ratio of the PaO2 to the fraction of inspired oxygen (FiO2) of ≤300 mmHg and pulmonary artery occlusion pressure of ≤18 mmHg or the absence of left atrial hypertension. 17
AKI was defined as serum creatinine levels >106 µmol/L (1.2 mg/dL) or a ≥ 50% increase in serum creatinine from baseline, based on the risk, injury, failure, loss, and end-stage kidney disease (RIFLE) criteria. 18
Statistical analysis
All statistical analyses were performed using PASW Statistics for Windows (version 18.0; SPSS, Inc., Chicago, IL, USA). Data were presented as mean ± standard deviation (mean ± SD), median with interquartile ranges (IQR), or frequencies. χ2 tests were used to compare frequencies. One-way analysis of variance (ANOVA) and Student’s t-tests were used for normally distributed variables, whereas Mann–Whitney U-tests were applied to non-normally distributed variables. Fisher exact tests were performed for comparisons of nominal variables between the two groups. Correlations for normally distributed variables were determined via linear regression analysis. For non-normally distributed variables, correlations were determined using Spearman rank tests. Independent associations between one dependent variable and more than two independent variables were assessed by multiple and logistic regression analyses. The Kaplan–Meier technique (log-rank test) was used for survival analysis. Receiver operating characteristic (ROC) curves were generated for sensitivity and specificity analyses, with the respective areas under the curves (AUC) used to predict mortality after PQ poisoning. Cut-off values were derived from the AUC of urine PQ concentration ROC curves via the Youden Index. The intermediate values were used to determine the cut-off values, defined as (sensitivity) + (specificity) − 1, giving equal weight to sensitivity and specificity. A probability value of <0.05 was considered statistically significant.
Results
Among 463 patients with clinical diagnoses of acute PQ poisoning, 306 were included between 1 January 2009 and 31 December 2013. Of the patients excluded from the study, 3 were poisoned via PQ absorption through their skin and mucous membranes, 6 were younger than 18 years, 11 co-ingested another fatal drug with PQ, 17 had a history of chronic kidney disease or dialysis therapy prior to ED admission, 12 had hyperbilirubinemia, 78 had a delay in presentation to the ED (>4 h after ingestion) or urine was tested later (>6 h after ingestion), inserting a Foley catheter was contraindicated in two patients with non-surgically treated prostate cancer, 15 patients were discharged against medical advice and had a duration of treatment in the ED of <48 h, and 13 were lost during the follow-up (Figure 1).
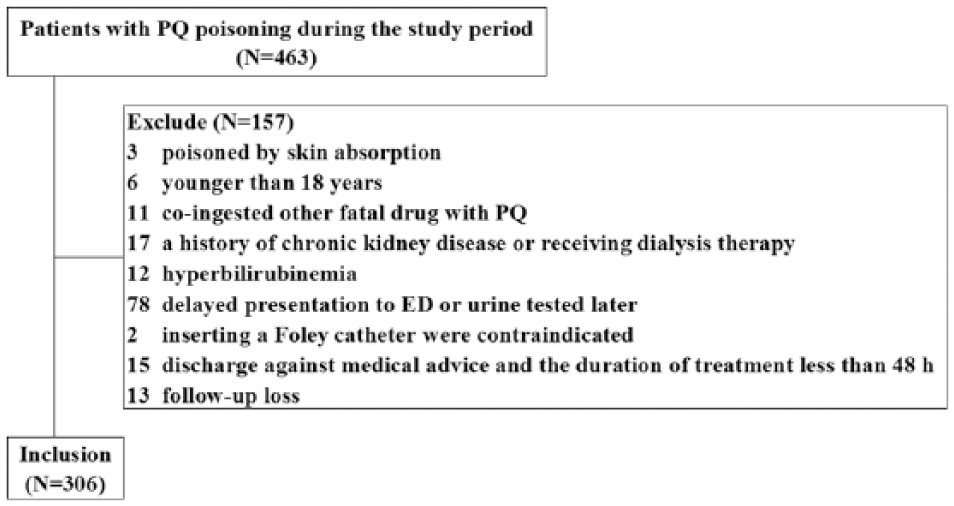
PQ ingested patients between January 2009 and December 2013.
Baseline characteristics
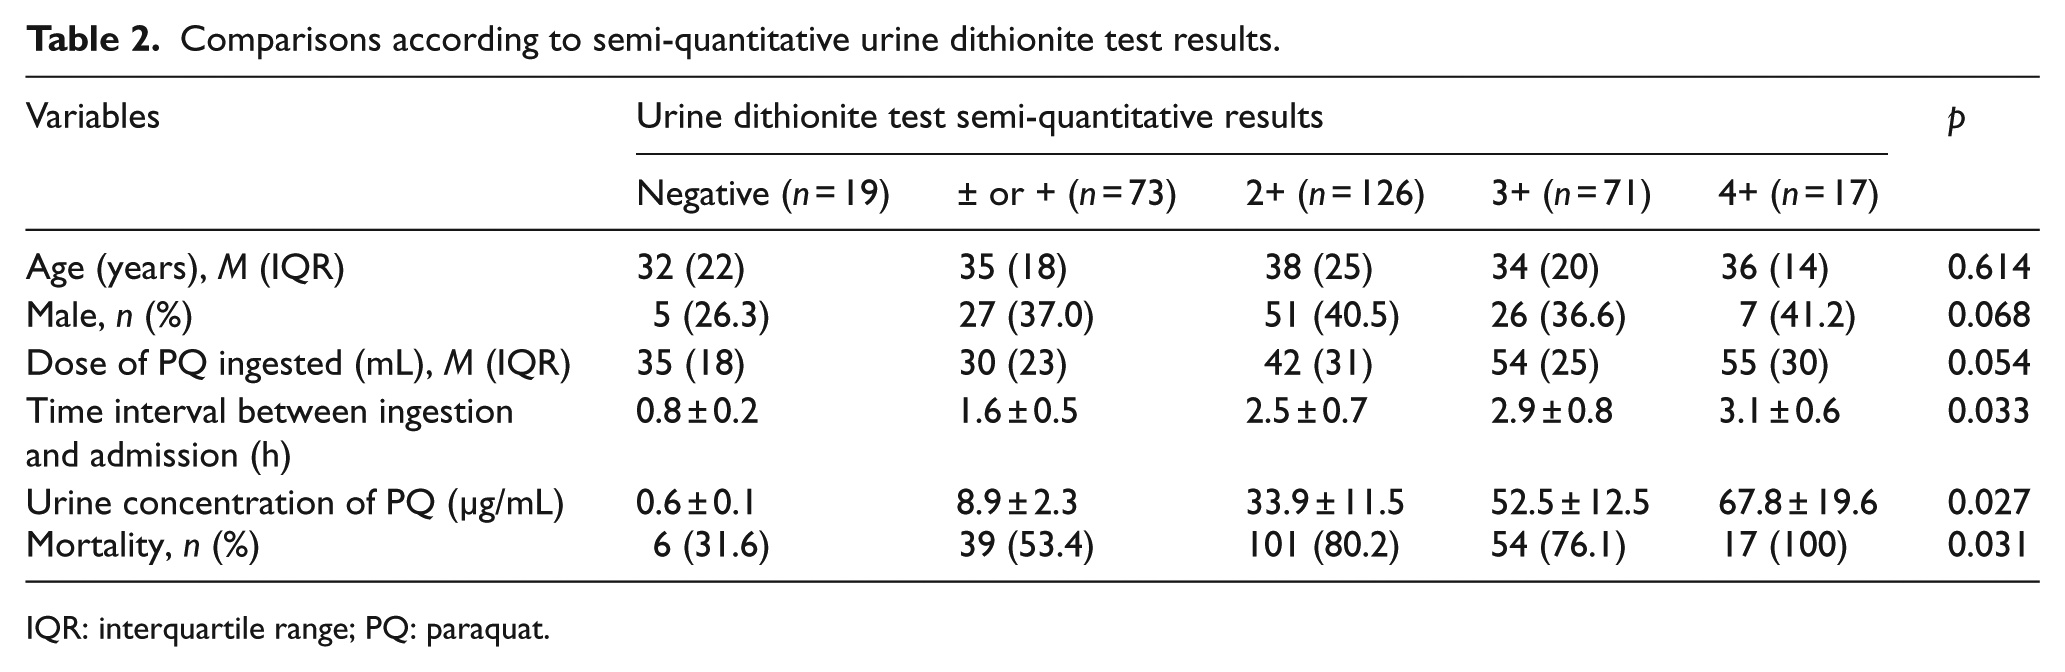
The general demographic characteristics and baseline laboratory results in the survivors and non-survivors are summarized in Table 1. All 306 patients included in this study were suicidal and had ingested 20% liquid PQ concentrate, including 116 men and 190 women, with a median age of 37 years (range: 19–75 years, IQR: 23 years). The median ingested dose of 20% PQ was 45 mL (range: 10–280 mL, IQR: 60 mL). The mean time interval between PQ ingestion and presentation for medical care was 2.9 ± 0.9 h (range: 0.5–4.0 h). The assessment follow-up period lasted until 31 January 2014. In all, 217 (70.9%) patients died within 28 days after ingestion and only 89 patients with acute PQ poisoning survived. Of the non-survivors, 38 patients died within 7 days after PQ poisoning and 179 died between 7 and 28 days.
Demographic and laboratory observations of the survivors and non-survivors among the 306 patients with acute PQ poisoning.
PQ: paraquat; IQR: interquartile range.
Urine PQ concentration
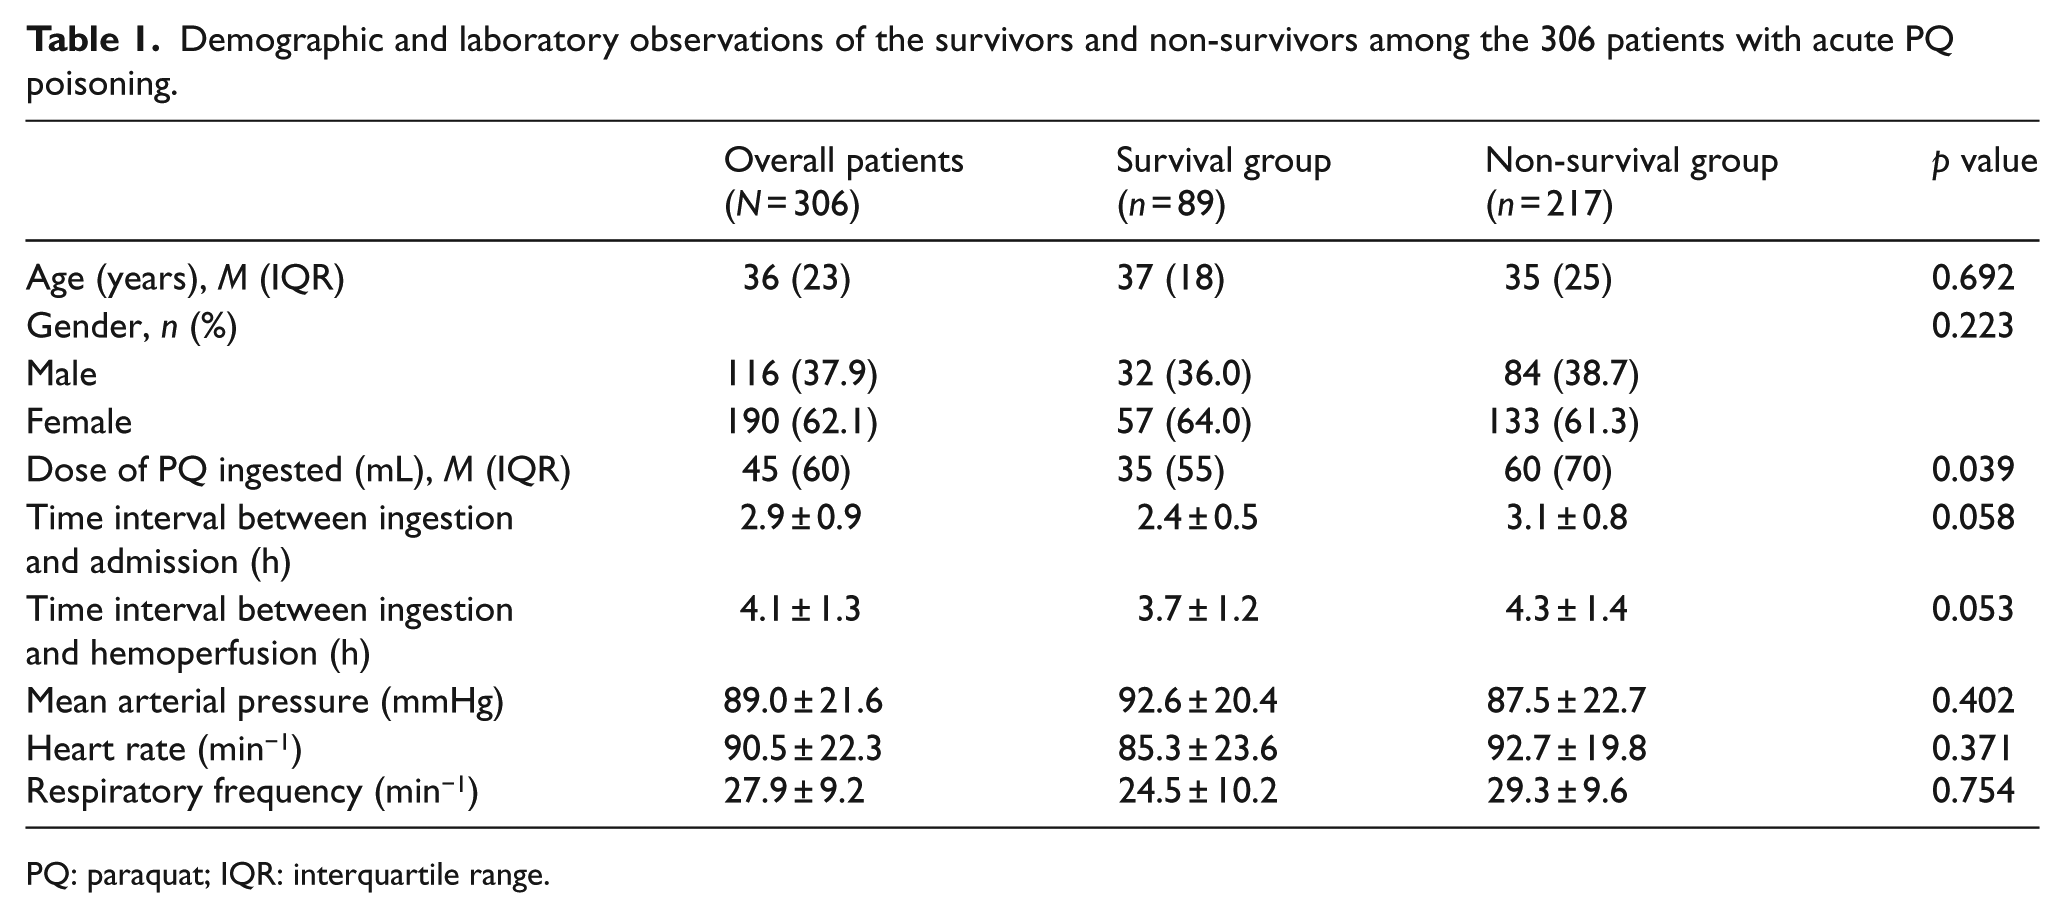
Non-survivors had a higher urine concentration of PQ (47.5 ± 11.6 µg/mL) than did survivors (28.9 ± 10.7 µg/mL; p = 0.022) in univariate analysis. The dose of PQ ingested and serum amylase and arterial lactate levels were higher in non-survivors (p < 0.05, for all comparisons), while PaCO2 was higher in non-survivors (p = 0.048). The comparisons of urine PQ level are shown as scatter plots of the non-survivors and survivors (Figure 2).
Scatter plots of urine PQ concentration in survivors and non-survivors.
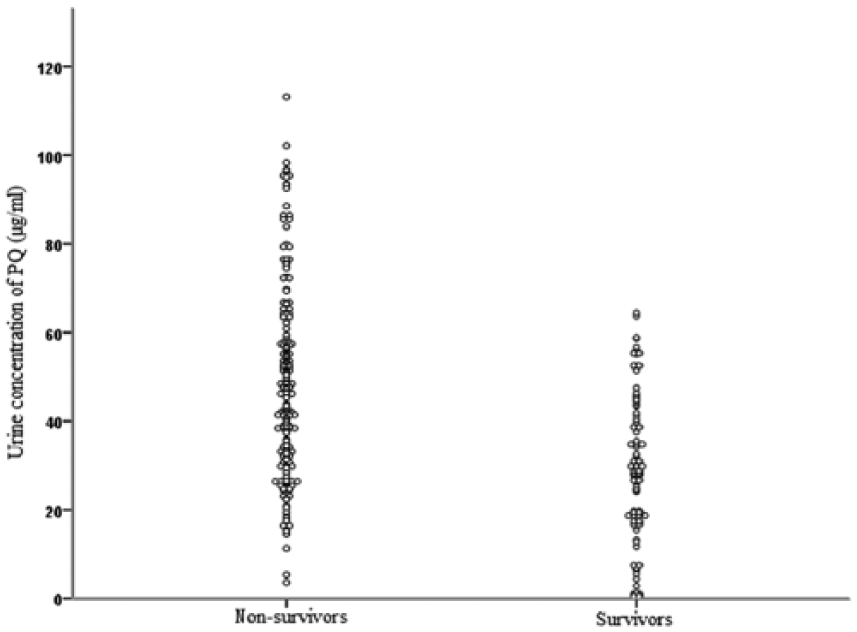
According to semi-quantitative urine dithionite test results, 6 patients with negative results died and none of the 17 patients who survived had results of 4+. The analysis revealed no significant difference in the dose of PQ ingested between the patient subsets, but the time interval between ingestion and admission, urine PQ concentration, and mortality differed significantly (p < 0.05; Table 2).
Comparisons according to semi-quantitative urine dithionite test results.
IQR: interquartile range; PQ: paraquat.
Correlation analysis between urine and plasma PQ levels
Since November 2012, plasma PQ levels were measured in 74 patients in the ED by HPLC. The plasma and urine PQ levels were measured simultaneously after admission. Correlation analysis revealed that urine PQ concentrations were positively related to plasma levels (r = 0.532, p = 0.002; Figure 3).
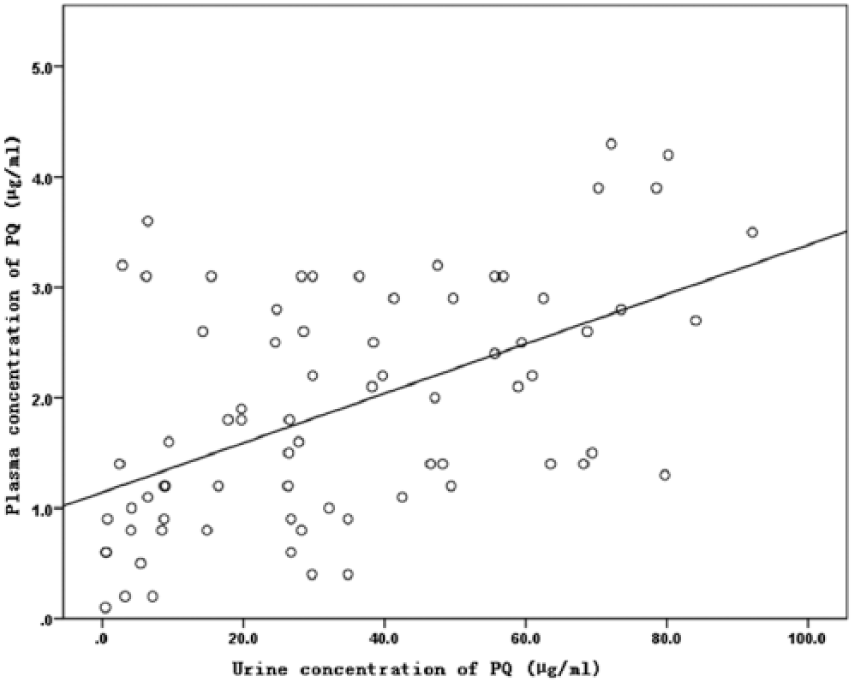
Correlation analysis of urine concentration of PQ and plasma concentration of PQ.
Clinical predictors of mortality and organ dysfunction
Multivariate logistic regression analysis was conducted to verify the significant determinants of 28-day mortality and early organ dysfunction (Tables 3 and 4). After adjusting for age, gender, and the time interval between ingestion and admission, the dose of PQ ingested, arterial lactate, and urine PQ concentration were independent risk factors predicting 28-day mortality (Table 3). During the first 7 days of hospitalization, of the 306 patients, ALI and AKI occurred in 132 (43.1%) and 237 (77.5%) patients, respectively. The time interval between ingestion and hemoperfusion, arterial lactate level, and urine PQ concentration were independent risk factors predicting AKI (Table 4), while PaCO2 and urine PQ concentration were independent risk factors predicting ALI (Table 4).
Multivariate logistic regression analysis to verify significant determinants of 28-day mortality.
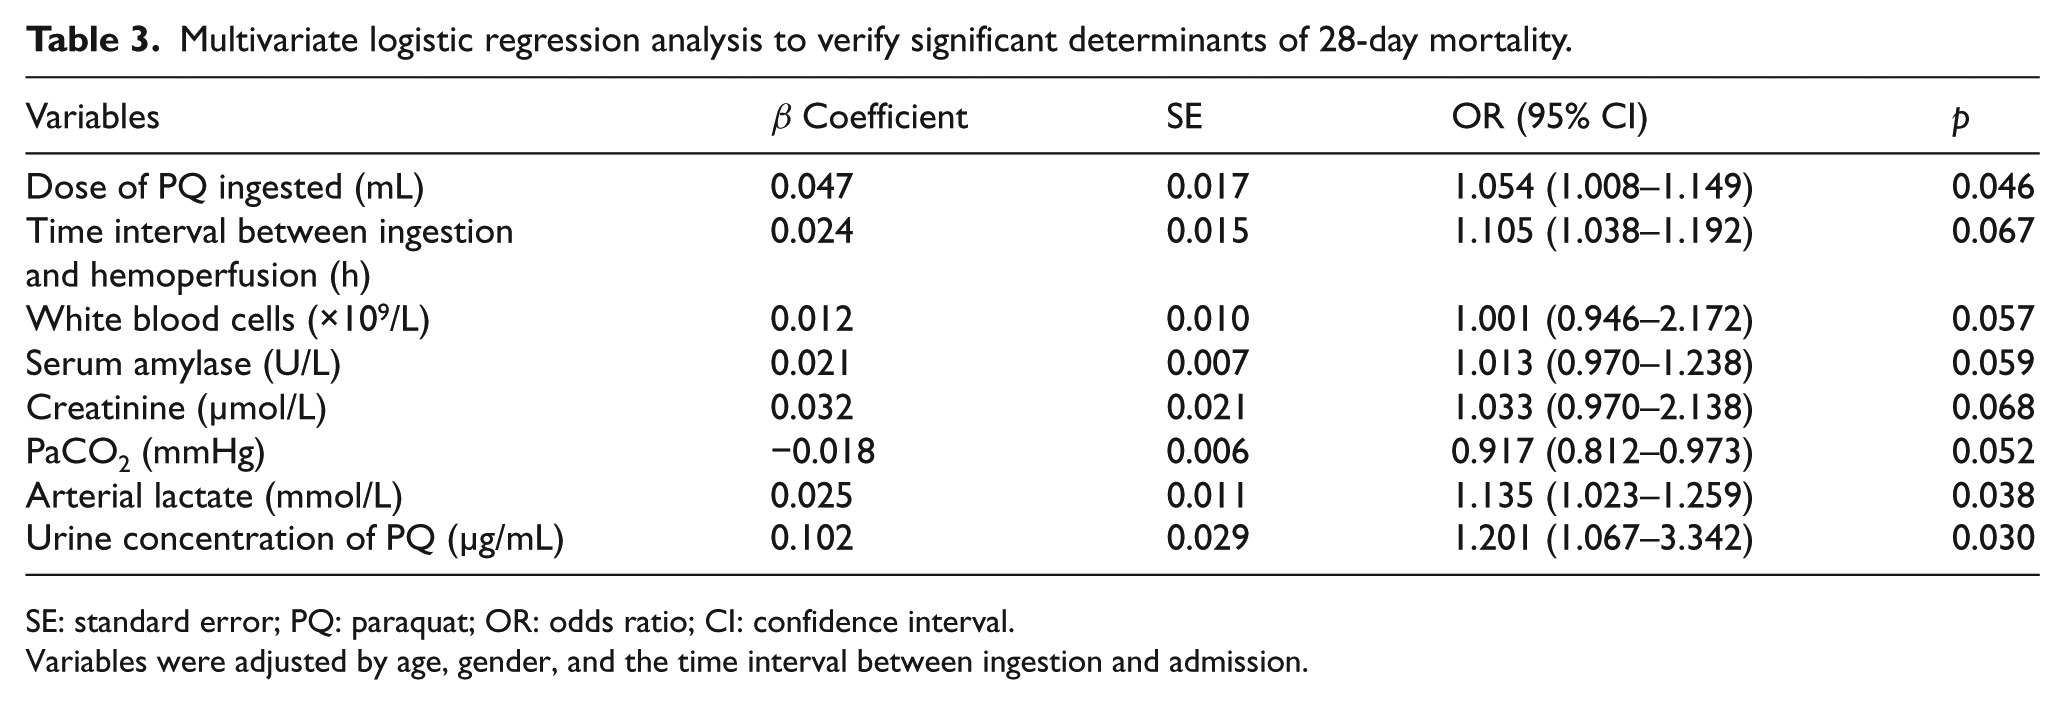
SE: standard error; PQ: paraquat; OR: odds ratio; CI: confidence interval.
Variables were adjusted by age, gender, and the time interval between ingestion and admission.
Multivariate logistic regression analysis to verify significant determinants of organ dysfunction.
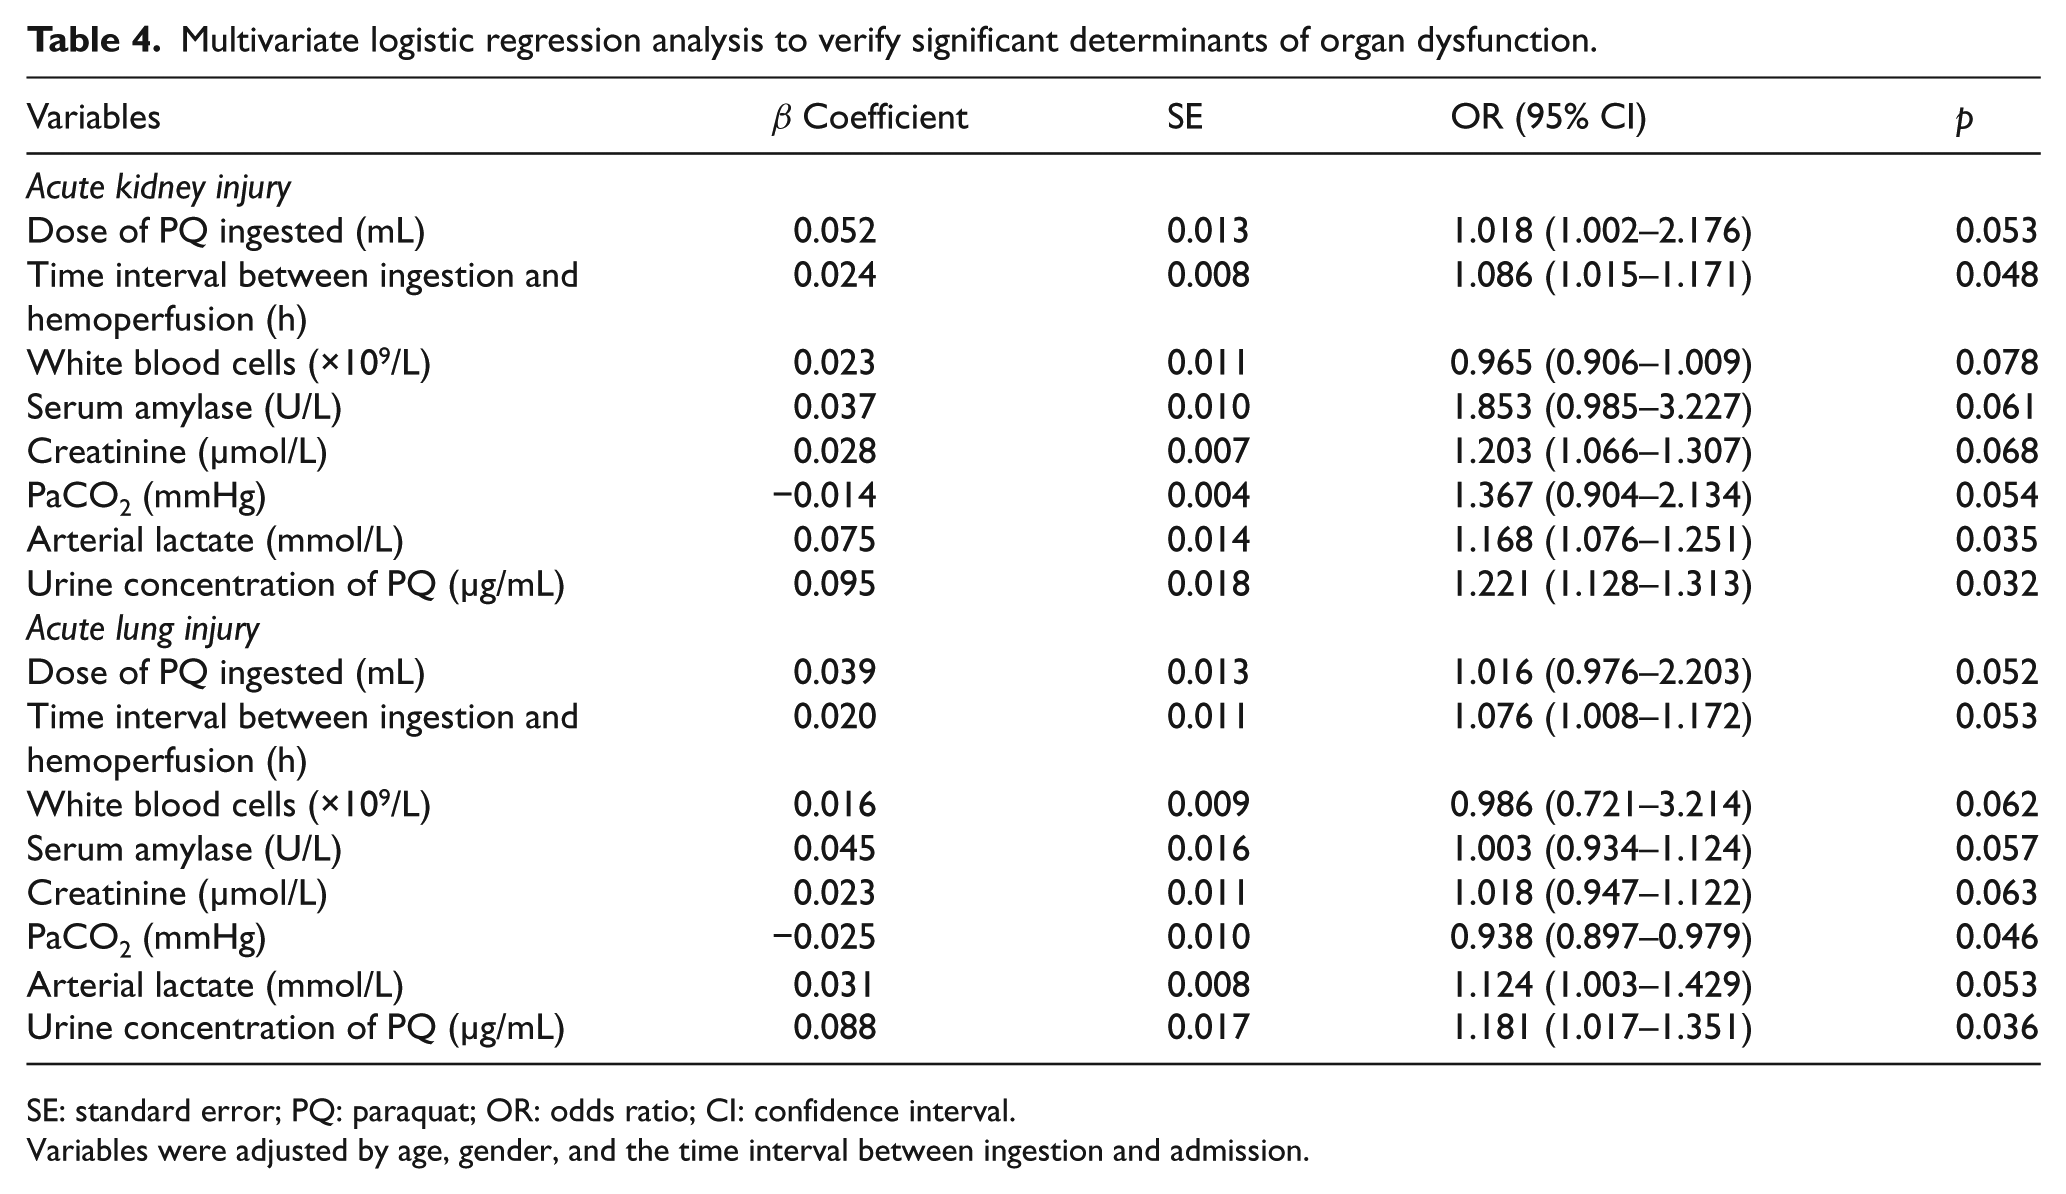
SE: standard error; PQ: paraquat; OR: odds ratio; CI: confidence interval.
Variables were adjusted by age, gender, and the time interval between ingestion and admission.
ROC curve analysis
In the ROC curve analysis, the AUC of urine PQ concentrations for predicting 28-day mortality was 0.854 with a cut-off value of 34.5 µg/mL (sensitivity = 84.8%, specificity = 42.7%, and Youden Index = 0.275; Table 5, Figure 4).
Prediction of 28-day mortality in acute PQ poisoning.
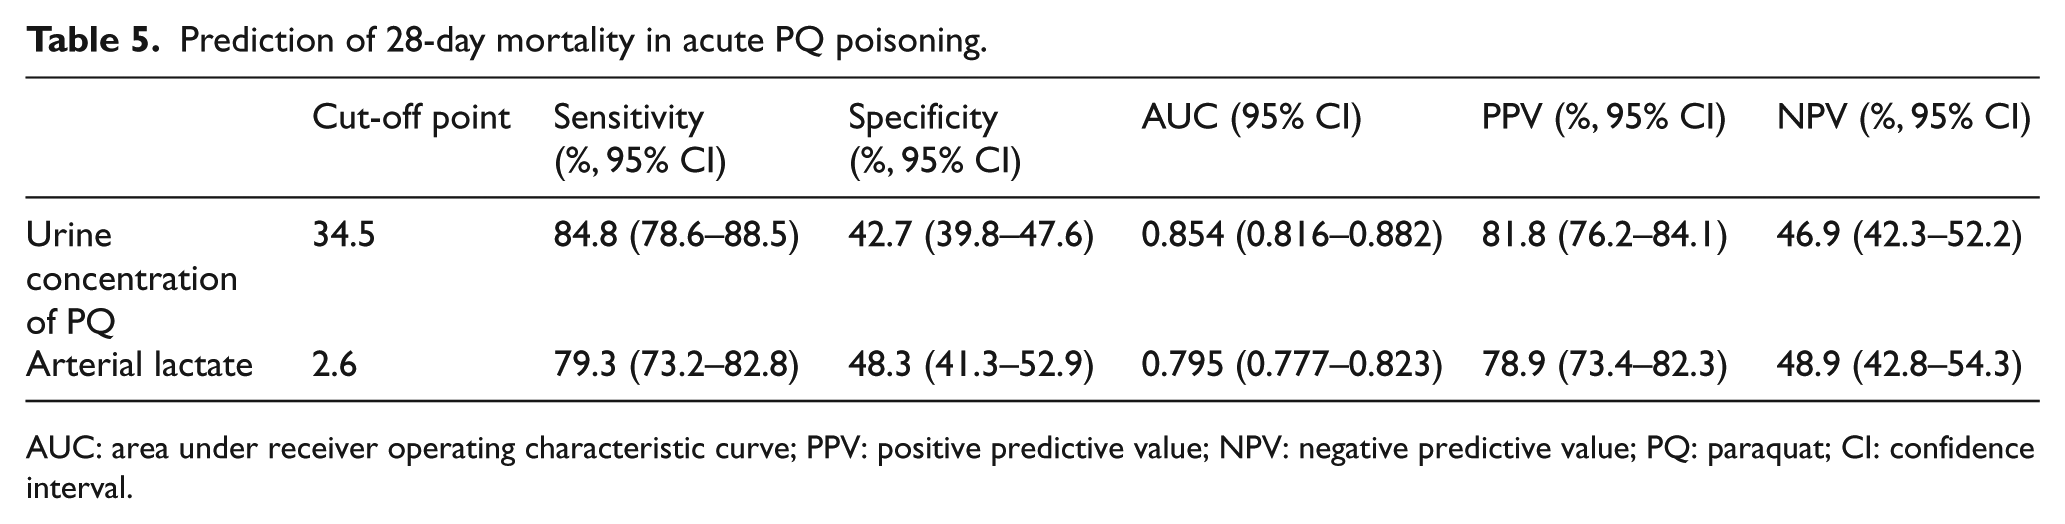
AUC: area under receiver operating characteristic curve; PPV: positive predictive value; NPV: negative predictive value; PQ: paraquat; CI: confidence interval.
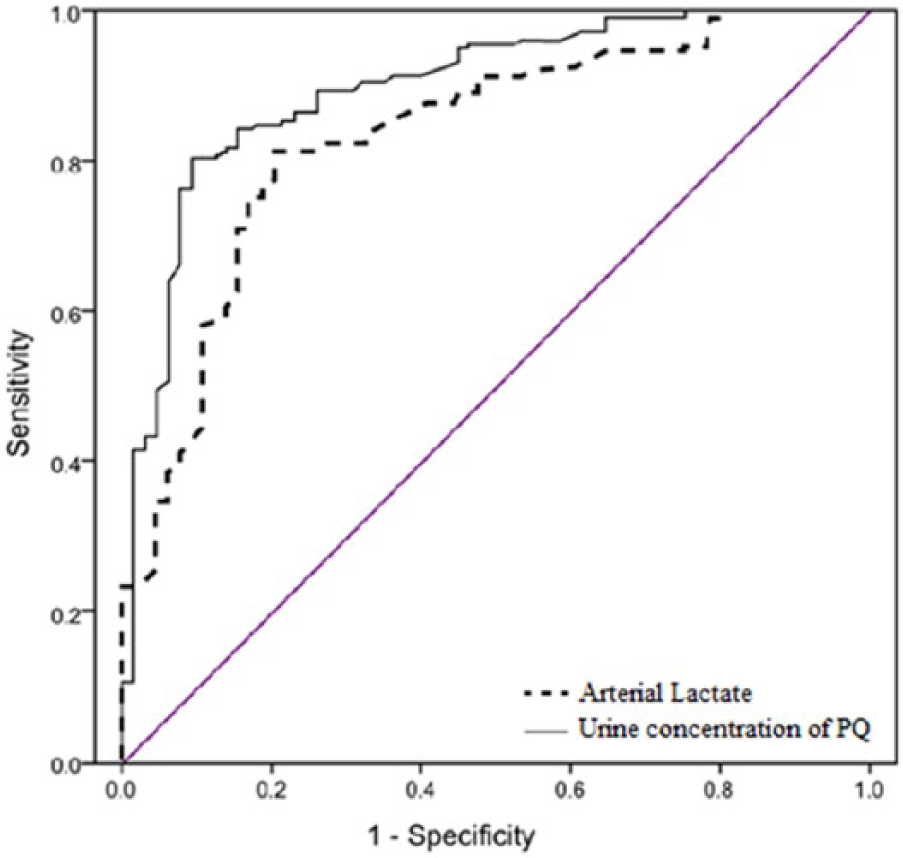
The receiver operating characteristic (ROC) curves of urine concentration of PQ and arterial lactate in PQ-poisoned patients. Urine concentration of PQ showed better discriminative power than arterial lactate.
Kaplan–Meier curve
A Kaplan–Meier curve was constructed using a log-rank test (Figure 5). The results showed that increased urine PQ concentrations were associated with increased 28-day mortality (log-rank P = 0.000).
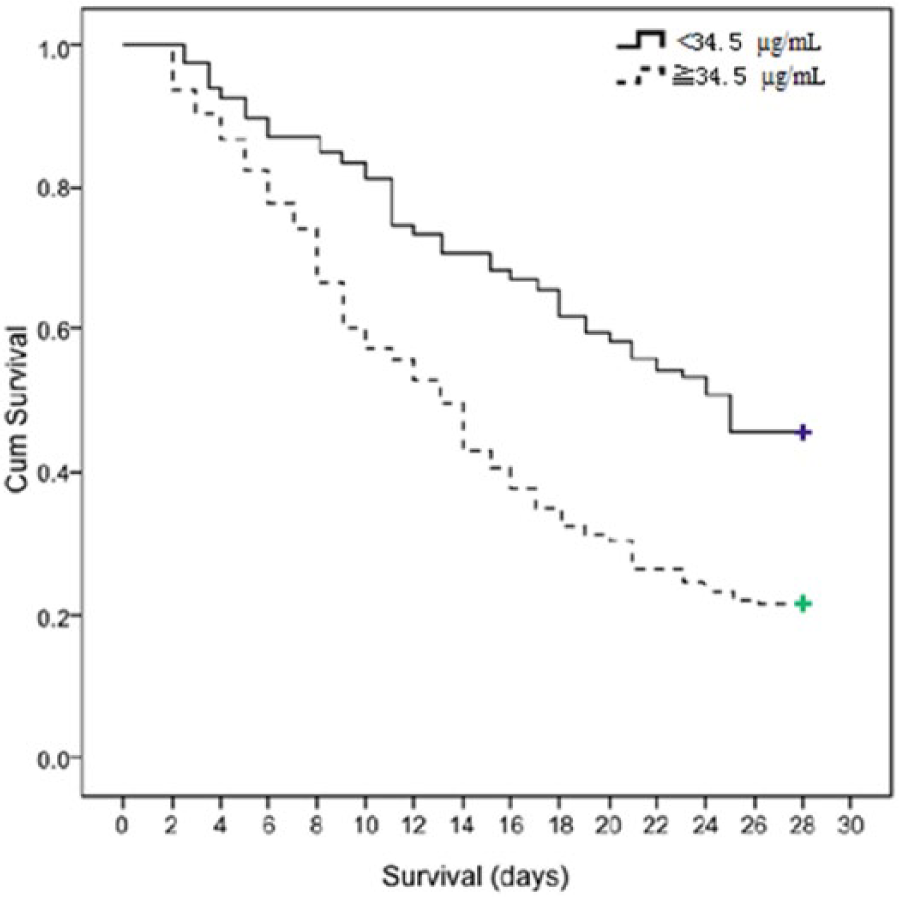
Kaplan–Meier survival analysis of PQ-poisoned patients whose urine PQ concentrations ≥34.5 µg/mL (n = 225, 51/225 = 22.7%) and those whose urine PQ concentrations <34.5 µg/mL (n = 81, 38/81 = 46.9%) (log-rank tests, χ2 = 18.024, p = 0.000, OR = 8.96, and 95% CI = 5.19–13.71.)
Discussion
The principal result of this study is that the urinary PQ concentration is an independent risk factor predicting not only death but also organ injury, particularly of the lung and kidney. A semi-quantitative test using sodium dithionite can be used as a bedside test to confirm systemic PQ toxicity. Urine samples that were obtained easily may be a suitable choice for the detection of PQ poisoning, despite the fact that individuals have different urine volumes, which may change over time. Because PQ is usually not reabsorbed by the renal tubules, with >90% of the absorbed PQ being rapidly excreted, unchanged, from the kidneys within 12–24 h after ingestion. 19 In this study, we examined urine PQ concentrations as a predictor of PQ poisoning; this method was noninvasive and did not require complex laboratory instruments. A three-compartment model best describes the subsequent distribution of PQ: 4,7,9 (1) plasma levels reach a maximum within approximately 1–1.5 h post-ingestion upon disruption of the gastric mucosal barrier; once the peak is reached, the level decreases rapidly even without extracorporeal elimination; 2) a rapid uptake and removal compartment such as the kidneys; 3) a slow uptake compartment such as the lungs, reaching a maximum concentration about 4–5 hours after ingestion, regardless of the plasma PQ level. The urinary PQ concentration may be affected by sampling time; in order to avoid this effect, we utilized strict exclusion criteria in which we excluded patients who returned urine specimen > 6 hours after ingestion. The use of randomly collected urine for testing may have been problematic for comparison; however, we avoided the influence from residual urine in the bladder by emptying the patients’ bladders when collecting fresh urine for testing. Urine PQ concentrations are useful for advising patients and making decisions on monitoring; furthermore, the results may have an essential role in guiding interventions, especially hemoperfusion (data not published). However, urine PQ concentrations may vary, even in patients that have ingested the same amount of PQ, which may be partially attributable to individual differences in absorption and expulsion but sampling time also plays an important role. In this study, six patients with negative semi-quantitative urine dithionite test results died, and the mean time interval between ingestion and urine collection was 42 min (range: 27–86 min). Thus, the dynamic monitoring of urine PQ concentrations may serve as a convenient and effective tool for determining the prognosis of PQ poisoning.
The results of this study showed that the urine PQ concentrations of non-survivors were higher than that of the survivors (47.5 ± 11.6 vs. 28.9 ± 10.7 µg/mL, P = 0.022), suggesting that the urine PQ could be a biomarker for predicting the prognosis of patients with acute PQ poisoning. Seok et al. 10 demonstrated that the time for a negative urine dithionite test is a reliable marker for predicting mortality and essential organ failure in patients with acute PQ intoxication. In ROC curve analysis, the AUC of urine PQ concentrations for predicting 28-day mortality was 0.854, indicating that urine PQ concentrations might have higher discriminative power for predicting the mortality of patients with acute PQ poisoning. Moreover, analysis of survival data showed that the mortality rates of patients with urine PQ concentrations < 34.5 µg/mL was significantly lower than those with urine PQ concentrations ≥ 34.5 µg/mL (log-rank test, χ2 = 18.024, P = 0.000, odds ratio (OR) = 8.96, 95% confidence interval (CI) = 5.19–13.71). Our survival curve analysis indicated that the survival rate drops continuously in patients with lower urine concentrations. This may be partially attributable to the relatively short follow-up period in this study, however, much of the research5,12,20 has reported acute PQ poisoning to be a progressive process, usually stopped within one month, with death relatively less often observed after one month from ingestion; thus, we choose 28 days as the follow-up period in the present study. These results revealed that urine PQ concentrations might be an important determinant of prognosis in acute PQ poisoning. Our findings are consistent with the previous hypothesis that the urine PQ concentrations had predictive powers for the prognosis of patients with acute PQ poisoning.
The results of this study revealed that urine PQ concentrations were not only higher in non-survivors compared with those in survivors but were also positively correlated with the plasma PQ concentration (r = 0.532, p = 0.002). The low correlation of urine and plasma PQ levels may be due to the three-compartment model of PQ distribution after ingestion. Plasma PQ levels cannot be checked easily and quickly in an emergency situation. Conversely, a semi-quantitative urinary sodium dithionite test on admission is a reasonable clinically useful choice and may be performed easily and quickly in an emergency situation. This method is particularly suitable for dynamic monitoring. Given the predictive power of urine PQ concentrations for evaluating the prognosis of patients with acute PQ poisoning and its correlation with the sodium dithionite test, the latter may be a simple and practical tool for assessing the severity and prognosis of PQ poisoning, which requires additional studies to confirm.
This study has several limitations. First, this was a single-center study; despite the relatively large number of cases, a multicenter randomized controlled study is necessary for further verification. Second, our conclusion can probably not be extrapolated to acute PQ poisoning patients with pre-existing kidney diseases because of the exclusion criteria in this study. Third, the specimens tested in this study were fresh urine collected by indwelling urethral catheters; some patients had urinary retention in their bladders on admission because of untimely urination, which may have affected the dithionite test results. However, whether the peak urine PQ concentration had been reached is questionable even if the interval between ingestion and sampling was within 6 h. Fourth, we did not assess the correlation between urine PQ concentration and renal clearance. The kidney is vulnerable to PQ injury and its ability to clear PQ declines with renal function decline. A rapid deterioration of renal function was commonly observed in the early stage after ingestion, especially in severe poisoning, which in turn, may, affect the amount of PQ eliminated. Fifth, in this study the plasma and urine PQ levels were measured at the same time following admission in 74 patients. Although meaningful statistical analysis could be performed, our results were probably not based on a large enough sample size to come to firm conclusions. Finally, the sodium dithionite test is a colorimetric, semi-qualitative test that uses the naked eye, with a PQ detection limit of 1.0 mg/L in this study. According to the course of the distribution of PQ after ingestion described above, the absorbed PQ was rapidly excreted from the kidneys after ingestion; however, a negative semi-qualitative test finding does not mean that there was no PQ is present in the body. Using a more sensitive method (e.g. HPLC), PQ should be detectable for a longer period of time after ingestion at concentrations below 1.0 mg/L. Accordingly, more rigorous standardization of the test is required before its clinical application.
Conclusion
The urine PQ concentrations appear to have predictive ability for the prognosis of patients with acute PQ poisoning. Urine PQ concentration may serve as a useful biomarker for assessing the severity of acute PQ poisoning. However, further studies are needed to confirm our findings.
Footnotes
Declaration of conflicting interests
The author(s) declared no potential conflicts of interest with respect to the research, authorship, and/or publication of this article.
Funding
The author(s) received no financial support for the research, authorship, and/or publication of this article.