
Abstract
Purpose
Knee joint fibrosis after anterior cruciate ligament (ACL) reconstruction causes dysfunction and requires precise quantification. Magnetic resonance imaging (MRI) is the primary method but has limitations like high cost and long scan times. Computed tomography (CT) offers better accessibility and speed, but its reliability remains unverified. This study compares CT and MRI for quantifying fibrosis volume post-ACL reconstruction.
Methods
18 fibrosis patients underwent same-day CT (1.0-mm and resliced 3.5-mm) and MRI (3.5-mm). Two observers measured fibrotic volume via three-dimensional (3D) reconstruction. Standardized regions of interest (ROI) were delineated to measure total and regional fibrotic volumes across three imaging modalities: 1.0-mm CT, 3.5-mm CT, and 3.5-mm MRI. Statistical analyses included intraclass correlation coefficient (ICC), Pearson’s correlation coefficient, Bland-Altman analysis, one-way ANOVA, and paired-sample t-tests.
Results
Both Pearson correlation coefficients and ICC values between the two observers exceeded 0.9, indicating excellent correlation and agreement. Bland-Altman analysis showed low mean inter-observer differences (−1.29% to 2.78%). For comparisons between imaging modalities with identical slice thickness (3.5-mm CT vs 3.5-mm MRI), the mean differences were minimal (−3.02% to 1.06%) with Pearson correlation coefficients >0.9. ANOVA analysis revealed no significant differences, demonstrating excellent agreement between CT and MRI. Although 1.0-mm CT did not show statistically significant differences in ANOVA analysis compared to the other two modalities, its thinner slice thickness provided more detailed visualization, resulting in significantly higher volume measurements in Bland-Altman analysis. Nevertheless, it maintained excellent correlation (Pearson’s > 0.9) with both 3.5-mm CT and MRI.
Conclusion
This study provides a method to quantify anterior knee fibrosis. CT is a feasible tool with performance comparable to MRI. Further studies are needed for multi-regional assessment and integration with other imaging or functional parameters.
Keywords
Introduction
Postoperative knee fibrosis (also termed arthrofibrosis or joint adhesion) represents a pathological condition caused by the excessive proliferation of fibrous tissue. This typically occurs during the rehabilitation process following surgical procedures or trauma, manifesting as abnormal thickening of the joint capsule and periarticular soft tissues with excessive fibrotic formation. 1 The incidence ranges from 2% to 35% following anterior cruciate ligament (ACL) reconstruction surgery.2–4 This condition not only causes pain and compromises surgical outcomes, but may also lead to permanent loss of knee range of motion (ROM), significantly impairing independent living capacity and psychological well-being, with potential long-term disability. 1 Current clinical diagnosis and evaluation primarily rely on physical examination and qualitative imaging analysis, which cannot objectively and accurately assess the degree of knee joint adhesion. Conventional ROM measurements also fail to reflect specific fibrotic characteristics. Quantitative analysis enables objective evaluation of disease severity, providing a scientific basis for personalized and precision treatment strategies.
The earliest quantitative analysis of collagen content in fibrotic tissue after ACL reconstruction was performed using histological sections. 5 However, this method requires secondary arthroscopic sampling from patients, which is invasive and limited in measurement locations, making it unsuitable for widespread clinical application. In contrast, volumetric quantitative analysis through imaging can safely, non-invasively, and comprehensively evaluate knee joint fibrosis. Magnetic resonance imaging (MRI) and computed tomography (CT) are the two most commonly used imaging modalities in clinical practice. Due to its excellent soft tissue contrast, MRI has been widely employed in quantitative studies of knee joint fibrosis. Previous research has utilized MRI to assess fibrosis severity in the infrapatellar fat pad (IPFP), 6 as well as to quantify regional thickness of fibrotic tissue and posterior joint capsule volume.7,8
However, MRI presents clinical challenges including difficult scheduling, time-consuming multi-sequence scans, and high patient costs. In comparison, CT offers advantages of lower time and financial expenditures, making it more suitable for rapid quantitative analysis in clinical settings. Researchers have successfully applied CT to quantify fibrosis in pulmonary and renal tissues, reporting that Hounsfield unit (HU) values serve as a highly sensitive marker for fibrotic tissue identification, showing strong correlation with histological scoring,9,10 Nevertheless, the efficacy of CT for quantifying knee joint fibrosis remains unexplored.
Therefore, this study aimed to establish a reproducible CT-based method for quantifying fibrotic tissue volume after ACL reconstruction, while conducting a comparative analysis with the currently prevalent MRI quantification approach to assess the feasibility of CT as a potential alternative.
Materials and methods
Study design
This cross-sectional study enrolled patients who were scheduled to undergo arthroscopic release or manipulation under anesthesia (MUA) due to post-ACL reconstruction fibrosis at Shanghai Ninth People’s Hospital between 2018 and 2022. The diagnostic criteria for postoperative knee fibrosis followed the international consensus on knee joint adhesion reported by Kalson et al. 1 Defined as: restricted knee flexion (<100°) and/or extension (>5° limitation) caused by intra-articular excessive fibrosis, while excluding malpositioned ligament reconstruction, infection (septic arthritis), pain, complex regional pain syndrome (CRPS), or other specific pathologies. All patients underwent CT and MRI scans prior to release procedures.
The experimental protocol consisted of the following steps: First, demographic and clinical data were collected, including: (1) gender; (2) age; (3) immobilization duration after ACL reconstruction; (4) time interval between ACL reconstruction and imaging examination (to determine disease course); (5) time gap between CT and MRI scans; and (6) whether concomitant procedures were performed during ACL reconstruction. The original CT images had a slice thickness of 1.0 mm, while MRI scans were acquired at a 3.5 mm slice thickness. To ensure comparability between CT and MRI data, the original 1.0-mm CT images were resliced to 3.5-mm thickness. Subsequently, fibrotic tissue segmentation and reconstruction were performed using three imaging modalities: 1.0-mm CT, 3.5-mm CT, and 3.5-mm MRI. To validate the reproducibility of the segmentation and reconstruction methods, two independent observers with biomedical engineering backgrounds conducted the analyses. Both observers had received specialized training in medical imaging analysis from a senior physician with over 10 years of experience, completing three dedicated training sessions prior to this study. Inter-observer agreement was systematically evaluated. Inclusion Criteria: (a) Patients aged 18–65 years; (b) Primary surgical procedure: arthroscopic ACL reconstruction, with possible concomitant collateral ligament or meniscal surgery; (c) No history of injury or surgery in the contralateral knee; (d) Postoperative duration ≤6 months, with CT and MRI scans performed within 1 week of each other. Exclusion Criteria: (a) Imaging-confirmed significant joint effusion; (b) Pre-existing knee osteoarthritis or systemic diseases; (c) History of multiple knee surgeries; (d) Concurrent extracapsular trauma or surgical history; (e) Heterotopic ossification or graft malposition; (f) Postoperative complications: joint infection, delayed fracture union, or osteoporosis; (g) Ipsilateral lower limb joint (hip or ankle) injuries.
Image acquisition
CT scans were performed on bilateral knee joints (General Electric Healthcare Systems, Milwaukee, WI, USA) with a 30 cm display field of view, 1.0 mm slice thickness, and 512 × 512 pixel resolution, while patients maintained full knee extension.
For MRI examinations, the affected knee was scanned using a 1.5-T clinical MRI system (Siemens Avanto, Erlangen, Germany) with patients in a supine position, feet-first orientation, and the knee stabilized at 15° flexion. The MRI protocol included: (1) Turbo Spin Echo (TSE) proton density-weighted imaging (PDWI) fat-suppressed sequence (sagittal): TR = 4500 ms, TE = 7.9 ms, FOV = 160 mm × 160 mm, slice thickness = 3.5 mm, matrix size = 256 × 192; (2) Spin Echo (SE) T1-weighted sequence (sagittal): TR = 420 ms, TE = 11 ms, FOV = 160 mm × 160 mm, slice thickness = 3.5 mm, matrix size = 256 × 192; (3) Turbo Spin Echo (TSE) T2-weighted fat-suppressed sequence (coronal): TR = 4820 ms, TE = 71 ms, FOV = 180 mm × 180 mm, slice thickness = 3.0 mm, matrix size = 256 × 192; (4) T2-weighted Blade fat-suppressed sequence (axial): TR = 4000 ms, TE = 94 ms, FOV = 170 mm × 170 mm, slice thickness = 3.0 mm, matrix size = 320 × 320 mm (Table 1).
Three-dimensional (3D) reconstruction procedures
All imaging data were processed using medical image 3D visualization software (Amira v.6; FEI, Hillsboro, OR, USA) to generate 3D bone models and fibrotic tissue models. For CT image processing, soft tissue differentiation was initially performed by applying appropriate Hounsfield unit (HU) threshold ranges based on soft tissue windows (Figure 1(a)). According to previous studies, the HU values were approximately 20–75 for fibrotic tissue, −155 to 0 for adipose tissue, and around 0 for synovial fluid,
11
while more dense tendons showed HU values of 75–115.
12
By setting the threshold range at 20–75 HU, we found that it could completely cover fibrotic regions while excluding nearly all adipose tissue. Since the main portions of the quadriceps tendon, patellar tendon, and cartilage contain dense collagen fibers, they were also excluded from this threshold range (Figure 1(b)). A senior physician then delineated and labele residual structures beyond threshold exclusion (quadriceps/patellar tendons, peripheral cartilage, and partial muscle/skin regions) for manual segmentation. After sagittal plane segmentation, multiplanar verification was conducted through affected-unaffected side comparisons in the coronal and axial planes, yielding the final fibrotic tissue segmentation mask (Figure 1(c)). Manual segmentation workflow for fibrotic tissue in CT and MRI. (a) CT soft tissue window (sagittal plane); (b) Initial fibrotic tissue identification using HU threshold (20–75) in CT; (c) Final manually segmented fibrotic tissue in CT; (d) MRI T1-weighted sequence (sagittal plane); (e) Fibrotic tissue identification using Gv threshold (324–900) in MRI; (f) Final manually segmented fibrotic tissue in MRI.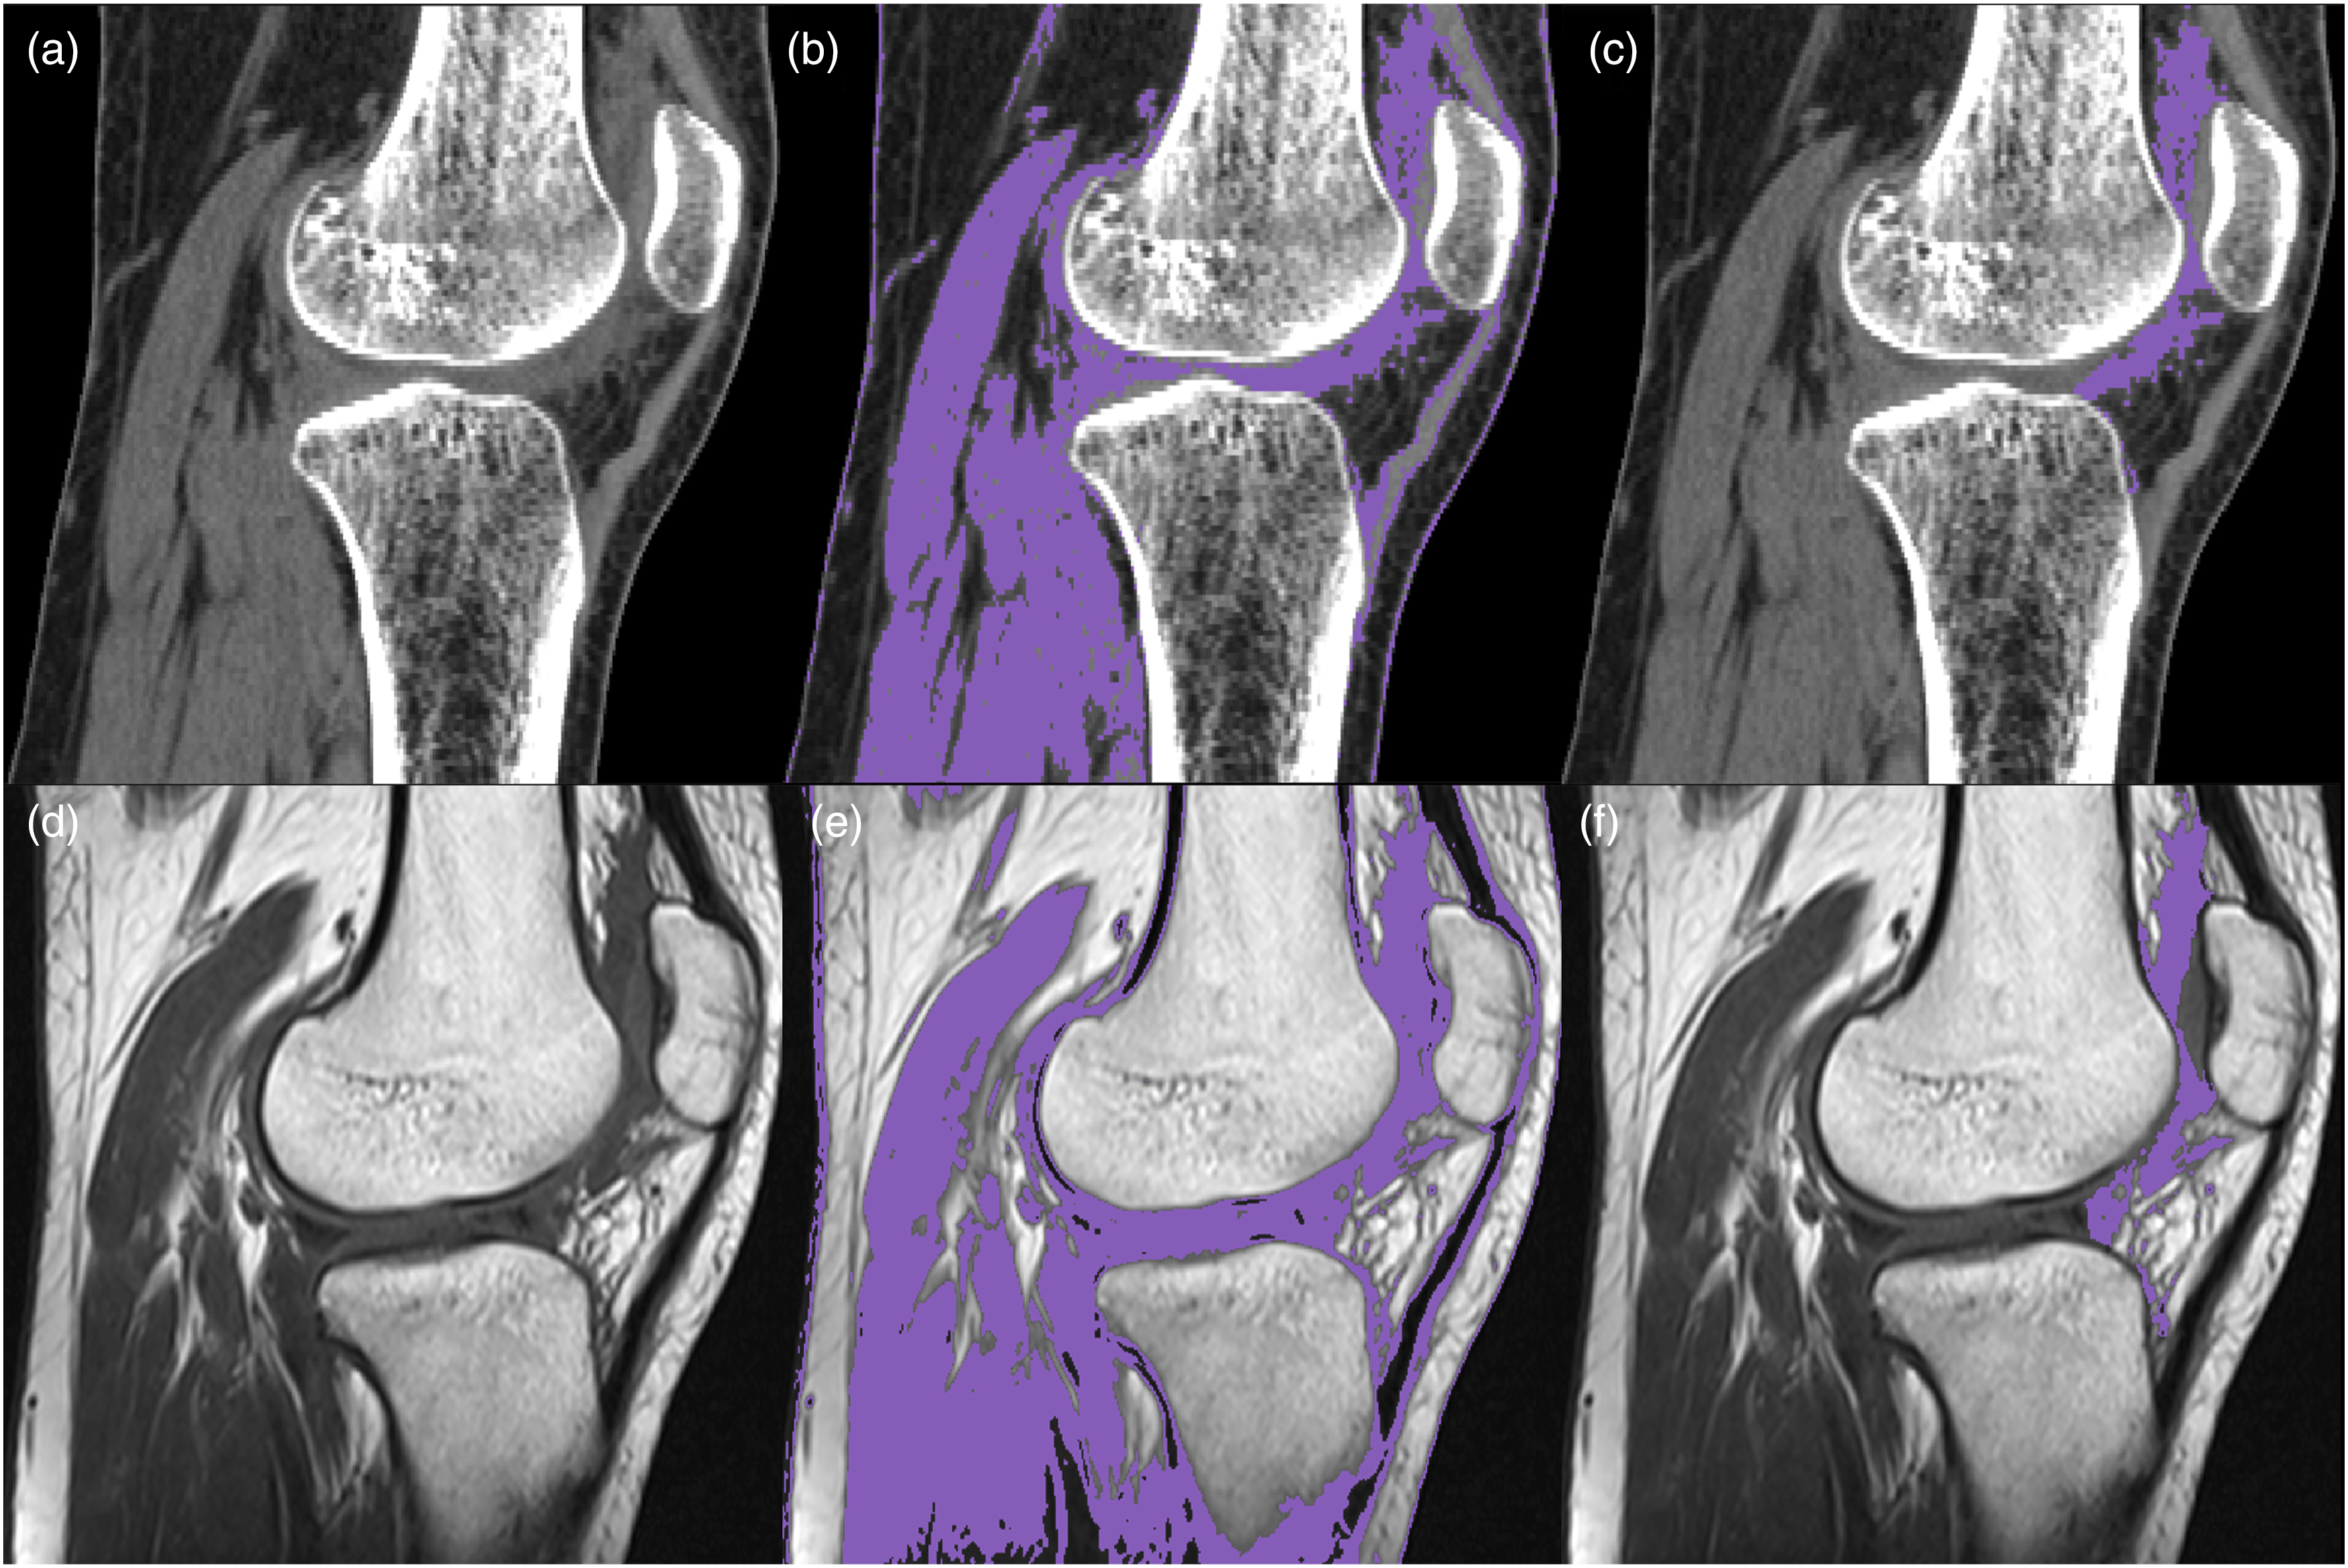
Currently, there are no established reports on the gray value (Gv) range for fibrotic tissue in MRI. However, based on the contrast characteristics of soft tissues in T1-weighted sequences (Figure 1(d)), fibrotic tissue can still be clearly distinguished from surrounding normal soft tissues.
8
In this study, we employed a Gv range of 324–900 for initial identification. This threshold selection was based on the following criteria: (1) encompassing all visually discernible fibrotic low-signal regions, and (2) maximally excluding normal soft tissues (e.g., tendons, ligaments, and adipose tissue). Following threshold application, the main portions of quadriceps tendon, patellar tendon, and nearly all adipose tissue were effectively excluded, demonstrating similar efficacy to the preliminary CT thresholding results (Figure 1(e)). The same physician then verified the extent of residual structures (tendons, cartilage, etc.), followed by manual multiplanar segmentation of these redundant tissues in the sagittal plane, ultimately generating the fibrotic tissue segmentation mask in MRI (Figure 1(f)). A subsequent 3D reconstruction of the mask yielded the final fibrotic tissue model (Figure 2). 3D reconstructed models of fibrotic tissue derived from CT (a) and MRI (b).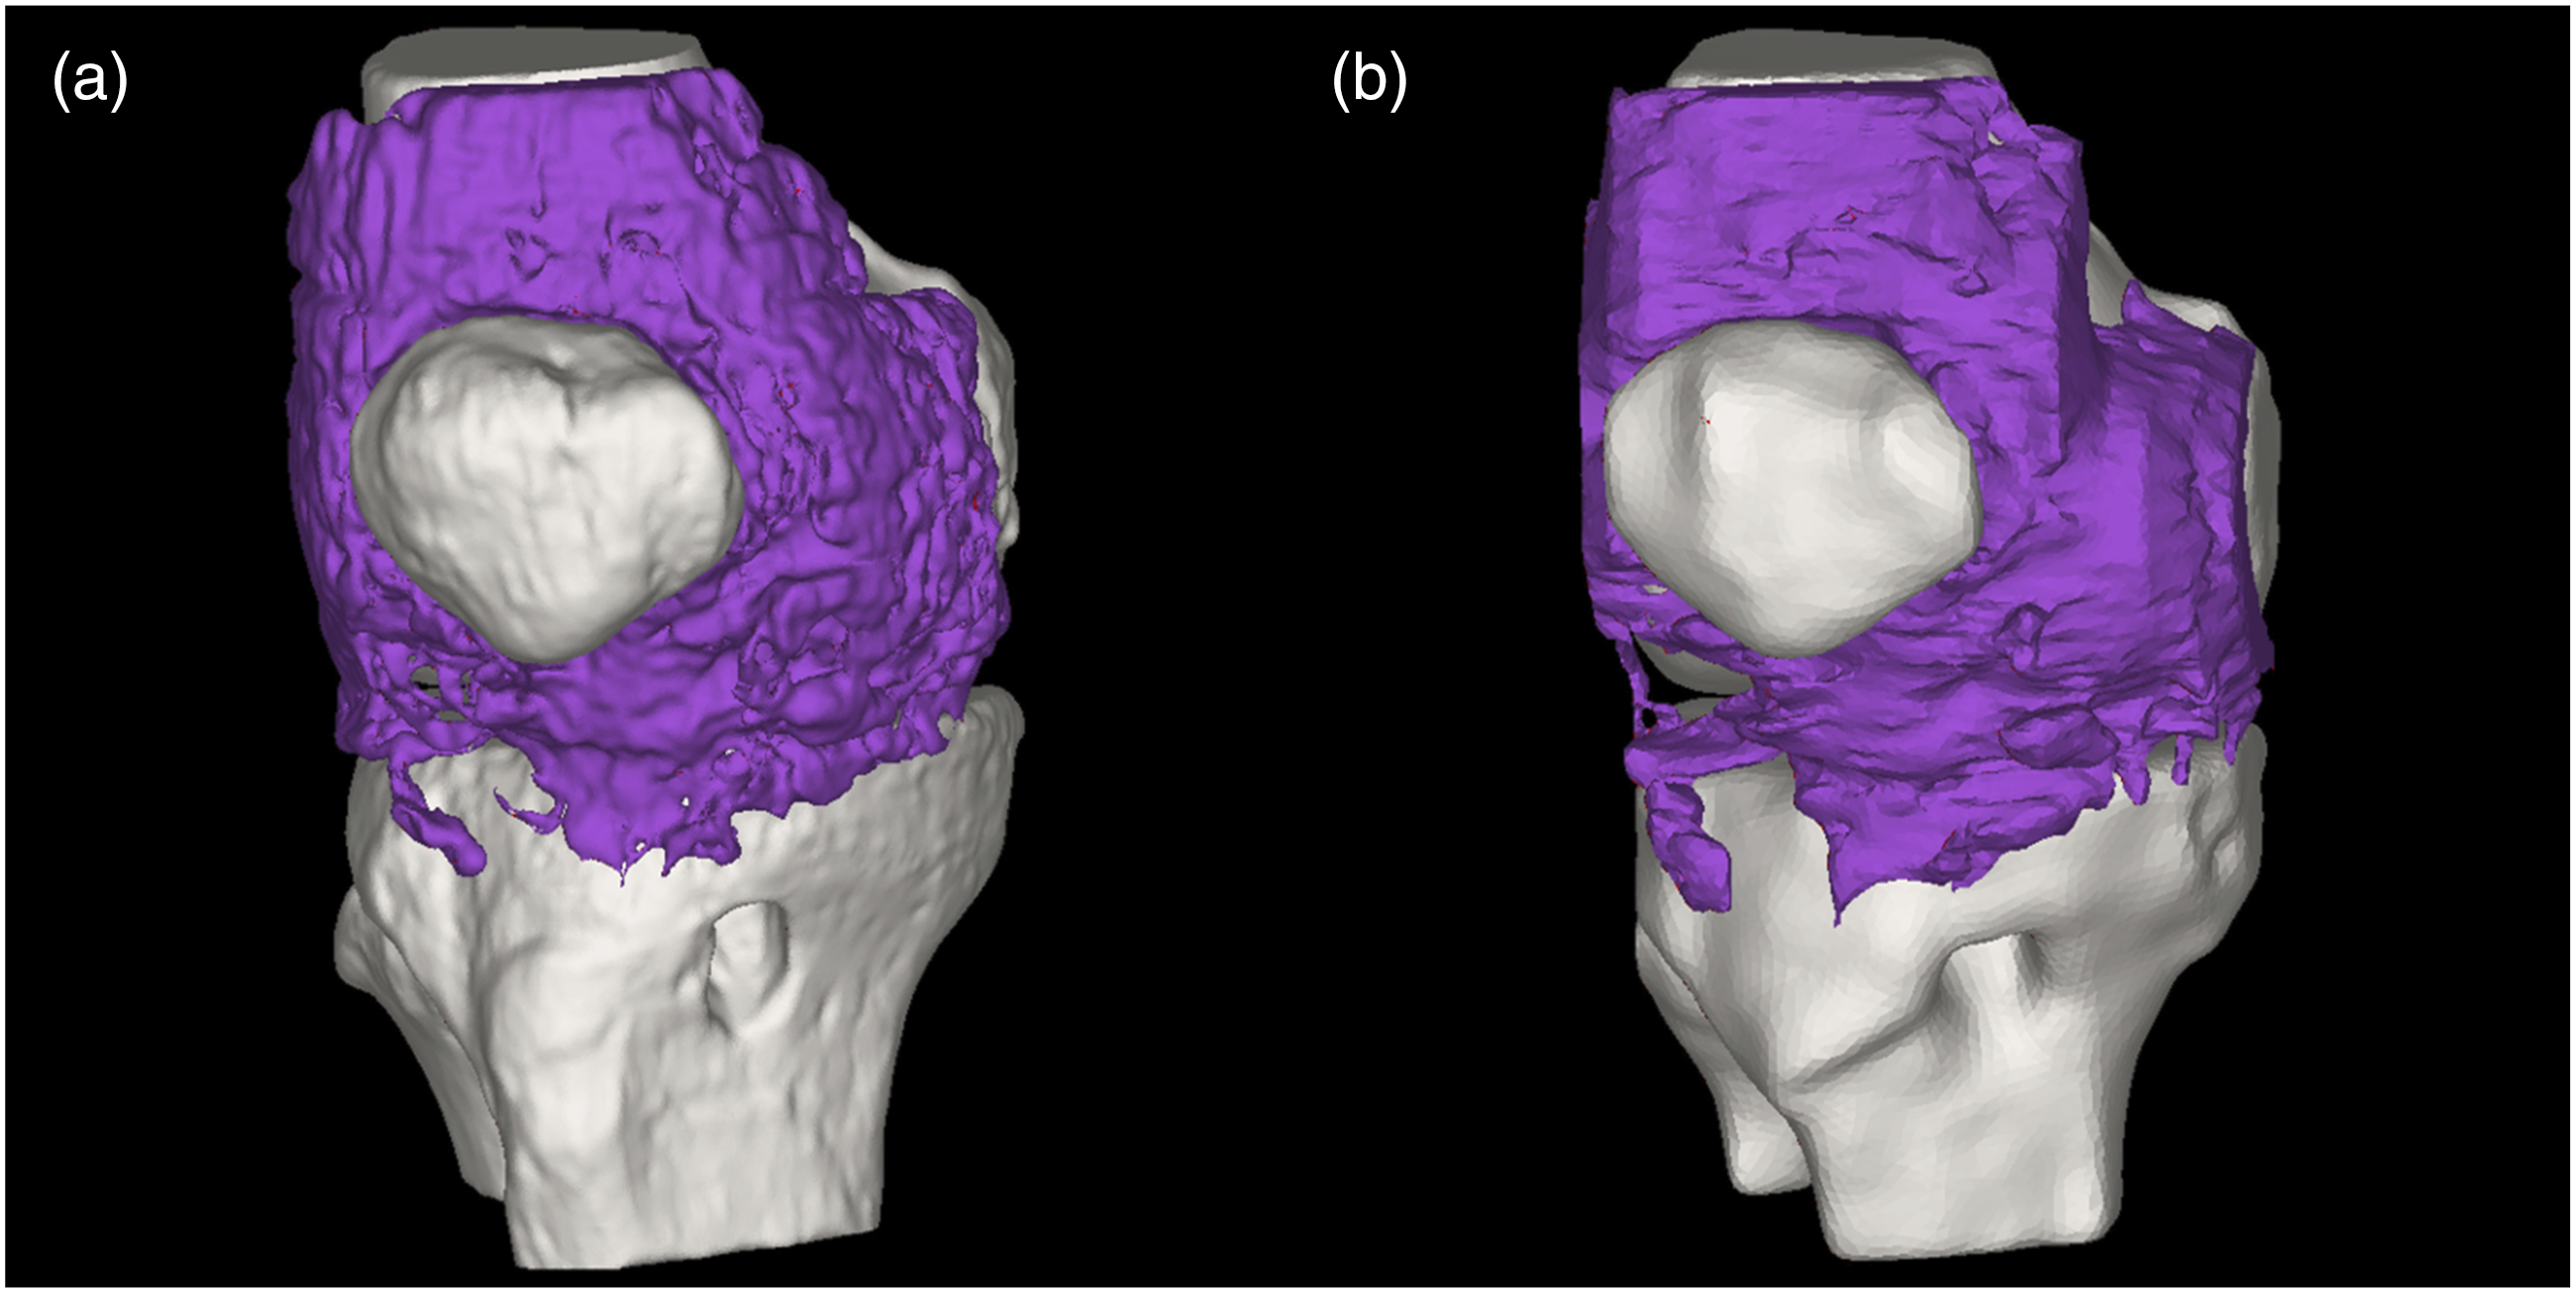
Standardized regions of interest (ROI) selection
A standardized ROI selection protocol was developed to quantify post-ACL reconstruction intra-articular fibrosis volume and enable cross-modality comparison between CT and MRI. The ROI boundaries were defined according to anatomical structures. The anterior boundary was delineated along the quadriceps tendon and patellar tendon, with careful exclusion of any fibrotic tissue present in the cutaneous layers. Posteriorly, the boundary was established immediately anterior to the graft tunnel to prevent potential segmentation errors that might arise from the indistinct tissue boundaries often observed posterior to the tunnel (Figure 3(a) and (b)). To address variations in femoral coverage between CT and MRI acquisitions in the sagittal plane, precise anatomical landmark-based registration was performed. This process utilized 3D alignment of the femoral models reconstructed from both CT and MRI datasets, establishing a consistent superior boundary at a matched femoral level (Figure 3(c)). The inferior boundary was positioned at the tibial tubercle where the patellar ligament inserts, while the lateral boundaries were demarcated by both the medial and lateral femoral epicondyles. Throughout this process, fibrotic tissue involvement in cutaneous layers was systematically excluded (Figure 3). For detailed anatomical analysis, the reconstructed 3D fibrotic tissue model was divided into superior and inferior subregions using a transverse plane through the midpoint between the medial and lateral femoral epicondyles (Figure 4). Consistent epicondylar localization between CT and MRI was ensured by rigid registration of femoral landmarks (Figure 3(c)). ROI selection and anatomical registration. (a, b) Consistent ROI delineation in CT and MRI segmentation masks; (c) Unified superior ROI boundary determination through spatial registration of CT-reconstructed (red) and MRI-reconstructed (gray) femoral models, with consistent medial/lateral epicondyle labeling (green points). Bipartition of the 3D fibrosis model into upper/lower subregions using a standardized transverse plane. (a) CT fibrosis model segmentation; (b) Upper subregion of CT model; (c) Lower subregion of CT model; (d) MRI fibrosis model segmentation; (e) Upper subregion of MRI model; (f) Lower subregion of MRI model.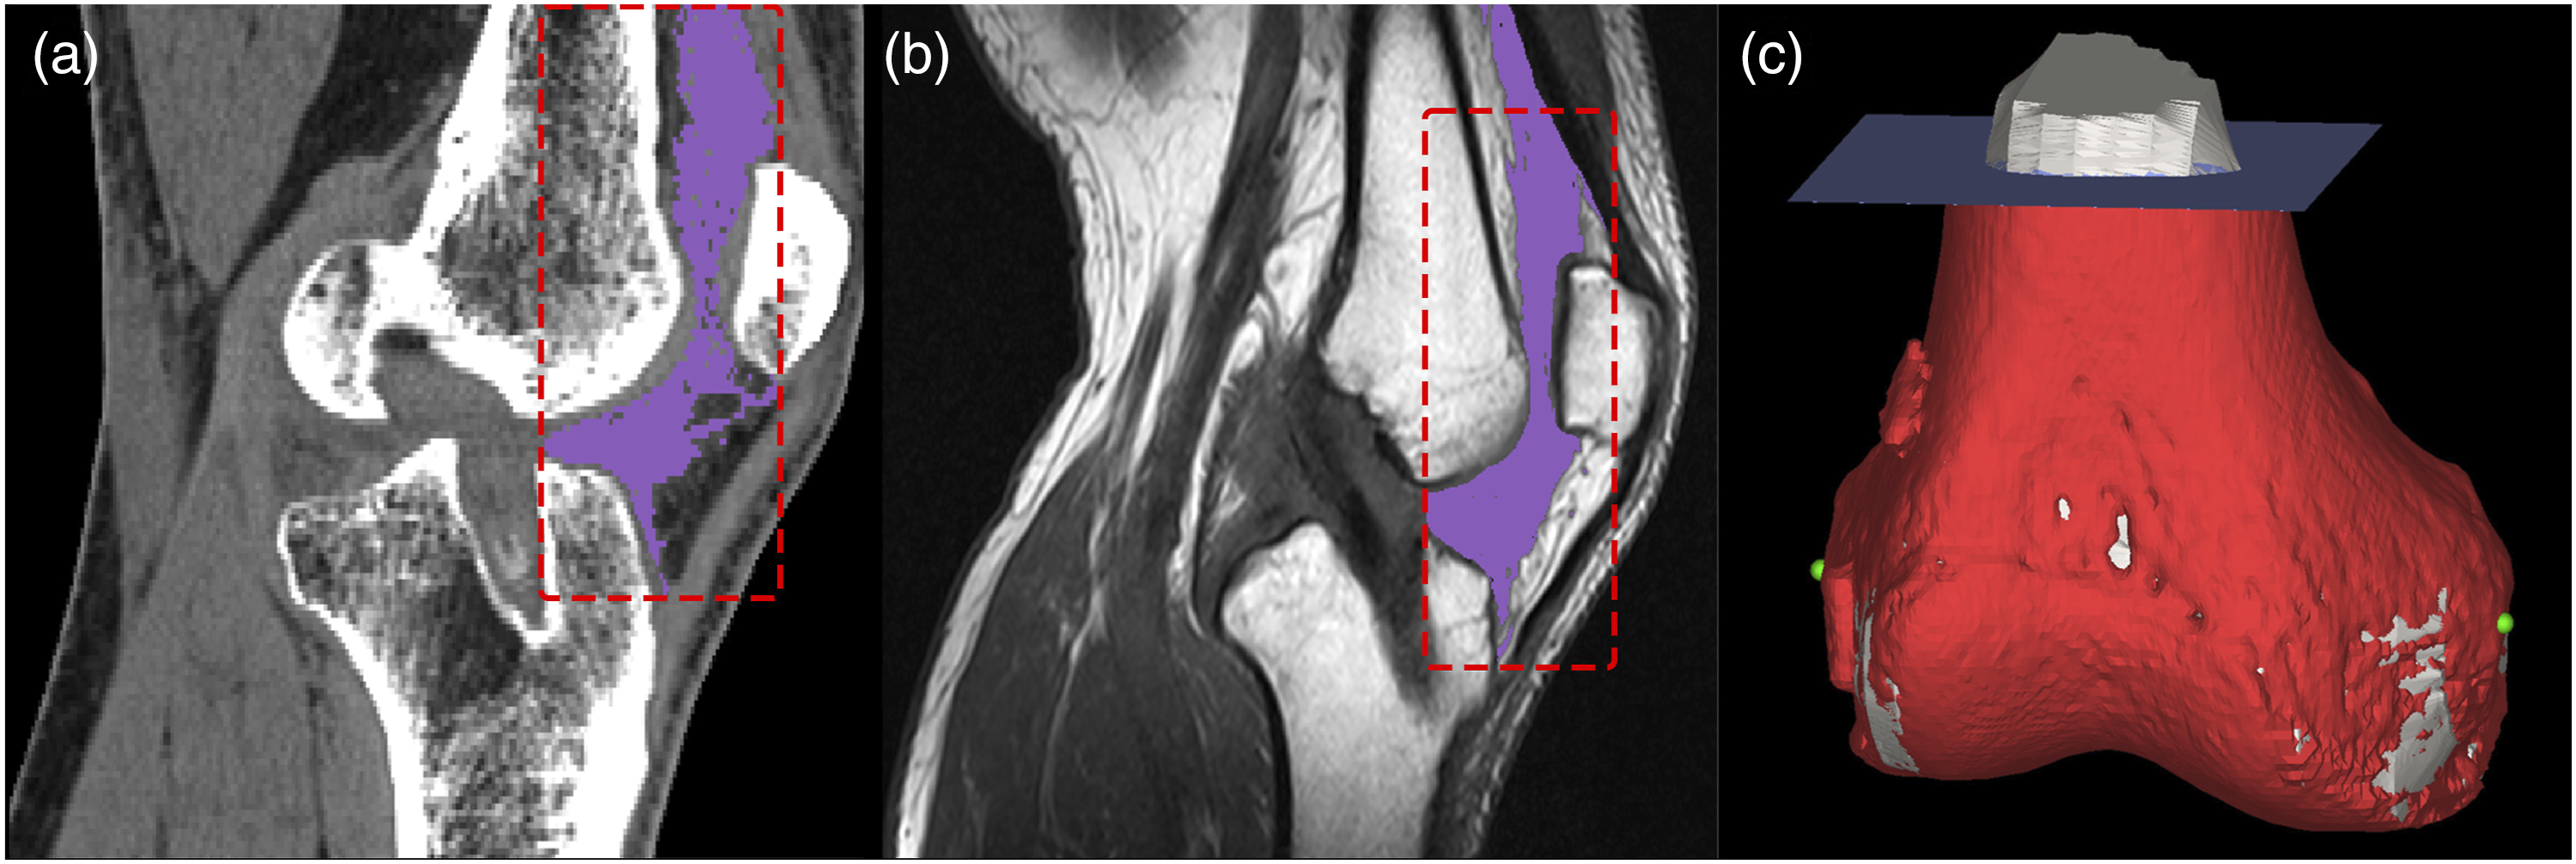

Statistical analysis
Imaging acquisition parameters.

Abbreviations: NA: not applicable; FS: Fat saturation; TSE: Turbo spin echo; SE: Spin echo.
Results
Quantification of knee fibrosis volume
Clinical information of patients with knee fibrosis.
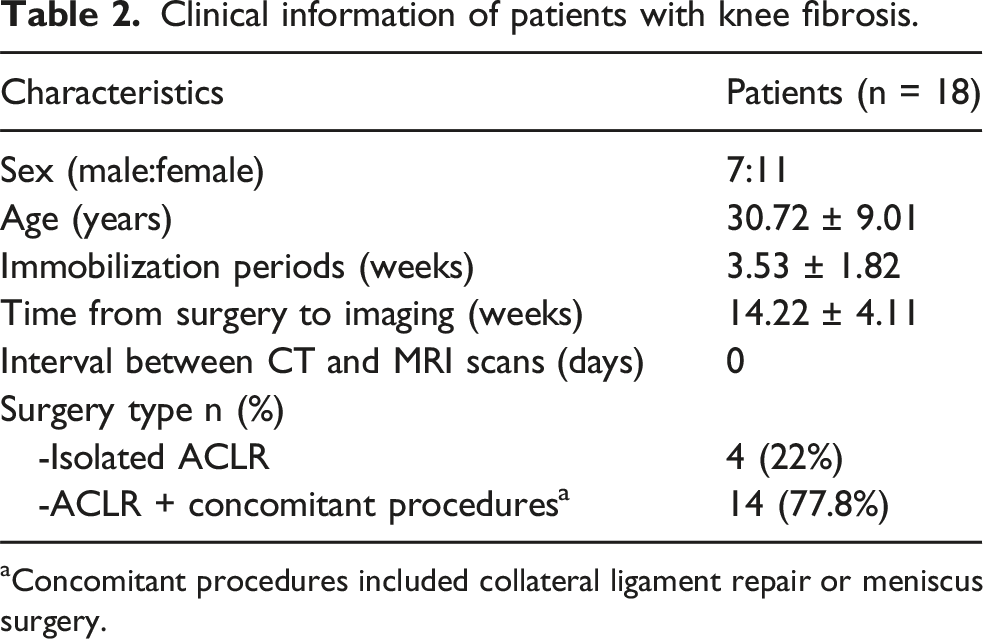
aConcomitant procedures included collateral ligament repair or meniscus surgery.
Mean and standard deviation of fibrotic tissue volumes (TV, UV, and LV) measured by CT and MRI.
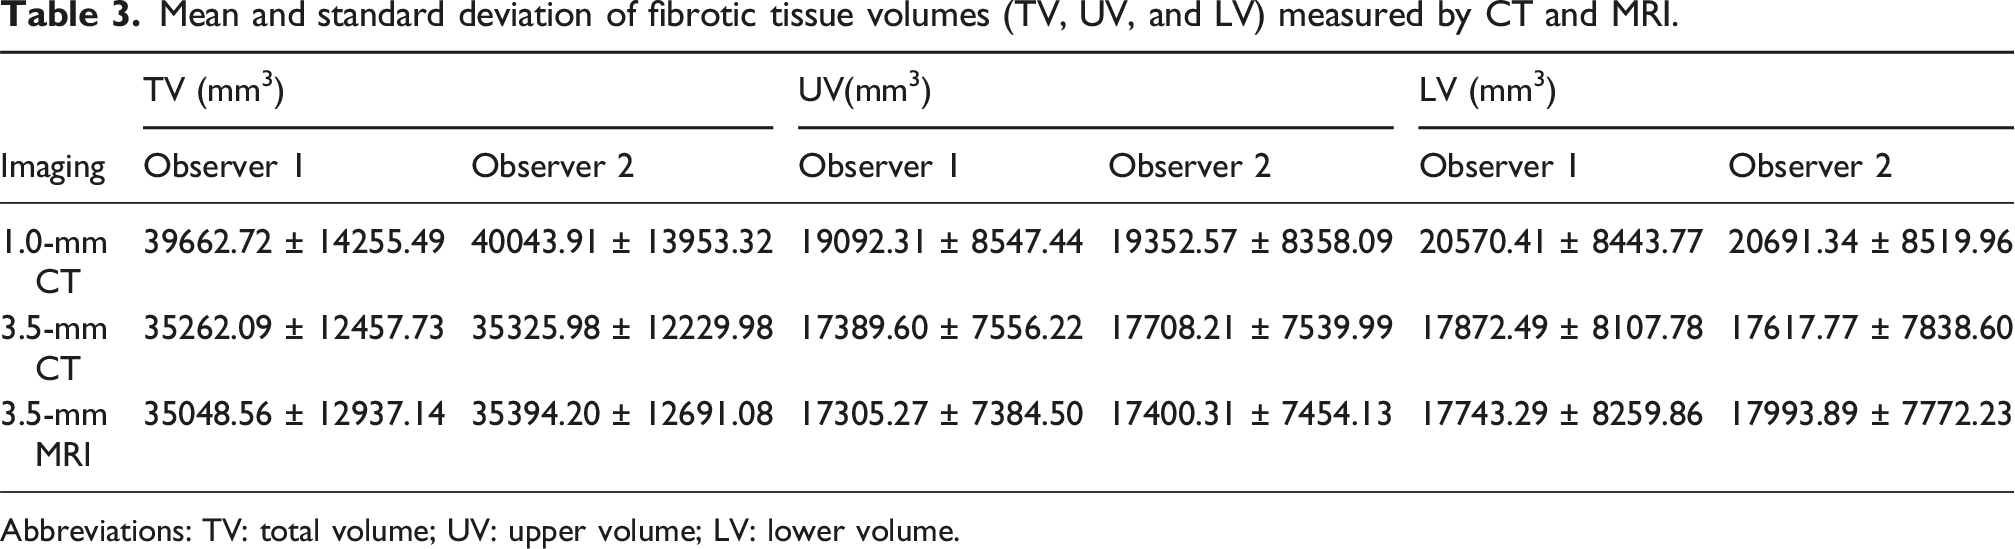
Abbreviations: TV: total volume; UV: upper volume; LV: lower volume.
Interobserver reproducibility
Reproducibility of TV, UV, and LV measured by two observers within the same imaging modalities.

Abbreviations: TV: total volume; UV: upper volume; LV: lower volume; ICC: intraclass correlation coefficient; BALA: Bland-Altman limits of agreement (%); Pearson: Pearson’s correlation coefficients.
aNumbers in parentheses denote 95% confidence intervals.
bMean bias in the Bland-Altman analysis for fibrotic tissue volume measurements of the knee between two observers.
cNumbers in brackets denote 95% limits of agreement of the Bland-Altman analysis.
dPearson’s correlation coefficients measured by two observers.
Results of paired t-test comparing mean knee stiffness measured by two observers. Level of significance was defined by p < 0.05.

Bland‒Altman analysis between the two observers, showing reproducibility and differences. (a–c) Volume deviations for the anterior knee’s TV, UV, and LV observed on 1.0-mm CT by the two observers, (d–f) deviations observed on 3.5-mm CT, whereas (g–i) deviations observed on 3.5-mm MRI. The green dashed lines indicate the mean bias between the two observers, whereas the red dashed lines represent the 95% limits of agreement in the Bland‒Altman analysis (±1.96 SD).
Intermodality agreement
Agreement of measurements across three imaging modalities (1.0-mm CT, 3.5-mm CT, 3.5-mm MRI) by the same observer.

Abbreviations: TV: total volume; UV: upper volume; LV: lower volume; BALA: Bland-Altman limits of agreement (%); Pearson: Pearson’s correlation coefficients.
aMean bias in the Bland-Altman analysis for fibrotic tissue volume measurements of the knee obtained from 1.0-mm CT, 3.5-mm CT, and 3.5-mm MRI.
bNumbers in brackets denote 95% limits of agreement of the Bland-Altman analysis.
cPearson’s correlation coefficients between pairwise comparisons of 1.0-mm CT, 3.5-mm CT, and 3.5-mm MRI.
Results of one-way ANOVA comparing mean fibrotic tissue volume of the knee measured by 1.0-mm CT, 3.5-mm CT, and 3.5-mm MRI. Level of significance was defined by p < 0.05.
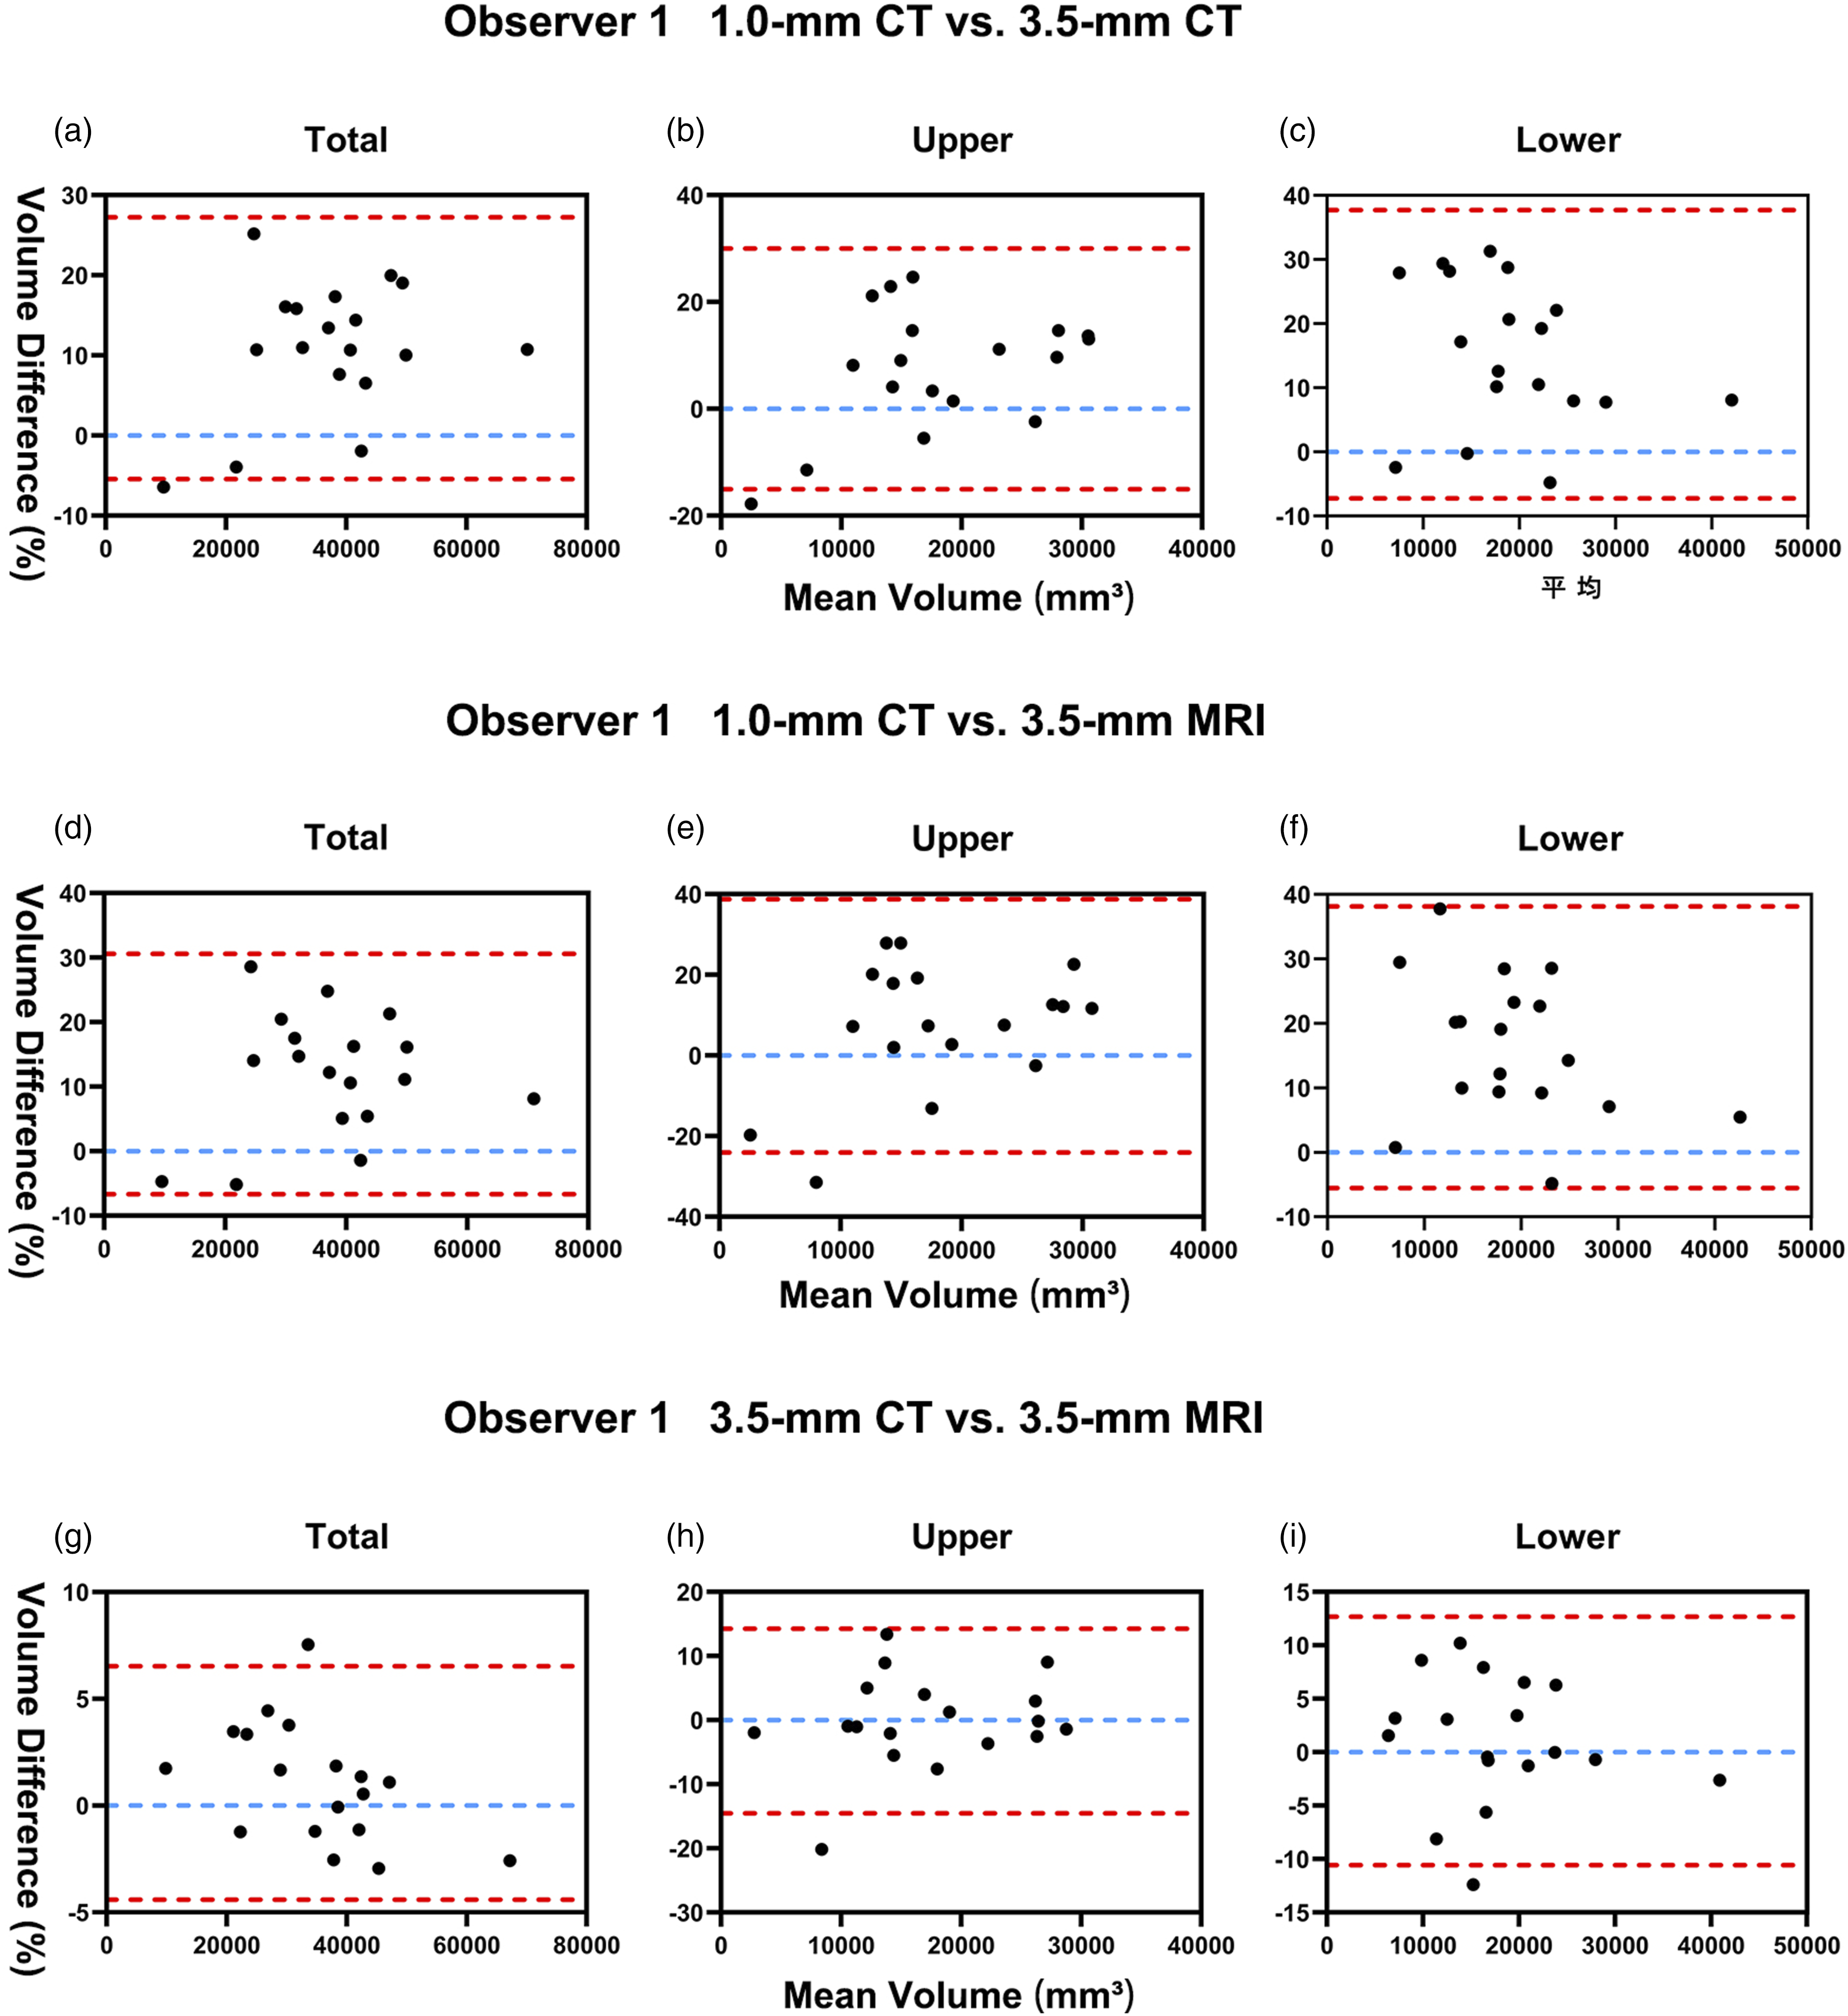
Observer 1 conducted Bland‒Altman pairwise comparisons among 1.0-mm CT, 3.5-mm CT, and 3.5-mm MRI. (a–c) Volume deviations (TV, UV, LV) of the anterior knee between 1.0-mm CT and 3.5-mm CT; (d–f) Deviations between 1.0-mm CT and 3.5-mm MRI; (g–i) Deviations between 3.5-mm CT and 3.5-mm MRI. Blue dashed lines indicate the mean bias between modalities; Red dashed lines represent the 95% limits of agreement (±1.96 SD).

Observer 2 conducted Bland‒Altman pairwise comparisons among 1.0-mm CT, 3.5-mm CT, and 3.5-mm MRI. (a–c) Volume deviations (TV, UV, LV) of the anterior knee between 1.0-mm CT and 3.5-mm CT; (d–f) Deviations between 1.0-mm CT and 3.5-mm MRI; (g–i) Deviations between 3.5-mm CT and 3.5-mm MRI. Blue dashed lines indicate the mean bias between modalities; Red dashed lines represent the 95% limits of agreement (±1.96 SD).
Discussion
This study presents the first quantitative comparison of post-ACL reconstruction knee fibrosis volumes using both CT and MRI, incorporating a standardized ROI delineation protocol. A comprehensive evaluation was performed assessing both interobserver reproducibility for total, upper, and lower fibrotic tissue volumes and intermodality agreement among 1.0-mm CT, 3.5-mm CT, and 3.5-mm MRI. The results showed excellent interobserver reliability (ICC and Pearson coefficients >0.9 for all modalities), with Bland-Altman analysis further confirming minimal interobserver differences (mean bias ≤3.08%; Table 3), confirming the high reproducibility of our measurement methodology. For modalities with identical slice thickness (3.5-mm CT vs 3.5-mm MRI), the mean intermodality differences were clinically negligible (≤3.02%; Table 4), indicating that CT demonstrates comparable measurement efficacy to MRI for fibrosis quantification, particularly in terms of operational practicality and volumetric consistency.
Although ANOVA revealed no significant differences among imaging modalities with varying slice thicknesses, the 1.0-mm CT scans consistently measured larger mean fibrotic volumes compared to 3.5-mm CT and 3.5-mm MRI, while still showing excellent correlation with these thicker-slice modalities (Pearson’s coefficient >0.9; Table 4). This is because thinner slices provide better visualization of fibrotic tissue details, leading to more accurate quantification and improved clinical assessment of fibrosis location and extent.
MRI is well-established as the primary method for volumetric quantification of knee joint fibrosis, and is routinely employed to evaluate both post-surgical fibrosis and disorder-associated fibrotic changes in various knee pathologies. Abdul et al. (2015) and Attard et al. (2020) utilized MRI to localize fibrosis in the infrapatellar fat pad (IPFP) following total knee arthroplasty (TKA) and quantify fibrotic tissue thickness across different knee regions,7,15 These studies demonstrated significantly greater fibrotic tissue thickening in TKA patients compared to asymptomatic controls. Iura et al. (2023) 8 further employed MRI-based 3D reconstruction of the posterior joint capsule in patients with knee extension limitations, revealing markedly increased thickness and volume in the extension-restricted group. This highlights the value of 3D reconstruction for visualizing fibrosis patterns, with quantitative thickness and volume metrics effectively reflecting joint dysfunction. For flexion limitations, however, anterior knee fibrosis remains the primary restricting factor, 5 Existing studies have not yet achieved volumetric measurements for anterior knee fibrosis, nor standardized the measurement methodology. These unresolved issues have significantly hindered progress in quantitative analysis of knee fibrosis. The volumetric quantification approach established in this study could facilitate more accurate assessment and tailored therapeutic interventions for patients with knee flexion limitations. Although MRI is widely utilized, it has notable clinical limitations including difficult scheduling, high costs, and especially lengthy scanning durations. This is particularly true for thin-slice acquisitions (e.g., 1.0 mm) that are frequently clinically impractical. By comparison, CT demonstrates clear clinical advantages through more accessible scheduling, reduced costs, and efficient acquisition of high-resolution thin-slice images. Moreover, validation studies in pulmonary and renal fibrosis have confirmed CT’s high sensitivity for fibrotic tissue detection. Sul et al. (2019) 16 demonstrated that CT can accurately quantify both volumetric parameters and spatial patterns of idiopathic pulmonary fibrosis using Hounsfield unit (HU) values, with excellent reproducibility. Cohen et al. (2020) 17 reported that HU variations could detect even mild renal fibrosis, while Olson et al. (2023) 10 reported strong correlation between HU values and histologic fibrosis scores (r = 0.8, p < 0.0001), with sensitivity extending to minimal fibrosis (Grade 1). These findings support the feasibility of applying CT for knee fibrosis quantification in our study.
Both CT and MRI 3D reconstructions showed that fibrotic tissue in the anterior knee was mainly distributed in the suprapatellar pouch, IPFP, and medial/lateral gutters, a spatial pattern consistent with previous findings of fibrosis after TKA. 7 None of the enrolled patients exhibited significant joint effusion, which was associated with their postoperative duration and younger age. The study cohort had a mean postoperative duration of 14 weeks and a mean age of 31 years. Previous evidence suggests that effusion and swelling typically resolve by 12 weeks in this age group, 18 thereby minimizing fluid-related interference with fibrotic tissue segmentation. Furthermore, substantial interpatient variability was observed in fibrotic volume measurements (e.g., Observer 1’s 3.5-mm CT reconstructions ranged from 9937.69 to 66,361.92 mm3; Supplemental Table 1), highlighting pronounced individual differences in post-ACLR fibrotic responses.
Reliable fibrosis localization and quantification methods will enable exploration of volume-function relationships, advancing pathological insights and supporting evidence-based disease classification and treatment strategies.
This study provides valuable insights into the quantitative analysis of knee joint fibrosis, but several limitations should be acknowledged. First, we focused on the anterior knee ROI to establish a standardized region for comparison between CT and MRI. All participants included in this study had intra-articular injuries, with fibrotic tissue proliferation observed only in the anterior region, while no significant fibrosis was observed posteriorly. It should be noted that the fibrosis volume within this ROI only reflects part of the overall severity of knee fibrosis. Other parameters, such as tissue stiffness and density, were not assessed in this study and require further investigation. Second, differences in imaging positioning between CT (full knee extension) and MRI (15° flexion) could potentially alter the compression of fibrotic tissues, thereby affecting volumetric measurements. Standardized positioning protocols are needed in future investigations. Thirdly, CT imaging provides high-resolution visualization of bone and fibrotic tissues, but cartilage exclusion, especially over the femoral and tibial surfaces, remains challenging. In our workflow, HU thresholding was applied to exclude the main cartilage regions, while remaining areas were manually segmented. Nonetheless, residual segmentation errors may still exist. Finally, the relatively small sample size (n = 18) may limit the generalizability of the findings. Expanding the cohort size and including patients undergoing other types of knee surgeries would strengthen future research.
Conclusion
This study provides a method to quantitatively assess the anterior knee fibrosis volume. CT can serve as a feasible and promising tool with performance not inferior to MRI. Further studies are needed to validate its application in multi-regional assessments and to combine it with other imaging or functional parameters for comprehensive analysis.
Supplemental Material
Supplemental Material - CT as a feasible tool for quantifying anterior knee fibrosis volume following ACL reconstruction
Supplemental Material for CT as a feasible tool for quantifying anterior knee fibrosis volume following ACL reconstruction by Jixiong Qin, Jiling Ye, Yuning Su, Yangyang Yang, Diyang Zou, Qixing Shen, Rongshan Cheng, Tsung-Yuan Tsai, and Bin Cai in Journal of Orthopaedic Surgery.
Footnotes
Acknowledgments
We acknowledge the institutional ethics committee (SH9H-2021-T365-1) of Shanghai Ninth People’s Hospital for supporting this study and Shanghai Jiao Tong University for the technical support.
Consent to participate
Informed consent was obtained from all the subjects involved in the study.
Author contributions
Conceptualization, B.C, T.-y.T., J.Y. and R.C. ; data curation, J.Q., Y.S, D.Z. and Q.S.; methodology, T.-y.T., J.Q., Y.S., R.C., Y.Y. and D.Z.; project administration, J.Q., R.C., J.Y., T.-y.T. and B.C.; resources, J.Q., Q.S., T.-y.T. and B.C.; software, J.Q., Y.S., R.C., Y.Y. and D.Z.; supervision, R.C., J.Y., T.-y.T. and B.C.; validation, J.Y., R.C., Y.Y., and B.C.; visualization, J.Q., J.Y. and Y.S; writing—original draft, J.Q.; writing—review and editing, J.Q., R.C., J.Y., Y.Y, and B.C. All authors have read and agreed to the published version of the manuscript.
Funding
The authors disclosed receipt of the following financial support for the research, authorship, and/or publication of this article: This research was funded by the Shanghai Municipal Science and Technology Major Project (grant number 21Y11903400); the Shanghai Municipal Health Commission Key Supporting Disciplines (grant number 2023ZDFC0303); the Hainan Provincial Natural Science Foundation of China (grant number 824RC558); Shanghai Hospital Development Center Foundation (grant number SHDC12026118).
Declaration of conflicting interests
The authors declared no potential conflicts of interest with respect to the research, authorship, and/or publication of this article.
Data Availability Statement
The datasets used and analyzed during the current study are available from the corresponding author on reasonable request.
Institutional Review Board Statement
This study was conducted in accordance with the Declaration of Helsinki and approved by the Shanghai Ninth People’s Hospital, Shanghai Jiao Tong University School of Medicine Ethics Committee (protocol code: SH9H-2021-T365-1).
Supplemental Material
Supplemental material for this article is available online.
References
Supplementary Material
Please find the following supplemental material available below.
For Open Access articles published under a Creative Commons License, all supplemental material carries the same license as the article it is associated with.
For non-Open Access articles published, all supplemental material carries a non-exclusive license, and permission requests for re-use of supplemental material or any part of supplemental material shall be sent directly to the copyright owner as specified in the copyright notice associated with the article.