
Abstract
Introduction
Dissatisfaction after total knee arthroplasty (TKA) continues to be reported amongst patients, the question of how to better optimize total knee arthroplasty procedures persists. Historically, mechanical alignment (MA) techniques have been utilized with the goal of achieving a horizontal joint line perpendicular to the neutral mechanical axis. 1 Although this technique is highly successful with regards to implant longevity and low failure rates, the lack of consideration of a patient’s native alignment in MA has been hypothesized to contribute to decreased patient satisfaction. 1 In contrast, kinematic alignment (KA) technique aims to restore the arthritic deformity to the pre-arthritic alignment in 3 dimensions. Increased interest in KA alignment strategies have evolved as improved survival rates have been reported. 2
The Coronal Plane Alignment of the Knee (CPAK) classification system utilizes arithmetic Hip-knee-ankle angle (aHKA) and joint line obliquity (JLO) to categorize patients into nine different knee phenotypes. 3 This system has been proposed to better identify native knee phenotypes and guide intraoperative soft tissue balancing. Associations between certain CPAK phenotypes and intraoperative alignment techniques have been demonstrated to improve functional outcomes. 4
The variability in CPAK phenotype frequency among different patient populations has been examined. Studies analyzing CPAK phenotypes in patients from Belgium and Australia have found similarities in distribution of phenotypes between arthritic and healthy knees with CPAK II, I and IV as the most common. 3 Additionally, sex differences in CPAK distributions have been found with females exhibiting higher incidence of valgus phenotypes compared to men. 5 Although differences in CPAK phenotypes between geographic locations and sex have been examined, the interaction of other patient demographics and CPAK classification have not been investigated.3,5
To date, no studies have examined the interaction of sex, race, age, and BMI on CPAK phenotype. Therefore, the aim of this study was to examine the impact of patient demographics on CPAK classification for native arthritic knees. It was hypothesized there would be differences in frequency of CPAK phenotypes impacted by sex and race.
Methods
Institutional Review Board (IRB) approval was attained, and a retrospective review identified all primary total knee arthroplasty cases performed at a tertiary care health system located in the southeastern United States between January 2014 and December 2022. Inclusion criteria were patients between 30 and 91 years old who underwent a primary TKA and had pre-operative long leg standing radiographs. Patients who had prior knee arthroplasty were excluded.
A total of 1167 patients were included in the study. Demographic information including age at time of surgery, sex, race, and BMI were recorded for each patient. TraumaCad orthopaedic templating software (Brainlab, Munich, Germany) was utilized to complete radiographic measurements. The medial proximal tibial angle (MPTA) was defined as the medial angle formed between the tibial mechanical axis and joint line of the proximal tibia, and the lateral distal femoral angle (LDFA) was defined as the lateral angle formed between the femoral mechanical axis and the joint line of the distal femur. The MPTA and LDFA were measured on preoperative bone length films with TraumaCad.
CPAK classification was defined as outlined by MacDessi et al. 3 Arithmetic HKA (aHKA) was calculated as MPTA minus LDFA, and JLO was calculated as MPTA plus LDFA. The established boundaries for aHKA are varus: less than −2°, neutral: 0 +/− 2°, and valgus: greater than 2°. The boundaries for JLO, as previously defined, are apex distal: less than 177°, neutral: 180 +/− 3° and apex proximal: greater than 183°. The CPAK matrix has the three columns of aHKA and three rows of JLO plotted against each other to create 9 different recognized phenotypes.
The interobserver reliability of the CPAK measurements were determined using the class 3 model intraclass correlation coefficient (ICC). A 2-factor analysis of variation without replication model was used to calculate the ICC with a 95% confidence interval. The benchmarking of ICC values utilized the following classification: less than 0.50 indicating poor reliability, 0.50 to 0.75 indicating moderate reliability, 0.76 to 0.90 indicating good reliability, and values exceeding 0.90 indicating excellent reliability. 6 When examining the association between demographic categories and CPAK category, chi square test of independence and descriptive statistics were used. When chi square test of independence demonstrated a significant association, Pearson’s standardized residuals were utilized to assess which demographic factors and CPAK categories demonstrated the greatest discrepancy from expected values. A residual greater than 3 or less than −3 was considered a large contributor to the chi square. Statistical significance was set at p value <0.05. Statistical analysis was performed using R studio Posit team (2023, RStudio: Integrated Development Environment for R. Posit Software, PBC, Boston, MA).
Results
Of the 1167 patients included in the study, sex was identified in 1166 (99.9%) with 520 males (44.5%) and 646 females (55.4%). The interobserver reliability for CPAK measurements is demonstrated in Supplemental Figure 1 with all measurements demonstrating an ICC with “excellent” reliability except Right mLPFA which demonstrated an ICC of “good” reliability.
CPAK frequency by patient sex.
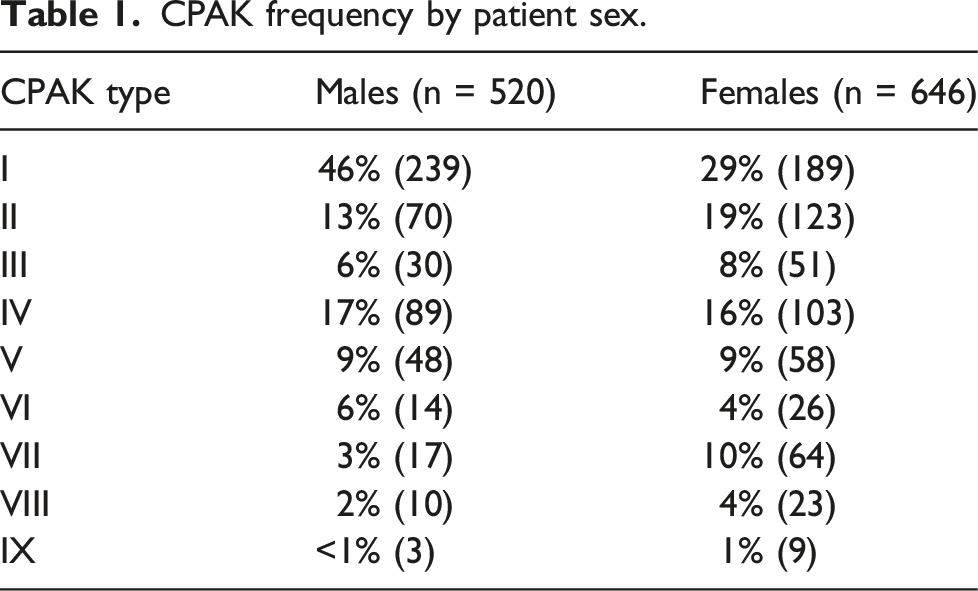

Distribution of CPAK phenotypes by sex.
Frequency of CPAK phenotype by patient race.
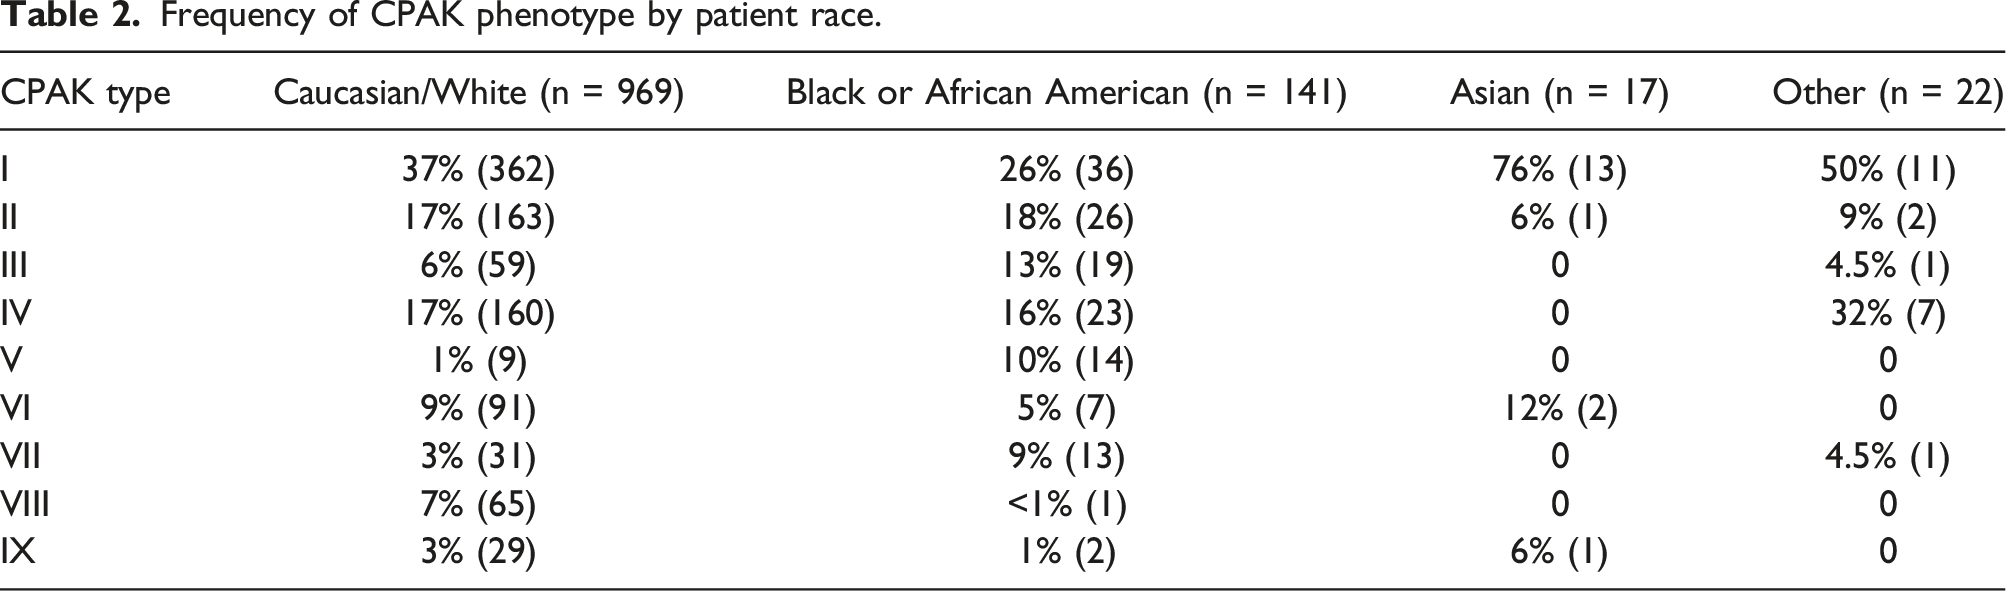

Distribution of CPAK phenotype by Patient Race (Other category includes the following: Did not disclose, 2 or more, American Indian or Alaskan native, native Hawaiian or other pacific islander).
CPAK frequency by patient BMI.

CPAK frequency by patient age.

Discussion
The most important findings of this study were that patient demographics, such as race and sex demonstrated differences in CPAK phenotype frequency. However, no associations were found between age and BMI. With increased efforts to personalize TKA, phenotype classification systems such as CPAK offer surgeons the opportunity to further characterize patient’s pre-operative anatomy and can help guide operative planning. Previous work evaluating CPAK phenotypes has found geographical differences in phenotype frequency and associations between patient sex and aHKA alignment.7,8 To date, there are no studies examining the association between demographic factors such as race, sex, age, and BMI impact on CPAK phenotype.
An association between patient sex and CPAK phenotype frequency was found in this study with 46% of males in CPAK phenotype I as compared to 29% of females. In contrast, females had a higher frequency of phenotype II at 19% and VII at 10% as compared to men who had frequencies of 13% and 3%, respectively. Additionally, when examining aHKA alignment, there was an association between sex and aHKA with females demonstrating a higher incidence of valgus deformity and less varus deformity as compared to men. These findings are similar to that of Steele et al., who analyzed 1946 knees using a deep learning neural network to render CPAK classifications and found that women had a significantly higher proportion of knees in valgus and significantly less knees in varus as compared to men. 5 Similarly, Huber et al. who analyzed 8739 long leg radiographs found that CPAK Type I, II and III along with neutral and valgus alignment were more common in women. 9 Overall, the findings of different CPAK phenotype frequencies between males and females is consistent with previous work demonstrating sex differences in lower extremity alignment. Differences have been demonstrated in static Q angle, anterior pelvic tilt, hip anteversion and thigh foot angles between healthy males and females.10,11
This study identified a significant association with race and CPAK phenotypes. A positive correlation was observed between CPAK phenotype III and Black or African American patients. However, within this group, CPAK phenotype I was the most common, despite having a negative correlation, whereas CPAK phenotype VIII was the least common. Ethnic differences in knee phenotypes have previously been demonstrated with significantly lower tibial mechanical angle and higher femoral mechanical angle found in Asian patients than Caucasian patients. 7 Additionally, CPAK frequency in Asian populations have been shown to have slight differences in observed classifications with CPAK II, I and III being the most common in healthy and arthritic knees.12,13 A systematic review by Pagan et al. found geographical variations in CPAK phenotypes, CPAK phenotype I was the most common in India (58.8%), Japan (53.8%), and France (33.4%), whereas CPAK phenotype II was the most common in Australia (32.8%). 8 Racial differences in alignment may be related to differences in the distribution of body weight and biomechanics among different racial and ethnic groups. Understanding the racial and ethnic differences in coronal plane alignment may have important implications for the diagnosis, prevention, and treatment of knee osteoarthritis and other knee-related conditions in diverse patient populations.
In addition, this study found no association of BMI or age with CPAK phenotypes. Our discoveries indicate that considerations beyond BMI and age might play a more crucial role in determining CPAK classifications. This observation is consistent with Nomoto et al.'s identification of similarities in CPAK phenotypes both before and after an eight-year period of osteoarthritic progression. 14 Possible factors that could influence CPAK phenotypes include genetic factors, physical activity levels, and previous injury history.
One limitation of our study is the reliance on race data that is self-reported and recorded in the electronic medical record (EMR). While efforts are made to accurately capture this information, we acknowledge there is a possibility that patients may have entered their race incorrectly or declined to answer the question altogether. Additionally, we recognize that self-identified race is a complex and multifaceted construct that may not capture the full range of ethnic and ancestral backgrounds that contribute to a person’s identity. Additionally, there were few patients who identified as African American and Asian included in this study. Finally, the inclusion of patients with severe inflammatory arthritis and significant knee deformity may lead to inaccuracies in the measurement of anatomical parameters. Despite these limitations, we believe that our study provides valuable insights into the relationship between race and CPAK phenotypes. Additionally, the overall observed frequency of certain CPAK phenotypes is very low. A limitation encountered was observed CPAK phenotypes VI, VII, VIII, IX were so few for different demographic groups, which resulted in the inability to include these in statistical analysis. Future investigations of CPAK classifications could include examining their association with Patient-Reported Outcomes Measures (PROM), including generic and joint specific PROMs to evaluate the impact of CPAK on patient-reported outcomes. Additionally, assessing the inter-observer reliability of the CPAK classification or utilizing computed tomography images would enhance the validity and reliability of CPAK assessments. 15
The high dissatisfaction rate in TKA in uncomplicated cases, could be attributed to the broad variability in alignment and the sex-specific distribution present in both classifications. 16 Although this study demonstrates there is an association between sex, race, and alignment, this ultimately has no impact on TKA surgical technique because the goal of the surgeon is to maintain the joint line. However, the association between joint line and certain phenotypes based upon sex may help surgeons decide on prosthesis type such as asymmetric, symmetric, or custom designs.
Conclusion
In examination of patient demographics and CPAK phenotype, we demonstrate that sex and racial differences exist in phenotype frequency. Therefore, findings of this study suggest a necessity for personalized alignment paradigms that account for variations in individual knee morphology such as personalized alignment methods and prosthesis design selection.
Supplemental Material
Supplemental Material - Patient sex and race are associated with differences in coronal plane alignment classification in native arthritic knees
Supplemental Material for Patient sex and race are associated with differences in coronal plane alignment classification in native arthritic knees by Caitlin Grant, Niall Cochrane, Mikhail Bethell, Christopher Holland, Jay Levin, Joshua Helmkamp and Thorsten Seyler in Journal of Orthopaedic Surgery.
Footnotes
Declaration of conflicting interests
The author(s) declared no potential conflicts of interest with respect to the research, authorship, and/or publication of this article.
Funding
The author(s) received no financial support for the research, authorship, and/or publication of this article.
Ethical statement
Supplemental Material
Supplemental material for this article is available online.
References
Supplementary Material
Please find the following supplemental material available below.
For Open Access articles published under a Creative Commons License, all supplemental material carries the same license as the article it is associated with.
For non-Open Access articles published, all supplemental material carries a non-exclusive license, and permission requests for re-use of supplemental material or any part of supplemental material shall be sent directly to the copyright owner as specified in the copyright notice associated with the article.