
Abstract
Background
In order to simulate weight-bearing Computed Tomography (CT) examination, this study designed a simple stress position device. By analyzing the relevant data of stress position footprints and weight-bearing position footprints, the feasibility of the stress position device to simulate standing weight-bearing was verified.
Methods
This study randomly selected 25 volunteers for standing weight-bearing and stress position footprints collection, and measured the relevant indicators of stress position footprints and standing weight-bearing position footprints. Two foot and ankle surgeons conducted two measurements respectively on the footprints. Intra-observer and inter-observer reliability were calculated using intra-class correlation coefficients (ICC). Pearson correlation coefficient, ICC, scatter plot analysis, and paired t-test were used to analyze the stress and weight-bearing position data.
Results
The intra-observer and inter-observer measurement values were reliable. There was a certain degree of correlation between the stress position footprints and weight-bearing position footprints in terms of Pearson correlation coefficient, ICC, and scatter plot analysis. Paired t-tests showed significant differences in Clarke angle (t 2.636, p .012), C-S index (t 10.568, p .000), arch indx (t 2.176, p .035), and arch lower angle (t 6.246, p .000).
Conclusion
The stress position device can generate a certain degree of stress, and after further optimization and improvement of the stress position device, it is feasible to apply it to weight-bearing CT examination in clinical settings.
Introduction
Diseases related to the foot and ankle are often accompanied by foot alignment and spatial abnormalities. Weight-bearing X-rays are widely used to objectively show the structure and force lines of the foot and ankle in physiological conditions, which is an important basis for foot and ankle measurements.1,2 However, X-rays have limitations such as overlapping bones, deviations in positioning and methods, and body rotation.3–6 Studies have shown that some measurement values for foot and ankle deformity analysis are highly dependent on the position of the foot relative to the X-ray beam. Conventional CT scans of the foot and ankle can clearly display the bony structure of the foot, but are not applied with any stress during the examination,7,8 and cannot objectively display the actual status of the foot and ankle under standing and weight-bearing stress. Studies have shown that only weight-bearing CT can accurately reflect the foot condition.9–11
Standing weight-bearing CT provides direct observation of the actual status of the ankle in standing position. It offers accurate anatomical information, as it allows for 3D imaging and reconstruction of the ankle in weight-bearing state. Therefore, it is considered to be the most reliable measurement method for diagnosis of foot-related disorders in recent years.9,12–14 However, full weight-bearing CT requires specialized equipment, which is extremely expensive, and professional radiology software is also needed for measurement assistance. Currently, most hospitals do not have weight-bearing CT, especially in developing and underdeveloped countries where the penetration rate is even lower. For most foot and ankle specialists, foot-related indices are still measured using weight-bearing X-rays.
To simulate the measurement and analysis of foot and ankle related indices under weight-bearing conditions, this study designed a simple device based on its own economic conditions in clinical work. Stress positioning was used to simulate the full weight-bearing position, and the stress footprints were compared with weight-bearing footprints and related data measurements were used to validate the correlation between the two. It was confirmed that the stress positioning device could simulate the effect of weight-bearing to a certain extent, thus achieving the simulation of weight-bearing CT using stress positioning CT in clinical practice, and providing a simple method to obtain similar weight-bearing examinations for the diagnosis and treatment of foot and ankle diseases. The relevant studies are reported as follows:
Materials and methods
General information
Inclusion criteria
(1) No discomfort in the ankles and feet. (2) Inform the Volunteers about the necessary examination procedures, purposes, and significance of this study. The Volunteers expresses understanding and signs the informed consent form. For Volunteers under 18 years of age, the informed consent form is signed by their parents.
Exclusion criteria
The person who refuses to participate in this study or cannot cooperate with the examinations.
Volunteer demographics.

Device
The device used in this study was designed based on the conditions of our own institution, without any conflicts of interest. The materials used in manufacturing the equipment were approved by the hospital equipment management department. After the device was made, it underwent relevant safety testing. The design is simple and easy to produce, ensuring convenience and reliability.
The stress position device
(Figure 1) 180 cm long and 60 cm wide. The front end of the wooden board is the supporting structure, which is composed of two wooden boards connected by hinges. The two boards are called the stress surface and the supporting surface respectively. The stress surface and the supporting surface are separated by a 1.2 cm thick transparent tempered glass, which allows for observation and collection of footprints under stress position. The supporting board can adjust the supporting angle through the card slot on the wooden board. The installation of handrails on both sides of the wooden board helps to maintain balance and stable force during the use of the stress positioning device. Stress positioning device schematic. (a) Stress positioning device after folding, (a)-a slot structure, (b), (c) and (d) stress positioning device after unfolding, (b)-b Support plate, (b)-c Stress plate, (b)-d handrails.
Light box device
(Figure 2) 60 cm in length, 50 cm in width, and 20 cm in height. The top of the light box is a 1.2 cm thick tempered glass panel. The front of the box is open and the inner part of the box is equipped with a strip-shaped light strip. A certain slope-shaped baffle is set at the bottom of the box, on which a suitable-sized mirror is placed. When the patient stands on the colorless transparent tempered glass surface, the footprints can be clearly displayed on the mirror when the light strip is electrified. Light box device. (a) A 1.2 cm thick tempered glass that can withstand up to 200 kg. (b) A mirror with a certain slope. (c) A light strip (arrow).
Footprint collection
Standing full weight footprints collection
The volunteers stands on the tempered glass surface of the lightbox, and the bottom mirror surface clearly displays footprints when the light strip is turned on. The footprints are then captured using a mobile phone.
Stress position footprint collection
The subject lies supine on the stress position device, gripping the handles on both sides, elevating the hips, placing both feet on the tempered glass surface, and adjusting the angle of the slots to ensure that the lower legs are as vertical as possible with respect to the tempered glass surface. Using the muscular force of the lower limbs, the subject exerts pressure on the tempered glass surface with their feet, and capture their footprints through colorless and transparent tempered glass using a mobile phone.
Measurement of footprints
Measurement of Footprint Indicators: respectively measure the foot angle, C-S index, and arch index of footprints on the weight-bearing position light box and stress frame. (Figure 3(a) and (b)) One chief ankle specialist physician confirms the markings on each footprint image, and then two ankle specialist physicians use the MedCAD software to measure various indicators on the footprint image. Each physician makes two measurements, with a 1-week interval between them, and the average of the two measurements is taken for statistical analysis. Collection and measurement of weight-bearing and stress position footprints. (a) displays the weight-bearing footprint, (b) displays the stress position footprint, (c) shows the markers for measuring different parameters on the weight-bearing footprint, (d) shows the markers for measuring different parameters on the stress position footprint. In (c) and (d): draw a tangent line b to the inner edge of the footprint, then draw another tangent line a from the point where line b intersects with the forefoot to the inner longitudinal arch of the footprint, the angle between line a and b is the footprint angle; draw a line segment B which represents the narrowest part of the footprint, line segments A and C represent the widest parts of the forefoot and rearfoot, respectively, the ratio of B to A is the C-S index, and the ratio of B to C is the arch index. Draw a tangent line e and f from the point on the inner edge of the footprint that is the farthest away, towards the forefoot and rearfoot, respectively, the angle between lines e and f is the arch lower angle.
Statistical analysis
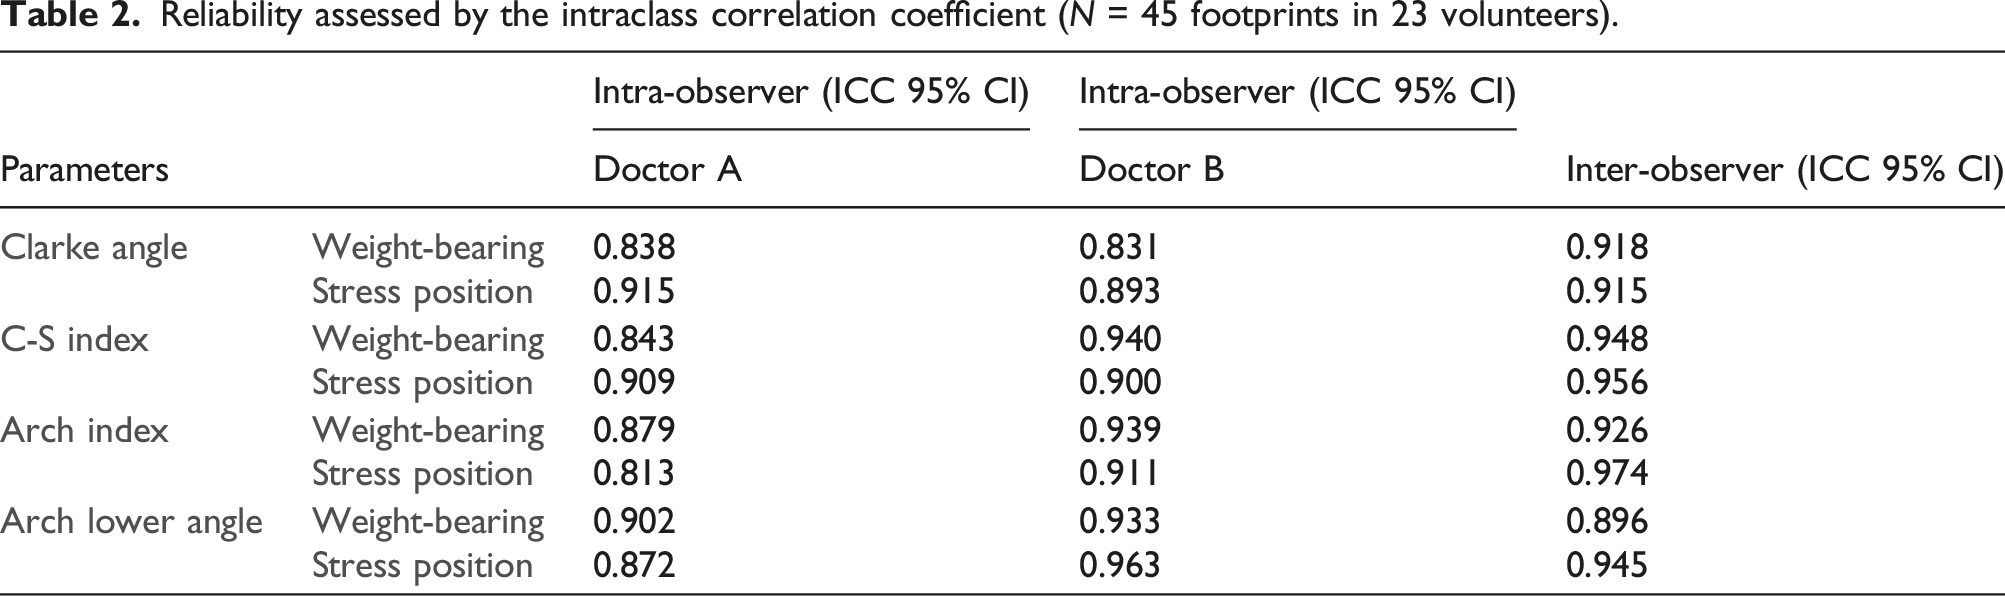
Use intra-class correlation coefficient (ICC) to analyze inter-observer and intra-observer reliability. ICC values above 0.800 indicate high reliability, ICC values between 0.400 and 0.800 indicate moderate reliability, and ICC values below 0.400 indicate poor reliability. Apply scatter plots, Pearson correlation coefficient, and ICC to examine the correlation between stress and weight-bearing footprints. To perform a normality test on the data and compare the differences between two groups of data that follow a normal distribution, we can apply a paired t-test.
Results
Footprint collection and data measurement illustration
A 6-year-old female child and an obese woman were unable to provide stress position footprints due to non-cooperation. A male participant with left high-arched foot only provided a valid right foot footprint, while the other volunteers were able to provide valid footprints from both feet.
Reliability analysis of measurement data between intra-observer and inter-observer
Reliability assessed by the intraclass correlation coefficient (N = 45 footprints in 23 volunteers).
Correlation analysis of load position and stress position footprint data in scatter plots
Between stress position and load position: Clarke angle R2 0.477, C-S index R2 0.742, Arch index R2 0.679, and Arch lower angle R2 0.559. All four indicators between stress position and standing weight-bearing show a certain degree positive correlation (Figure 4). The correlation between stress position and load position data on the scatter plot (N = 45 footprints in 23 Volunteers). (a) Clarke angle, (b) C-S index, (c) arch index, (d) arch lower angle.
Intra-class correlation coefficients (ICC) and Pearson correlation coefficient analysis of footprint data at weight-bearing and stress positions
Intra-class correlation coefficients and Pearson correlation coefficient analysis of footprint data at weight-bearing and stress positions (N = 45 footprints in 23 volunteers).

Paired t-test for the weight-bearing and stress position footprint data
Clarke angle
Paired t-test for the weight-bearing and stress position footprint data (N = 45 footprints in 23 volunteers).

C-S index
The maximum angle difference between the two groups was 0.173, with angles of 0.483 and 0.309, while the minimum difference was 0.006, with angles of 0.386 and 0.392. The t-value was 10.568 and the p-value was 0.000, which was less than 0.05, indicating significant difference.
Arch index
The maximum angle difference between the two groups was 0.143, with angles of 0.574 and 0.432, while the minimum difference was 0.001, with angles of 0.339 and 0.340. The t-value was 2.176 and the p-value was .035, which was less than 0.05, indicating significant difference.
Arch lower angle
The maximum angle difference between the two groups was 17.815, with angles of 113.400 and 95.585, while the minimum difference was 0.035, with angles of 97.902 and 97.937. The t-value was 6.245 and the p-value was 0.000, which was less than 0.05, indicating significant difference.
In conclusion, the stress position can generate effective stress and to some extent simulate the weight-bearing position. Additionally, the stress position device can be properly placed on the CT equipment without affecting the CT examination (Figure 5). Weight-bearing X-ray and stress position CT examinations have been performed on suitable patients, and subsequent measurement of relevant indicators (Figure 6) can be carried out to further verify the feasibility of the stress position device. Simulation of CT examination on the stress position device. Weight-bearing X-ray images and stress position CT reconstructed images. (a) shows weight-bearing lateral X-ray image, (b) shows stress position CT sagittal reconstruction. (c) shows weight-bearing axial X-ray image, (d) shows stress position CT axial reconstruction. The angle between a and b in (a) and (b) is the angle between the calcaneus and the first metatarsal, the angle between c and d is the inclination angle of the calcaneus, and the angle between b and d is the inclination angle of the talus. The angle between a and c in (c) and (d) is the calcaneus-first metatarsal angle, the angle between b and c is the angle between the second metatarsal and the calcaneus, and the angle between d and e is the coverage angle of the navicular bone.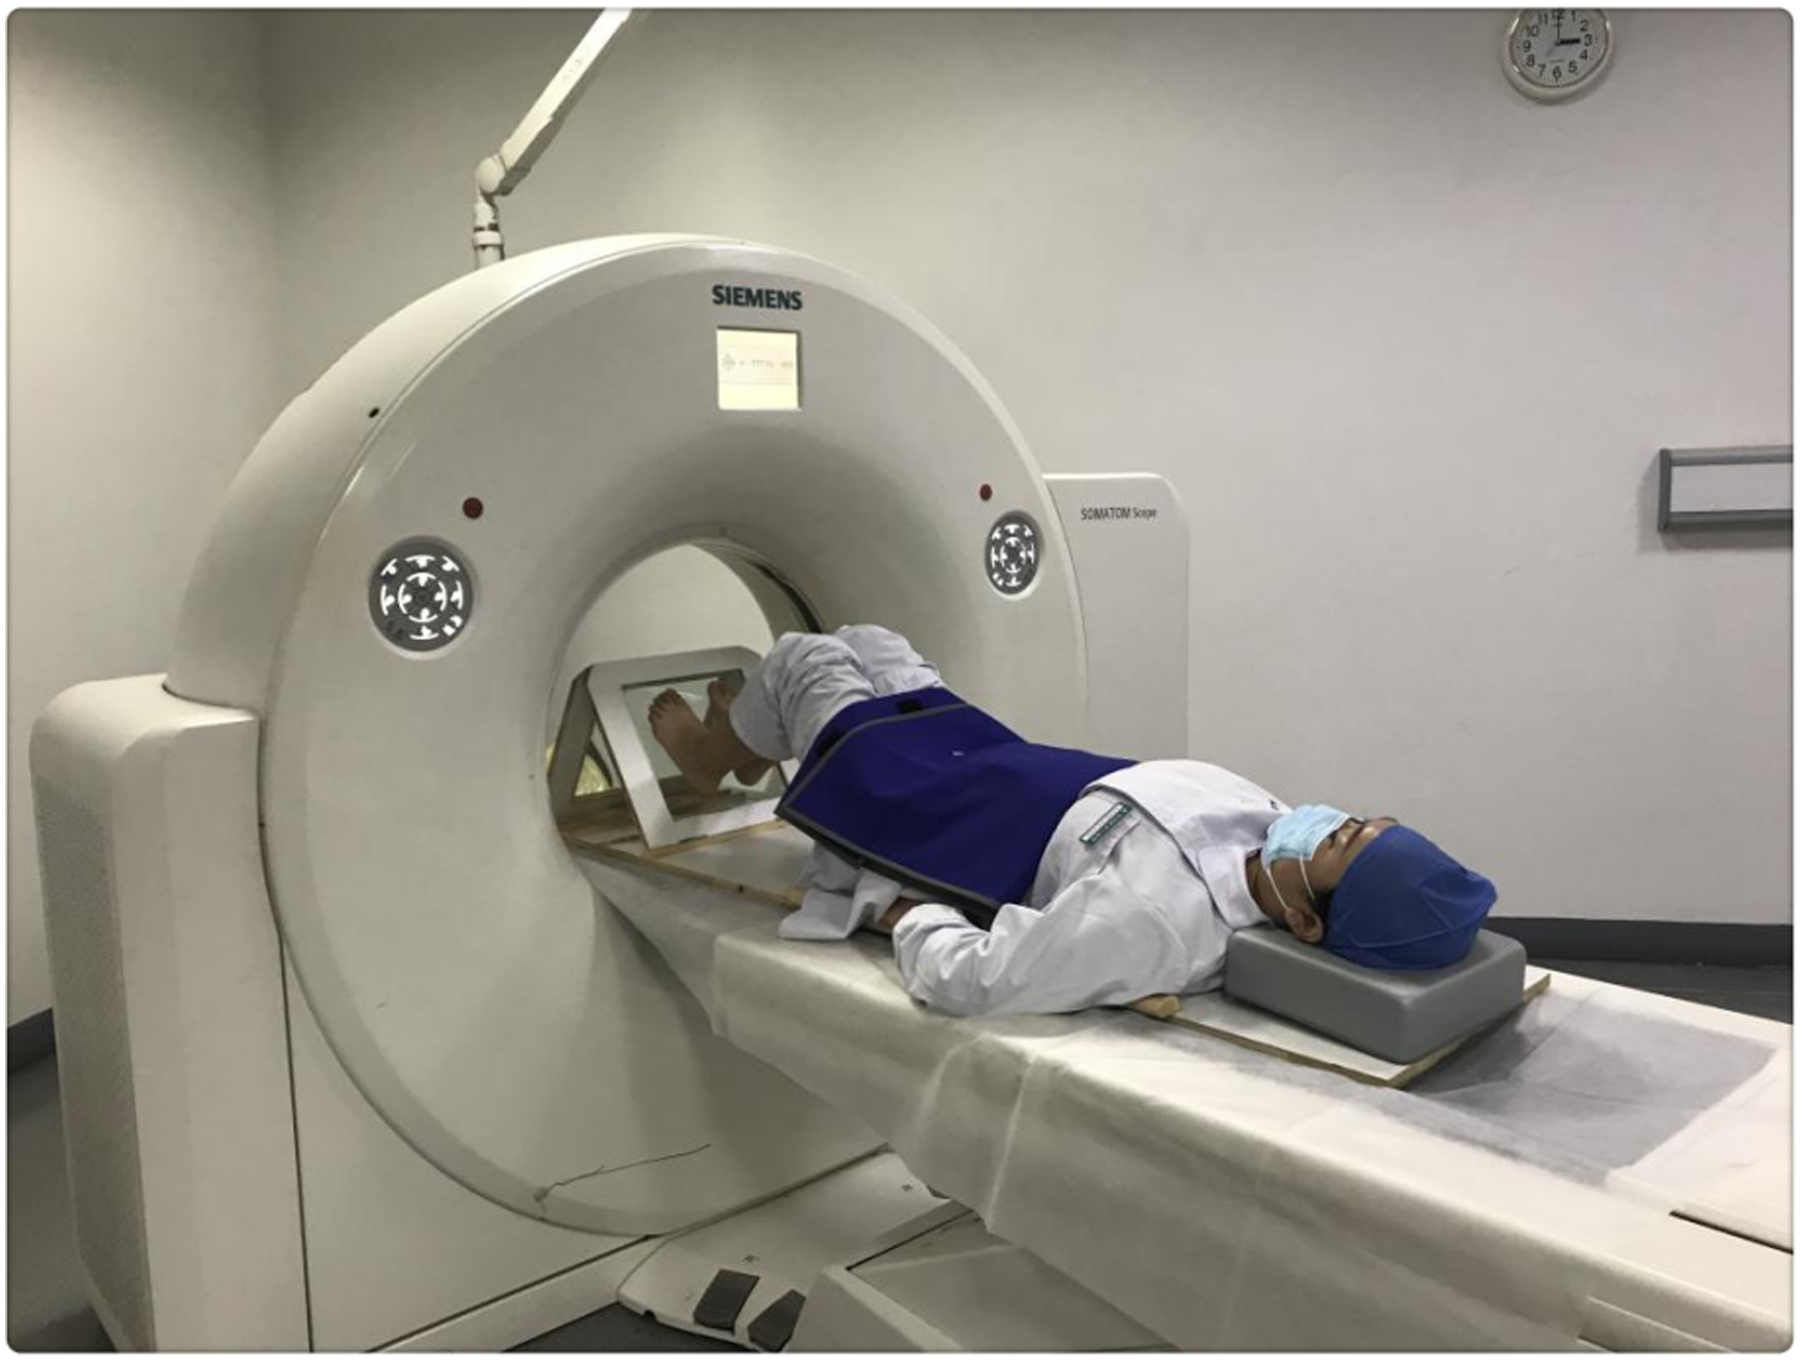

Discussion
Weight-bearing CT can accurately and objectively reflect the anatomical structure of the ankle and foot in three-dimensional space, without technical problems such as radiation angle deviation, and it is the gold standard for ankle and foot disease examination.15–22 However, the popularity of weight-bearing CT is low, and most ankle and foot doctors still rely on weight-bearing X-rays for examination. Ankle and foot doctors have also been trying to design devices that can simulate the effect of weight-bearing CT, so as to measure ankle and foot indicators from a 3D perspective. When the patient is fully weight-bearing, the body is vertical to the ground, the feet fully contact the ground, and the gravity of the body makes the three weight-bearing points, the first metatarsal head, the fifth metatarsal head, and the calcaneus, fully contact the ground, thus producing the effect of full weight-bearing. As long as the lower limbs are kept fully vertical to the weight-bearing surface to produce similar pressure, the effect of weight-bearing can be simulated. In recent years, some scholars have developed various devices for simulating weight-bearing CT examinations,16,23,24 such as the Axial loading device designed by Dong HK, Chan K, 25 and the loading device designed by Kimura T, Kubota M, Taguchi T, et al.26,27 They all simulate weight-bearing by directly or indirectly applying axial stress to the sole. The device designed by Kido et al.28–30 simulates weight-bearing by fixing the knee joint in a flexed position and applying pressure to the foot. These devices can all simulate the effect of weight-bearing CT through external force transmission to the ankle and foot, and the reliability of the weight-bearing effect is evaluated by studying the contact area and pressure of the sole under weight-bearing and loading conditions. However, these studies still require some economic and technical support, which is still difficult for small grassroots hospitals. Footprints are closely related to human weight-bearing, and previous studies on footprints have shown no significant differences in footprints when the same or similar pressure was applied to the ankle and foot.31,32 In order to make the examination more economical and convenient, and to further simplify the device according to the actual situation of the hospital, a simple stress position device was designed to allow patients to generate stress actively, thus making the stress more direct and objective. By presenting weight-bearing footprints and stress position footprints, it is verified that there is a certain degree of correlation between the two, which proves the feasibility of the stress position device simulating weight-bearing.
This stress-position device can observe the patient's footprints during the examination. By observing the footprints and measuring relevant indicators, it can be confirmed that the device achieves the effect of partial weight-bearing. The data analysis shows that there is a certain positive correlation between the stress-position data and the weight-bearing data. The footprints data under stress position can reflect the trend of changes in footprints data under weight-bearing position, which can provide a reference basis for the changes of weight-bearing position-related parameters and a new idea and method for clinical diagnosis and treatment. However, the stress-position cannot completely replace the weight-bearing position because the production of downward force through one's own muscles and then acting on both feet has some limitations and instability. Further modifications need to be made to improve the stability and reliability of the device.
During the collection of stress-position footprints, due to different heights of each patient, the selection of the support plate's slot is also different. Patients are required to hold onto the handrails on both sides, while simultaneously exerting force in the muscles of their legs so that their feet naturally relax, ensuring that the sole of the foot is in parallel contact with the tempered glass surface. By selecting slots with different angles, it is ensured that the calf is as vertical as possible with respect to the sole of the foot and the tempered glass surface, ensuring that the direction of the stress produced by the stress-position and the direction of the gravity of the weight-bearing position are consistent with respect to the foot. Patients, especially children, are encouraged to practice with the device, ensuring stability and reliability during the footprint collection process. A powerful flashlight can be used during data collection for stress-position footprints to ensure clearer footprint imaging due to lighting issues. The stress-position device is small and can be placed safely and conveniently on a CT machine, without affecting its operation during a CT examination. The total cost of the device is only 500 RMB, making it readily accessible and available for use in all hospitals. Although there are still differences between the stress-position and weight-bearing position data in this study, the positive correlation between the two was evident. For hospitals that are economically constrained and unable to use weight-bearing CT or similar weight-bearing CT devices, this simple stress position device is also a good choice for foot and ankle specialists.
Advantages of the stress-position device: (1) it is inexpensive to manufacture and can be widely used; (2) its design is simple and easy to transport and use. It can be placed directly on the CT bed without affecting scanning space; (3) it does not increase costs and is easily accepted by patients; (4) the footprints can be observed in real-time during examination, and the partial weight-bearing effect can be confirmed through the footprints; (5) bilateral foot examinations can be performed simultaneously during CT scans. There are some limitations in this study: (1) the number of subjects is not sufficient; (2) there was no comparison with a foot and ankle disease group; (3) although efforts were made to ensure the lower limbs were as vertical as possible to the stress surface, there were still differences between the stress and weight-bearing positions. The magnitude of stress could not be directly measured; (4) to reduce volunteer’s radiation exposure, there was no comparison of ankle-related indicators between stress-position CT and regular CT; (5) patients require some training for the standing examination, and some patients, especially obese and young patient childrens, may have difficulty completing the movement satisfactorily; (6) there is a certain time limit for producing satisfactory stress, and there may be slight trembling of the lower limbs.
In future studies, further attempts will be made to improve the device to produce more stable and reliable stress, select suitable patients for stress-position CT examination, and conduct related data research.
Conclusion
This study validated that the stress position device can obtain valid footprints, and there is a strong correlation between stress position footprints and fully weight-bearing footprints. It confirms that the stress position device can generate effective pressure, and the application of the stress position device enables stress position CT examinations. Therefore, using the stress position device to simulate weight-bearing during CT examinations is feasible and can provide valuable references for foot and ankle diseases.
Footnotes
Declaration of conflicting interests
The author(s) declared no potential conflicts of interest with respect to the research, authorship, and/or publication of this article.
Funding
The author(s) disclosed receipt of the following financial support for the research, authorship, and/or publication of this article: This study was supported by grant from Medical Health Science and Technology Project of Zhejiang Provincial Health Commission, (Grant No. 2022ZH025).
Ethical statement
Data availability statement
The datasets used and analysed during the present study are available from the corresponding author on reasonable request.