
Abstract
Purpose
The talar bone plays a crucial role in ankle biomechanics and stability. Understanding the shape variability of the talar bone within specific populations is essential for various clinical applications. In this study, we aimed to investigate the mean shape and principal variability of the human talar bone in the Chinese population using statistical shape modeling (SSM).
Methods
CT scans of 214 tali were included to create SSM models. Principal component analysis was used to describe shape variation among the male, female, and overall groups.
Results
The largest amount of variation among three groups ranges from 17.2%–18.8% of each variation. The first seven principal components (modes) captured 62.4%–67.5% of the cumulative variance. No dominant shape of the talus was found. Male tali generally have a larger size than the female tali, with the exception of the articular surface of the anterior subtalar joint.
Conclusions
SSM is an effective method of finding mean shape and principal variability. Considerable variabilities were noticed among these three groups and all principal modes of variation. No dominant talar model was found to represent the majority of tali, regardless the gender. Such information is crucial to improve the current understanding of talar pathologies and their treatment strategies.
Keywords
Introduction
The talus bone is a critical component of the ankle joint complex,1,2 influencing ankle stability and biomechanics.3–6 Pathological conditions affecting the talus, such as fractures, flat foot, and osteochondral lesions, can alter its morphology and impact overall foot function.3,7–13 The shape variability of the talus within specific populations is important for accurate diagnosis, treatment planning, and implant design.3,4,14–17
Conventional radiographic measurements used to assess talar morphology often rely on feature points selected from images obtained through plain radiography, computed tomography (CT), or magnetic resonance imaging (MRI). Distances, angles, areas, or volumes are then calculated based on these feature points to describe the surface geometry of the talus.9,10,12,13,18–24 However, these methods present selection bias when choosing feature points and only utilized limited information of the images.17,25 Statistical shape modeling (SSM) provides a valuable tool for analyzing shape variations in bones. 26 By representing the surface of a bone with a set of points, SSM can capture the relative positions of these points and the patterns of shape variability observed among individuals.17,26
In this study, our main objective was to employ statistical shape modeling (SSM) to assess the shape variability of the human talus bone within the Chinese population. To account for potential gender differences, male and female tali were registered separately to capture the unique shape characteristics for each gender.
Materials and Methods
3D geometry acquisition
With Institutional Review Board approval, 108 healthy participants (51 females and 57 males, 106 participants contributed both tali; age: 23.44 ± 2.63 years; 19–37 years of age range, 171.00 ± 7.75 cm of height, and 65.93 ± 12.81 kg of body weight; body mass index (BMI):22.41 ± 3.28) were CT scaned using a CT scanner (Brilliance iCT, Philips. Cleveland, U.S.) with 120 kV voltage, 250 mA tube current, 0.625 mm of slice thickness, and 512 × 512 acquisition matrix in the Huashan Hospital, Fudan University, Shanghai, China. The assessments of all CT images were performed by senior foot and ankle surgeons (X.W. and X.M.) and no signs of previous trauma, severe deformity, or degenerative changes in the ankle, such as ankle arthritis, osteochondral lesions of the talus and talar cyst, were observed in the CT images of all ankles.
3D reconstruction and preprocessing
The Digital Imaging and Communications in Medicine (DICOM) file of each ankle was imported into Mimics (Materialise NV, Belgium) for the segmentation of the talus. The 3D model of each talus was imported into 3-Matic Medical (Materialise NV, Belgium) to clean from spikes. All right tali were mirrored and grouped together with the left talar bones.
The 3D surface models of tali were input to open-source SSM (ShapeWorks, University of Utah, Salt Lake City, UT, USA) for statistical shape modeling. 27 Each talus was rigidly scaled and aligned to a randomly chosen “master” talus iterative closest point method. Surface meshes were then converted to volumetric datasets in the form of distance transforms. The ShapeWorks constructs statistically optimal anatomical mapping across different shape samples by automatically computing a dense set of corresponding landmark positions that are geometrically consistent on a set of anatomy segmentations or surface meshes and does not rely on any specific surface parameterization. The final model used 1024 correspondence particles for each talus bone hierarchically placed using a computational optimization splitting strategy. Mean shapes and modes of variation for the talus were generated using the ShapeWorks. The correspondence particle locations were analyzed to define mean shapes, which were used to quantify differences in 3D anatomy.
Analysis
Principal Component Analysis (PCA) was used to reduce high-dimensional SSM correspondence data. It yielded a series of non-zero eigenvalues that characterize the amount of variance explained within an orthonormal eigenvector. Each uncorrelated dimension of variation was defined as “modes,” based on order of the eigenvalues. A parallel analysis was used to determine the number of statistically significant modes of variation. For each significant mode of the talus, the mean surface model was exported and the mean surface was warped about ±3 standard deviations (SD).
To visualize anatomic differences within a mode of variation, surface distance color maps were calculated between the mean and warped ±3 SD surface reconstructions in Geomagic Studio 2013 (Geomagic, Morrisville, North Carolina, United States). Deviation analysis was performed, in which the mean talus bone was used as the reference model, while the ±3 SD talus bone was used as a target model. The whole modeling process was presented in Figure 1. Flow chart of image and model processing. Subject-specific talus bone models were segmented and reconstructed from computed tomography images. Surfaces were reflected (all left limbs). Then all talus bones were isotropically resampled, padded, centered, and rigidly aligned. Correspondence particles were mathematically placed on each bone specimen to represent its unique shape. Principal component analysis (PCA) was used to analyze the variation of shape variations of talus bones. Finally, the deviation of the shape variations of talus bones was calculated and visualized.
Results
Principal component analysis and talus shape variation for the overall, male, and female groups
We examined the first seven PCA components and their principal talus shape variations (+3σ) for the overall, male, and female group. Contour plots identify areas of deviation with respect to the mean shape were presented in Figure 2–4. The cumulative shape variation in significant PCA modes of the Overall, Male, and Female groups was shown in Figure 5. Shape variation captured in PCA modes one to 7 of the overall group. Within each mode, shape variations are shown at ±3 standard deviations from the mean shape. Contour plots identify areas of deviation with respect to the mean shape. Shape variation captured in PCA modes one to 7 of the female group. Within each mode, shape variations are shown at ±3 standard deviations from the mean shape. Contour plots identify areas of deviation with respect to the mean shape. Shape variation captured in PCA modes one to 7 of the male group. Within each mode, shape variations are shown at ±3 standard deviations from the mean shape. Contour plots identify areas of deviation with respect to the mean shape. The cumulative shape variation in significant PCA modes of the Overall, Male, and Female groups. PCA modes are ordered based on the associated variance (bar), which determined the cumulative shape variation (curve).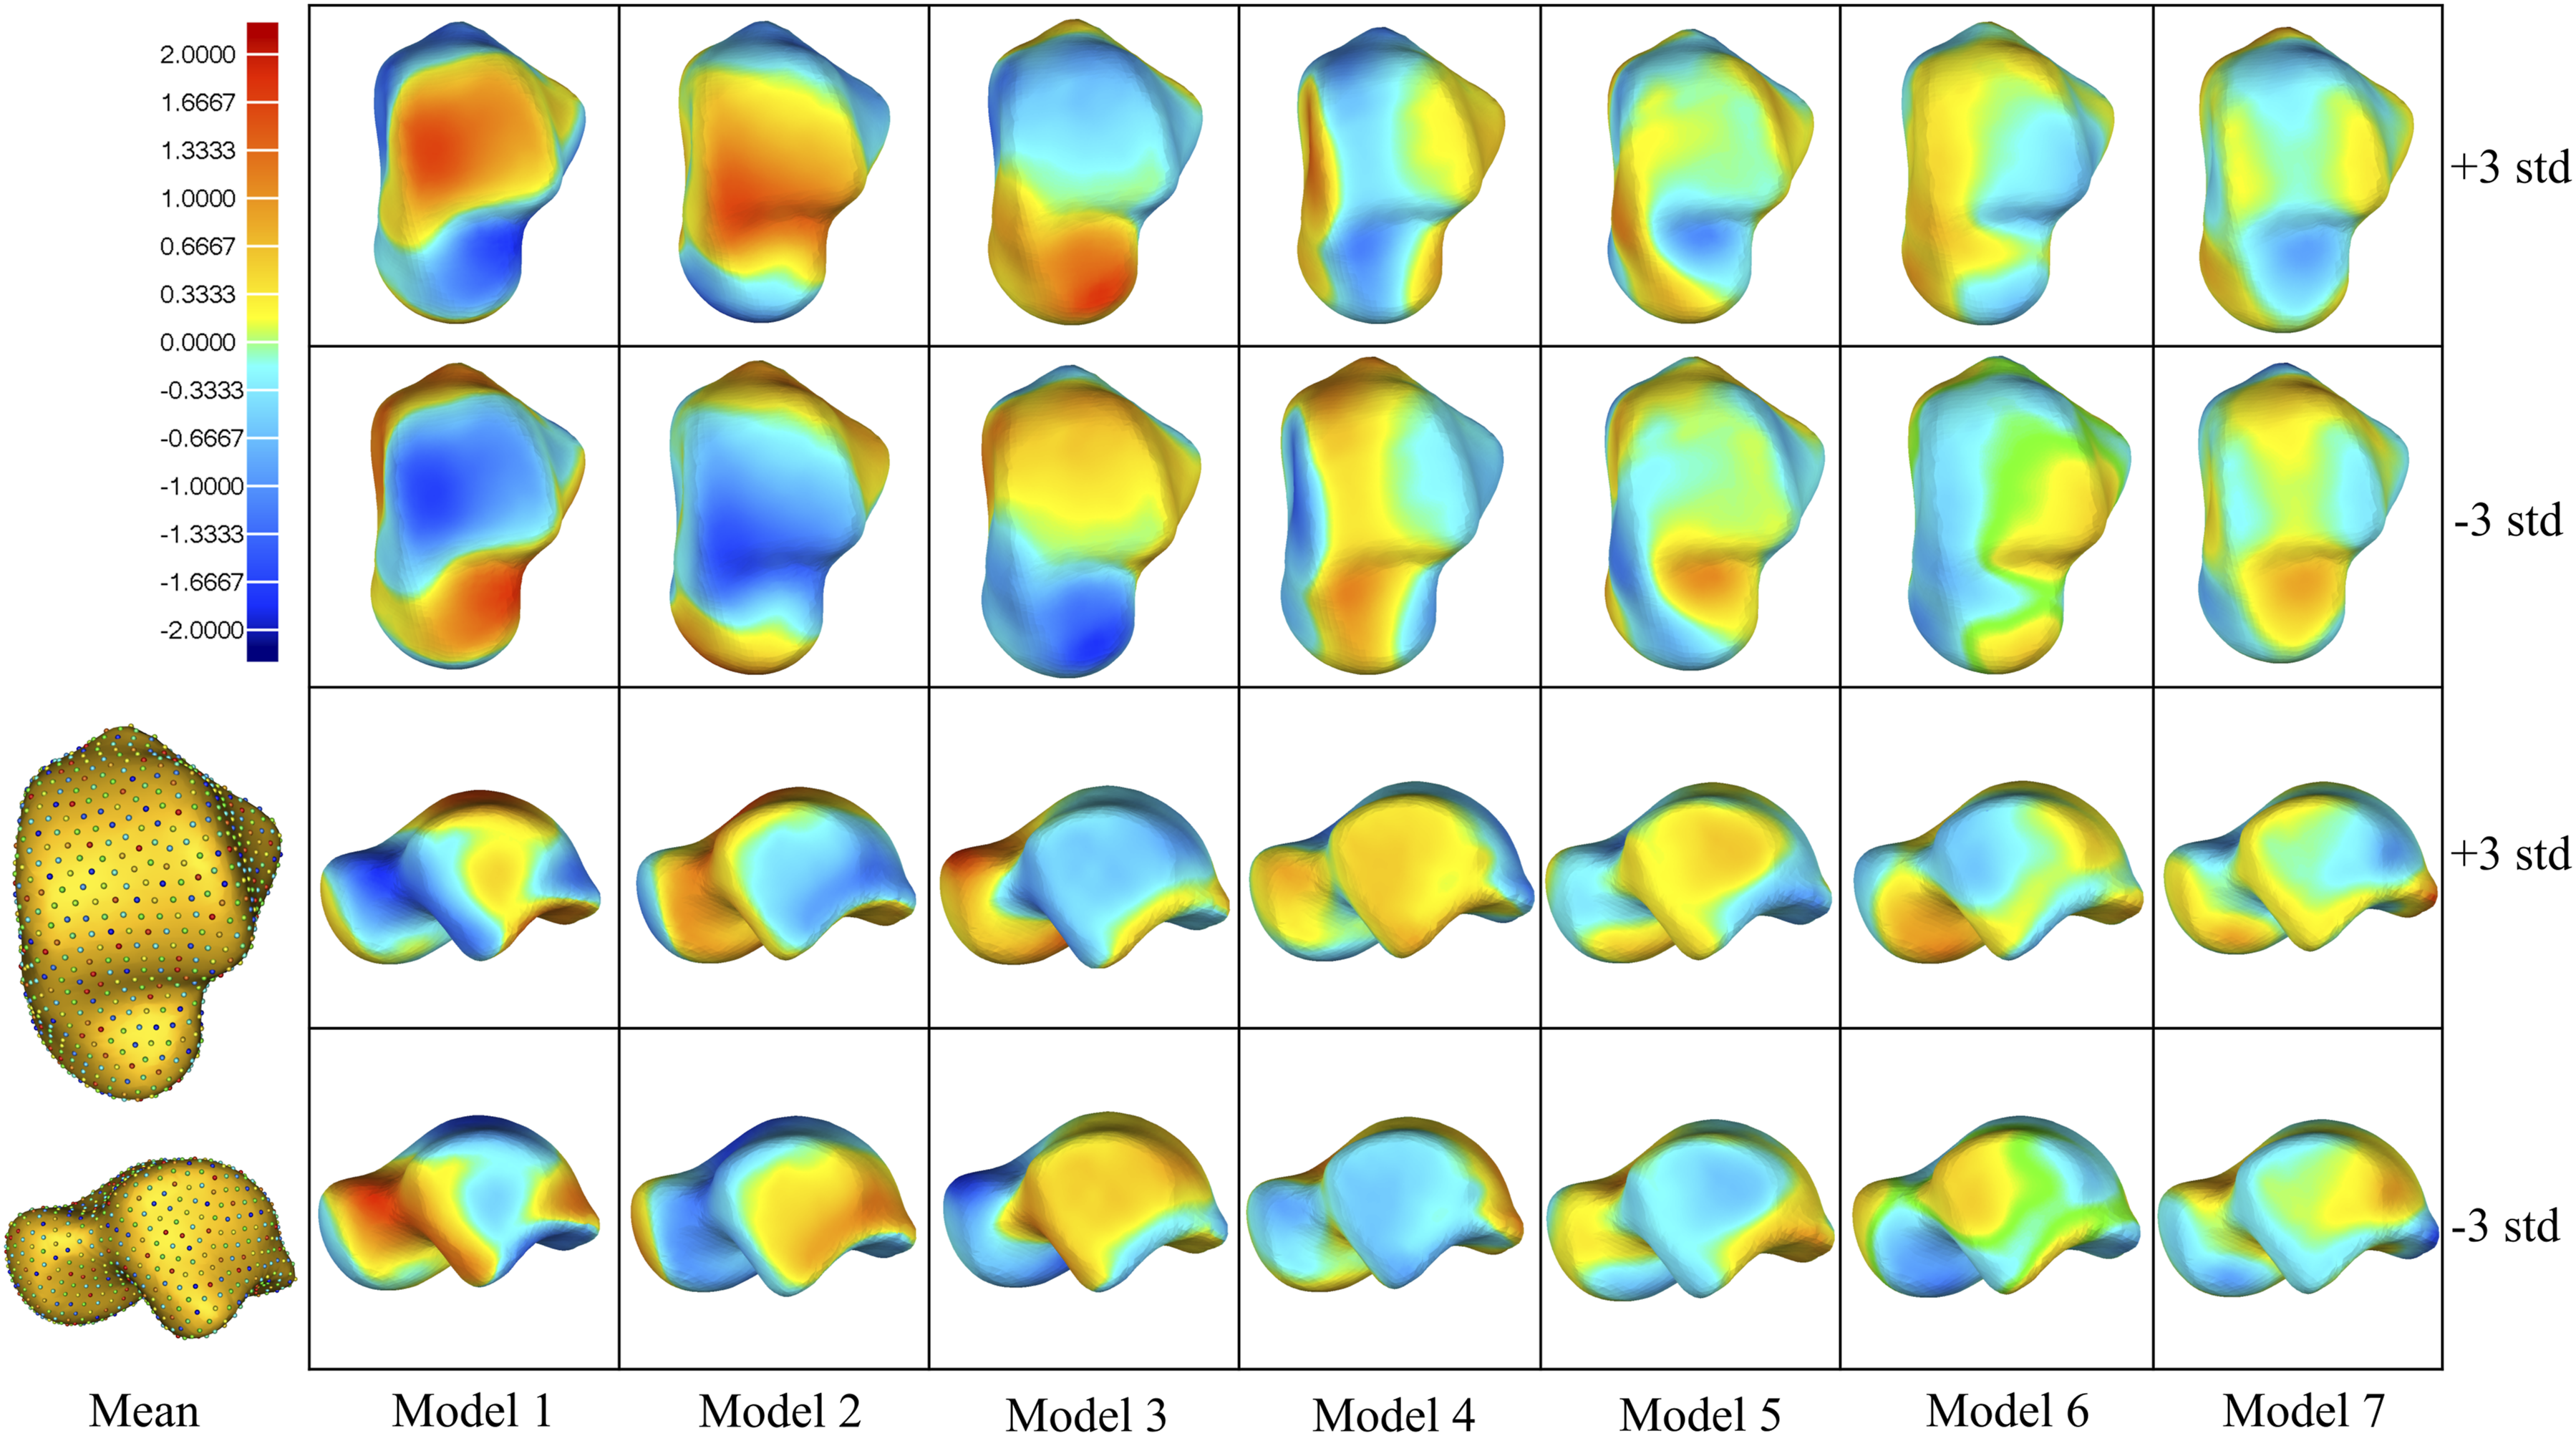

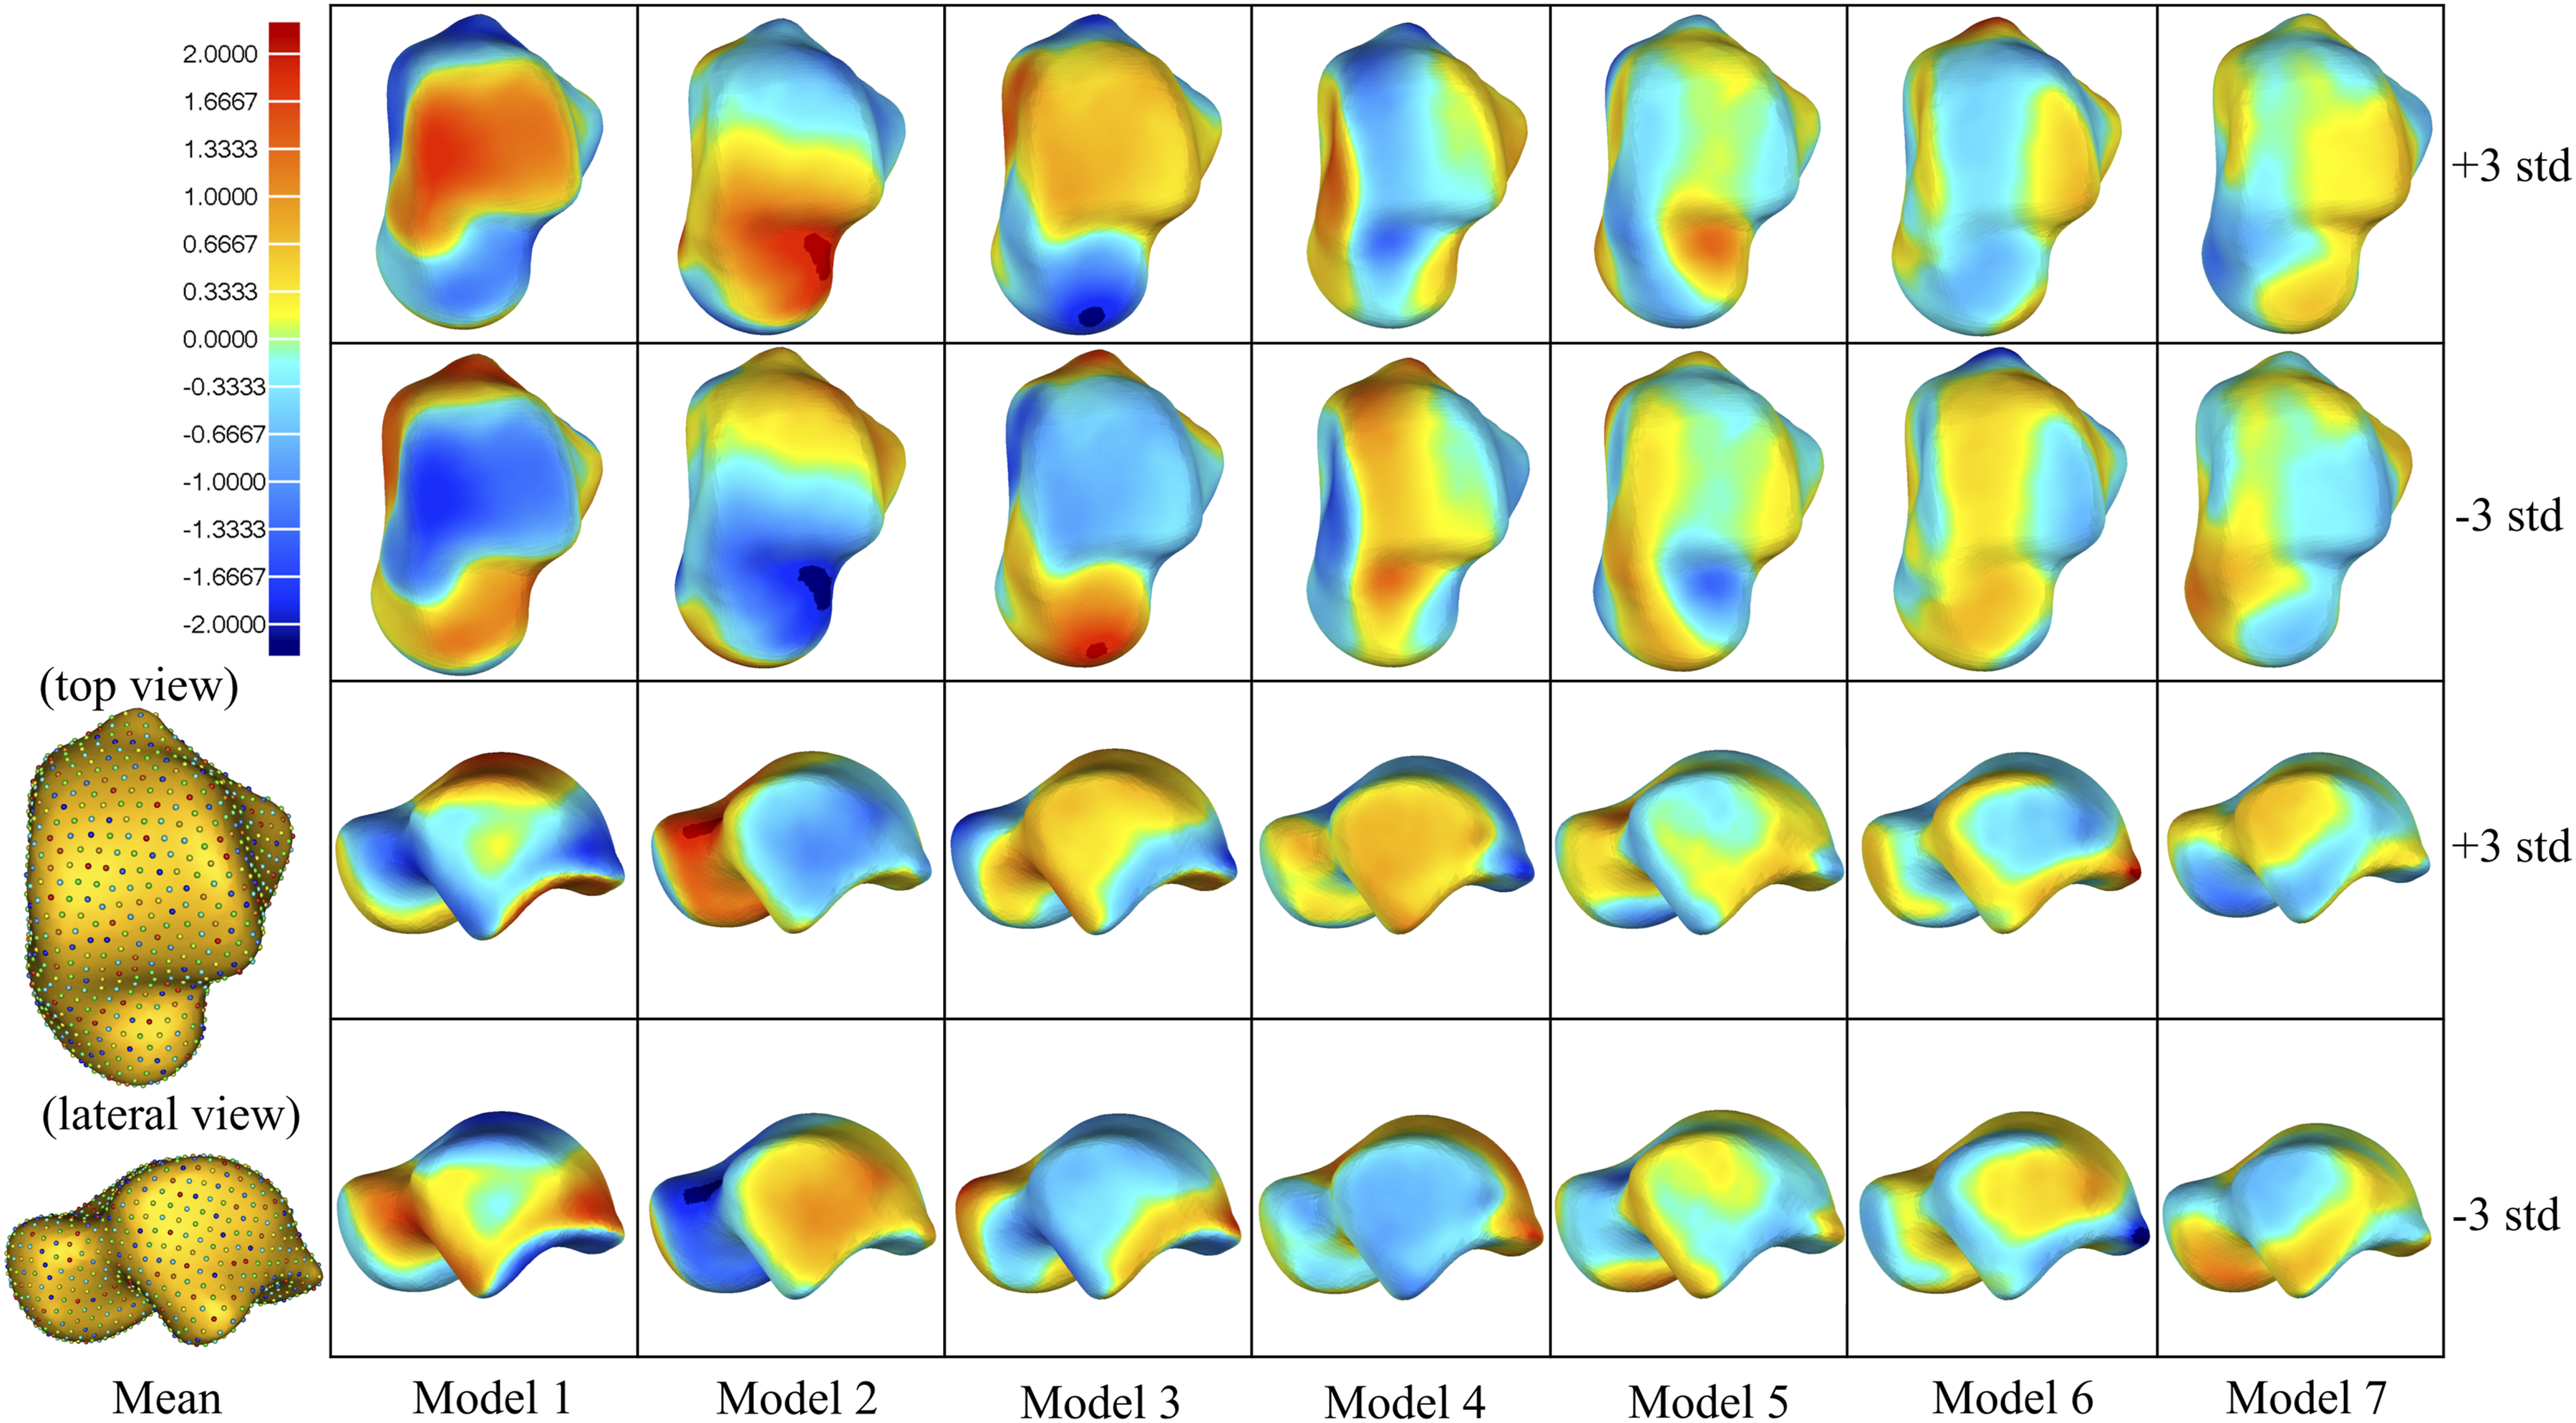

Anatomical variations of the talus were noted across these modes. In the overall group (Figure 2), remarkable differences in the first mode of variation included a variation of talus from top-bottom direction and anterolateral to posterior-medial direction. The second mode of variation showed a variation of talus from anterior-medial to posterior-lateral direction. The third mode of variation exhibited a variation of talus from anterior-top to posterior-bottom direction. The fourth mode of variation described a variation of talus in both the medial-lateral and up-down direction. The fifth mode of variation was a combination of a varying width of talar neck and talar body. The sixth mode of variation included small changes at the tip of talar posterior process, anterior lateral edge of the talar trochlear and the articular surface of the talar navicular joint. The seventh mode of variation in the overall group included small changes at the medial and bottom of the talar head and anterior lateral edge of the talar trochlear.
Shape variation in the female group showed a small change to the overall group (Figure 3). The first mode of variation showed a variation of talus from anterior-top to posterior-bottom direction. Remarkable differences in the second mode of variation included a variation of talus in anterior-lateral to posterior-medial direction. The third mode of variation exhibited a variation of talus in the anterior-posterior direction. The fourth mode of variation described variation in both the anterior-posterior and up-down direction. The fifth mode of variation was a combination of varying width of the talar neck and talar body. The sixth mode of variation included small changes at the lateral edge of the articular surface of the posterior subtalar joint, the medial and lateral edge of the talar trochlear, and the top and medial surface of the talar head. The seventh mode of variation included small changes at the medial and lateral side of the talar trochlear, anterior and posterior edges of the talar lateral process.
The first five modes of variation in the male group shared the same trend with the overall group (Figure 4). The sixth mode of variation described a variation of the talus in both the medial-lateral and anterior-posterior direction. Lastly, the seventh mode of variation in the male group included small changes at the anterior lateral edge of the talar trochlear, medial and bottom of the talar head.
The seven talar modes represented 17.2%, 14.4%, 11.5%, 6.6%, 4.9%, 4.1%, and 3.7% of the overall talus variation, respectively, which contained 62.4% of the overall shape variation (Figure 5). For the female group, the first seven talar modes represented 17.7%, 16.8%, 9.1%, 6.4%, 5.8%, 4.8%, and 4.6% of the overall talus variation, respectively. These modes contained 65.2% of the female shape variation. While the first seven talar modes (1–7) for male groups represented 18.8%, 15.9%, 12.4%, 7.1%, 5.1%, 4.5%, and 3.7% of the overall talus variation, respectively. The first seven modes of male tali contained 67.5% of the male shape variation.
Gender difference of mean models
Shape deviation among mean shapes of the overall, male and female tali were presented in Figure 6. We found that the mean shape of the male tali generally has a large size than that of the female tali, with the exception of the articular surface of the anterior subtalar joint. Compared with the female group, the mean shape of the male tali has a bigger talar head, longer and wider talar trochlear. However, at the bottom of the talar head, the mean shape of the female tali extrudes which means that its talar head has a large top-bottom thickness and is more plantar flexed. Shape deviation among mean shapes of the overall, male and female tali.
Discussion
In this study, we developed an SSM of the talus in the Chinese population using CT image data of 214 tali from 108 healthy individuals. The mean shape and principal variation of the talus were generated and gender difference was analyzed. Our results showed that the largest amount of variation among the overall, female and male ranges from 17.2%–18.8% of each variation, and no dominant shape of the talus was found. The first seven PCA modes contributed only about 60% of the shape variation. Similar results were found in the work by Vafaeian et al. 14 and Tumer et al. 28 Considerable variabilities were noticed among these three groups and all principal modes of variation, which highlights the complexity of the 3D shape of the talus and may not be clearly represented by 2D radiographs and described with 2D measurements. Our result of the shape difference of the first PCA at ± 3 standard deviations (SD) from the mean shape was in line with that provided in Liu et al. 29 and Lenz et al. 17 Our findings also do not support the idea30,31 that scaling a mean talus to design different sizes of total talar implants.
The deviation analysis of gender difference in this study revealed substantial variation between the mean shape of male and female tali. Compared with the female group, the mean shape of the male tali has a bigger talar head, a longer and wider talar trochlear. Clinically, it is well established that male generally has a bigger size of talus than female.4,32 However, it is noted that at the bottom of the talar head, the mean shape of the female tali extrudes which means that its talar head has a large top-bottom thickness and is therefore more plantar flexed. Therefore, we do not consider the average female shape to be geometrically similar to the average male shape as Liu et al 29 claimed.
The current study has several limitations. First, the current SSM only involves healthy young participants. Future work should expand the criteria for recruitment to represent the elderly population. Second, the cartilage of the talus was ignored in CT scanning. Around 60% of the surface of the talus was covered by cartilage, however, they cannot be displayed in CT images. Although the thickness of the cartilage is about 1 mm to 2 mm33,34 which may make a small impact on the current study, future studies involving MRI images may better describe the shape of the talus. 33 Finally, the interpretation of deviation results of principal modes of variation has inherent subjectivity. Thus, quantitative measurements should be developed in future studies to further identify the shape variability of the talus.
In conclusion, SSM is an effective method of finding mean shape and principal variability. Considerable variabilities were noticed among these three groups and all principal modes of variation. No dominant talar model was found to represent the majority of tali, regardless the gender. Male talus has a bigger talar head, longer and wider talar trochlear, however, female talar head has a large top-bottom thickness and is, therefore, more plantar flexed. Such information is crucial to improve the current understanding of talar pathologies and treatment strategies.
Ethical Statement
Ethical Approval
The study protocol was reviewed and approved by the ethics committee of the authors’ institute (HIRB Approve Letter (2021) No. 457).
Footnotes
Author contributions
All authors contributed to the study conception and design. Material preparation, data collection and analysis were performed by Jian Yu, Shuo Wang and Jinyang Lyu. The first draft of the manuscript was written by Shuo Wang and all authors commented on previous versions of the manuscript. All authors read and approved the final manuscript.
Declaration of conflicting interests
The author(s) declared no potential conflicts of interest with respect to the research, authorship, and/or publication of this article.
Funding
The author(s) disclosed receipt of the following financial support for the research, authorship, and/or publication of this article: This work was supported by the National Key R&D Program (Grant No. 2021YFC200235), the National Natural Science Foundation of China (Grant No. 82072388 and 82172378), and the Shanghai Committee of Science and Technology, China (Grant No. 21511102200).