
Abstract
Introduction
Generalized joint hypermobility (GJH) is a hereditary connective tissue disease in which the range of motion (ROM) of multiple joints exceeds the normal range, and the ROM varies with age, gender, and ethnicity. At present, the six-degree-of-freedom (6-DOF) of ankle kinematics among people with GJH have not been studied. To investigate the kinematic characteristics in the ankle during treadmill gait of university students with generalized joint hypermobility compared to normal participants. We hypothesized that compared to the participants in the control group, those with GJH would exhibit kinematic characteristics of poorer active motion stability in the ankle during treadmill gait.
Methods
Healthy university student volunteers aged 18–24 (excluding those with a history of ankle trauma, etc.) were recruited and divided into a control group (50 volunteers) and a GJH group (Beighton score ≥4, 50 volunteers). Data of the 6-DOF kinematics of ankle was collected using a 3D gait analysis system. Variables were evaluated using independent t-tests and Wilcoxon signed-rank tests.
Results
In the proximal/distal parameter, proximal displacement was significantly increased in the GJH group compared with the control group during 4–9% and 96–97% of the gait phase (loading response and terminal swing phase), with an increase of (0.1–0.2 cm, p < .05). Regarding the proximal/distal, internal/external, plantarflexion/dorsiflexion, and anterior/posterior parameters, the participants with GJH exhibited greater ROM than those in the control group throughout the gait cycle (0.24 ± 0.22 cm vs. 0.19 ± 0.15 cm, p = 0.047, 5.56 ± 2.90° vs. 4.48 ± 3.30°, p = .020, 23.05 ± 5.75° vs. 20.36 ± 4.91°, p < .001, 0.65 ± 0.30 cm vs. 0.55 ± 0.27 cm, p = .018). However, ROM of inversion/eversion translation was found to be decreased in the GJH group compared to the control group (8.92 ± 1.59° vs. 9.47 ± 1.37°, p = .009). In addition, there was no statistical difference between the GJH group and the control group in ROM of medial/lateral translation (0.05 ± 0.06 cm vs. 0.04 ± 0.05 cm, p = .131).
Conclusion
Our results confirm that our hypothesis is not valid. Although there were a few differences in each gait parameter of the ankle between the GJH group and the control group, the difference was not significant. These results indicate that the presence of GJH has less effect on ankle kinematics and enhance our knowledge of the relationship between GJH and 6-DOF of ankle kinematics.
Keywords
Introduction
Generalized joint hypermobility (GJH) is a hereditary connective tissue disease in which the range of motion (ROM) of multiple joints exceeds the normal range, and the ROM varies with age, gender, and ethnicity. Some patients with GJH are asymptomatic, and joint hypermobility syndrome (JHS) is the combination of GJH with joint pain, dislocation, and other symptoms. 1 GJH is most often observed in children and tends to diminish with age. 2 Some researchers reported that the global incidence rate of GJH in adults was 11–38%,3–5 depending on the definitions used. Beighton scores6,7 are broadly used in the world to diagnose GJH. These scores are based on the measurement of the passive locomotion range in all the body joints among patients.
The ankle is one of the main joints of the motor chain of the human lower limb joints and bears very important weight-bearing and motor functions. Gait analysis is a science to study the walking regularity of patients, and has been widely used to study the kinematic gait performance of human lower limb (including hip, knee, ankle, etc.) joints.8–10
Kamran Azma et al. showed that the incidence rate of ankle sprains among hypermobility patients is high compared to that of healthy people during military training. 11 In addition, Raoul H. H. Engelbert et al. found that children frequently visit pediatric clinics due to generalized hypermobility of the joints and musculoskeletal complaints. 12 Individuals with hypermobility are prone to metatarsalgia, hallux valgus, and patellofemoral pain, 13 and Shawn Robbins et al. found that changes in kinematic parameters and muscle activation during tread among people with Ehlers–Danlos syndrome may result in damaging balance and proprioception, as well as muscle deficits. Measures should be taken to improve these situations. 14 However, Peter R. Reuter reports that people with GJH are not necessarily more likely to suffer ankle injuries, such as sprains. 15 Flowers et al. carried out a survey and found that 7% of 1987 participants diagnosed with GJH developed diseases such as arthritis. 16 In addition, GJH has been associated with increased risk of ligament injuries and possible premature arthritis. 17 However, Yvonne et al. showed that GJH is not associated with ankle arthritis. 13
GJH features joint laxity and overactivity. Therefore, people with GJH present different kinematics than people with normal joints. 18 Gait observation can be used to help identify the kinematic changes caused by excessive joint movement. Ankle overactivity is an especially considerable part of GJH, so there have been many kinematic research studies on it. Nevertheless, Helene Nikolajsen found that children with GJH had reduced ankle movements compared to their normal counterparts. 19 As a result, the ankle kinematics of GJH patients remain unknown, and it is unclear whether such differences in gait have clinical significance for normal people. Moreover, at present, the six-degree-of-freedom (6-DOF) of ankle kinematics among people with GJH have not been studied.
Our objective in this research was to analyze the 3D gait of students in university and compare and contrast the outcomes for normal people and GJH patients to identify any abnormal gait parameters. We hypothesized that inferior active locomotion in the gait parameters of the ankle would be detected among the participants with GJH.
Materials and methods
Our team recruited the volunteers randomly in a Chinese university. Information was collected using questionnaire surveys about participants’ heights, weights, genders, ages, and medical histories of musculoskeletal disorders. Volunteers with histories of lower extremity major injury and surgery, trauma, Marfan syndrome (including connective tissue disorder, positive family and history of musculoskeletal complications), Ehlers–Danlos syndrome, or body mass indexes over 30 were excluded from this study. This research protocol was agreed to by the Institutional Review Board (SUMC-2019-26), and written informed consent was obtained from all participants. A researcher used the standardized Beighton scoring scheme to assess each participant. 7 The positive criteria for GJH diagnosis were the following: the measurements included the range of motion of the fifth metacarpophalangeal joint, the thumb, the elbow, the knee, and the spine. (1) (bilateral) If the passive back flexion of the fifth metacarpophalangeal joint can reach more than 90°, it is positive; (2) (bilateral) If the passive hyperextension of the elbow or knee can reach more than 10°, it is positive; (3) (bilateral) If the thumb can completely contact the forearm flexion side during extension under the conditions of shoulder flexion 90° and elbow extension, it is positive. (4) If the trunk bends its palm forward and can be easily placed on the floor when standing knees are straight, it is positive. According to the Revised 1998 Brighton Criteria, 20 people with Beighton scores of ≥ 4 were defined as having GJH.21,22 Our team used this criterion to test each participant, and those who met the above characteristics were placed in the GJH group.
The 6-DOF kinematic data about the subjects’ ankle were collected using a gait analysis system (Opti_kneepro, Innomotion Inc, Shanghai, China). This gait analysis system was made up of a high-speed camera, two marker clusters, a workstation computer, a surgical navigation stereo infrared tracking device, and a handheld digitizing probe. The marker clusters were fastened to lower leg and foot. The handheld probe was used to identify bone makers, including medial femoral condyle, lateral femoral condyle, medial malleolus, lateral malleolus, and second metatarsal. An integrated synchronous high-speed camera (Basler aca 640–90uc; Basler AG) was used to record and simultaneously identify gait cycles. The kinematic parameters of the participants’ ankle were calculated using customized software (Opti_kneepro, Shanghai Innomotion Inc.) (Figure 1(a) and (b)). A tread speed of 3 km/h was regulated for all participants by using a horizontal bi-directional treadmill. After each volunteer adapted to walking on the machine, the gait analysis system was used to collect 6-DOF data about their ankle. The ankle 6-DOF kinematic data during treadmill gait was normalized (1–100%, from heel strike to heel strike). The gait cycle was divided into the stance phase (1–62%) and the swing phase (62–100%).
23
Specifically, the stance phase was divided into initial contact (0–2% gait cycle), loading response (3–12% gait cycle), mid-stance phase (13–31% gait cycle), terminal stance phase (32–50% gait cycle) and pre-swing phase (51–62% gait cycle). The swing phase was divided into the initial swing phase (63–75% gait cycle), mid-swing phase (76–87% gait cycle), and terminal swing phase (88–100% gait cycle).24,25 Photos of experimental setup and example of three-dimensional coordinate systems of the tibia and foot. (a) This gait analysis system was composed of a workstation computer, a surgical navigation stereo infrared tracking device, a high-speed camera, a hand-held digitizing probe and two marker clusters. (b) The marker clusters were fastened to the lower leg and foot. The subject ‘s ankle joint coordinate system was used to establish the calibration scene of bony landmark points. The operator applied infrared light navigation probe to identify the patient’ s bony landmark points (medial femoral condyle, lateral femoral condyle, medial malleolus, lateral malleolus, and second metatarsal) to establish personalized ankle joint coordinate systems. (c) Definition of the whole foot and tibia coordinate systems. This system was used to determine the 6DOF motions of the ankle, including three angular motions and three translational motions. The three angular motions were plantarflexion/dorsiflexion, inversion/eversion, and internal/external rotation. The three translational motions were anterior/posterior translation, distal/proximal, and lateral/medial translation. These six motions fully describe the movements of the ankle.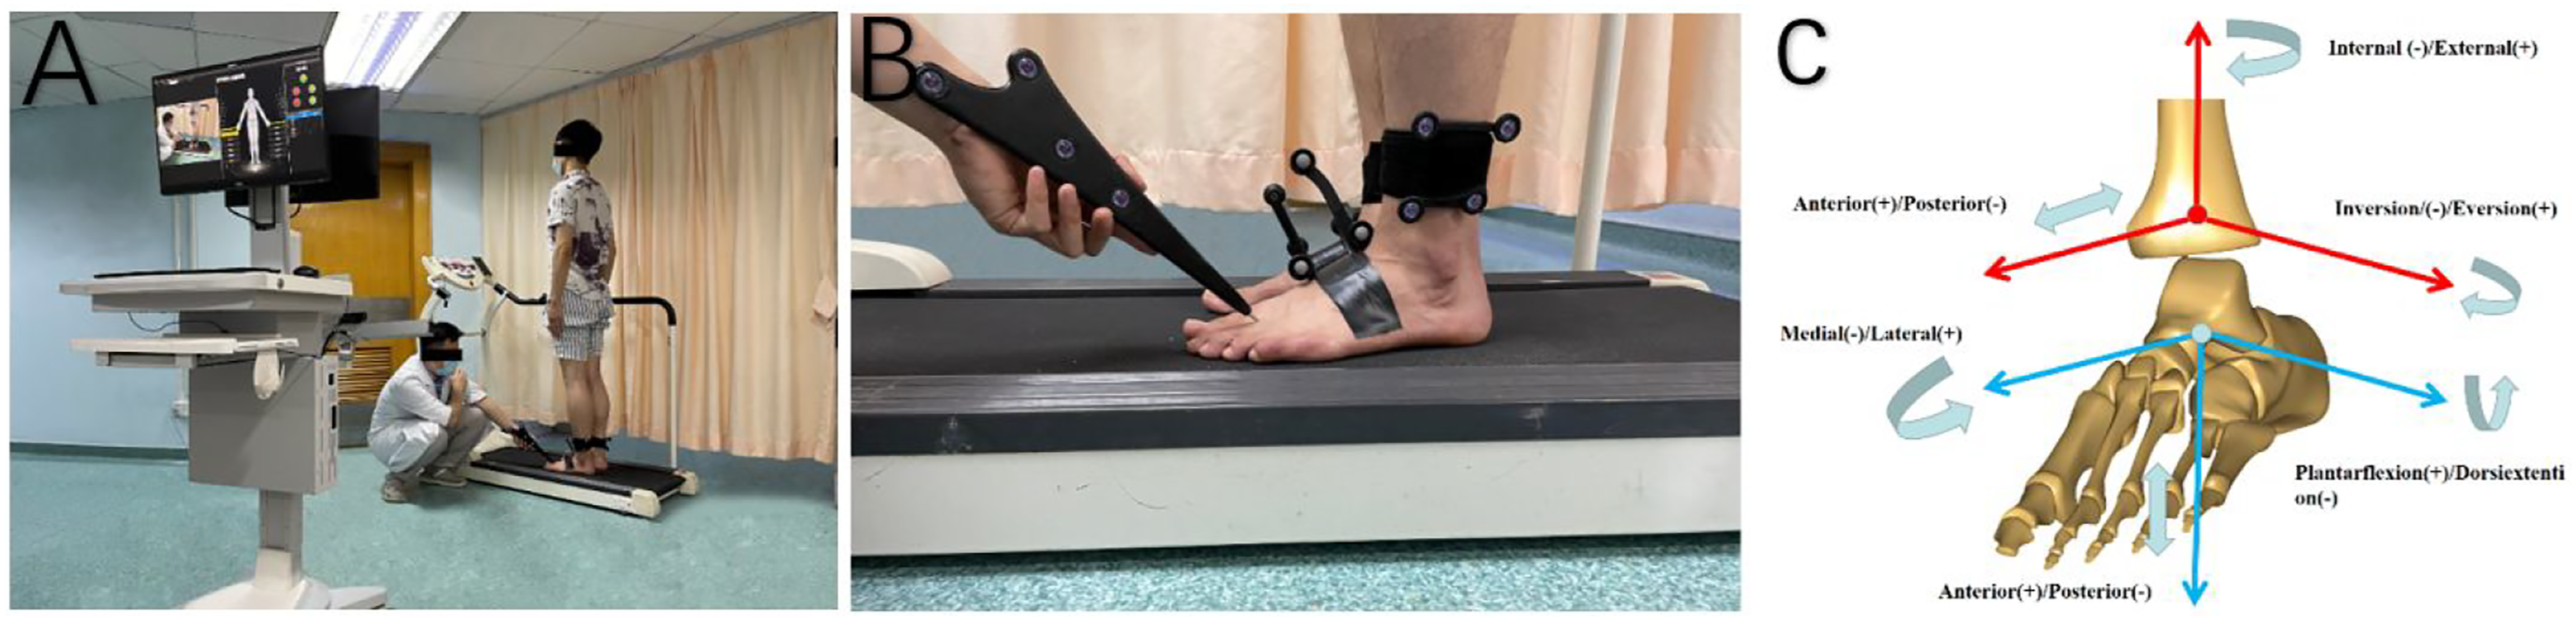
In a pilot study, 10 subjects (5 males and 5 females) were recruited in each group for sample size calculation with the ‘Two Independent Means’ module in PASS version 15.0 (NCSS, LLC. Kaysville, Utah, USA). We selected the flexion angle ROM as a primary kinematic parameter based on its wide applications.25,26 The average flexion angle ROM was found to be 22.9° for the GJH group and 18.2° for the Control group at 3.0 km/h. The power (1-β) was set to 0.8. The significant level was set at 0.05. The results showed that sample size of 18 ankles in each group could detect kinematic differences between two group, with a significant level of 0.05. Therefore, the subjects recruited in this study (50 ankles in GJH group, 50 ankles in Control group) met the sample size requirement.
Data was statistically analyzed utilizing SPSS version 26.0 (SPSS, Chicago, IL, USA). Mean values (with standard deviations) were made use of to represent continuous variables conforming to normal distribution by using independent t-tests. Nevertheless, Wilcoxon signed-rank tests were conducted for the variables. p values of <0.05 were regarded as indicating statistical significance.
Results
Description of demographic characteristics of GJH group and control group.
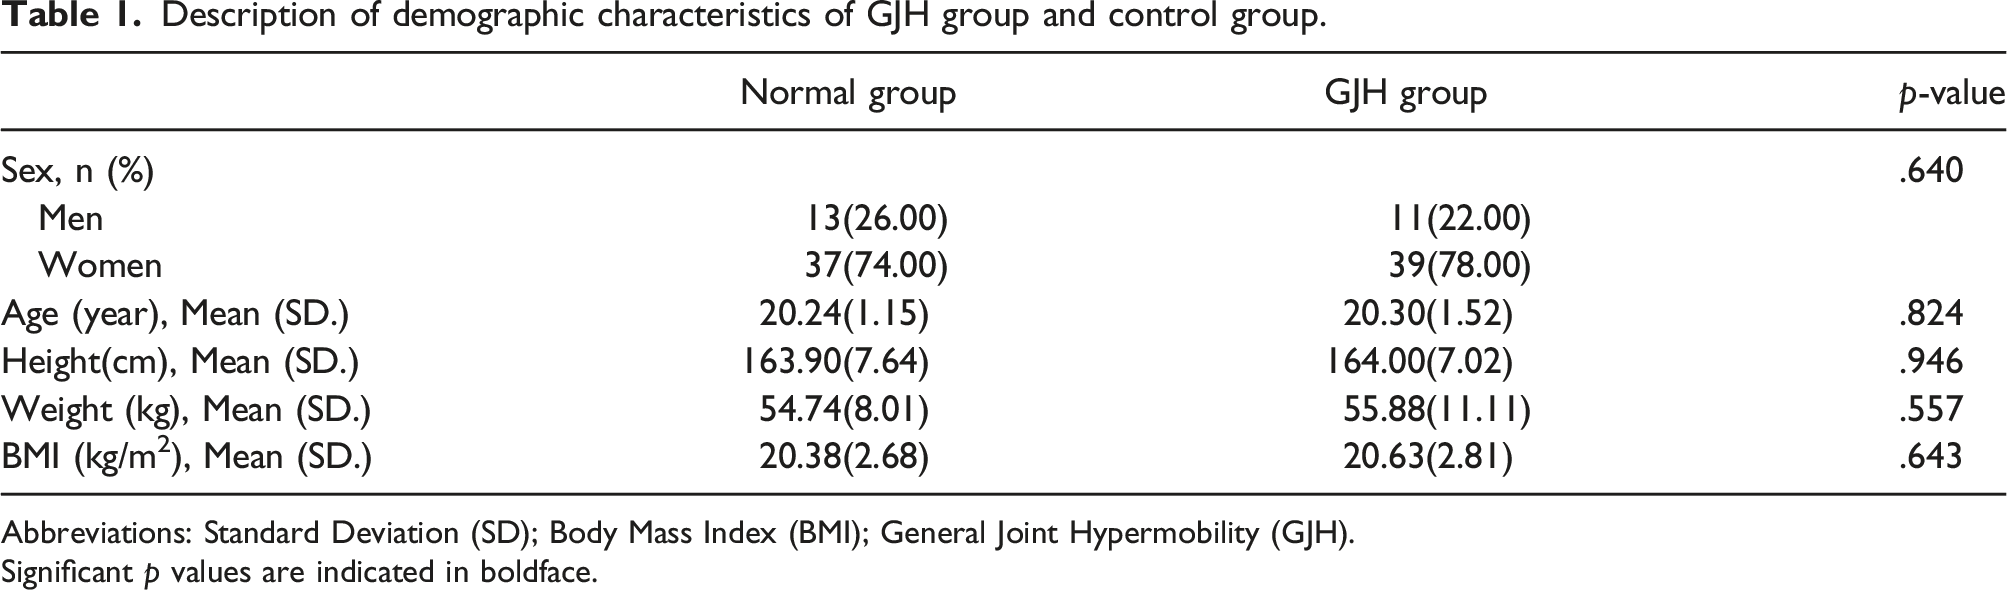
Abbreviations: Standard Deviation (SD); Body Mass Index (BMI); General Joint Hypermobility (GJH).
Significant p values are indicated in boldface.
The ROM of 6-DOF of ankle in GJH group and Control group (mean ± SD).

*p < .05 between the GJH group and the control group.
Abbreviations: Standard Deviation (SD); General Joint Hypermobility (GJH); Range of Motion (ROM); Six-Degree-of-Freedom (6-DOF).
Significant p values are indicated in boldface.
There was no significant difference in gait speed between the two groups because all the participants walked on the treadmill at 3 km/h. The definition of the whole foot and tibia coordinate systems are demonstrated in Figure 1(c). Ankle kinematic features are exhibited in Figure 2. The dashed curve shows the SD and the solid curve shows the average. Critical events of gait parameters were compared between the two groups. Ankle kinematic features of six-degree-of-freedom at 3 km/h on a treadmill. The descriptions of standard deviation (dashed line) and the average (solid line) of ankle kinematics between the general joint hypermobility group (greed line) and the control group (black line). *The significant difference is set at 0.05 level. Abbreviations: GJH= general joint hypermobility.
For the plantarflexion/dorsiflexion parameter, the ankle remained plantarflexion throughout the gait cycle between two group. The angle decreased from the start of the gait cycle until the stance phase (approximately 53% in the gait phase) reached the minimum plantarflexion (13.46 ± 18.32° vs 12.38 ± 4.71°, t = -0.404, p = .687), then the plantarflexion angle gradually increased and peaked at the swing phase (approximately 69% in the gait phase). The maximum flexion angle was (35.87 ± 21.43° vs 30.01 ± 8.30°, t = 1.775, p = .079), after which the plantarflexion angle decreased until the end of the gait cycle.
Regarding the internal/external parameter, the ankle showed internal rotation during the gait cycle between two group, and the ankle angle was about (8.66 ± 8.04° vs 6.79 ± 5.35°, t = 1.370, p = .174) during standing in both groups, which gradually increased with the start of the gait cycle, reaching a maximum value of (12.91 ± 9.42° vs 12.26 ± 8.68°, t = 0.355, p = .724) during the swing phase (about 66% during the gait phase), followed by a gradual decrease in the internal rotation value, reaching a minimum value by the swing phase (about 74% during the gait phase), which was (5.04 ± 7.1° vs 4.55 ± 6.7°, t = − 0.350, p = .727), after which the internal rotation value decreased to the middle swing phase (about 82% during the gait phase) with the progress of the gait cycle until the end of the gait cycle.
Concerning the inversion/eversion parameter, both groups showed inversion at the ankle during the gait cycle, and a gradual decrease in inversion angle showed that the valley was reached at 39% of the gait cycle in the gait cycle diagram, and the minimum inversion angle was (6.56 ± 11.84° vs 7.44 ± 8.02°, t = − 0.437, p = .663). Afterwards, the inversion angle gradually increased and peaked at about 59% of the gait cycle. The maximum value of inversion was (10.29 ± 13.02° vs 10.93 ± 8.72°, t = − 0.344, p = .732), and then the inversion gradually decreased to the initial angle as the gait cycle progressed, signifying the end of a gait cycle.
Regarding the anterior/posterior parameter, the ankle of both groups always showed a posterior displacement state during the gait cycle, which gradually increased from the beginning of the gait cycle to the maximum (1.27 ± 0.86 cm vs 1.23 ± 0.70 cm, t = 0.191, p = .849) in the early swing phase (about 70% of the gait phase), and then decreased with the progression of the gait cycle, indicating the end of a gait cycle.
In the proximal/distal parameter, subjects in both groups showed a gradual decrease in the proximal displacement distance of the ankle starting with the start of the gait cycle showing to be 0 at 31% of the gait cycle time in the gait cycle diagram. Afterwards, the distal direction displacement gradually increased, and the ankle began to show proximal displacement by about 64% of the gait cycle, reached a maximum of (0.53 ± 0.67 cm vs 0.41 ± 0.37 cm, t = -0.950, p = .345) by about 63% of the gait cycle, and then gradually decreased to the initial displacement as the gait cycle progressed. Proximal displacement was significantly increased in the GJH group compared with the control group during 4–9% and 96–97% of the gait phase (loading response and terminal swing phase), with an increase of (0.1–0.2 cm, p < .05).
Concerning the medial/lateral translation, Gait profile was flat in both groups, and there was no statistically significant difference between the two groups during the whole gait period.
Regarding the proximal/distal, internal/external, plantarflexion/dorsiflexion, and anterior/posterior parameters, the participants with GJH exhibited greater ROM than those in the control group throughout the gait cycle (0.24 ± 0.22 cm vs. 0.19 ± 0.15 cm, p = .047; 5.56 ± 2.90° vs. 4.48 ± 3.30°, p = .020; 23.05 ± 5.75° vs. 20.36 ± 4.91°, p < .001; 0.65 ± 0.30 cm vs. 0.55 ± 0.27 cm, p = .018). However, ROM of inversion/eversion translation was found to be decreased in the GJH group compared to the control group (-8.92 ± 1.59° vs. -9.47 ± 1.37°, p = .009). In addition, there was no statistical difference between the GJH group and the control group in ROM of medial/lateral translation (0.05 ± 0.06 cm vs. 0.04 ± 0.05 cm, p = .131).
Discussion
Generalized joint hypermobility is characterized by abnormal range of motion of systemic joints due to relaxation of surrounding ligaments and decreased muscle strength, which is mainly affected by their race, gender, and age, and is a connective tissue hereditary disease, in addition, periarticular ligament relaxation may eventually lead to the development of arthritic pairs.1,27 It has been found that female patients have a higher degree of joint laxity than male patients, with a prevalence approximately three times that of male patients,5,28,29 and the symptoms of laxity gradually decrease with age in male patients, while the joint laxity gradually increases with age after 15 years in female patients. 30 In females, hormones affect the extensibility of ligaments, and the phenomenon may be caused by hormonal changes that occur during puberty.30,31 However, it has been documented that this phenomenon is advantageous for gymnasts or rhythmic performers.1,19,27 The prevalence of GJH was higher in women than in men,5,32 which may be one of the reasons why the proportion of adult women with GJH was also higher in the experimental group of this study than in adult men.
Nowadays, there are six main clinical evaluation methods for the classification of GJH, including two questionnaire evaluation methods (Beighton Score-reported, Five-part self-questionnaire), and four test evaluation methods (Hospital del Mar, Rotes Querol, Carter and Wilkinson, Beighton Score). 33 The Beighton Score has been tested for reliability and validity. The Beighton score is widely used for the diagnosis of GJH, including measuring the passive range of motion of joint pairs throughout the body. 34 According to the literature, the Beighton score is an effective measure of generalized joint motor ability in children, but hyperactivity (Beighton 6/9) does not predict future musculoskeletal pain in preschool, adolescent, and adolescent children. 35 For adults, different test assessment methods can be used, but the main one is the Beighton score. 5
Due to racial differences in the incidence of GJH and the use of differing Beighton score thresholds to identify GJH, different researchers have arrived at different results about the prevalence of GJH. Based on the results of many studies, a Beighton score threshold of ≥4/9 can be used to diagnose adults with GJH. 33 However, children are regarded as having GJH when they have Beighton scores of ≥ 5–7/9. 36 The International Federation of Ehlers–Danlos syndrome came to a consensus on the Beighton scoring criteria for diagnosing GJH in 2017: ≥6 points for children and adolescents before puberty, ≥ 5 points for men and women under 50 years old, and ≥4 points for people over 50 years old. 36 To make our kinematic research results comparable to other research results, we chose a ≥4/9 cut-off point, which is broadly utilized in adults with GJH.21,37,38
The authors of the current study found that concerning the proximal/distal parameter, proximal displacement was significantly increased in the GJH group compared with the control group during 4–9% and 96–97% of the gait phase (loading response and terminal swing phase), with an increase of (0.1–0.2 cm, p < .05), and Gait profile coincidence rates were higher in both groups on medial/lateral translation in both GJH and control groups, with no statistical difference throughout gait and ROMs between two groups. It is also possible that this phenomenon may be an abnormal gait phenomenon exhibited by GJH patients by means of muscle compensation to overcome ligament relaxation. 39 In our study, it was found that other parameters of the ankle were not significantly different in the GJH control group on the gait pattern, which may be due to the compensatory effect of the muscles around the ankle. 40
Ankle stability relies on muscles, active (musculotendinous) and passive (ligamentous) restraints to prevent injury. 41 It has been reported that lower extremity motor function is mainly dependent on muscle strength around the ankle, and muscle damage may limit daily activities. 42 This research on university students’ ankle strengthened our understanding of abnormal gait patterns among people with GJH. Proximal displacement was significantly increased in the GJH group compared with the control group during loading response and terminal swing phase, and regarding the proximal/distal, internal/external, plantarflexion/dorsiflexion and anterior/posterior parameters, the participants with GJH exhibited greater ROM than those in the normal group throughout the gait cycle, consistent with most literature describing increased range of motion in GJH as a result of ligament laxity and muscle dysfunction around the ankle.19,21,43–46 Hypermobility may be caused by deficiency of one or more of these structures. Regardless of the underlying cause, hypermobile joints may depend on the stability of musculotendinous function, which may lead to muscular strain and pain. Hypermobile joints can also alter the biomechanics of the body, leading to compensatory changes and further strain. 43 The most common ankle injury, lateral ankle sprain, is caused by unrestrained inversion and plantar flexion. 41 However, the inversion and eversion parameters of ankle ROMs during the gait cycle was reduced compared with the control group in our study. In two other reviews was shown that people with GJH have a higher prevalence and incidence of lower limb injuries 47 and factors contributing to the risk of arthritis are joint injuries. 48 Bruce D. Beynnon et al. revealed that ankle injuries were more common in women with increased tibial varum and calcaneal eversion range of motion, whereas no such relationship was found in men. 49 However, as reported by literature, GJH have little effect on the ankle50,51 and show a similar or reduced injury risk for athletes with GJH. 52
Dorsiflexion and plantarflexion are the main ankle movements. 26 We speculated that the danger of ankle sprain and ankle arthritis could increase due to increases in the ankle plantarflexion range during gait cycle caused by GJH in our study. Some scholars found that ankle sprain could develop into chronic ankle instability, finally leading to arthritis which aligned with the research finding that future ankle sprains may be predicted among patients with decreased balance. 52 However, de Noronha et al. observed that an increased risk of ankle sprain could be found among people with GJH due to the reduction of ankle dorsiflexion. 53 Furthermore, Hamid Rahmatullah Bin Abd Razak et al. reported that conditions of the musculoskeletal system, such as ankle sprains, cruciate ligament weakness, and the dislocation of joints are related to the generalized ligamentous laxity, and they suggested that people with these conditions should take part in non-contact activities such as swimming, Pilates, and Tai Chi. 54 However, other researchers suggested people with GJH who are asymptomatic can be fully involved in sports exercise, and sport participants with generalized joint hypermobility have no altered risk of ankle injury.50,55
The limitation of the study is that the participants were only from the same university. Another limitation of this study is the relatively small sample size of the study. However, the size of the sample size is acceptable by sample size calculation. The results showed altered kinematics due to GJH rather than accidental result. The relationship between GJH and sports injuries and arthritis require further in-depth study.
Conclusion
Our results confirm that our hypothesis is not valid. Although there were a few differences in each gait parameter of the ankle between the GJH group and the control group, the difference was not significant. These results indicate that the presence of GJH has less effect on ankle kinematics and enhance our knowledge of the relationship between GJH and 6-DOF of ankle kinematics. However, patients with GJH can perform intensive muscle training or bicycle exercises, such as swimming, Pilates, and Tai Chi, which can enhance ankle stability in patients with GJH.
Highlights
(1) Although there were a few differences in each gait parameter of the ankle between the generalized joint hypermobility group and the control group, the difference was not significant. (2) The plantarflexion/dorsiflexion parameter was important in gait cycle. (3) Presence of generalized joint hypermobility has less effect on ankle kinematics, which enhance our knowledge of the relationship between generalized joint hypermobility and six-degree-of-freedom of ankle kinematics.
Footnotes
Acknowledgements
We would like to thank the volunteers recruited in this study sincerely.
Declaration of conflicting interests
The author(s) declared no potential conflicts of interest with respect to the research, authorship, and/or publication of this article.
Funding
The author(s) disclosed receipt of the following financial support for the research, authorship, and/or publication of this article: This study was supported by the National Natural Science Foundation of China (81972126), Doctoral startup Foundation of Guangdong Provincial People’s Hospital (2020bq10), and Natural Science Foundation of Guangdong Province (2022A1515011323). The funding organization provided experimental devices and testing venues for the current study. No other relationships or activities that could appear to have influenced the submitted work.