
Abstract
Introduction
Three-dimensional (3D) patient-specific cutting guides are increasingly promoted for deformity correction procedures.1,2 Recent publications evaluating these techniques reported significantly lower rates of outliers and unintended changes in the medial proximal tibial angle (MPTA) and the tibial posterior slope (TPS).3–8 Despite the promising in vitro and in vivo results regarding the accuracy, an according improvement of the clinical outcome has not been observed to date. 9 In order to better understand the full potential of these new approaches and to ultimately improve patient reported outcome measures, the reliability of every single step should be examined closely. Right now, 3D HTO is performed in cooperation with companies and their engineers and not by physicians.1,2
Medial open wedge high tibial osteotomy (HTO) is an established surgical procedure for the correction of tibial varus deformities and the treatment of symptomatic medial osteoarthritis of the knee caused by proximal tibial deformity.10–13 Based on a quite elaborate preoperative planning, the procedure aims to precisely increase the MPTA to a predefined extend towards more valgus.
Unfortunately, unintended changes in the sagittal and axial plane represent a common clinical phenomenon. The underlying mechanisms and consequences have not yet been fully understood. Various clinical studies described an increase of the TPS and the tibial torsion.10,14–18 If the actual osteotomy is conducted from anteromedial instead of strictly medial, the resulting more posterolateral leads to an increase in TPS. Wang et al. 15 called this the “hinge effect” and first reported their findings in 2009. This is associated with a decreased extension of the knee and altered knee kinematics.17,18 Particularly in patients with insufficient anterior cruciate ligament (ACL) this has a negative effect and must be avoided when performing a HTO. 16 Increased tibial torsion in HTO patients is also frequent and not fully understood, as it has been attributed either to hinge position or soft tissue tension.19,20
In a first study we developed a standardized 3D assessment tool to perform a 3D analysis of the 3D tibial anatomy. 21 In this study, the standardized 3D planning method of an HTO was tested for reliability and reproducibility fully by physicians. At the same time, several simulations of the HTO were performed to explain unintended changes in the anatomy.
Materials and methods
This study is divided into three parts. First, we developed a standardized design of an HTO in 3D, which can be performed by the treating surgeons. Second, we investigated reliability of multiple planning by two observers on 13 specimens. Third, 3D simulations of different tilted HTO cuts were performed and the resulting changes in all planes were calculated. The study was approved by the local Ethics Committee (Nr. 18–184). All methods were carried out in accordance with relevant guidelines and regulations. Informed consent was obtained from donor`s relatives by Institute of Legal and Forensic Medicine of LMU Munich.
Standardized three-dimensional planning of high tibial osteotomy
We scanned a left tibia sawbone-model with regular anatomy (Pacific Research Laboratories Inc., Vashon, WA, USA) by using a 3D Scanner (3D Digitizer Comet L3D, Carl Zeiss Optotechnik GmbH, Neubeuern, Germany). The surface model was exported to the Software Geomagic Design 2014 (3D Systems, Rock Hill, SC, USA). Similar to a previous study, we set 15 landmarks on the surface of the 3D tibia model and relevant angles were automatically calculated in 3D (MPTA, medial and lateral TPS) and in 2D (tibial torsion) using a modified Python script.
21
The generated 3D model was rotated and a new coordinate system was defined in which the tibial plateau defined the xy-plane and the z-axis ran perpendicular (Figure 1). 3D Model in coordinate system (x-axis = red; y-axis = green; z-axis = violet). y-axis is defined by the medial anterior and posterior points of the medial plateau (TMCP, TMCA). The xy-plane is defined by y-axis and a parallel running to a line between most medial and lateral proximal points (MMPP, MLPP). z-axis runs perpendicular to xy-plane (through TKC (Tibial knee center)). TMCA, TMCP define the medial slope). (view from anteromedial proximal).
Medial open wedge osteotomy was performed as biplanar osteotomy in two steps. First, we executed the frontal cut, parallel to the tibial anterior margin and about 10 mm behind the foremost point of the tibial tuberosity. This cut was not relevant for the results of this study but would be relevant for patellofemoral changes in vivo.
The second step involved defining the main osteotomy plane by measuring the tibial plateau width between the most medial and lateral proximal points (MMPP-MLPP) of the tibial plateau. The osteotomy started half the width distal (z-axis) and parallel to the medial slope (defined by TMCA, TMCP). The end of the osteotomy plane was 1.5 cm distal (z-axis) to the tibial lateral plateau. The hinge axis resulted from the cut in the osteotomy plane which ends 1.5 cm medial to the lateral tibial border depending on the cutting direction (Figure 2). Put into practice, this corresponded to the intended minimum distance of the saw blade from the lateral tibial rim in order to allow the lateral cortex to remain in place and to protect it from fracture during unfolding. All models had the same gap measurement of 8 mm at the most medial sagittal (y-axis) midpoint of the osteotomy plane (Figure 3). The main goal of the planning was to open the medial gap by 8 mm and increase the MPTA. Medial and lateral slope and torsion were planned to remain equal. This was assumed to be achieved by an osteotomy plane parallel to the tibial plateau and a hinge position parallel to the y-axis. 3D HTO model with different planes defining the osteotomy. The height of hinge axis (violet, 1.5 cm below tibial plateau) and starting point of osteotomy (green, half of the tibial width below the tibial plateau (3.5 cm)). The resulting ascending osteotomy plane is marked in yellow. The hinge axis is marked by a grey cross (left tibia). Left: 3D-HTO model with 8 mm gap medial; Right: opening tool with red line reflecting hinge axis (left tibia).

Reliability of three-dimensional high tibial osteotomy planning
A CT scan (slice thickness 0.625 mm) (GE HD750 CT, General Electric, Boston, USA) of 13 human cadaveric tibiae without soft tissue was performed. Only complete tibiae without defects or severe deformities were included. The range was defined as Paley 22 ’s mean MPTA (87°) plus minus two standard deviations (82–92°). Limbs were also excluded if there was evidence of previous surgery or injury. A surface model (STL file) was created by the DICOM-data for each bone model by image segmentation (ImFusion Suite, ImFusion GmbH, Munich, Germany). The surface model of the tibia was then exported to the Software Geomagic Design 2014. Similar to a previous study, we set 15 landmarks on the surface of all 3D tibia models and relevant angles were automatically calculated in 3D (MPTA, medial and lateral TPS) and in 2D (tibial torsion) using a modified Python script 21. The generated 3D model was rotated and the coordinate system was defined as described in above.
Multiple planning (two times) of 3D HTO in 13 specimens was performed by two observers with minimum downtime of 6 weeks between their respective planning. Mean differences and Intraclass Correlation Coefficients (ICC) for all relevant angles were calculated. The main goal of the planning was to open the medial gap by 8 mm and increase the MPTA. Medial and lateral slope and torsion were planned to remain equal. This was assumed to be achieved by an osteotomy plane parallel to the tibial plateau and a hinge position parallel to the y-axis.
Three-dimensional simulations of high tibial osteotomy
After checking the reliability of 3D HTO planning, different HTOs were performed by using a sawbone-CT-Scan. Depending on the cutting direction, we defined four different groups with different hinge axes: each one with cutting direction from medial 0° (Group 0), from 10° anteromedial (Group 1), from 20° anteromedial (Group 2), and from 30° anteromedial (Group 3). The midpoint of the hinge axis was always 1.5 cm medial to the lateral tibial border (Figure 4). Osteotomy plane from above, proximal part of the tibia deleted. Cutting direction of the 4 different groups; Green lines = different hinge axes (left tibia).
In each group there were five different osteotomy plane orientations formed by tilting the osteotomy plane around the x-axis (−10°, −5°, 0°, +5°, +10°) resulting in 20 HTO models in total (Figure 5). The cortical hinge changed orientation according to the osteotomy plane orientation. The landmarks on each model remained at the previously defined locations. For all HTO models MPTA, medial and lateral TPS were calculated in 3D angles using the aforementioned Python based software script. Tibial torsion was a 2D angle.
21
Arrows showing the direction of the tilted osteotomy planes (Model of Group 0 – cutting direction from medial). yellow dot = rotation axis (parallel to x-axis), at sagittal midpoint of osteotomy, osteotomy plane parallel to medial tibial posterior slope (green line) (left tibia).
Statistics
Intraobserver and interobserver variability of multiple HTO models were defined as the difference to the mean values. 23 The intra- and inter-observer Intraclass Correlation Coefficients (ICC) are based on the deviations to the mean values. The variation was assumed to be random; therefore, simple error propagation estimations were used. The ICC was evaluated considering the multiple measurements by different observers on different specimens.24–26 A two-way random effects model was used. 26 An ICC greater than 0.75 indicates good agreement and above 0.9 excellent agreement. 23
Linear regression models were calculated to explore associations between hinge position and TPS on the one hand side and osteotomy plane tilt and MPTA/tibial torsion on the other. Pearson’s correlation coefficient was calculated to evaluate the differences between all simulations as a function of MPTA. All p-values <0.05 were deemed statistically significant. Changes from baseline (tibia-model before osteotomy; Table 2) were reported, by using the post-osteotomy angles. All calculations were performed using the statistical software R.
Results
Reliability of three-dimensional high tibial osteotomy planning
Mean values of MPTA, ΔMPTA, tibial torsion, medial and lateral slope between original tibiae and 3D HTO-planning – measurements by two observers.

Three-dimensional Simulations of high tibial osteotomy
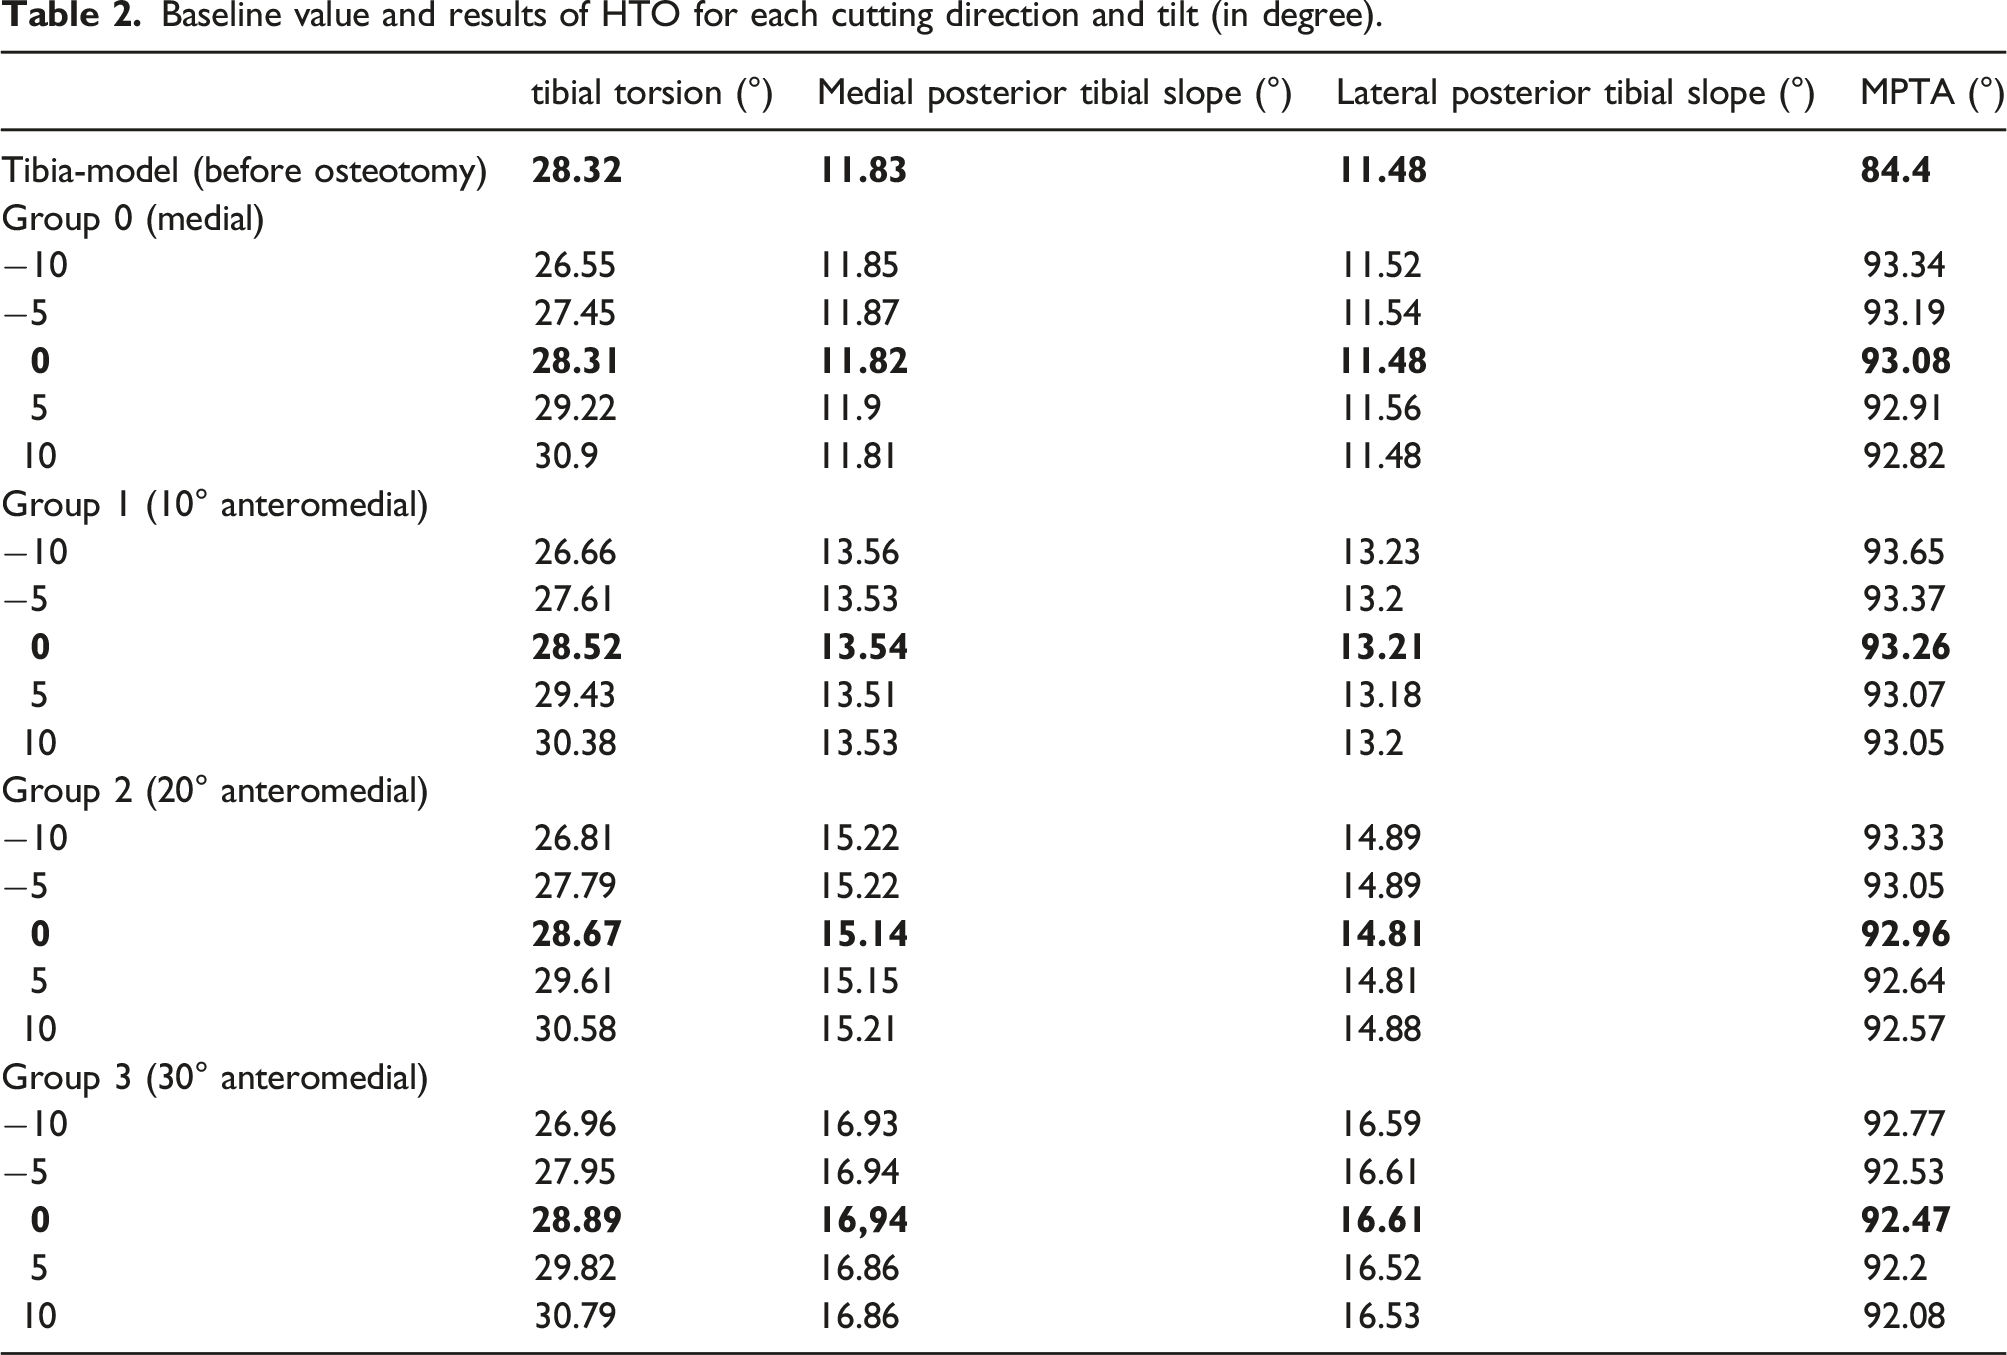
Baseline value and results of HTO for each cutting direction and tilt (in degree).
Tibial torsion
After open wedge osteotomy, the change of tibial torsion was similar in each group regarding hinge position, but significantly changed with the osteotomy plane orientation (Figure 6): With every five degrees increase in tilt we measured about 1° increase in tibial torsion (mean 0.97°, p < 0.001). Hence, there was minimal change with an osteotomy plane parallel to the TPS and 2° internal rotation of the distal fragment with an osteotomy plane almost perpendicular to the tibial mechanical axis or the anterior margin of the tibia. The location of the hinge axis had almost no effect on tibial torsion. Change from baseline in tibial torsion (°) in dependence on the osteotomy plane tilt (°) for the different hinge positions.
Medial proximal tibial angle
The influence of the cortical hinge axis and tilt on medial proximal tibial angle (MPTA) is shown in Figure 7. The MPTA differs little between groups with a maximum change of 0.76° within and 1.57° between the hinge groups. Tilting of the osteotomy plane has a small but significant impact on the MPTA: Per 5° increase in tilt the MPTA decreases by 0.16° (p = 0.002). MPTA (°) in dependence on the osteotomy plane tilt (°) for different hinge positions.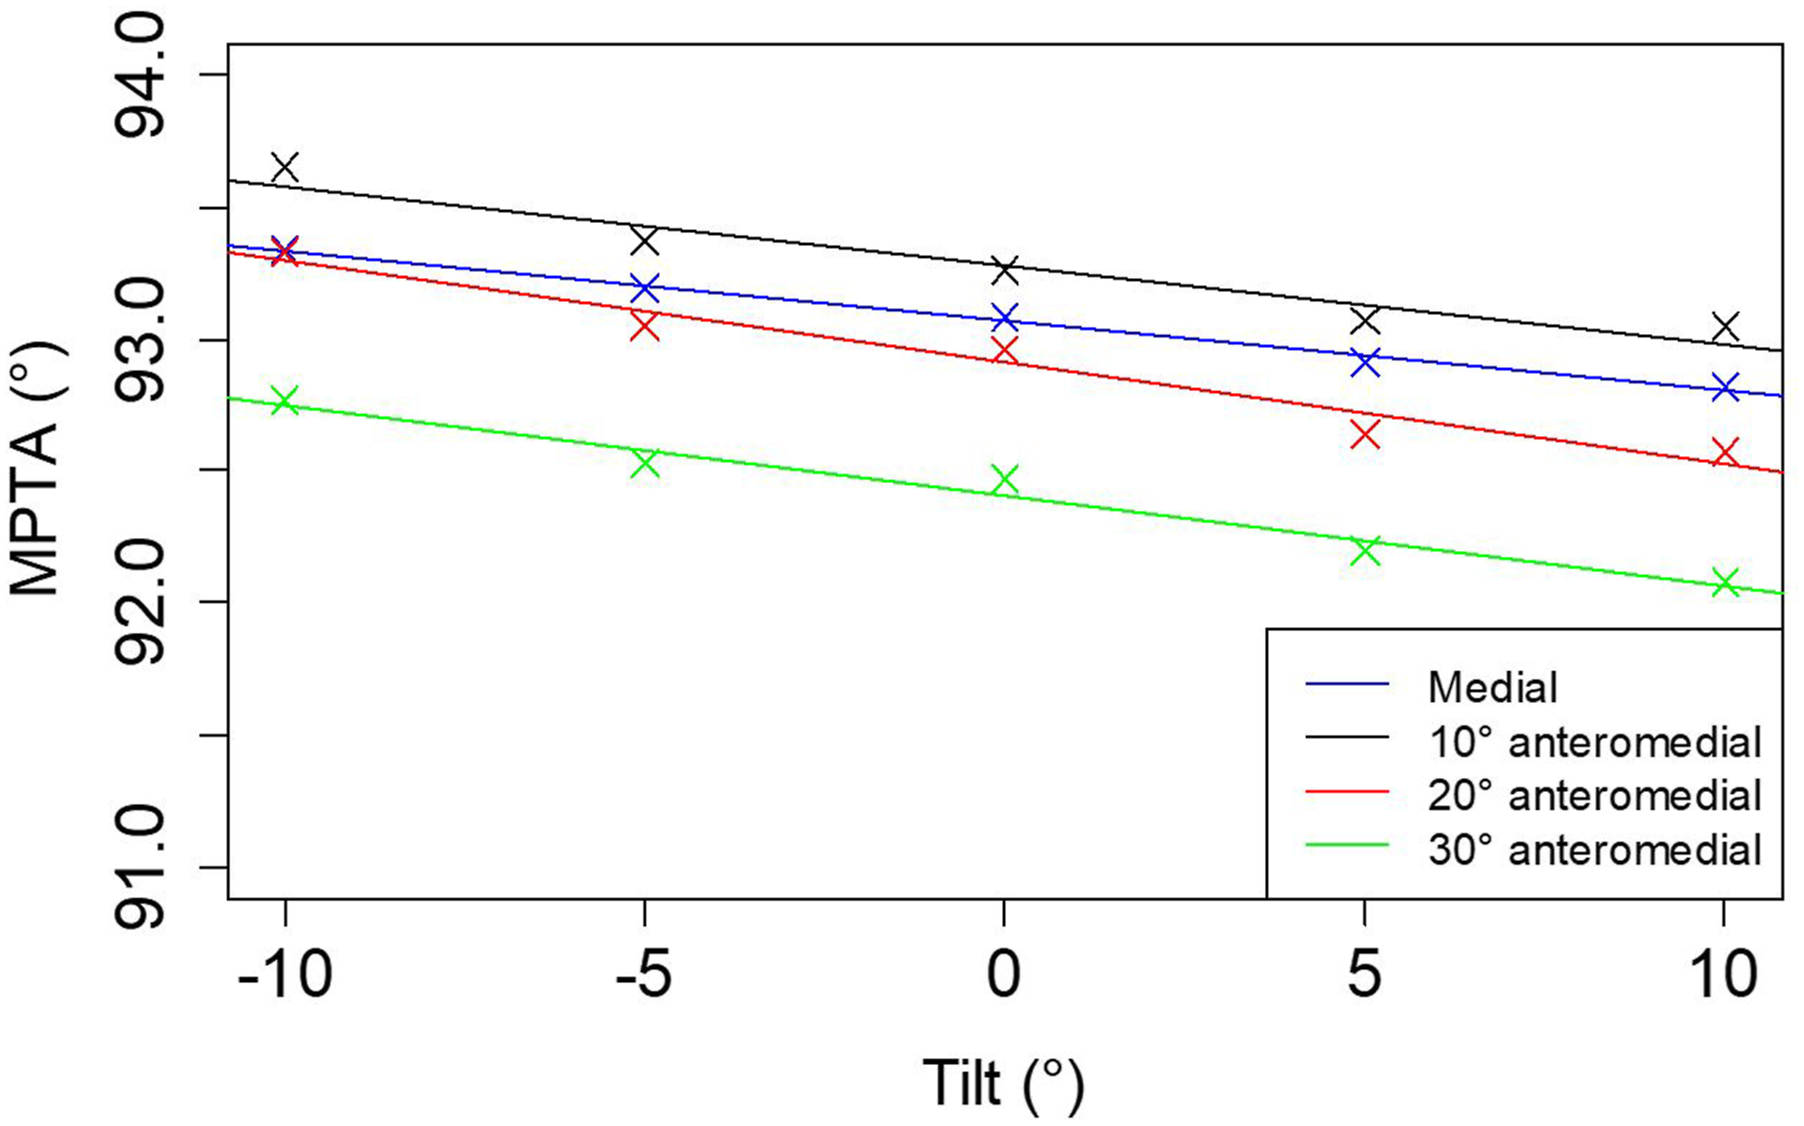
Tibial posterior slope
Results for both medial and lateral tibial posterior slope (TPS) are basically identical (Figure 8). Both slopes are significantly influenced by the hinge position. The more anteromedial the hinge position is, the higher is the TPS: With every 10° increase in the anteromedial cutting direction both medial and lateral TPS increase by 1.68° (p < 0.001). In contrast, tilting of the osteotomy plane had almost no effect on posterior tibial slope (Figure 8). Change from baseline in TPS (°) in dependence to the osteotomy plane tilt (°). Crosses with superimposed solid regression lines and points with superimposed dashed regression lines apply to medial and lateral TPS, respectively.
Discussion
Using a standardized protocol for 3D planning of HTO with precise definition of osteotomy planes, multiple planning by two medical observers revealed only minor differences in the angles most affected by the procedure. This proves the main objective of the study, that a high reproducibility and reliability of a standardized 3D osteotomy planning process is possible for treating surgeons despite the higher complexity compared to 2D planning. In order to further automate the more complex planning process in the future and make it applicable to everyday clinical practice, a high degree of standardization is required.
Standardized 3D planning of HTO and other osteotomies is necessary for patient-specific instrumentation (PSI) and further biomechanical simulations, as is already numerous for total knee arthroplasty.
Further results of this study confirm several clinical or cadaveric studies regarding anatomic changes in osteotomies. Most of those are focused on the position of the hinge axis and its effect on the TPS.14–16,27,28 Like these studies, we identified the hinge position as a most relevant parameter for unintentional changes, independent of the original MPTA.14–16 An anteromedial to posterolateral cutting direction is frequently used in HTO due to soft tissue structures (pes anserinus, superficial medial collateral ligament (MCL)), being one possible reason for the often seen increase in tibial slope in HTO. Kuriyama et al. 14 conducted a clinical study with pre- and postoperative CT-analysis in HTO patients and found no change in TPS when cutting from medial, but with every 10° change in cutting direction towards an anterior starting point an increase of 1.9° (±0.8°), of 3.9° (±1.4°) and of 5.6° (±2.0°) was measured. These results are very well comparable to Chang et al. 29 and our study results, which leads to the conclusion, that the frequently occurring increase in TPS after HTO is mainly caused by the cutting direction and hinge position. Soft tissue tension seems to play a minor role when it comes to factors causing unintended changes in HTO. In order to minimize soft tissue influence, some authors recommend an increased gap of the osteotomy posteriorly and a cutting direction from medial.14,30
Our results show the resulting tibial torsion depends on the tilt of the osteotomy plane. For the five different simulated tilts, we found values of resulting tibial torsion ranging from 26.6° to 30.9° (with a value of 28.3° for neutral/no tilt). Hinterwimmer et al. 20 detected the tibial torsion after HTO and determined an average change towards internal tibial torsion of 4.8° (±2.6°). Also Jacobi et al. 31 obtained similar results with a mean rotation of distal tibia 1.5° (±2.9°). Our results indicate that if the cut is almost parallel to the medial tibia plateau almost no reduction of torsion occurs. In the above-mentioned studies, there is no information about the osteotomy planes, so we cannot differentiate between possible soft tissue or osteotomy plane effects. However, our results indicate that the observed change in tibial torsion can be partly explained by the orientation of the osteotomy plane.
Also, the MPTA is significantly influenced by the osteotomy plane, however the observed effect is minor. Previous studies describe a high accuracy of preoperative 3D planning models for HTO and postoperative MPTA results.1,14,32 The joint line convergence angle and the joint laxity was not included in the preoperative planning in these studies, so the influence of weight bearing has been neglected. How to include this information into 3D planning should be the topic of further studies.
Applying the demonstrated method of 3D HTO planning, it is easy to accomplish preoperative planning while avoiding changes in TPS or torsion. Transforming this 3D planning into reality through PSI or robotic assisted surgery is the necessary next step to achieve high precision in osteotomy. Due to the results of our study being similar to the mentioned clinical studies on 3D analysis, we conclude that the demonstrated 3D modeling is realistic but must be further verified in clinical practice.
There are some limitations to this study. First, the software does not simulate the plasticity of the bone in the cortical joint region. Second, the fibula and soft tissue structures are not included in the simulation. Third, to validate a surgical method for 3D planning of HTO, we changed various cadaveric tibiae most without varus deformity to valgus deformity. Overcorrection exceeded 95° in 5 cases, which is considered the upper limit for overcorrection of MPTA in clinical and biomechanical studies. However, the changes in inclination and torsion were independent of the varus/valgus deformity of the tibia and the study focused on the reliability of 3D-HTO-planning regardless of the baseline MPTA value. Because of the known hinge effect with similar values demonstrated in this study, it can be assumed that the results (from tilted osteotomy levels) are somehow transferable to varus deformities of the lower limb. But further simulations on tibiae with severe varus deformities are necessary.
Conclusion
Standardized 3D planning of HTO can be performed by the treating surgeons. The demonstrated technique demonstrates a high reproducibility and reliability using two-observer multiple planning. Thus, this study provides a first important step towards 3D planning by the applying surgeon. In addition, 3D simulations highlight that control of the osteotomy plane is most relevant to avoid unintended changes in the resulting anatomy. In a preoperative situation this can be a helpful tool to modify specific angles in different pathologies and minimize unintended changes in HTO. Further studies regarding planning and simulations on varus/valgus deformities and surgical implementation of 3D planning are needed.
Footnotes
Declaration of conflicting interests
The author(s) declared no potential conflicts of interest with respect to the research, authorship, and/or publication of this article.
Funding
The author(s) disclosed receipt of the following financial support for the research, authorship, and/or publication of this article: This research was partly funded by the German Knee Society e.V. (Deutsche Kniegesellschaft e.V. (DKG)).