
Abstract
This study tracks the spatiotemporal changes in high-population growth and high-density rural regions of India, also called ‘urural’. The urural areas are remote, high-density rural areas far from zones of urban influence. Deriving the land use and land cover changes from the Global Land Cover and Land Use Change dataset and analysing them in the most populated and dense districts, the study confirms the hypothesis that land uses are continuously changing and have accelerated in high population growth and density in rural districts in India. The findings demonstrate significant changes in land use patterns in the last two decades, that is, 2000–2020, particularly in the last decade. Almost all physical changes, such as an increase in built-up areas, a reduction in agricultural lands, and depletion in vegetative cover and water bodies, were significant. This means that high population density, combined with population pressure in remote rural regions, is a leading contributing factor to considerable land use transformations, essentially turning them into areas with urban characteristics, that is, making them urural.
Introduction
High population density is a key indicator of urbanity (Castells, 1977; Harvey, 1985; Qadeer, 2000, 2004; Rex & Moore, 1967; Wirth, 1938), which has been on the rise globally over the last two decades due to population growth (World Bank, 2023). High density and population pressure could transform a region’s spatial organisation, land market, and housing and community needs of a rural area, among others, introducing major urban characteristics.
According to the United Nations (UN), guidelines on rural–urban definition boundary lie within 400 persons per square kilometre, where areas above this threshold are considered urban. However, Qadeer (2000) points out that certain rural regions in India, neighbouring South Asian countries, and many parts of developing countries have emerged with higher population densities that exceed this recommended guideline. Despite the high population pressure, many of these regions retain economic and social rural characteristics. Agrawal et al. (2021) coined the term ‘urural’ to describe these remote areas far from zones of urban influence but experiencing higher population pressures and density. These urural areas significantly impact land use, spatial organisation, land market, housing, communities and other infrastructure requirements, endowing them with urban characteristics. The population increase in these areas may have led to increased land pressure, contributing to significant changes in land use and land cover, mainly at the expense of agricultural and forestry areas.
India loosely follows the UN guidelines on rural–urban designations (Qadeer, 2000; UN, 2005). However, rural population densities in India have surpassed this threshold in various regions, including along the Ganges River, on the route from Delhi to Kolkata in Kerala and along the coast of Odisha. The Census of India defines the rural area based on the UN density criterion and two other requirements: A population of less than 5,000 and at least one-quarter of the adult male population employed in agriculture (Government of India, 2013). Despite this definition, most districts in populous states have greater than 1,000 persons per square kilometre.
Over 60% of India’s population lives in rural areas, with an increase of nearly 142 million people in the last two decades alone (World Bank, 2023). This rise in rural population, particularly in states with a higher rural population, can lead to changes in land use patterns attributed to fulfilling the increased resource demands such as infrastructural development and housing. Changes in land use in these regions have far-reaching implications for various aspects of society, including the economy, environment and social structure. Qadeer (2000, 2004) and Vidyarthi et al. (2017) also indicated that areas of rural India with high population densities show signs of changing land use, deteriorating economic situations, and poor or absent physical and social infrastructure. Therefore, it is crucial to understand the land use changes in these areas to strike a balance between economic development, the needs of a growing population and sustainable land-use practices.
In a previous study by the authors of this paper (Agrawal et al., 2021), they hypothesised that India’s high-density rural areas—also known as urural— are experiencing significant changes in their land use characteristics. This earlier study analysed the land use changes between 2001 and 2018 in two high-density rural areas of Bihar, one of India’s most populous and dense states. We conducted this study, including 58 districts across India that have >80% rural population covering over 17 million hectares of land, to further confirm the hypothesis developed by Agrawal et al. (2021) and to better understand the spatial variation of land use changes. Further, our study draws attention to the need for medium and long-term policies that are more attentive to the changing dynamics in rural areas in India. Our study is arguably the only study conducted at the national level to examine the nexus of population density and land use patterns in rural India over the last two decades.
Literature Review
The literature review covers an extensive scholarly review of areas, mainly in the Global South, that are neither urban nor rural, factors contributing to land use conversions and techniques used to measure them.
Mixing Urban–Rural Distinction
High-density rural regions are the least explored phenomenon, particularly in rural India, barring a few studies by the study’s first author. In contrast, in the Global North, the urbanisation of the countryside has been more thoroughly investigated within the context of suburbanisation and urban sprawl. A few scholars have examined the mixing of urban and rural areas in regional contexts, particularly in Asia, generating insights into changing land and density patterns in such locations. They have described this phenomenon through various terminology: Dispersed metropolis (Ginsburg et al., 1991), desakota (McGee, 1991), in-situ urbanisation (Zhu, 2004; Zhu et al., 2013), rurban (Afshar, 1994), ruralopolis (Qadeer, 2000, 2004) or urural (Agrawal et al., 2021; Vidyarthi et al., 2017).
McGee (1991) has explored the phenomenon of non-agricultural activities infiltrating rural areas through his concept of ‘desakota’ (derived from the Bahasa Indonesian language, in which desa means village and kota means city). He deploys this term to describe corridors of mixed agricultural and non-agricultural activities connecting large Southeast Asian cities. Rural villages are situated within these linear corridors that connect the urban centres. Agricultural and urban land uses have transformed these villages, which have grown substantially in size due to this mixed-use.
Ginsburg et al. (1991) favour a ‘dispersed metropolis’ to describe the extended metropolis between the rural and urban corridors, which are socio-economic zones organised by neither urban nor rural strategies in particular; instead, they preserve the essential ingredients of each form. He says, ‘This complex and compound regional system consists of central cities, fringe areas, exurbs, satellite towns and extensive intervening areas of dense population and intensive traditional agricultural land uses’ (1991, p. xiii). Most people live in villages, and almost all of the land is cultivated, with the landscape and topography remaining unchanged for the most part. However, most people’s incomes in these extended metropolitan zones come from non-agricultural sources: Village-based work, small-town industries, city work entailing daily commutes from the village and remittances from family members who have relocated to central cities. Ginsburg attributes these income streams to the ongoing improvements in the transportation system.
The concept of ‘in situ urbanisation’, coined by Zhu (2004), addresses the dramatic growth in rural villages as a direct result of government intervention. He examined urbanisation in the rural areas of the Quanzhou municipality in China and across Fujian Province, the region in which Quanzhou is located, exploring beyond just the province’s coastal areas, as the government claims (Zhu et al., 2013). Government schemes aimed at developing township and village enterprises in rural areas were intended to stop the flow of rural-to-urban migration but have led to increased rural industries in China. These changes, in turn, have undermined the distinction between rural and urban areas (Zhu, 2004). Importantly, rural regions of both China and India have undergone in situ urbanisation. However, the Indian experience is mostly a natural one, with little or no government involvement—unlike the Chinese instances, fuelled by rural industrialisation through government intervention.
Qadeer (2000) has identified the urban potential of high population density in rural areas, calling such regions ‘ruralopolises’. These hybrid settlement systems are spatially urban but economically, institutionally, socially agrarian and rural. A ruralopolis is an area with high population density, an agricultural economy and small landholdings broadly defined by extended corridors or bands of homesteads and villages sprawled amidst farms and woods.
Elsewhere, Qadeer (2004) explains a ruralopolis as a
form of urbanization that emerges with large institutional deficits or lags between needs and provisions for facilities, services, and resources, as well as administrative organizations on the one hand and spatial-environmental structures and community institutions on the other. (p. 9).
These rural communities are situated away from large centres, having grown exclusively through ‘urbanisation by implosion’ (Qadeer, 2004). Notably, while ruralopolises experience intensive population growth from within by increased births, they lack parallel increases in infrastructure, institutional capacity, or public services.
While rural segments of urban areas have long been called ‘rurban’ (Afshar, 1994), Qadeer (2000) was more interested in the transformation that occurs in such regions rather than considering them simply a settlement type or zone. For him, pre-existing urban patterns and lifestyles alter rural forms at the periphery of large metropolitan areas and cities, generating new rurban forms. Examples include rooftop or backyard chicken farms; the keeping of large animals like cows, goats, sheep or pigs in cities; and rural industries making gunny bags, shopping bags, handicrafts, carpets and many other items for urban dwellers. Conversely, computer and internet cafés in the countryside would also qualify.
The Vidyarthi et al. (2017) chapter on high-density rural areas in India mentioned above extends Qadeer’s (2004) concept. This work, however, proposes the term ‘urural’ for remote, high-density rural areas far from zones of urban influence—unlike McGee’s (1991) desakota, Ginsburg’ et al. (1991)’s extended metropolis and even Afshar’s (1994) rurban. The density of these urural areas, as well as their economy (a criterion not considered in Qadeer’s ruralopolis), have evolved past the current definition of rural due to in situ transformation that occurred without government intervention or support (different from Zhu’s (2004) examples from China). Specifically, what makes them urural is that urban elements have been introduced in remote rural areas changing their physical, social and economic character. The urural classification draws attention to the blurring of rural–urban distinctions in areas not proximal to cities or within metropolitan areas.
Rising unemployment, poverty and the shift away from traditional agricultural work towards the non-agricultural sector significantly contribute to increased out-migration rates from the area. These concerns intertwine with growing pressures on land and public resources in these areas, producing evermore conflicts linked to drainage routes, land ownership and access to water (Vidyarthi et al., 2017). Further, the increase in land values prompts many rural residents to sell their holdings, which are converted to non-agricultural uses.
Urural regions are also complex because they are difficult to classify within the current rural and urban binary system. A clear divide between rural and urban does not exist anymore, given the emergence of new urban forms and evolving patterns of physical development. The 2011 Census of India 1 considers urural areas as rural—and not census towns (CTs)—settlements administered as rural areas. However, these have crossed the thresholds of urban characteristics concerning the workforce’s size, density and nature. However, we hypothesise that urural zones may be more rural in their physical characteristics. Further, compared to CTs, these areas have fewer or no institutions such as banks and schools or infrastructures such as sewerage, drainage and water supply systems. In this paper, we intend to examine if the urural areas in India are indeed undergoing land conversion from agricultural to non-agricultural uses.
Factors Contributing to Land Conversion
Multiple factors contribute to land use conversion. For instance, Fazal (2000) looked at urban expansion surrounding a mid-size city in northern India with a similar method. The study evaluated the trade-offs linked to the rapid conversion of agricultural areas to non-agricultural uses that accommodate the growing urban population, observing that this unfolds at the expense of surrounding fertile agricultural land and a loss of food production. Similarly, Fox et al. (2017) focused on Kerala, a state in India with a high population density, employing mixed methods (including remote sensing) to show that land use change is gradually decreasing agricultural land. This shift depends on several intertwined factors, including declining profitability of farm practices, rural urbanisation, unreliable weather patterns, housing demands, remittances from the Gulf countries and government policies such as MNREGA. 2
Measuring Land Use Conversion
Several research tools can uncover changes in land use over time, but remote sensing and geospatial technology systems provide high accuracy at a lower cost than other methods (Rawat & Kumar, 2015). Multiple satellite sensors provide several image types with different spatial, spectral and temporal resolutions that aid in detecting specific land cover types to meet diverse research needs. Techniques to classify land use vary as well: For example, supervised classification (Huang et al., 2015; Mallupattu & Reddy, 2013); unsupervised classification (Mishra et al., 2014); spectral vegetation indices; and normalised difference built-up index (Rawat et al., 2013) and machine learning tools (Potapov et al., 2022). However, most of these methods depend heavily on the spatial and temporal resolution of satellite images, and the known information of prior ground-based land use maps (Al-doski et al., 2013).
Due to the lack of reliable spatial land use data for the study area, we used the Global Land Cover and Land Use Change (GLCLU) dataset and tools to understand detailed information about changes in major land use classes. The Methods section, Data Analysis, goes into detail about this approach. We also applied this technique on the Landsat 3 satellite imageries, available for our study area during the study time frame.
Methodology
Study Area
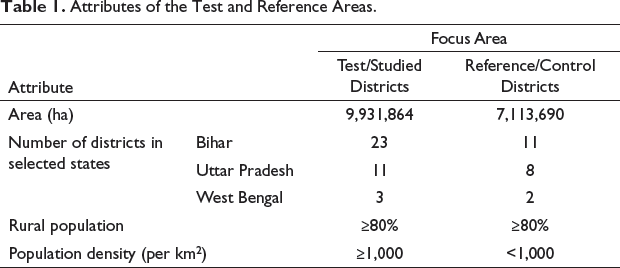
To determine the most appropriate area for the study (hereafter referred to as the test area), we first gathered data from the Government of India’s report of 2020 and the Census of India 2001 to calculate the percentage of the rural population and population density in each district of the states. We selected the test area based on two criteria: A rural population of 80% or more and a population density of at least 1,000 or more persons per square kilometre (km). After analysing the data, we identified 37 district clusters covering a total land area of 9,931,864 hectares (ha) in three states—Uttar Pradesh, Bihar and West Bengal (Figure 1 and 2). This test area enables us to understand urural growth over the last two decades.
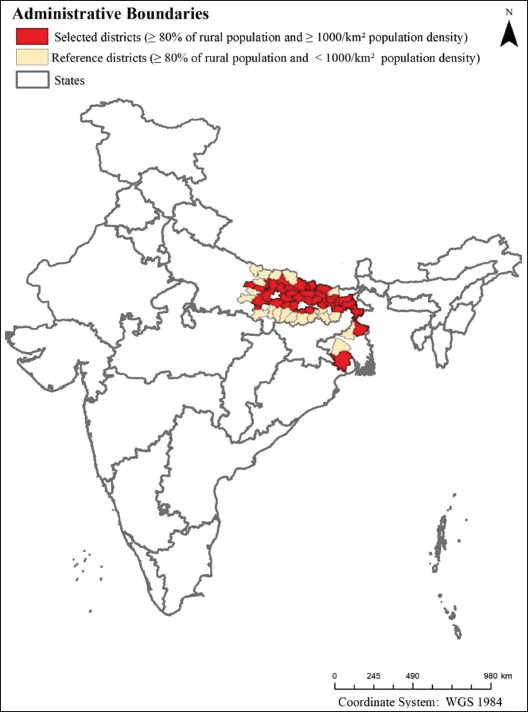
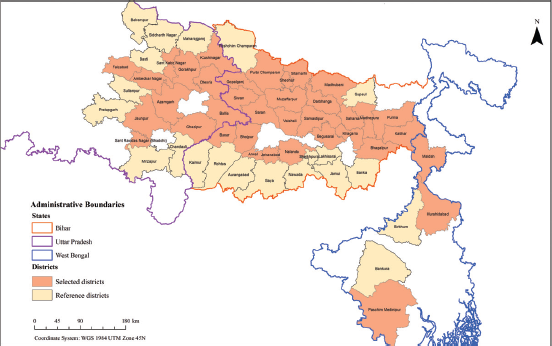
Additionally, we identified 21 reference/control districts (hereafter referred to as the reference area) around the test area. The reference areas also have a rural population of at least 80%. Still, their population density is less than 1,000 persons per square km—a means to isolate the effects of population and density. The average density in the test area in 2001 was 1,018 km2, while the reference area in 2001 had an average density of 627 km2, considerably lower than our threshold of 1,000 km2.
All districts we identified lie in three populous states in India: Uttar Pradesh, Bihar and West Bengal. These states have significant rural populations and extensive land areas (Government of India, 2021). According to the Government of India (2020), Uttar Pradesh, Bihar and West Bengal had a population of 199,812,341, 104,099,452 and 91,276,115 in 2011, respectively. As of 2020, the estimated populations in these states are 227,943,000, 121,302,000 and 97,516,000, respectively (Government of India, 2020). Table 1 shows a summary of the test and reference areas.
Attributes of the Test and Reference Areas.
Methods
The method section includes three steps, as depicted in Figure 3:
Schematic Diagram of the Method.
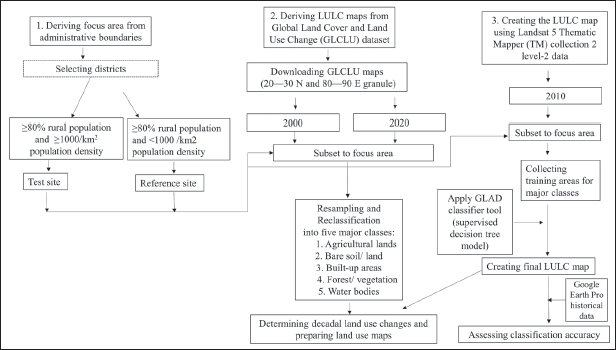
Deriving focus areas from administrative boundaries.
Deriving the land use land cover (LULC) maps of 2000 and 2020 from the GLCLU 2000–2020 dataset.
Creating the LULC map of 2010 and assessing classification accuracy.
Collecting Administrative Boundaries and Deriving Focus Areas
We obtained administrative boundaries for India up to the district level by collecting Geographic data from the DIVA-GIS (
Deriving LULC Maps Using the Global Land Cover and Land Use Change Dataset
Downloading LULC maps of 2000 and 2020
We obtained LULC maps for the years 2000 and 2020 from the GLCLU dataset developed by the Global Land Analysis and Discovery Laboratory (GLAD) at the University of Maryland (Potapov et al., 2022). These maps were created using Landsat archive data with a spatial resolution of 1 arc-second per pixel or approximately 30 meters at the equator. The GLCLU data, which consists of 10 × 10-degree granules, is publicly available at
Furthermore, the dataset has been validated using independently collected reference data, ancillary data from the UN Food and Agricultural Organization, and other global land cover products from the NASA Global Ecosystems Dynamics Investigation (GEDI) service (Potapov et al., 2022; Yuh et al., 2023). Given its high accuracy (above 85%) and availability, we have used this dataset for our analysis.
These GLCLU maps’ thematic classes were created using manually collected training data and supervised classification models with machine learning tools, including decision tree models (Potapov et al., 2022). These maps consist of seven primary classes, including forest regions, wetlands, croplands, surface water, built-up areas, snow/ice and ocean, and they were further categorised into 110 subclasses with designated colour codes. Forest areas were defined as regions with trees at least 5 m tall at the Landsat pixel scale. Croplands were land used to produce annual, perennial and herbaceous crops. Pixels that cover more than 50% of the pixels by water were defined as the Water surfaces. Built-up areas were identified as Landsat pixels that include man-made structures or surfaces, including settlements, roads and industrial areas, regardless of whether they are the dominant land cover class of the pixel. Therefore, built-up areas outline the extent of human settlements without distinguishing internal structures, such as impervious surfaces, soil, trees and grasses within the settlements or industrial areas. The complete methodology used to derive and validate GLCLU maps can be found in Potapov et al. (2022).
To conduct our analysis, we downloaded GLCLU data for 2000 and 2020 covering 20–30N and 80–90 E regions. The data was resampled to 30-m spatial resolution and re-projected into Transverse Mercator (UTM) Zone 45 N with the World Geodetic System 1984 (WGS84) datum to match the GIS data and LULC map of 2010.
Reclassifying GLCLU maps
Our previous study (Agrawal et al., 2021) analysed five major LULC classes in three selected districts to achieve the study objectives. In the current study, we maintained consistency with our prior work by analysing the same land use classes, which include agricultural, bare lands, built-up, forest/vegetated areas and water bodies, as defined in Table 2.
Major Land Use Land Cover Classes.
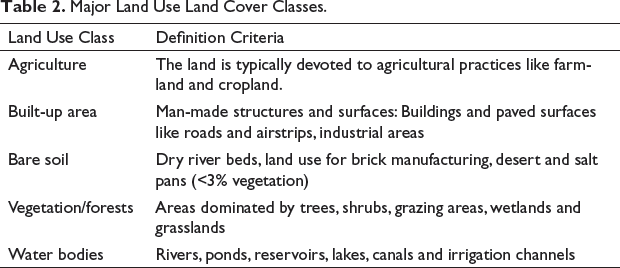
There are 110 subclasses in the GLCLU maps. We reclassified these maps to create LULC maps with five major classes, as in Table 2. We have not encountered snow/ice-covered areas or oceans within our study area, two of the major classes in the GLCLU maps. After reclassification, we extracted separate LULC maps for the test and reference regions using GIS data and calculated the area of each class in each region. We then developed a transition matrix to quantify the conversion and changes of each class over the past two decades.
Deriving the 2010 LULC Map and Assessing Classification Accuracy
One of our objectives was to determine the decade with the most land use changes in the focus areas, and to do so, we needed a LULC map for 2010. However, the GLAD GLCLU dataset did not include the 2010 data. Therefore, we created a LULC map using a similar procedure to that used by GLAD.
In order to create a LULC map, we downloaded the cloud-free Landsat 5 Thematic Mapper (TM) Collection-2 Level-2 atmospherically corrected surface reflectance data (30-m spatial resolution) from the USGS EROS data centre (
For the image classification, we followed the same procedure used by GLAD to create the GLCLU maps described in the ARD user manual (Potapov et al., 2022). We downloaded the latest version of the GLAD ARD management and application software tools (
Finally, we calculated the areas that have changed over the past 20 years and prepared maps showing land use changes within the study areas. We also analysed the land use changes between 2000 and 2010 and 2010 and 2020 to better understand the trend of changes for reclassifying images and creating a transition matrix. ArcGIS was used to combine classes and develop final maps and accuracy assessments. The QGIS software was used for the training data collection and classification of the 2010 map using ARD tools.
Results and Discussion
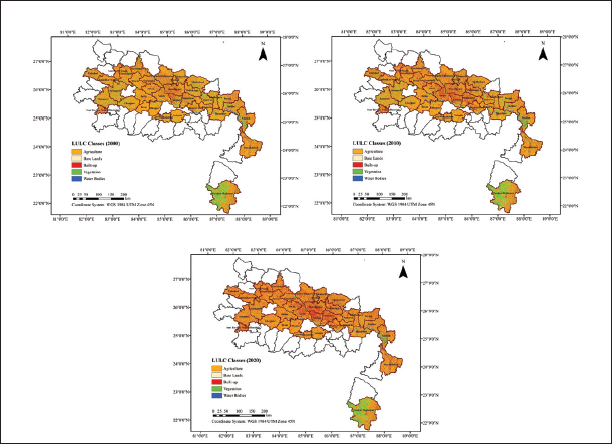
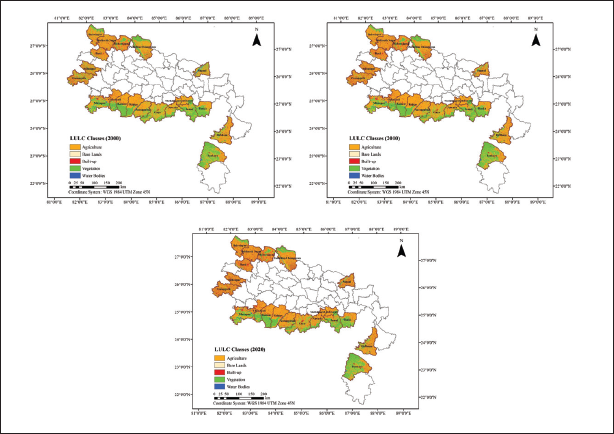
Land use land cover maps have shown significant land use land cover changes in the selected districts compared to reference areas (Figure 4 vs 5).
LULC Classes in the Test/ Study Districts in 2000, 2010 and 2020.
LULC Classes in the Reference Districts in 2000, 2010 and 2020.
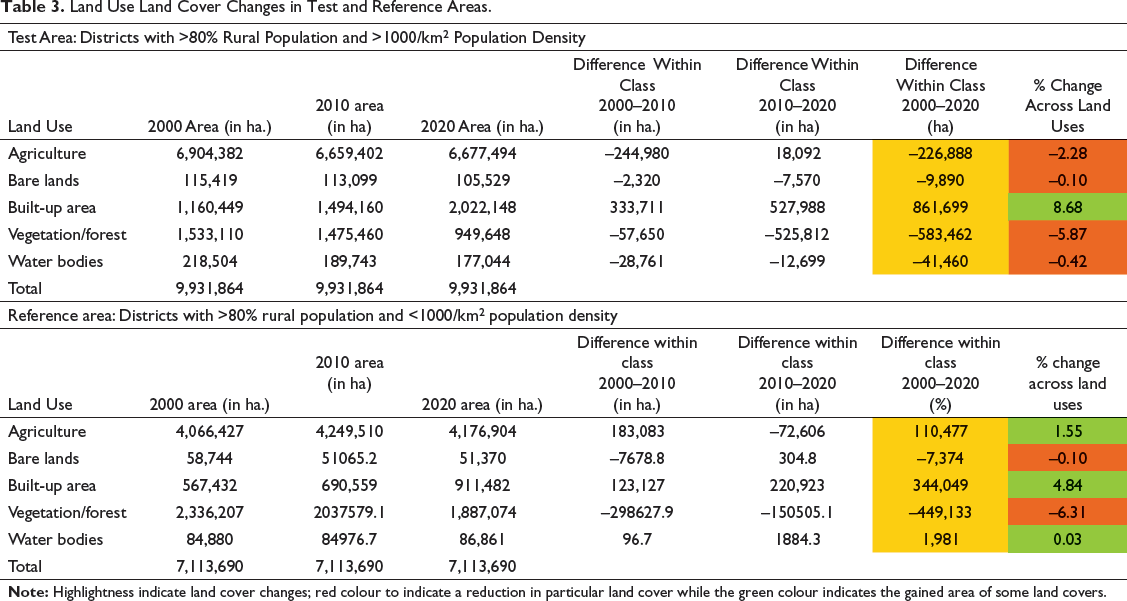
Further analysis of these maps shows some interesting findings related to land use changes in the urural areas in India. We noticed a depletion in vegetation and forest land and a substantial increase in built-up areas most likely used for residential and other land use (Table 3). Also noticeable were tested districts. Vegetation losses were present in both types of districts and of almost similar amounts. The low-density districts have witnessed a slight increase in agricultural land. It is possible that the increase took place at the expense of vegetation and forest lands. Water bodies did not show much difference over the years in both districts.
Land Use Land Cover Changes in Test and Reference Areas.
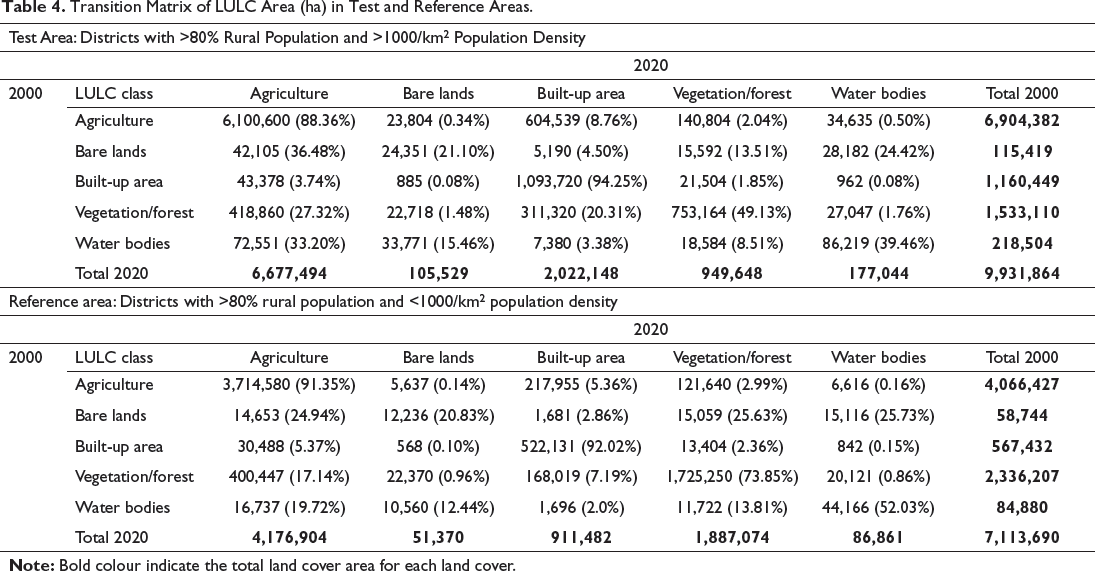
Transition Matrix of LULC Area (ha) in Test and Reference Areas.
Reduced Agricultural Land
Agricultural land has been decreasing since 2001 in urural areas in India (Agrawal et al., 2021). We notice a similar trend in this study as well. However, the net shrinkage in the agricultural land is not as pronounced as was noticed in our previous study. However, the loss over 20 years is about 2.28%, much of which was between 2000 and 2010. Furthermore, we also notice that the 2010–2020 period showed a slight increase in agricultural land, which masked some of the losses that occurred in the previous decade. This may be due to the fast upsurge in a new development in the past decade, largely meant for residential and transportation uses, which consumed a large portion of the agricultural land (see similar findings by Zhilong et al., 2017). Other factors responsible for the slight increase in cropland in the last decade are removing vegetation, uprooting trees and destroying forest land to pave the way for farming (also confirmed by Reddy et al., 2016 in a smaller study). Changing rainfall patterns due to climate change might also have been a factor (Meer & Mishra, 2020), a phenomenon often witnessed in similar conditions in different geographical contexts in India.
Much of the agricultural lands were converted into built-up areas because of the population pressure and the need for people to house themselves. The population increased by almost 30% in the test area, while the average density increased from 1,018 to 1,341 persons per square kilometre. Between 2000 and 2020, we noticed that 8.76% of agricultural land turned into built-up areas in the test area, while 27.32% of vegetation and forest were cut down and 33.2% of water bodies were drained out to convert the land for agricultural use (Table 4). The overall percentage increase in conversion from agricultural land to built-up is almost 10%. The districts that exhibited the highest increase in built-up areas (mainly converting agricultural areas to built-up) were located just north of Patna district in Bihar, particularly in five districts—Vaishali, Saran, Siwan, Samastipur and Muzaffarpur.
The test area showed a specific trend of land conversion: Agricultural areas were initially turned into built-up areas (6.17%), followed by the conversion of forest areas (5.26%) to gain more cropland. Opposite trends were observed for the reference area: Initially, forest areas were converted into agricultural areas, followed by a conversion of some agricultural areas into built-up areas. This trend in the reference area can be partly because the area has had more vegetation/forest cover than the test area.
In urural areas, between 2000 and 2020, 27.32% of vegetation and forest lands were uprooted to use the land to grow crops. In total, 36.48% of bare lands were used for agricultural purposes and 33.2% of water bodies were converted into croplands.
Agrawal et al. (2021) previously showed that agricultural land also turns into bare land. The study attributed it to an increase in brick kiln industries that manufacture bricks to meet the demands for building construction in nearby towns or cities or within rural areas. In this study, we did notice instances of bare land in the proximity of urban areas such as Patna and other cities and towns in the vicinity. However, they were not significant, given the extent of the geographic area we were examining in this research.
Sinha et al. (2017) present similar findings confirming the loss of agricultural lands in Bihar and rising shrinkage in the agriculture-led area as a critical concern for sustaining food security for the ever-increasing population. Mondal and Mandal (2018) also confirm the loss of agricultural lands in West Bengal state and attribute the loss to bank erosion processes caused by the dynamicity of the river Ganga (also see Hazarika et al., 2015 study with similar findings in the upper Brahmaputra plain of India).
The transformation of agricultural lands into other land uses can have important long-term implications for sustainable livelihood, forced internal migration (Mondal & Mandal, 2018), and food security of rural communities. These issues are further exacerbated by existing economic and social barriers (Gaur & Squires, 2020; Vidyarthi et al., 2017). Some critical implications of rural agricultural land depletion that arise from these changes are reduced cultivable land, exacerbated land values, increased non-farm activities, changing cropping patterns and farming practices, and imposed food insecurity challenges.
Increased Built-up Areas
Of 58 districts, 37 with the highest population density are experiencing a rapid rise in built-up areas. Between 2000 and 2020, the built-up areas have increased by 604,539 ha, that is, 8.7% of the total agricultural area. In the same period, however, the reference area, consisting of 22 districts, experienced a 5.36% increase in built-up area, considerably less than that of the test area. The differences here illustrate how unique the concern is in urural areas.
Over the two decades, 20.31% of vegetation and forest lands were paved. These changes are likely a response to the needs of the growing population and their associated demands, leading to the consumption of other land uses (especially agricultural land, forested areas and depleting wetlands), as these demands are wide-ranging: Home construction and related physical infrastructures (e.g., roads, bridges and railroads); amenities and healthcare systems (e.g., schools and hospitals); service sectors; and businesses. As a result, built-up areas have been increasing rapidly. The reference area also shows decreased vegetation, forests, waterbodies, bare lands and conversion into agricultural areas. Regarding size, a similar amount of vegetation and forests were cut down in both test and reference areas.
Salghuna et al. (2018), in their study in the Krishna district of Andhra Pradesh, attributed the increase in built-up land use there to necessary accommodations for population growth, mainly due to the construction of the new capital city of Telangana-Amravati. They also pointed to excessive mining and logging of the forests as additional contributing factors. The effects of such changes are profound, including changes in the biodiversity of the region as well as adverse effects on ecosystem services (Rimal et al., 2019; Talukdar et al., 2020). Other scholars also highlight that increasing built-up areas contributes to the destruction of forest areas, as Rahaman et al. (2020) demonstrated in their study of land use and land cover changes in the Barddhaman district in West Bengal, India. Rapid increases in built-up areas, often at the cost of forest and vegetation areas, result in increased ecological disturbances, micro-climatic conditions and long-term threats to the ecosystem (Prasad & Ramesh, 2019; Salghuna et al., 2018). Although the growth dynamics of our study areas’ predominantly rural character may differ, these areas all reflect the intense trade-offs between economic growth and ecological conservation.
Depleting Vegetation and Forest Areas
In the Indian Subcontinent, deforestation is generally linked to population growth as it requires more land for people (Zhilong et al., 2017). Environmental factors, climate change and forest (mis)management also play a role in deforestation (Reddy et al., 2016; Roy, 2014). Population growth and the subsequent agricultural expansion are the two top driving forces behind deforestation (Baidya et al., 2020; Geist & Lambin, 2002). As Table 4 shows, vegetation or forested areas have decreased by 6% in the test area between 2000 and 2020. Interestingly, low-density districts also showed a similar reduction in the same period. In the test area, 20.31% of vegetation and forest land turned into built-up areas, and 27.32% were cleared for farmlands. In low-density districts, a larger proportion, 17.14%, went towards agricultural land, while 7.19% was taken over to expand newer development. Deforestation increased tenfold between 2010 and 2020 compared to the previous decade.
The population increase is likely one of the dominant factors for decreasing forest land use, as percentages of built-up areas have increased to accommodate more people (Zhilong et al., 2017). Of note, the population growth rate between 2000 and 2020 5 in the test area was about 30% (Government of India, 2020), with the Madhepura, Khagaria and Purbi Champaran districts topping the list with over 50% increase in population, while several other districts in Bihar are not too far away. However, detailed ground truthing information may be required to confirm the large-scale deforestation we have detected with the Landsat imagery.
Findings from similar studies in other districts in India by Roy (2014) and Reddy et al. (2016) suggest that forest land depletion is likely due not only to population growth but also to the lack of national-, state- or local-level policy tools for monitoring and conserving forest lands. Salghuna et al.’s (2018) Andhra Pradesh study shows that government policies regarding forest conservation are inconsistent. A few critics contend that recently passed amendments to the 1980 Forest Conservation Act will likely increase the destruction of forest lands (Gupta, 2023).
In sum, built-up areas are marked as one of the major expansions in the rural areas in both test and reference areas. Agricultural land areas and vegetation cover have decreased significantly to accommodate housing and the affiliated needs of the growing population. The type of land use under pressure for urban development may vary, as does the conversion sequence. For instance, in the test area, agricultural areas were initially turned into built-up areas, followed by the conversion of forests (5.26%) to gain more cropland. Opposite trends were observed in the reference area: Initially, forest areas were converted into agricultural areas, followed by a conversion of some agricultural areas into built-up areas. Such dynamicity in land use and land cover changes may be a combination of rapidly changing densities, migration flows and policy changes (see previous studies by Agrawal et al., 2021; Vidyarthi et al., 2017).
These are alarming trends in the high-growth and high-density rural districts as they portend the possibility of a looming crisis in food supplies, insufficient availability of potable water and decreasing forest cover. The scarcity of such necessities of life is already leading to abject poverty, high unemployment and social conflicts; it is also forcing people to migrate out of the area (Vidyarthi et al., 2017). These changes should be of major concern to the state and national policymakers and government officials. The situation warrants a stricter implementation of agricultural land conversion laws, coupled with strategic management of natural resources, that will place a check on expanding built-up areas and brick-manufacturing activities, as well as establish better employment and incentives for farmers (such as PM-Kisan scheme6, expanded MNREGA, and/or other forms of subsidies) to remain in farming activities, and thus reduce rural to urban migration.
Conclusion
Our study objective was to track spatiotemporal changes in urural areas across India. We used the Global Land Cover and Land Use Change dataset to confirm the hypothesis that land uses are continuously changing due to high population growth and density in rural districts in India. The study findings demonstrate significant changes in land use patterns observed over the last two decades, particularly in the last decade in the test area, which consists of predominantly rural districts with high density and population. Almost all changes, such as an increase in built-up areas, a reduction in agricultural lands and depletion in vegetative cover and water bodies, were significant in the test area when compared with the reference area. This means that high population density, combined with population pressure in remote rural regions, is leading to significant land use transformations, essentially turning them into areas with urban characteristics.
Such urural areas are the new frontier in rural and regional planning in India. Barring some progress in educational facilities and improvements in road connectivity, other forms of physical and social infrastructure and services are not commensurate with the urban characteristics of these villages—especially their population, density and land use changes (Vidyarthi et al., 2017). The spatial and socio-economic characteristics of these areas are close to those described in Ginsburg et al.’s (1991) extended metropolis or even McGee’s (1991) desakota concept, especially concerning these features: The rural nature of these landscapes, which also reveal shifting land uses; the non-agricultural economy; the improving connectivity; and the dense, but also migratory, population. However, as noted earlier, urural areas are remote and far from any metropolitan zone of influence.
Two possible explanations, also hypothesised in Agrawal et al. (2021), would account for similarities in the spatial and socio-economic characters of urural areas and those of extended metropolises or desakota regions. Either the metropolitan influence transcends far beyond what we have traditionally understood, or these characteristics appear despite the absence of a nearby metropolitan area. Such appearances may also arise because of rapidly diversifying and interconnected rural–urban economies and an ever-improving transportation system beyond a metropolitan area, allowing people to traverse much longer distances in short amounts of time.
The findings of this study further suggest that urural areas need several urban amenities (such as water, drainage, sanitation and healthcare) because they face unprecedented population density and economic pressures that are often going under noticed from a policy perspective. Increased disputes and public encroachments might result from population density pressures on land and a lack of public resources. The formal governance system in India needs to urgently recognise the reality of these zones of intense rural-urban interaction and direct investment in these underserved areas.
This study could help the Government of India’s rural programs such as the National Rurban Mission, which has two specific goals: To stimulate local economic development and to enhance basic urban services in rurban clusters. Interestingly, land use changes are not a factor that was invoked to identify rurban clusters. Therefore, the study methods used here could be applied to the hundred or so identified clusters, along with other factors, to prioritise those in dire straits and, thus, most in need of urgent attention. In addition, the study can help stimulate discussion on categorising urban, rural, rurban and the presented ‘urural’ regions and formulate appropriate land use policies based on the local issues in each category.
Employing remote sensing data to ascertain land use changes is useful. However, a more extensive and significantly more in-depth study is needed to better understand the dynamics affecting the change of land use and other characteristics in remote rural areas such as Bangladesh, China and Pakistan. Further investigation is also necessary to identify other major factors affecting the loss of fertile agricultural land in such countries. Higher-resolution satellite imagery coupled with more detailed ground-truthing through field checks and qualitative interviews with the locals could further ascertain the details of changes and the factors affecting them.
Footnotes
Declaration of Conflicting Interests
The authors declared no potential conflicts of interest with respect to the research, authorship and/or publication of this article.
Funding
The authors received no financial support for the research, authorship and/or publication of this article.