
Abstract
The World Health Organization (WHO) recommends the use of color-coded cardiovascular disease (CVD) risk charts for CVD management. This study evaluated the agreement between the laboratory and non-laboratory 10-year CVD risks based on 2019 WHO CVD risk-prediction charts. The agreement of CVD risk scores among 40- to 69-year-old Bhutanese population stratified by gender and age groups (<60 and ≥60 years) was determined via weighted kappa statistics. In the general population, there was substantial agreement between the two CVD risk score charts for all ages and <60 years but a moderate agreement for participants aged ≥60 years. In males, substantial agreement was observed in all ages and in <60 years and moderate agreement in ≥60 years. In females, both the predictions showed substantial agreement in all ages and <60, but a moderate agreement for ≥60 years. The non-laboratory-based risk charts can be used interchangeably with laboratory-based charts for predicting 10-year CVD risk in resource-constrained countries like Bhutan.
Keywords
What We Already Know?
The World Health Organization (WHO) recommends the use of color-coded cardiovascular disease (CVD) risk prediction charts for CVD management.
In 2019, WHO upgraded the charts for 21 regional areas, and the recommended chart for Bhutan is South Asia.
There are currently other non- laboratory based CVD risk prediction charts in use.
What This Article Adds
There is a substantial agreement between laboratory-based and non-laboratory-based CVD risk prediction charts for the general population.
Non-laboratory-based risk chart predicted a higher percentage of low and moderate CVDs than the laboratory-based chart.
Therefore, non-laboratory-based CVD risks can be used in rural Bhutan by primary healthcare workers to support prompt referrals of those at a high risk of CVDs to higher health centers for blood tests and management by
Introduction
Noncommunicable diseases (NCDs) consist of diabetes, cardiovascular diseases (CVDs), cancers, and chronic respiratory disease. According to the World Health Organization (WHO), 71% of global deaths are due to NCDs of which the majority is due to CVDs. Each year, 17.9 million people die from NCD between the ages of 30 and 69 years, and over 85% of these “premature” deaths happen in low- and middle-income countries.1,2 The deaths due to CVD will reach 23.3 million by 2030 compared to 16.7 million deaths in 2002. 3
Multiple risk factors including both modifiable and non-modifiable risk factors are responsible for CVDs. Non-modifiable risk factors are age, sex, and ethnicity, 4 and modifiable risk factors include unhealthy diet, physical inactivity, tobacco use, and harmful use of alcohol.5 -7 The risk of CVD is greatly reduced through the cessation of modifiable risk factors (stopping tobacco use, reduction of salt in the diet, eating more fruit and vegetables, regular physical activity, and avoiding harmful use of alcohol). 2 Therefore, identifying those at the highest risk of CVDs and ensuring they receive appropriate treatment can prevent premature deaths.
A number of guidelines and CVD risk prediction equations are currently in use.8,9 Similarly, the WHO released 21 region-specific CVD risk prediction charts in 2019. 10 The WHO CVD risk prediction charts are color-coded and provide both laboratory and non-laboratory components for prediction of 10-year CVD risks. 11 Laboratory-based algorithms include information on age, sex, smoking status, systolic blood pressure (SBP), history or evidence of diabetes mellitus (DM), and the total cholesterol value. In the non-laboratory-based algorithms, body mass index (BMI) is used in place of blood sugar and cholesterol to calculate CVD risks. The chart recommended for Bangladesh, Bhutan, India, Nepal, and Pakistan is the WHO CVD chart for South Asia. 10
The updated 2019 WHO CVD risk prediction chart for South Asian countries including Bangladesh, Bhutan, India, Nepal, and Pakistan has neither been used to estimate the risk nor been validated in these countries and Bhutan using large population-based data. Noncommunicable diseases including CVD are becoming an important public health problem in Bhutan because of epidemiological and nutritional transition in the last two decades.12 -16 This was driven by rising disposable income levels and a shift to diets lower in carbohydrates and higher in saturated fat, sugar and salt from traditional high-carbohydrate and low-fat diets. As a result, a significant increase in chronic diseases including CVD, diabetes, hypertension, and smoking has been reported. In 2012, the prevalence of diabetes was 1.8%, 12 hypertension 17.4%, 16 alcohol use 30.9%, 14 betel quid use 45.0%, 15 and smoking 4%. 17 In 2019, the national prevalence of CVD was 37.9%. 18 Nearly 70% of the population live in rural Bhutan, and primary health centers (PHCs) are the main provider of health care. 19 These PHCs are not equipped with laboratory facilities to test for blood sugar and cholesterol. Understanding the level of agreement between laboratory and non-laboratory-based CVD risks can be imperative in the selection of risk chart, especially non-laboratory-based CVD in rural Bhutan. Therefore, this study aimed to study the agreement between laboratory and non-laboratory-based 10-year CVD risk using 2019 WHO CVD risk prediction charts in the adult Bhutanese population using the 2019 National Nutritional Survey.
Methods
Study Design and Data Source
This was a secondary data analysis of the 2019 Bhutan WHO NCD STEPwise (STEPS) survey. 20 The required variables including age, sex, smoking status, body weight, height and laboratory results were extracted from the NCD STEPS survey database maintained by the Ministry of Health, Bhutan (Supplemental Table 1). There were 5575 individual records of participants aged 15 to 69 years in the data set. A further four records were excluded because of missing weight. Of 5574 records, 2574 participants aged ≥40 years were included in the final analysis.
2019 WHO STEPS Survey
Based on WHO’s approved STEPwise survey method, a cross-sectional study was carried out in Bhutan in April 2019. A sample size of 5575 was used to represent the target population aged 15 to 69 years. A multistage cluster sampling, using a mix of probability proportionate to size (PPS) and systematic random sampling was applied, using the sampling frame from the Population and Housing Census of Bhutan 2017 to select the participants. The primary sampling unit (PSU) was “Gewog,” or county, in rural setting and towns (thromdes) in an urban setting. A total of 88 PSU (55 from rural and 33 from urban) settings were selected. From each PSU, 4 secondary sampling units (SSU) were selected using the PPS method, resulting in a total of 352 SSUs (220 from rural and 132 from urban). From each of these census blocks, 16 households were selected using circular systematic random sampling. Only one eligible individual from each household was selected randomly using Kish sampling method. The questionnaire consisted of three STEPS for measuring the NCD risk factors. Step 1 constituted of an interview using questionnaires. In step 2, physical measurements were taken, and in step 3, biochemical measurements were taken from the participants.
Cardiovascular Disease Risk Assessment
We estimated the 10-year risk of CVDs using WHO CVD 2019 laboratory-based and non-laboratory-based charts for South Asia. Laboratory-based CVD risks were calculated using age, sex, SBP, current smoking status, blood cholesterol (mmol/l), and blood sugar (mg/dl). Non-laboratory-based CVD risks were calculated based on age, sex, SBP, current smoking status, and BMI. 10
The current smoker was determined from the interview response. It was defined as smokers and those who quit smoking less than one year before the survey. Systolic blood pressure was calculated by taking the mean of the second and third SBP obtained within 10-minute intervals during the survey. Systolic blood pressure was classified into five categories including <120, 120-139, 140-159, 160-179, and ≥180 mm Hg according to the WHO 2019 CVD chart. If the participants fasting blood sugar was ≥126 mg/dl, or on medication, they were categorized as diabetic, otherwise they were considered nondiabetic. Blood cholesterol was recorded in mg/dl, so it was converted into mmol/dl by multiplying it by 0.02586. Cholesterol level was stratified into five categories as follows: <4, 4.4-4.9, 5-5.9, 6-6.9, and ≥7 mmol/dl. Similarly, age was grouped as 40-44, 45-49, 50-54, 55-59, 60-64, and 65-69 years. The cutoff for BMI was taken as per the WHO CVD risk chart (Supplemental Table 1). 10
Statistical Analysis
For laboratory-based risk calculation, 2019 WHO CVD risk laboratory charts for South Asia were used to calculate the risk for people with or without DM and the table for men or women, as appropriate. In the next step, a column for smokers or nonsmokers and age group were identified. Within the selected box, we matched the cell where the person’s SBP and total blood cholesterol intersect. While for non-laboratory-based risk calculation, we used the relevant chart for South Asia and calculated risk for men or women, then used the table for non-smokers or smokers. Within the selected box, we matched the cell where the person’s SBP and BMI intersect.
In the 2019 WHO CVD risk model, the predicted risk is classified into five groups; ie, very low (<5% [green]), low (5% to <10% [yellow]), moderate (10% to <20% [orange]), high (20% to <30% [red]), and very high (≥30% [deep red]). 10 The agreement between the classified risk of laboratory-based and non-laboratory-based charts was evaluated using weighted kappa statistics. At first instance, agreement was assessed for the general population for all age groups and stratified by age groups <60 and ≥60 years. In the second instance, analysis for males and females for all ages, <60 and ≥60 years, was undertaken. The agreement less than odds was indicated by kappa values <0, slight agreement by kappa values between 0.01 and 0.20, fair agreement by kappa values between 0.21 and 0.40, moderate agreement by kappa values between 0.41 and 0.60, substantial agreement by kappa values between 0.61 and 0.80, and almost complete agreement by kappa values between 0.81 and 0.99. 21 Statistical analyses were performed with Stata 16.1 (Stata Corp., College Station, TX, USA). P values less than 0.05 were considered statistically significant as evidence against the null hypothesis.
Results
There were 2574 individuals of age ≥40 years, of which 56.8% (1462) were female with a mean age of 51.9 years (range 40-69 years). Eighty-six participants (3.3%) were current smokers, and 142 participants (5%) were diabetic. The mean SBP and diastolic blood pressure (DBP) was 131.6 (18.9) mm Hg and 86.78 (11.8) mm Hg, respectively, in the general population. The mean SBP in general population were 27.9% (717), 43.5% (1120), 21.1% (544), 5.4% (139), and 2.1% (54) in <120, 120-139, 140-159, 160-179, and >179 mm Hg levels, respectively. The mean cholesterol level was 3.97 (1.99) with a mean high-density lipoprotein (HDL) level of 1.15 (0.37) (Table 1). In the general population, the mean BMI was 25.9 (4.6), while 6.5% (167), 38.0% (979), 39.0% (1027), 13.3% (344), and 2.2% (57) were under, normal, overweight, obesity, and severe obesity, respectively (Table 1).
Characteristics of Participants Aged 40-69 Years in the NCD STEPS Survey in 2019, Bhutan (n = 2574).
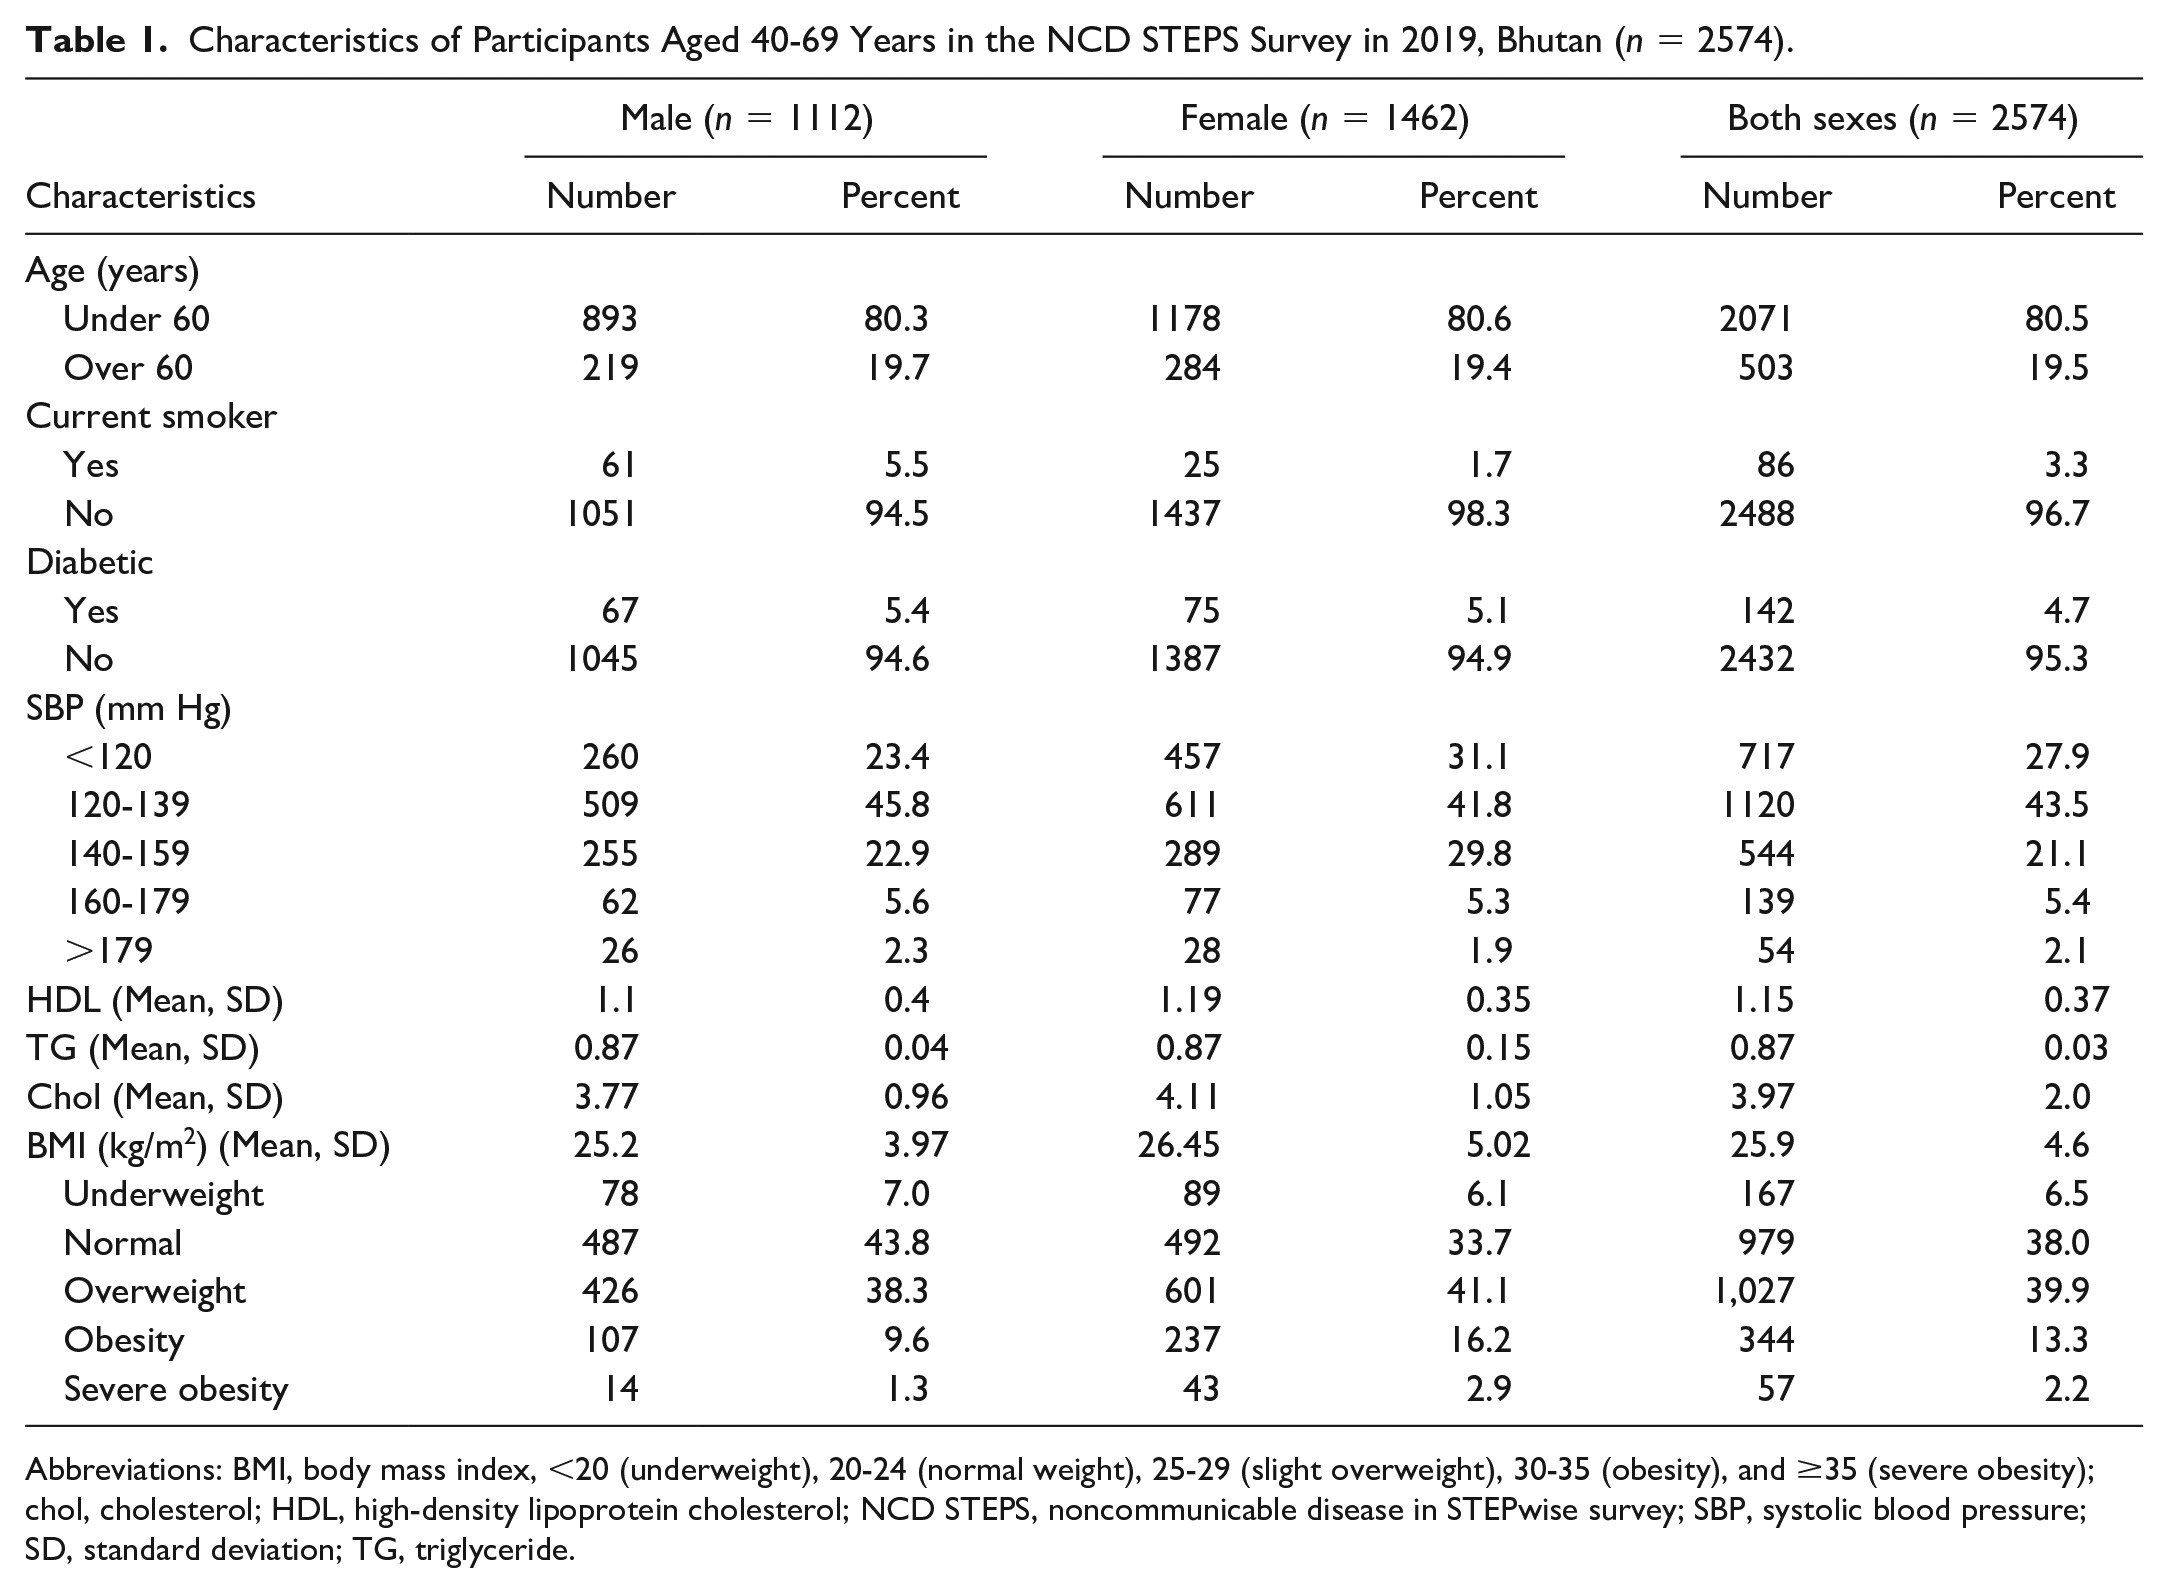
Abbreviations: BMI, body mass index, <20 (underweight), 20-24 (normal weight), 25-29 (slight overweight), 30-35 (obesity), and ≥35 (severe obesity); chol, cholesterol; HDL, high-density lipoprotein cholesterol; NCD STEPS, noncommunicable disease in STEPwise survey; SBP, systolic blood pressure; SD, standard deviation; TG, triglyceride.
In addition, smoking prevalence was higher among males than among females. The prevalence of hypertension and diabetes was higher in females than in males. The mean DBP was slightly higher in males than in females. However, the means of SBP, HDL, low-density lipoprotein (LDL), cholesterol, and BMI were higher in females than in males (Table 1). In general population, laboratory-based risk for very low, low, moderate, high, and very high was 60.3% (1552), 30.9% (795), 8.6% (220), 0.2% (6), and 0.04% (1), respectively (Figure 1). The non-laboratory-based risk for the five categories was 54.3% (1397), 33.1% (852), 12.2% (315), 0.4% (10), and 0% (0) (Figure 1).
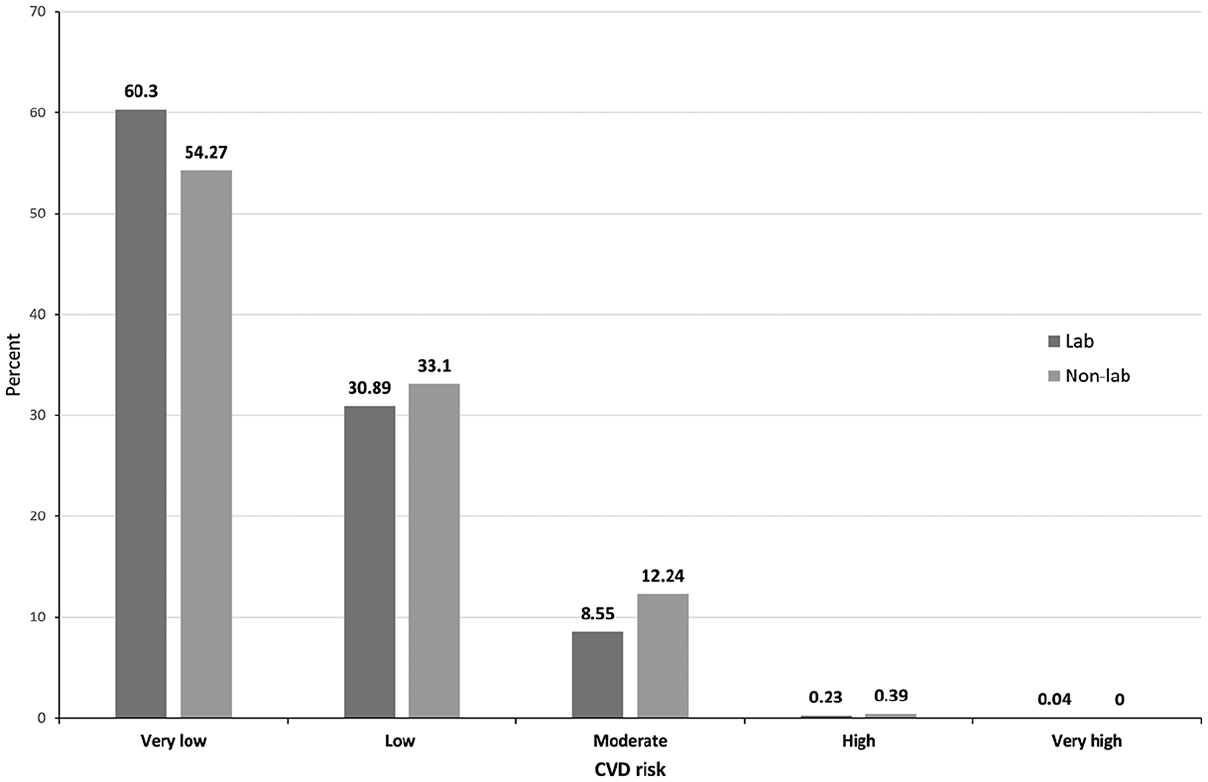
Ten-year cardiovascular risk among patients aged 40-69 years in NCD STEPS survey in Bhutan, 2019 (n = 2574).
Cardiovascular Disease Risks
In the total population, there was substantial agreement between the two risk charts which was 95.5% (kappa = 0.74, standard error [SE] = 0.02). Similarly, substantial agreement was found between the two risk charts for <60 years at 91.7% (kappa = 0.64, SE = 0.02), but moderate agreement was found for participants aged ≥60 years at 92.0% (kappa = 0.56, SE = 0.04) (Table 2).
Agreement Between the Laboratory-Based and Non-Laboratory-Based Risk Scores Among Participants Aged 40-69 Years in Bhutan in 2019 (n = 2574).
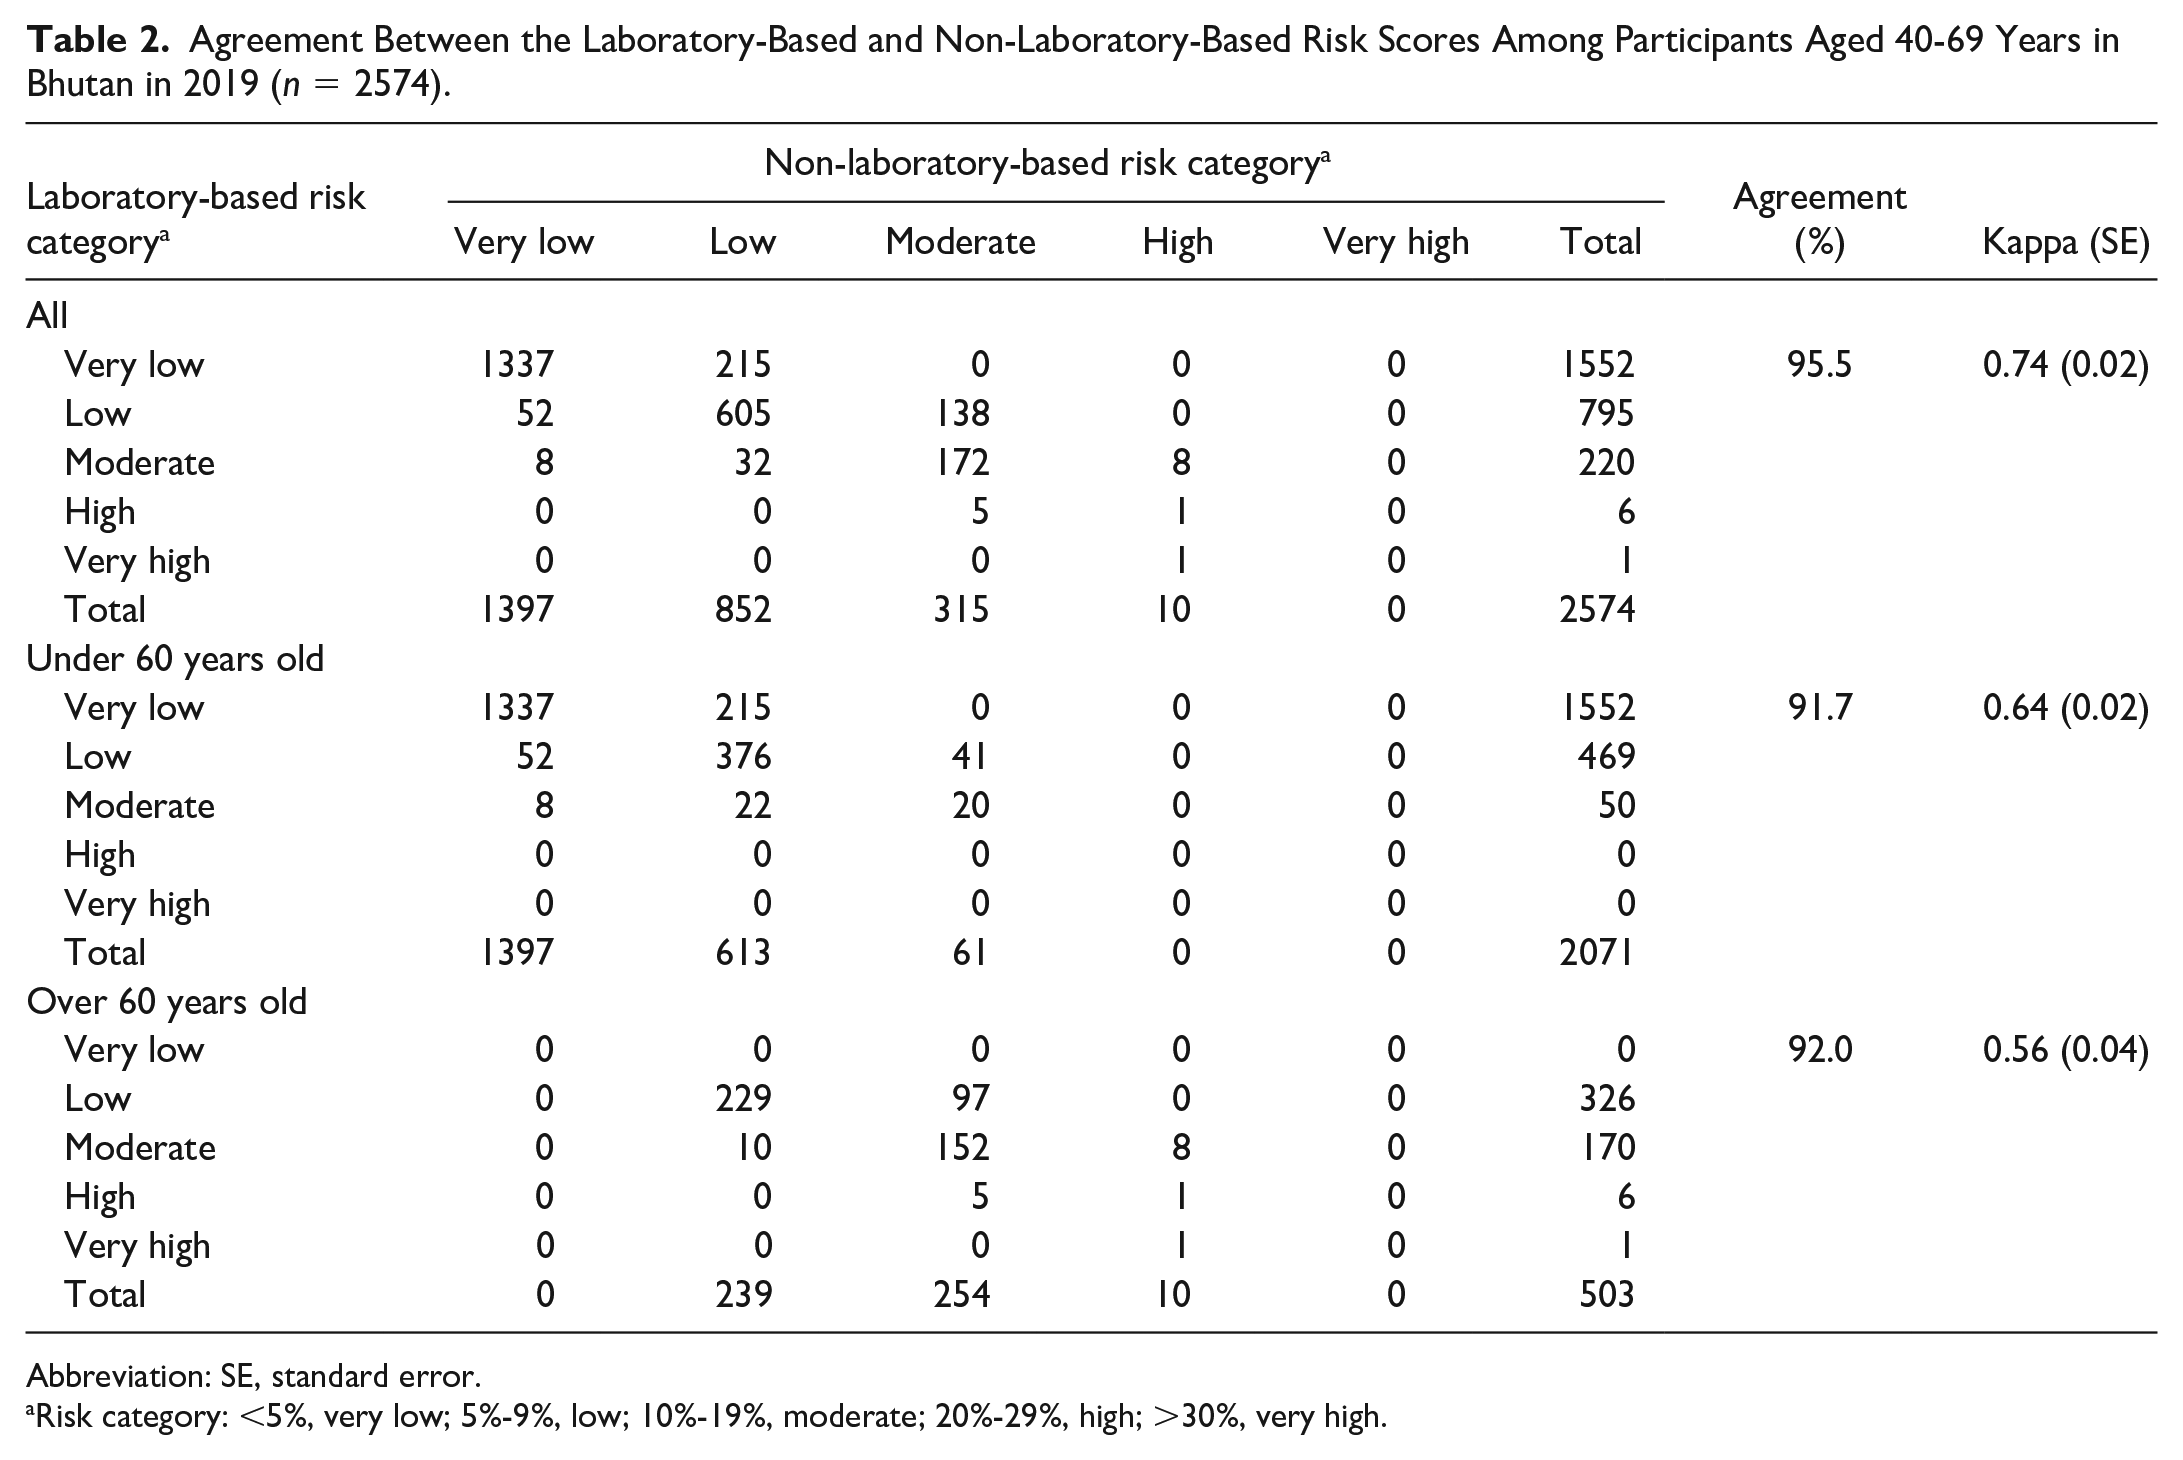
Abbreviation: SE, standard error.
Risk category: <5%, very low; 5%-9%, low; 10%-19%, moderate; 20%-29%, high; >30%, very high.
There was sustainable agreement between the laboratory and non-laboratory CVD risk prediction among males in all ages and <60 years while moderate agreement in those aged ≥60 years. The overall agreement was 94.1% (kappa = 0.69, SE = 0.02), for participants aged <60 years, 89.0% (kappa = 0.61, SE = 03), and for participants aged ≥60 years, 90.0% (kappa = 0.48, SE = 0.05) in males (Supplemental Table 2). The overall agreement between the laboratory and non-laboratory CVD risk prediction for females was substantial agreement 95.4% (kappa = 0.77, SE = 0.02), and for participants aged <60 years, 93.7% (kappa = 0.64, SE = 03). However, a moderate agreement for female participants aged ≥60 years was 90.3% (kappa = 0.58, SE = 0.06) (Supplemental Table 3). The agreement between the two risk charts was higher in females than in males. Similarly, the risk agreement was higher for those aged <60 years than for those aged ≥60 years when compared between the sexes.
Discussion
In this study, concordance between laboratory and non-laboratory CVD risks using the 2019 WHO CVD risk prediction chart for South Asia was tested using 2019 STEP survey data from Bhutan. There was substantial agreement between the two risk charts for the general population in all age groups and <60 years. When categorized by gender, in males, substantial agreement was observed in all ages and <60 and moderate agreement in ≥60 years. In females, both the predictions showed substantial agreement in all ages and <60 years, while there was moderate agreement for ≥60 years. In the general population, the laboratory-based risk chart predicted a higher percentage of very low risk while the non-laboratory-based risk chart predicted a higher percentage of low- and moderate-risk CVDs.
In the general population, there was substantial agreement between the two risk charts in predicting 10-year CVD risk. Similar findings were reported from studies in northern India with 2019 WHO CVD risk charts.22,23 Since the release of 2019 WHO CVD risk charts, there are limited published studies assessing the concordance between the laboratory-based and non-laboratory-based risk. However, an earlier version of the WHO/International Society of Hypertension (ISH) chart showed variable concordance between “without” and “with cholesterol.”24,25 Similarly, a study on the level of concordance between “without” and “with” cholesterol using the Framingham Risk Score showed a significant concordance. 25 In a study carried out in China using the WHO CVD risk chart for East Asia, it was observed that it could be used for pre-screening CVDs, but it was observed that in diabetics, the laboratory-based charts need to be used while estimating the risk as declaimed by WHO. 26 The substantial agreement between the non-laboratory-based risk charts in this study can be a useful tool in resource-limited settings like Bhutan where 70% of the population live in rural areas and avail health care from PHCs. Primary health centers are usually involved in primary health services including the Expanded Program on Immunization, Maternal and Child Health, and treatment of common ailments and have recently expanded in delivering Services with Care and Compassion Initiative (SCCI) for NCDs in Bhutan as an adaptation of WHO Package for Essential NCD (PEN) protocol (personal communication).
Non-laboratory-based risk charts predicted a higher number of low (5%-9%) and moderate (10%-19%) CVD risks than laboratory-based risk charts in the general population. According to WHO, offering counseling and prevention through medications to those with a heart attack or stroke and those with high risk (≥20%) is the “best way” to tackle NCDs. 11 Therefore, the use of a non-laboratory-based risk score can support this goal for referral of those with a CVD risk level of ≥10% for an assessment using laboratory-based charts after measurement for diabetes and cholesterol. 10 In the Bhutanese context, this would mean referring high-CVD-risk individuals to district and referral hospitals, which have facilities for testing blood sugar and cholesterol and management by medical officers and medical specialists.
Similar to the finding from a population-based study in Iran, there was a substantial agreement between the two risk charts for those aged <60 years. 27 This could be due to the physiological differences between the two age groups which can affect the biological parameters such as BMI, which could have led to higher agreement in <60 years. 28 The aforementioned reasons could explain the moderate agreement for those aged ≥60 years when stratified by gender. In addition, a lower sample size (19.5%, 503) in this group could be another reason. Similar trends were observed in this study when stratified by gender with a better agreement for females that had a larger study population than for males. Therefore, testing the concordance between the two risk prediction charts in a sub-section of the population will need an adequate sample size.
Study Strengths and Limitations
The main strength of this study is the large sample size that is representative of the Bhutanese population. Therefore, the findings of this study can be generalized. Second, this is the first study to validate laboratory-based and non-laboratory-based risk charts using the updated 2019 WHO risk chart for South Asia. So, the findings provide information on the validity of the new WHO CVD risk charts.
The main limitation of this study is that this study is based on secondary data from a cross-sectional study. Second, the findings were affected due to a lower sample size in certain categories such as ≥60 years. Therefore, analysis with an equal sample size should be undertaken in the future. A longitudinal cohort study with 10-year follow-up periods would be required to validate laboratory-based and non-laboratory-based risk charts for the whole population to determine the risk using the present charts.
Conclusion
The present study results revealed a substantial agreement between laboratory-based and non-laboratory-based CVD risk prediction charts for the general population. Thus, a non-laboratory-based risk prediction chart based on age, sex, smoking status, SBP, and BMI could be used for resource-limited settings such as Bhutan for CVD management. This can support referrals of those with the highest risk of CVDs to district hospitals and referral centers for expert management. There is a huge potential for non-laboratory-based risk-prediction charts to be used in place of laboratory-based risk charts in countries with limited laboratory facilities.
Supplemental Material
sj-docx-1-aph-10.1177_10105395231211997 – Supplemental material for Comparison of Laboratory and Non-Laboratory-Based 2019 World Health Organization Cardiovascular Risk Charts in the Bhutanese Population
Supplemental material, sj-docx-1-aph-10.1177_10105395231211997 for Comparison of Laboratory and Non-Laboratory-Based 2019 World Health Organization Cardiovascular Risk Charts in the Bhutanese Population by Kuenzang Chhezom, Mongal Singh Gurung and Kinley Wangdi in Asia Pacific Journal of Public Health
Footnotes
Declaration of Conflicting Interests
The author(s) declared no potential conflicts of interest with respect to the research, authorship, and/or publication of this article.
Funding
The author(s) disclosed receipt of the following financial support for the research, authorship, and/or publication of this article: KW is funded by Australian National Health and Medical Research Council (NHMRC) Investigator Grant (2008697).
Ethical Approval
Ethical approval from the Research Ethics Board of Health, Ministry of Health, vide approval letter number Ref.No.REBH/Approval/2021/053.
Supplemental Material
Supplemental material for this article is available online.
References
Supplementary Material
Please find the following supplemental material available below.
For Open Access articles published under a Creative Commons License, all supplemental material carries the same license as the article it is associated with.
For non-Open Access articles published, all supplemental material carries a non-exclusive license, and permission requests for re-use of supplemental material or any part of supplemental material shall be sent directly to the copyright owner as specified in the copyright notice associated with the article.