
Abstract
Evidence on the associations between built environment and overweight in children outside developed countries is scarce. We examined associations between access to local food and physical activity environments and overweight in 5- to 17-year-old Malaysians in two states with differing overweight levels. Information on children was measured in the National Health and Morbidity Survey 2015 and combined with Geographic Information System–derived data on local food and physical activity environments. Access to the built environment was measured by presence and distance from child’s residence. Complete data were available for 880 children. Access to local food outlets and parks was higher and associated with higher occurrence of overweight in children living in the state with higher overweight prevalence. When adjusted for sociodemographic factors, higher presence of and shorter distance to convenience stores and parks were associated with overweight. Both built environment and children’s sociodemographic backgrounds should be considered when planning interventions to curb the overweight epidemic in Malaysia.
Keywords
What We Already Know
Complex multifaceted factors contribute to the development of childhood overweight and obesity.
Obesogenic environment encourages positive energy balance with unhealthy eating habits and inactive lifestyles.
Existing evidence on the associations between built environment and overweight and obesity in children is inconclusive and primarily from developed countries.
What This Article Adds
Evidence on the associations between local food and physical activity environments and overweight among children in Malaysia.
Children living in a state with higher overweight prevalence (30%) had greater access to food outlets and parks than children in a state with lower overweight prevalence (16%).
Greater access to food outlets and parks was associated with higher overweight prevalence although sociodemographic factors partly explained the associations.
Introduction
Changes in the environment in the past decades have transformed our surroundings into an obesogenic environment, encouraging high-energy intake, physical inactivity, and sedentary behaviors. 1 This applies also to Malaysia, where fast-paced life and time constraints have increased reliance on food away from home, reflected in increased household expenditure from 8.7% in 2004 to 11.2% in 2019. 2 In 2017, 84% of adolescents reported consuming fast foods at least once a week, 3 and the proportion of physically active adolescents fell from 23% to 20%, while sedentary lifestyles increased from 47% to 50% in 2012-2017.3,4
There has been growing interest in the potential effects of the built environment on childhood overweight and obesity. However, as summarized by several recent reviews, food environment has shown inconsistent associations with children’s weight status,5-9 and evidence concerning physical activity environment is still limited and inconclusive.10-12 Reasons for such inconsistent associations may include differences in methodologies and between the populations studied.
Previous studies come almost exclusively from developed countries; however, the associations may be different in developing countries because of differences in cultures, lifestyle behaviors, food types, and preferences. 13 In the only study representative of Malaysian children, a positive relationship was reported between the availability of fast-food outlets and overweight. 14
The present study aimed to investigate associations of built environment related to food and physical activity with overweight among 5- to 17-year-old children in Malaysia. We explored potential differences in access to local food and physical activity destinations and their associations with overweight among children in two states with different prevalence of overweight.
Methods
Study Areas
This study focused on two states in Peninsular Malaysia: Terengganu and Perak, located in north-east and north-west of the Peninsular, respectively. Only two states were included to allow for manual collection of the built environment data. Of the states, Perak had the highest and Terengganu the lowest prevalence of childhood overweight in Peninsular Malaysia in 2015. 15
Data Sources
Participants
Information on children aged 5 to 17 years (n = 932) residing in the states of Terengganu (n = 481) and Perak (n = 451) was extracted from the National Health and Morbidity Survey (NHMS) conducted in 2015. The NHMS was designed using a two-stage stratified cluster sampling proportionate to the population size. Malaysia was first stratified into states, which were further stratified into rural and urban areas (<10 000 vs ≥10 000 inhabitants) based on geostatistical census areas defined by the Department of Statistics, Malaysia. 16 The first stage of the sampling involved a random selection of enumeration blocks from the clusters of rural and urban areas separately. In the second stage, living quarters were randomly sampled from each selected enumeration block. All households and their members within the selected living quarters were included in the study. 15
Local food environment
We included chains, franchises, and well-established fast-food outlets, convenience stores, and supermarkets. Fast-food outlets are limited-service restaurants that provide the sale of quick-service foods. Convenience stores include stores that sell a limited line of food elements. Supermarkets include different sizes of stores selling primarily food elements. These food outlets were selected because they have been widely studied in developed countries.5-9 Also, the data were gathered from each company’s official website in 2019; thus, data on stalls, street vendors, and small groceries were unavailable.
Local physical activity environment
We included public parks and sports facilities because these recreational environments have been widely studied in developed countries.10-12 Data on public parks, including different types of parks (eg, neighborhood, local, urban, or state parks), recreational areas, and playgrounds were based on the land use map provided by PLAN-Malaysia. Information on public sports facilities (futsal courts, sports complexes, and gymnasiums) was acquired from an open data source from the Ministry of Youths and Sports. 17
Ethical Approval
National Health and Morbidity Survey 2015 received ethical approval from the Medical Research Ethics Committee, Ministry of Health Malaysia. Written informed consent was obtained from each participant, including parents or guardians of the children. The present study was registered at the Malaysia National Medical Research Register (ID NMRR-18-661-41326), and approval for data usage was received from the Director-General of Health, Malaysia and the Federal Department of Town and Country Planning.
Measures
Outcome variable
Overweight status (including obesity) was based on body mass index (BMI) calculated from measured height and weight. The BMI criteria of the International Obesity Taskforce (IOTF) 2012 were applied, where the age-specific and sex-specific BMI cutoffs correspond with the adult BMI cutoff of 25 kg/m2 at age 18. 18
Exposure variables
Two measures of exposure to the built environment were used: (1) number of destinations within 1000 m, and (2) distance to the nearest destination, from the child’s residence. First, a circular buffer region with a 1000-m radius was created around each child’s residential geolocation. To create the buffer region, the coordinate reference system of the residential geolocation was converted from WGS84 into Kertau RSO/RSO Malaya (m). Then, the geolocations of built environment destinations were determined using Google Maps and Google Street View. Next, residential geolocations and their buffer regions were linked to the built environment’s geolocations. The total number of destinations within the 1000-m buffer regions was then computed. The number of destinations was dichotomized into absence (0) or presence (≥1) because many residences had no destinations within the 1000-m buffer region.
Next, the shortest distances between the children’s residences and the nearest destinations were calculated, using a straight line (Euclidean distance), in meters. Because of skewed distributions, the distance variables were categorized into thirds. The lowest third (T1) represented the shortest distance. The geospatial processes were performed using QGIS 3.10.
Sociodemographic variables
Child’s age (in years), sex (boy/girl), place of residence (urban/rural), state of residence (Perak/Terengganu), and household income were included. Household income was considered as the total average earnings of the household per month and was divided based on quintiles into five equal groups, the lowest quintile (Q1) representing the lowest income.
Statistical Analysis
Descriptive statistics were conducted on overall data and by state, applying sampling weights. Differences in the distributions of the variables between the two states were tested using Rao-Scott adjusted χ2 statistics for categorical variables and a t test or Mann-Whitney U test for continuous variables.
The association between each built environment variable and child overweight was assessed by complex sample log-Poisson regression, using individual-level data. This was done separately for the two measures of exposure (presence of and distance to each built environment feature). Sociodemographic variables were then introduced into the model as potential confounders. Associations between the presence of or distance to food outlets and child overweight were further adjusted with the physical activity environment (parks and sports facilities separately). Log Poisson regression analyses were performed to solve the nonconvergence issue encountered in the initial analyses where log-binomial regression was applied. Poisson regression with robust variance has been shown to approximate a binomial model. 19 This modeling technique allows direct estimation of prevalence ratio as a measure of association from individual-level data (comparable to odds ratio in logistic regression, for example).
To identify possible effect modification by state, interaction tests were conducted between the built environment and state variables; followed by stratified analyses according to state. Sensitivity analysis using a 1500-m buffer radius was conducted. The results are presented as prevalence ratios (PR) with 95% confidence intervals. All statistical analyses were done using two-tailed tests and an alpha level 0.05 for statistical significance, except for the interaction tests, in which alpha level 0.01 was used. Because of the possibility of chance findings due to multiple testing, only associations with a P < .01 in the unadjusted models were further considered in the “Discussion” section. Analyses were performed using StataSE 14 and IBM SPSS 25.
Results
After exclusion of 4.2% of children with incomplete information on height or weight, or invalid BMI values and 1.4% of children with missing or invalid geolocation information, the analytic sample size (complete data) was 880. The distributions of age, sex, and place of residence were relatively similar across the two states (Table 1). In Terengganu, a higher proportion of children were from low-income households compared with Perak. Of the children, 30% in Perak were overweight compared with 16% in Terengganu.
Sociodemographic Characteristics of Participating Children, Overall and by State.
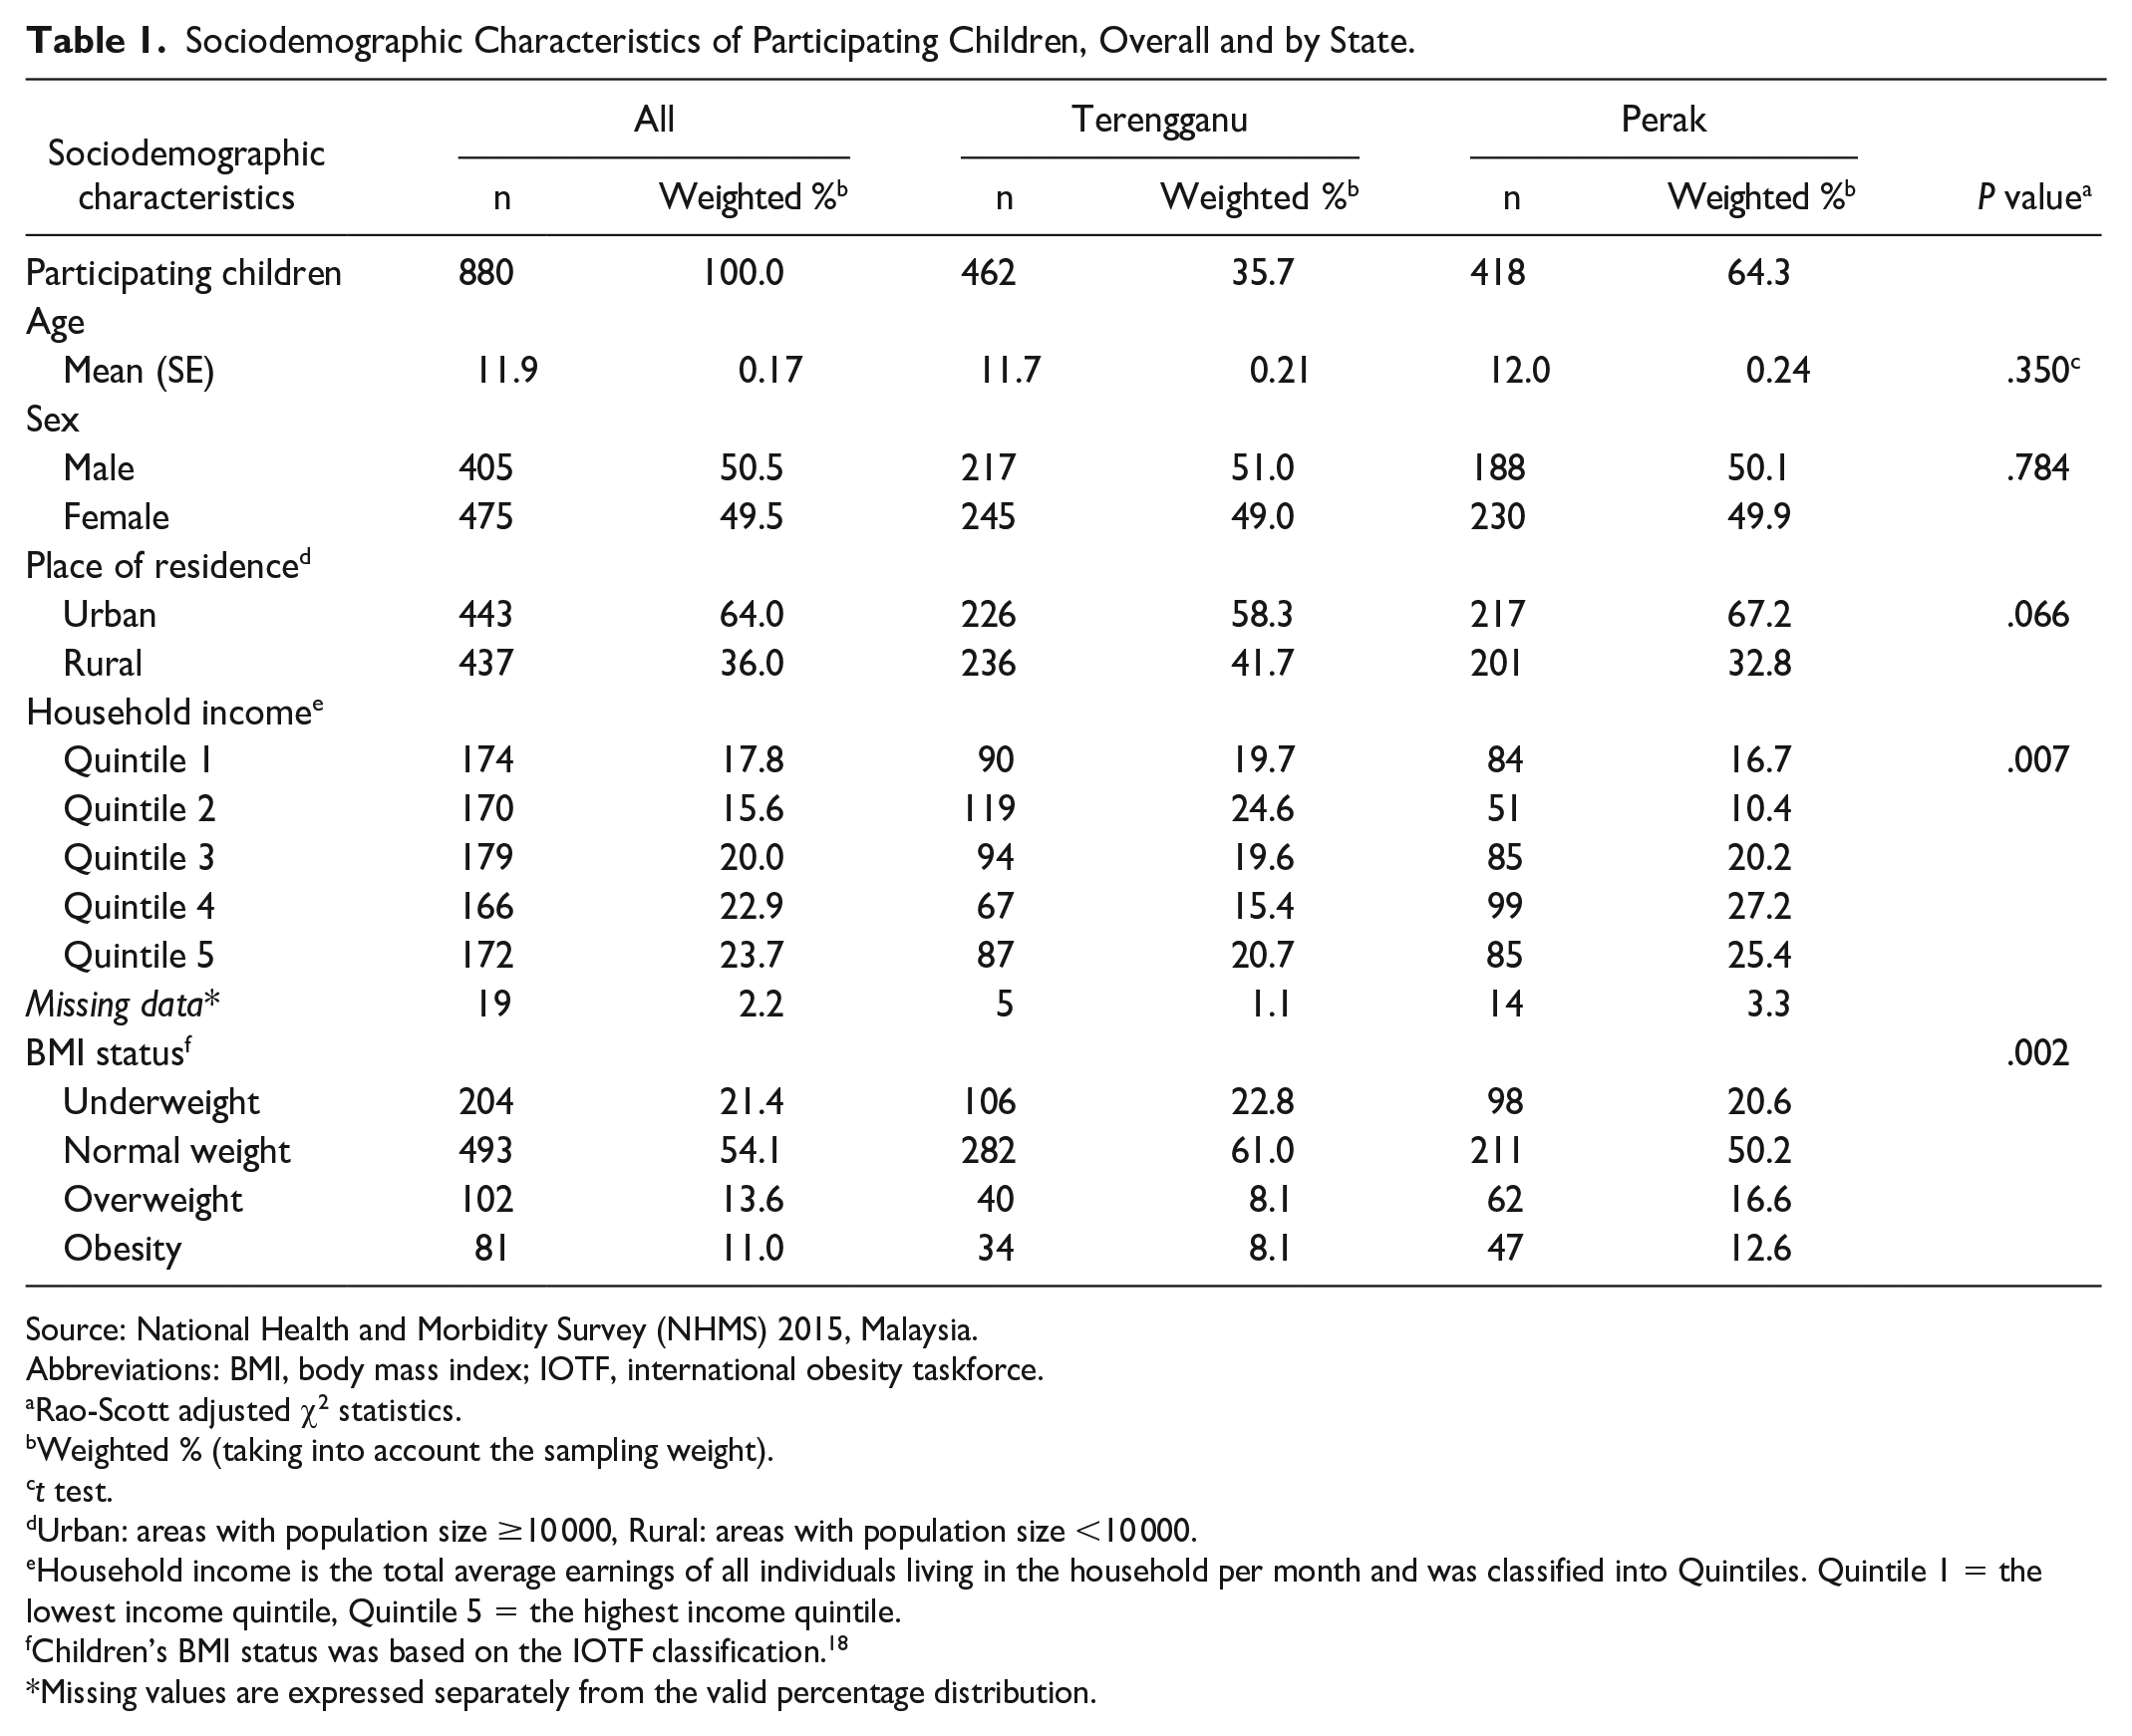
Source: National Health and Morbidity Survey (NHMS) 2015, Malaysia.
Abbreviations: BMI, body mass index; IOTF, international obesity taskforce.
Rao-Scott adjusted χ2 statistics.
Weighted % (taking into account the sampling weight).
t test.
Urban: areas with population size ≥10 000, Rural: areas with population size <10 000.
Household income is the total average earnings of all individuals living in the household per month and was classified into Quintiles. Quintile 1 = the lowest income quintile, Quintile 5 = the highest income quintile.
Children’s BMI status was based on the IOTF classification. 18
Missing values are expressed separately from the valid percentage distribution.
Overall, 20% to 40% of children had at least one type of food outlet within a 1000-m buffer radius (Table 2). The respective proportions were nearly 70% for parks and 30% for sports facilities. Fast-food outlets and supermarkets (within the buffer) were significantly more common in Perak than in Terengganu (Table 2).
Characteristics of the Local Food and Physical Activity Environments, Overall and By State.
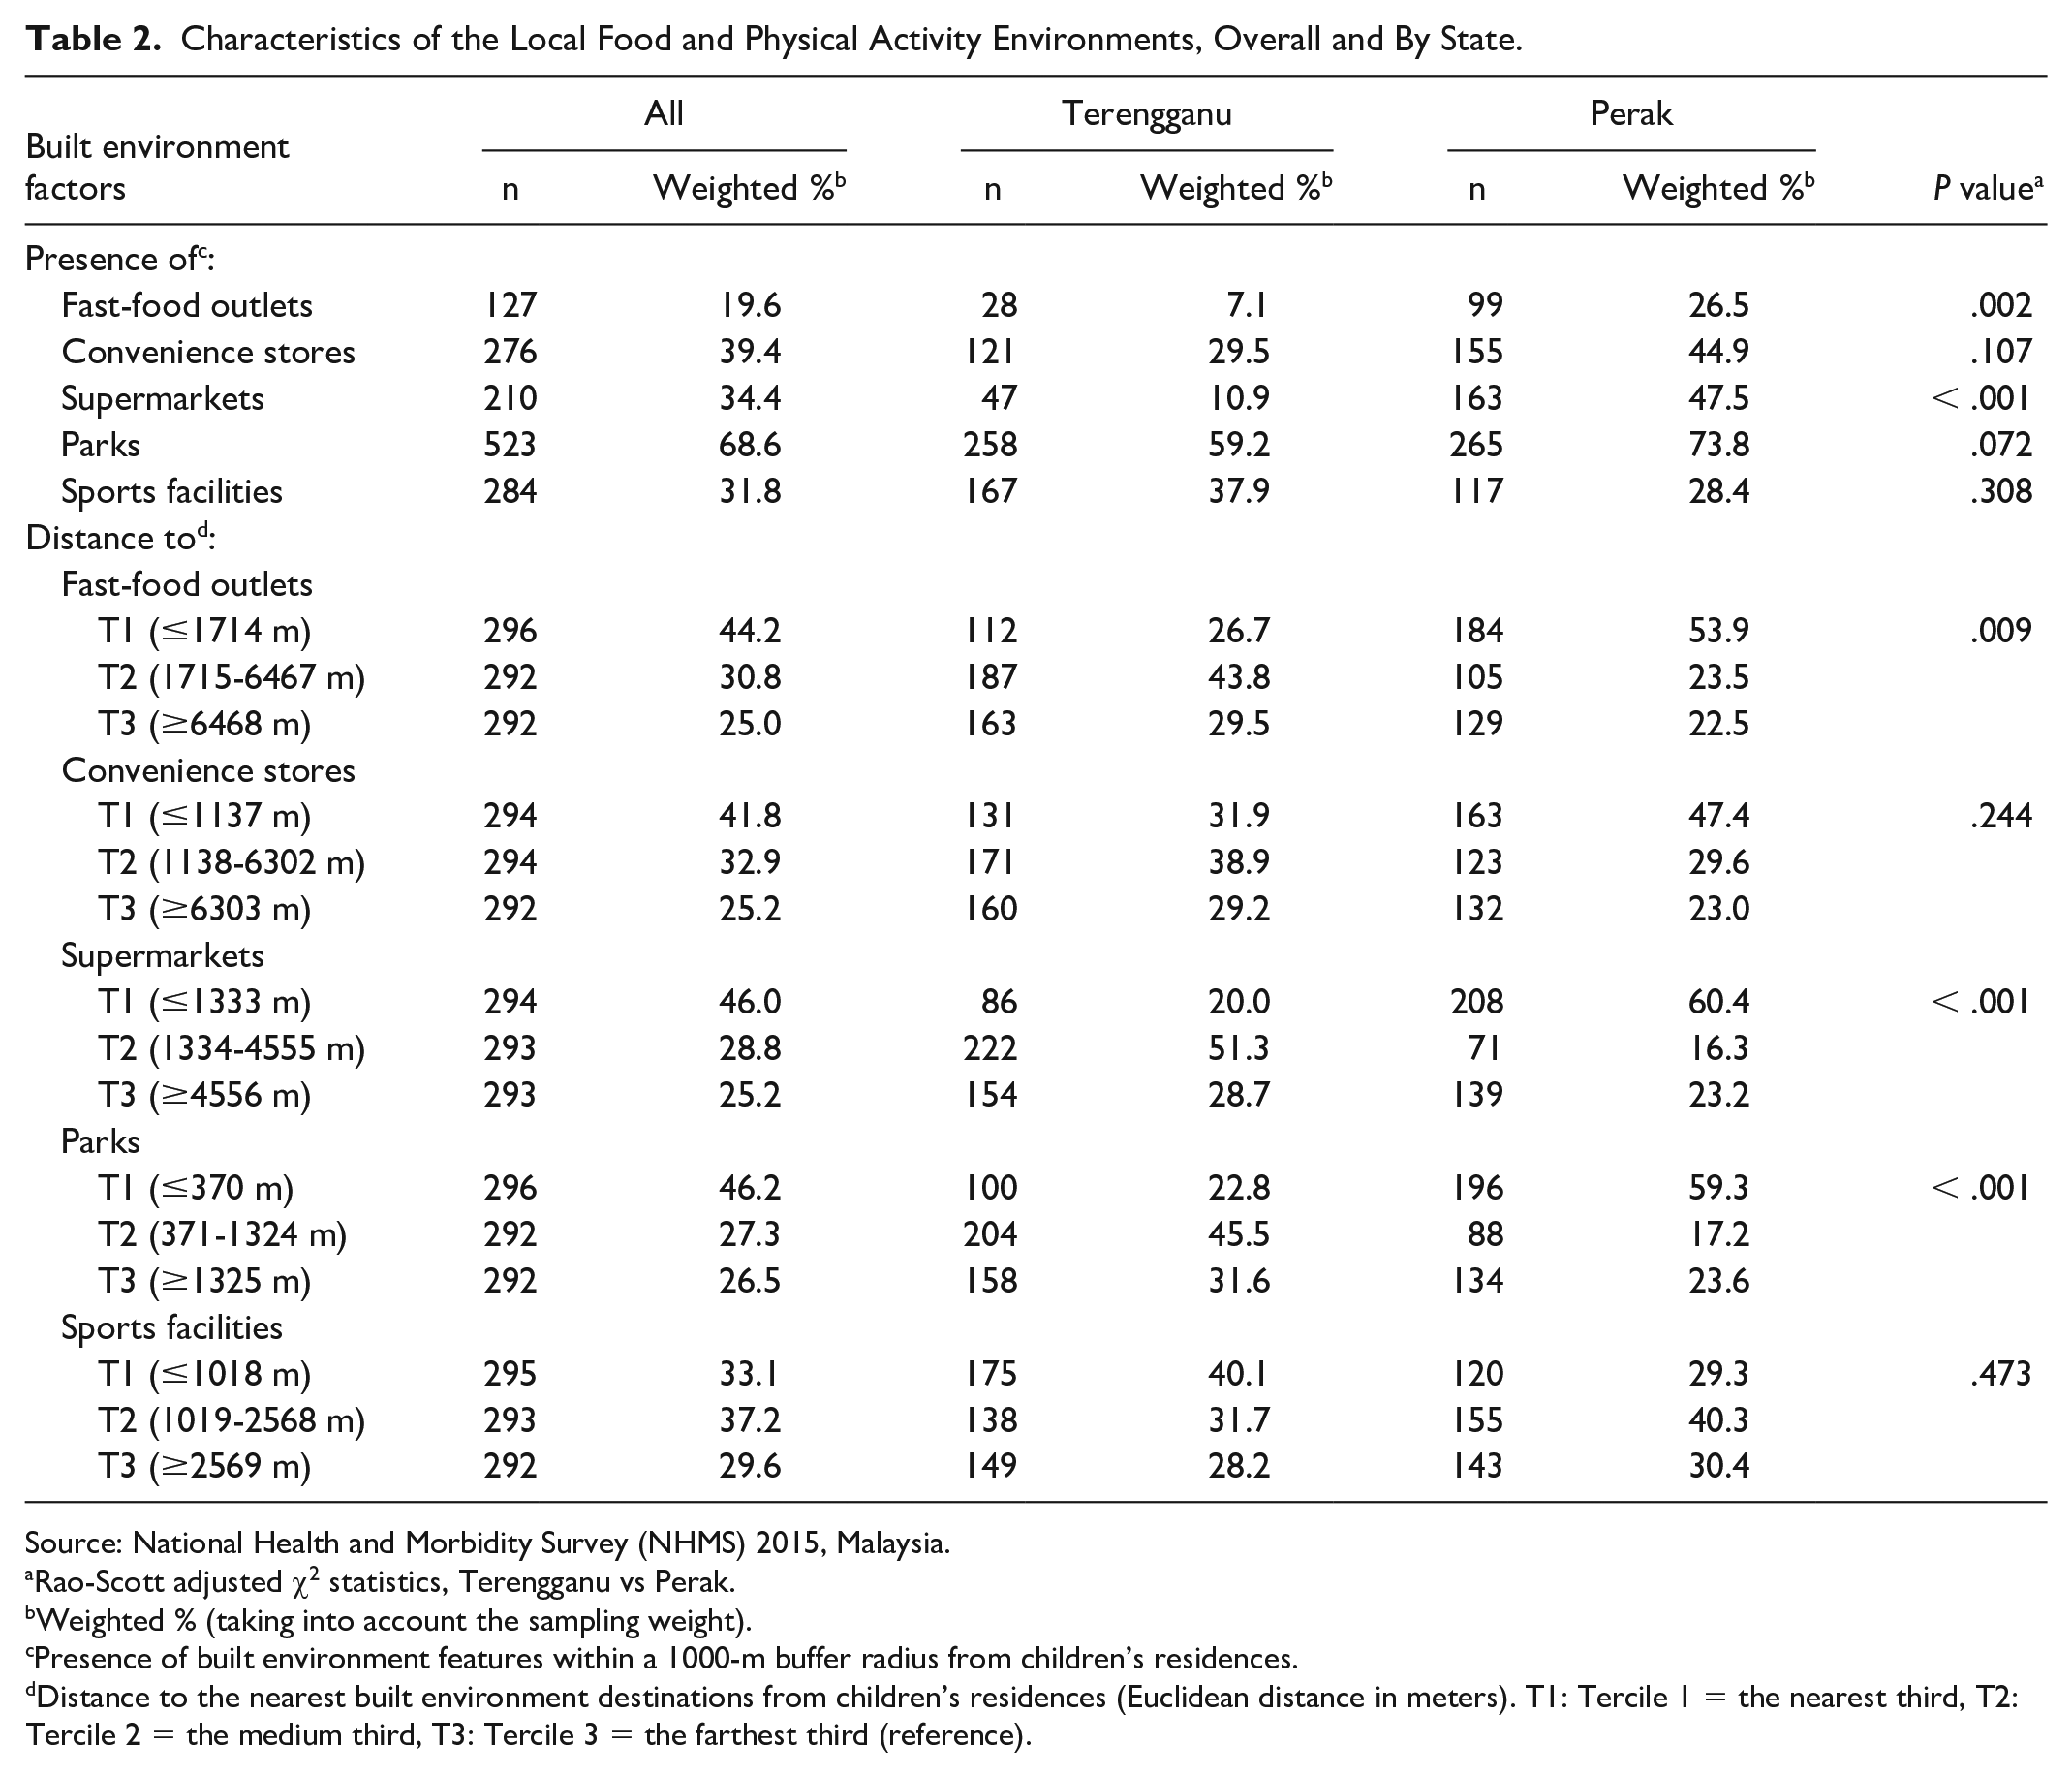
Source: National Health and Morbidity Survey (NHMS) 2015, Malaysia.
Rao-Scott adjusted χ2 statistics, Terengganu vs Perak.
Weighted % (taking into account the sampling weight).
Presence of built environment features within a 1000-m buffer radius from children’s residences.
Distance to the nearest built environment destinations from children’s residences (Euclidean distance in meters). T1: Tercile 1 = the nearest third, T2: Tercile 2 = the medium third, T3: Tercile 3 = the farthest third (reference).
Compared with children in Terengganu, those in Perak had shorter median distance to fast-food outlets (1600 m vs 3200 m), convenience stores (1200 m vs 2500 m), supermarkets (1100 m vs 2200 m), and parks (300 m vs 700 m) (for all comparisons, P < .001). The opposite was observed regarding sports facilities (1800 m in Perak vs 1500 m in Terengganu, P < .001). Significantly higher proportions of children in Perak lived within the nearest third of distance (T1) to fast-food outlets, supermarkets, and parks compared with Terengganu (Table 2).
Overweight was significantly more common among children who lived in the presence of food outlets or parks within a 1000-m buffer radius compared with those who did not (Figure 1). The same was observed for children who lived within the nearest third of distance (T1) to food outlets and parks compared with the farthest third (T3). The presence of and distance to sports facilities were not associated with overweight. Associations of the presence of and distance to convenience stores and parks with overweight remained significant when adjusted for children’s sociodemographic characteristics. The presence of convenience stores remained significant after a further adjustment for the physical activity environment (adjusted for parks, PR = 1.60, 95% CI [1.09, 2.34], P = .016; adjusted for sports facilities, PR = 1.68, 95% CI [1.14, 2.47], P = .009). Only few built environments showed a significant interaction (P < .01) with state: the presence of convenience stores (PR = 2.14, 95% CI [1.2 7, 3.61], P = 0.005) and sports facilities (PR = 1.47, 95% CI [1.02, 2.13], P = 0.042) was associated with higher prevalence of overweight in Perak only. Findings from the sensitivity analysis (using 1500-m buffer radius) were mainly consistent with the initial analysis and led to similar conclusions.
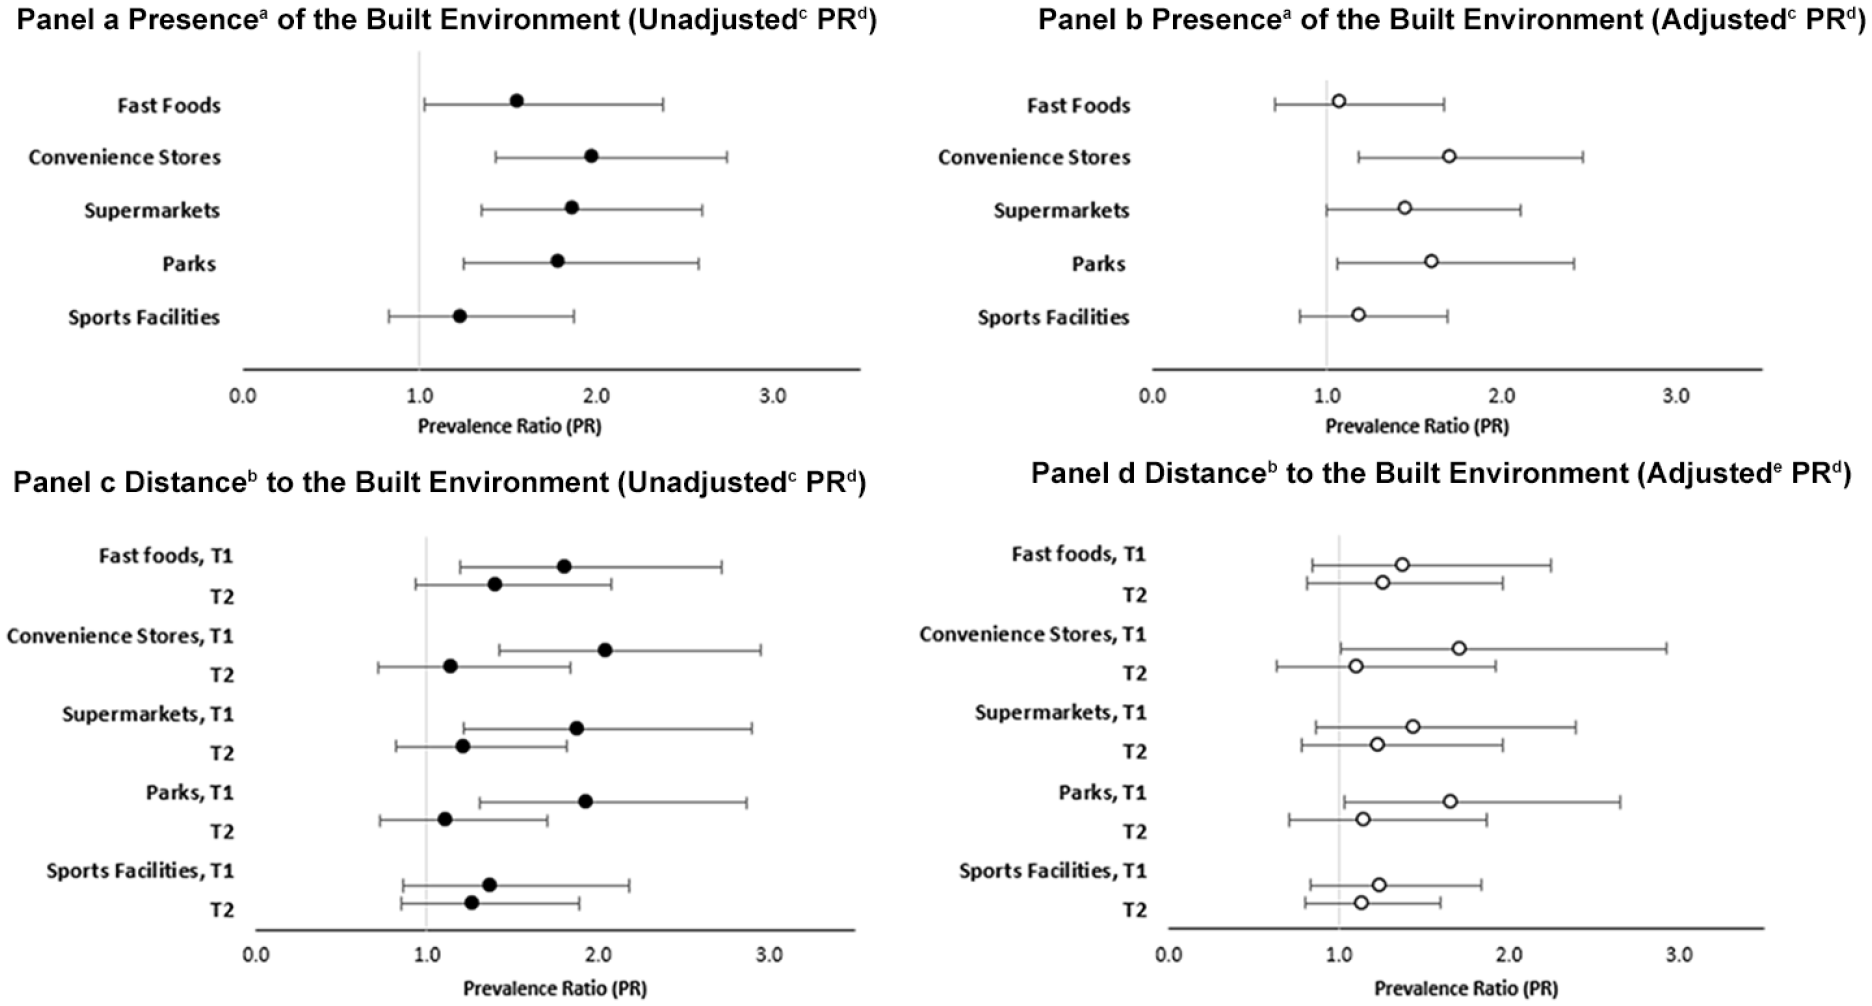
Associations between different built environments and overweight (including obesity) among children, expressed as PR from log-Poisson regression analyses. (Panel a) Overweight explained by presence (vs absence) of different built environment features (unadjusted PR). (Panel b) Overweight explained by presence (vs absence) of different built environment features and adjusted for sociodemographic factors (adjusted PR). (Panel c) Overweight explained by distance to (Tercile 1 [T1] and Tercile 2 [T2] vs Tercile 3) different built environment features (unadjusted PR). (Panel d) Overweight explained by distance to (Tercile 1 [T1] and Tercile 2 [T2] vs Tercile 3) different built environment features and adjusted for sociodemographic factors (adjusted PR). Children’s BMI status was based on the IOTF classification. 18
Discussion
We investigated whether access to local food and physical activity environments was associated with overweight among 5- to 17-year-old children in two states in Malaysia. We found that children living in the state with higher prevalence of overweight had greater access to food environment and parks than children in the state with lower prevalence of overweight. Greater access to the built environment was associated with overweight; however, sociodemographic factors partly explained these associations. Access to convenience stores and parks was associated with overweight, irrespective of the children’s sociodemographic backgrounds.
Association Between Access to Food Environment and Overweight
Our results extend previous evidence on a positive association between access to convenience stores and overweight in children.20,21 Overweight was more common among children exposed to convenience stores, and this association was independent of children’s sociodemographic backgrounds and access to physical activity environment. Convenience stores are well known to sell energy-dense convenience foods and sugar-sweetened beverages, and access to convenience stores around children’s residential areas has been associated with unhealthy weight-related behaviors, such as increased snacking and consumption of fast foods, takeaways, and sugar-sweetened beverages. 8 In the present study, 40% of children had at least one convenience store within a 1000-m buffer radius, and the median distance to convenience stores was the shortest when compared with other food outlets. This could explain our robust findings.
Access to supermarkets was positively associated with overweight in our unadjusted analyses, while the associations diminished when sociodemographic factors and access to physical activity environment were considered. This contrasts with several findings of an inverse association in developed countries. 5 Access to supermarkets has been associated with the availability of healthy foods in developed countries, but supermarkets also sell a variety of low-nutrient, high-energy foods and beverages in large quantities at cheap prices.7,22 In Malaysia, large supermarkets are usually located inside shopping malls together with other food establishments, and Malaysians enjoy spending their free time in shopping malls for dining, socializing, and entertainment, which has led to a boom of shopping malls across towns in Malaysia. 23 This could partly explain the contradicting findings between the present and previous studies. 5
Association Between Access to Physical Activity Environment and Overweight
We found a positive association between access to parks and overweight, which was only slightly reduced after controlling for sociodemographic factors. This contrasts with several studies in developed countries that reported inverse or no significant relationships.9-12 On the contrary, higher odds of overweight were associated with increasing percentage of green areas in rural regions among Norwegian adolescents 24 and with shorter distance to parks in urban areas among Dutch children. 25 Recent reviews demonstrated that diverse measures of park/green space have been used,9,11,12 which could be one reason for such discrepant results, besides other differences in the methodologies, including that we cannot exclude residual confounding. Other explanations for the distinct finding in our study could be differences between the populations studied, such as differences in beliefs, preferences, and behaviors influenced by culture. 13 Malaysian children could attend parks less often than children in developed countries because of the on-average very warm weather with bouts of heavy rains and floods, or because of spending more time after school on doing homework or attending tuition classes. 26 Measured in 2016, the proportion of adolescents with insufficient physical activity was higher in Malaysia (86.2%) than in developed nations, where most of the studies were conducted (United States = 72.0%, Canada = 76.3%, United Kingdom = 79.9%). 27 Also, food stalls, street hawkers, and ice cream peddlers selling high-calorie foods and drinks near parks, playgrounds, and recreational areas are quite common in Malaysia, and these places are also commonly used as sites for picnics. Inconsistent findings may also reflect the complexity of the relationship between built environment and childhood weight status,9,12 such as interactions by other built environment, social environments (such as perceived safety of parks), or sociodemographic factors (such as sex/gender, age, ethnicity, urban/rural residence, socioeconomic position).9,10,12 These aspects warrant further assessment.
This study has several strengths. We used children’s residential geolocations to measure access (presence and distance) to the built environment, and children’s weights and heights were objectively measured by trained personnel. We simultaneously addressed food and physical activity environments as both could affect individual energy balance. We also performed sensitivity analyses with a 1500-m buffer radius.
The study also has limitations to be considered. The cross-sectional design prevents us from making causal inferences. The identification of built environment was conducted after the survey, and we do not have information on temporal exposures to the built environment. Regarding buffer size, radiuses between 0.1 and 16.0 km have been used in previous studies on children.6-8,11,12 Different buffer sizes may be appropriate for different age groups of children, considering the different levels of independence. However, we selected the 1000-m buffer size to adapt to the wide age range of participating children in this study. Using network distances was not feasible in this study due to imperfect road network data, and using Euclidean distances may have resulted in underestimation of the true distance. Nonetheless, Euclidean distance gives a general overview on the distributions and distances between participants and the built environment. Furthermore, we employed indirect methods to assess the environment, whereas ground-truthing or field audits are the gold standard. We did not include other types of food sources such as stalls, street vendors, small grocery stores, or night markets, which could also act as sources of high-energy and low-nutrient food for children. We also lacked information on some potential mediating or confounding factors such as child and parental dietary and physical activity behaviors, consumer food environment, and additional aspects of physical activity environment. The relatively small sample size and fewer built environment may explain the lack of associations in the state with the low prevalence of overweight. Finally, the generalizability of the present findings to areas with different built environment features or socioeconomic and demographic compositions may be limited.
Conclusion
Built food and physical activity environments near children’s residences were associated with higher prevalence of overweight in Malaysian children. These associations were partly explained by sociodemographics; however, higher access to convenience stores and parks was associated with higher prevalence of overweight irrespective of the children’s sociodemographic factors. To ensure the success of intervention strategies to curb the overweight epidemic, both built environment and children’s sociodemographic backgrounds should be considered. Future research should be done with a larger sample size representing subpopulations in Malaysia with a longitudinal research design and direct assessment of the built environment and measurement of dietary and physical activity behaviors. Such efforts could further enhance the understanding of potential effects of built environments on childhood overweight and guide planning of interventions for at-risk populations.
Footnotes
Acknowledgements
We would like to thank the Director-General of Health Malaysia and the Federal Department of Town and Country Planning for the permission to use the data sets and publish this article.
Declaration of Conflicting Interests
The author(s) declared no potential conflicts of interest with respect to the research, authorship, and/or publication of this article.
Funding
The author(s) received no financial support for the research, authorship, and/or publication of this article.