
Abstract
Head and neck squamous cell carcinoma is the most commonly diagnosed cancer worldwide. The lifestyle, food habits, and customary practices manifest the Northeast Indian population toward higher susceptibility to develop head and neck squamous cell carcinoma. Here, we have investigated the association of smoke and smokeless tobacco, and alcohol with copy number variation of cell-free mitochondrial DNA and cell-free nuclear DNA in cases and controls. Cell-free DNA from plasma was isolated from 50 head and neck squamous cell carcinoma cases and 50 controls with informed written consent using QIAamp Circulating Nucleic Acid Kit. Real-time polymerase chain reaction was done for copy number variation in cell-free mitochondrial DNA and cell-free nuclear DNA. Receiver operating characteristic curve analysis was performed to evaluate the diagnostic application between the two study groups using clinicopathological parameters. The levels of cell-free nuclear DNA and cell-free mitochondrial DNA of cases in association with smoke and smokeless tobacco, alcohol with smoking (p < 0.05) were significantly higher (p < 0.01 and p < 0.001, respectively) than controls. Using receiver operating characteristic curve analysis between head and neck squamous cell carcinoma cases and controls, we distinguished cell-free mitochondrial DNA (cutoff: 19.84 raw Ct; sensitivity: 84%; specificity: 100%; p < 0.001) and cell-free nuclear DNA (cutoff: 463,282 genomic equivalent/mL; sensitivity: 53%; specificity: 87%; p < 0.001). The copy number variation in cases (cell-free nuclear DNA: 5451.66 genomic equivalent/mL and cell-free mitochondrial DNA: 29,103,476.15 genomic equivalent/mL) and controls (cell-free nuclear DNA: 1650.9 genomic equivalent/mL and cell-free mitochondrial DNA: 9,189,312.54 genomic equivalent/mL), respectively. Our result indicates that the cell-free mitochondrial DNA content is highly associated with smoke and smokeless tobacco, betel quid chewing, and alcohol which shows greater promises, holding the key characteristics of diagnostic biomarkers, that is, minimal invasiveness, high specificity, and sensitivity.
Keywords
Introduction
Head and neck cancer is the most commonly diagnosed cancer worldwide, with 90%–95% of the cases reported to be squamous cell carcinoma.1,2 The disease is one of the most mystifying, commonly misdiagnosed and poorly understood entities because the lesion is often situated in a relatively inert space where only air and mucus are in transit. Head and neck squamous cell carcinoma (HNSCC) can be silent for a long time without any primary symptoms. In Northeast India, HNSCC is most familiar in the states of Assam, Manipur, Mizoram, Tripura, and Nagaland with an incidence of 54.48%, which acquires 30%–40% cancers at all sites and is the sixth most common cause of death in males and seventh in females.3,4 The practice of betel quid chewing (locally known as Kwai or tambul primarily consumed with betel leaf and slaked lime), 5 along with smokeless tobacco products (locally termed as Khaini, Zarda, Gutkha), 6 cigarette smoking, kitchen setup (closed kitchen setup, exposure to household smoke from burning firewood), is also associated with the prevalence of HNSCC in some states of Northeast India, namely, Nagaland, Manipur, and Mizoram, 7 including alcohol drinking, which possibly features to cancer incidences in this region due to oxidative damage.8,9
Lately, the clinical viewpoint of cell-free DNA (cfDNA) has sparked the interest of scientists as it opens up a new possibility for non-invasive analysis of tumor-derived genetic materials such as circulating tumor cells (CTCs), cfDNA, cell-free mitochondrial DNA (cfmtDNA), circulating RNA, or microRNAs. 10 The idea of a “liquid biopsy” analysis may provide a means for non-invasive, real-time monitoring, 11 with potential applications of prognosis, response to therapy, and emergence of treatment resistance. 12 However, its success is dependent on robust validation in sufficiently large independent prospectively designed studies. 13 Earlier, increased levels of cfDNA were reported in the plasma of patients with cancer. 14 The release of cfDNA into the blood is presumably related to apoptosis and necrosis of cancer cells in the tumor microenvironment. 15 Identifying and decoding these potent biological signals in the form of cfDNA could serve as a better diagnostic marker in terms of “liquid biopsy,” which would be convenient for many diagnostic applications against the conventional tissue biopsies approach. 16 The routine application may bring the feasibility and reliability of tracing the changes in cell-free nuclear DNA (cfnDNA) as well as cfmtDNA during the natural course of the disease or during cancer treatment. 17
An increase in mitochondrial DNA (mtDNA) copy number has been reported in HNSCC,18,19 papillary thyroid carcinoma,20,21 lung cancer, 5 chronic lymphocytic leukemia (CLL), and small lymphocytic lymphoma.7,22 Mitochondrial defects have long been suspected to play an important role in the development and progression of cancer. 23 Mitochondrial respiratory activity is associated with the generation of reactive oxygen species (ROS). The mitochondrial genome is susceptible to ROS and other types of genotoxic damage due to lack of protective histones and its limited mtDNA repair capabilities. MtDNA copy number is a surrogate measure of mitochondrial function. 22 Change in mtDNA content has been reported from various body fluids, such as circulating blood cells, cell-free serum, saliva, sperm, urine, and cerebrospinal fluid, and also in tissue samples, such as tumor tissue, various organs, and biopsy materials, indicating a clear interest in measuring the mtDNA to nuclear DNA (nDNA) ratio. 24 But the cfmtDNA content reports are scarcely mentioned, with available studies on Ewing’s sarcoma, 25 trauma, 25 hepatocellular carcinoma, 26 chronic heart failure, 26 diabetes mellitus, 15 and prostate cancer 21 due to inefficient predictive value in high-risk population study. Although, a very few non-invasive methods and their associated biomarkers are available for screening and monitoring of HNSCC.24,27 Most contemporary studies have focused on the quantitative real-time analysis of cfDNA, but data on the content of cfmtDNA in plasma are lacking. 28
The study is hypothesized to examine selected environmental risk factors (diet and lifestyle) on the content of cfmtDNA, cfnDNA, and their potentiality to be used as an early diagnostic marker. This is the first kind of study on cfDNA copy number variation from India, which has included demographic clinical data of HNSCC cases and control.
Materials and methods
Demographic data collection
This study was conducted on Northeast India, namely, Assam, prone/prevalent/susceptible to HNSCC. Data regarding age, gender, lifestyle, occupation and nature of consuming tobacco–betel quid habit (smoke or smokeless), and alcohol intake from HNSCC cases and healthy controls were abstracted from hospital records and on personal interviews.
Subjects and sample collection
The study was conducted at the Laboratory of Molecular Medicine, Department of Biotechnology, Assam University, Silchar, India, and in Life Sciences Division, Institute of Advanced Study in Science and Technology (IASST), Guwahati, India. Consent forms were collected from all patients included in the study. This study was approved (IEC (HS)/IASST/1082/2015-16/1) by the Institutional Review Board (IRB), Institute of Advanced Study in Science and Technology, Guwahati, India. All possible precautions were taken to avoid any cross-contamination while collecting as well as processing of the samples.
Study cohort and sampling procedure
Samples were collected during the time period 2015 to 2016 from Ayursundra Hospital. Blood samples were taken before any surgical interventions or therapeutic treatments. The blood samples were processed and the plasma cfDNA was extracted according to standardized protocol, and the isolated DNA was quantified using Qubit Fluorometer 3.0 (Thermo Fisher Scientific, Gurgaon, India). The study (n = 100) was divided into two groups: (1) HNSCC cases (n = 50) and (2) healthy controls (n = 50). All cancer samples were confirmed by histopathology to be HNSCC. The healthy controls in this study neither had a family history of cancer nor experienced any other diseases.
CfDNA extraction from plasma
Peripheral blood was collected in BCT Streck tubes (Streck Inc., Omaha, NE, USA). 29 Blood samples were centrifuged at 1900g for 10 min, and the plasma was transferred, with great care by not disturbing the cell pellet, and transferred into a sterile plain polypropylene tubes. We used 500 μL of plasma per sample for extraction. CfDNA from plasma was isolated using QIAamp Circulating Nucleic Acid Kit (cat no. 55114) with QIAvac 24 Plus setup. The cfDNA isolation was carried out as per the manufacturer’s instructions, and the extracted cfDNA was eluted in 30 μL of elution buffer. The quantity of cfmtDNA and cfnDNA in the mixture was then measured by real-time quantitative polymerase chain reaction (PCR) (qPCR) assays.
qPCR
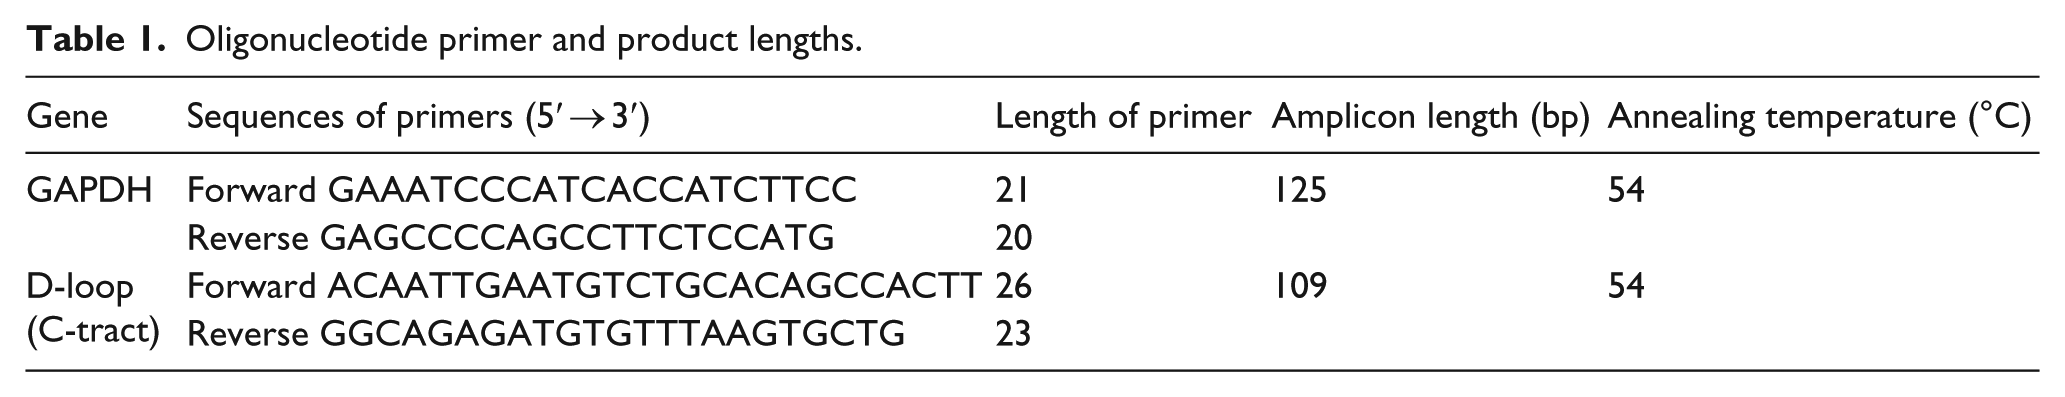
For the quantification of cfnDNA and cfmtDNA from plasma, real-time PCR was carried out using the nuclear GAPDH and the mitochondrial D-loop genes (C-tract region). The amplicon length, the annealing temperature, and the sequence information of primers for the GAPDH and the D-loop (C-tract region) genes are shown in Table 1. Real-time PCR was carried out in 10 μL of total reaction volume containing 3 μL H2O, 5 μL SYBR® Green Universal PCR Master Mix (Applied Biosystems, Branchburg, NJ, USA), 0.5 μL each of the above-mentioned 10-μM primers (Sigma-Aldrich, Bengaluru, India). For each reaction, 1 μL of DNA was added. qPCR was performed using ABI StepOne Real-Time PCR (Applied Biosystems) under the following conditions: first denaturation at 95°C for 10 min followed by 40 cycles of 95°C for 15 s, 54°C for 1 min, and 72°C for 1 min.
Oligonucleotide primer and product lengths.
Data collection and processing
The raw threshold cycle (Ct) values were recorded by the ABI StepOne Real-Time PCR software. Each sample was analyzed in triplicates, and one negative control was included in every run. For calibration, a standard curve with known genomic DNA concentrations ranging from 1.65 × 10⁴ to 1031 pg/μL with a dilution factor of 2 (including 5000, 2500, 1250, 625, 312.5 genome equivalent/μL (GE/μL)) was used. To determine the quantities of cfmtDNA, we amplified the whole mitochondrial genome using long PCR enzymes (Life Technologies, Bengaluru, India). Amplified DNA was quantified using a Qubit Fluorometer 3.0 (Thermo Fisher Scientific), and purity was examined by BioSpectrometer® (Eppendorf).
The efficiency of the assay for amplifying both cfnDNA and cfmtDNA was evaluated using standard curves generated by dilution series. The standard curves had average slopes at approximately ~3.3 (~100% efficiency). The concentration of cfnDNA was calculated according to the standard curves, using known concentration of human genomic DNA. The results were expressed as GE per milliliter of plasma for cfnDNA using the standard conversion factor of 6.6 pg of DNA per cell. 30 The content of cfmtDNA was calculated using the delta Ct (ΔCt) of an average Ct of cfmtDNA and cfnDNA (ΔCt = Ct cfnDNA − Ct cfmtDNA) in the same well as an exponent of 2 (2ΔCt). Relative quantities of cfmtDNA could be estimated using an equation of GE (nDNA) × fold-change mtDNA and also expressed as GE per milliliter of plasma.
Statistical analysis
Medians and frequencies of selected characteristics were compared between cases and controls using the Mann–Whitney U test and the Pearson chi-square for all other categorical variables. Receiver operating characteristic (ROC) curve analysis was performed, and the areas under the ROC curves (AUCs) were measured to compute the specificity and sensitivity of cfnDNA and cfmtDNA copy number to diagnose patients with HNSCC. p ≤ 0.05 was considered statistically significant. Sensitivity and specificity were calculated according to the formulas: (true positive/true positive + false negative) × 100, (true negative/true negative + false positive) × 100, respectively, and expressed as percentage. 31
Results
Demographic and clinical characteristics of HNSCC cases and controls
The characteristics of the study population were summarized in Table 2. There were no statistically significant differences in terms of age (p < 0.81), gender (p < 0.39), intake of fruit (p < 0.12), and intake of salted dry fish (p < 0.85). However, significant differences were observed in the kitchen setup of the individuals using firewood (p = 0.001), cigarette smoking (p < 0.01), betel quid (p < 0.0001), gutkha (p < 0.0001), zarda (p < 0.0001), khaini (p < 0.0001), and alcohol with cigarette smoking (p < 0.0001). The individual risk factors associated with HNSCC were also examined. The individuals with closed kitchen (partially ventilated using firewood) setup were at 4.1-fold increased risk (95% confidence interval (CI): 1.47-2.85; p < 0.0001) when compared to individuals with well-ventilated kitchen setup (using liquefied petroleum gas). Similarly, 4.3-fold increased risk has been observed among smokers (10 cigarettes/day), 4.1-fold increased risk (95% CI: 1.33–2.55; p < 0.0001) among gutkha users (5 packets/day), 4.2-fold increased risk (95% CI: 1.25–2.12; p < 0.0001) in betel quid chewers (10 per day), 4.9-fold increased risk (95% CI: 1.17–1.76; p < 0.001) among zarda users (more than 3 times/day), 4.3-fold increased risk (95% CI: 1.09–1.54; p < 0.001) among khaini users (more than 10 times/day), and 3.6-fold increased risk (95% CI: 1.68–4.08; p < 0.001), respectively, among individuals consuming alcohol along with cigarette smoking in comparison with healthy controls were observed (Table 3) as contributing risk factors for HNSCC prevalence in Northeast India.
Selected characteristics of HNSCC cases and controls.

HNSCC: head and neck squamous cell carcinoma.
Mann–Whitney U was used to examine difference.
Chi-square was used to examine differences.
p < 0.05 considered as statistically significant.
Environmental risk factors and risk of HNSCC.

HNSCC: head and neck squamous cell carcinoma.
Fisher’s exact test was used to calculate p value and p < 0.05 considered as statistically significant.
Quantitative assessment of cfnDNA and cfmtDNA
The cfnDNA and cfmtDNA equivalents were calculated according to the standardized method using reproducible standard dilution curves (Figure 1(a) and (b)). The primers for amplifying GAPDH and D-loop (C-tract) genes have been successfully used in our previous studies, and the specificity of the assay has been confirmed. 23 The standard curves with average slopes of approximately ~3.3 (~100% efficiency) were obtained. The two assays on the dilution series were very similar and showed a good reproducibility.

Simulation of real-time PCR kinetics for amplifying: (a) cfnDNA (GAPDH) and (b) cfmtDNA (D-loop C-tract) on serial dilutions. Levels of cfDNA copy number as determined by qPCR. Scatter dot plots of the levels of the (c) nuclear GAPDH and (d) mitochondrial D-loop (C-tract) in head and neck cancer patients (HNSCC, n = 50) and normal control subjects (control, n = 50). The lines in the scatter dot plots denote the medians. The cf nuclear and mitochondrial DNA copy numbers were higher in HNSCC patients compared to those in controls (higher raw Ct to HNSCC).
Plasma cfnDNA and cfmtDNA levels between the two study groups
We compared the levels of cfnDNA and cfmtDNA in plasma, by real-time PCR, between the HNSCC cases and controls. The level of cfnDNA in the cases was higher in comparison with the healthy control group (5451.66 vs 1650.9; Mann–Whitney: p < 0.01). Similarly, a significant increased level of cfmtDNA copy number was found in HNSCC cases when compared with the healthy control group (29,103,476.15 vs 9,189,312.54; Mann–Whitney: p < 0.001). The median values of plasma cfnDNA and cfmtDNA in the selected study groups are shown in Table 4. The comparison of the cfnDNA and cfmtDNA levels between the study groups is illustrated in Figure 1(c) and (d), respectively.
Concentrations of plasma cfnDNA and cfmtDNA in HNSCC cases and controls, expressed as median.
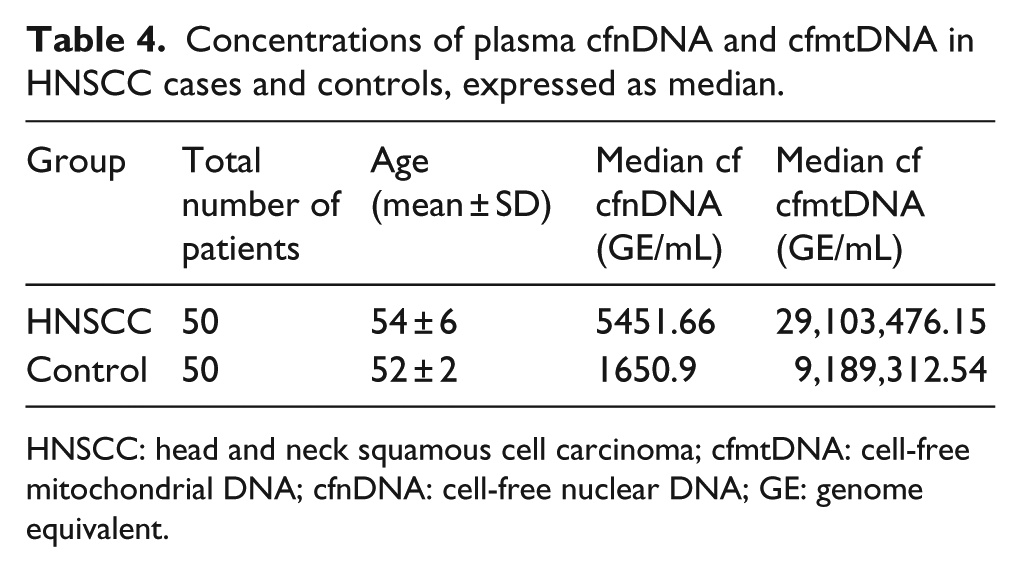
HNSCC: head and neck squamous cell carcinoma; cfmtDNA: cell-free mitochondrial DNA; cfnDNA: cell-free nuclear DNA; GE: genome equivalent.
Plasma cfnDNA and cfmtDNA as marker to differentiate between the two study groups
To assess the applicability of cfnDNA and cfmtDNA as a marker and to distinguish HNSCC cases from healthy controls, we performed ROC curve analysis to identify the optimal cutoff point using the Youden index (J). J is the maximum vertical distance between the ROC curve and the diagonal reference line, defined as J = maximum (sensitivity) + (specificity) − 1. The Youden index permits to choose an optimal cutoff point on the assumption that sensitivity and specificity are weighted to equal extent. 32
ROC curve analysis using cfnDNA to distinguish between HNSCC case and control groups
Level of cfnDNA in the HNSCC cases was significantly higher in comparison with the healthy controls. For distinguishing between the HNSCC cases and the healthy controls, an optimal cutoff point was indicated at <26.95 raw Ct for plasma cfnDNA with a sensitivity of 73%, specificity of 20% (AUC = 0.73; p < 0.001; 95% CI = 0.043–0.481) as shown in Table 5. The ROC curve to distinguish between the HNSCC cases and the healthy control group using cfnDNA is shown in Figure 2(a). It is a plot of the true-positive rate against the false-positive rate (FPR) for the different possible cutoff points of a diagnostic test. It shows the trade-off between sensitivity and specificity (any increase in sensitivity will be accompanied by a decrease in specificity). The closer the curve follows the left-hand border and then the top border of the ROC space, the more accurate the test.
Sensitivity and specificity of cfnDNA and cfmtDNA levels in diagnosis of HNSCC.

HNSCC: head and neck squamous cell carcinoma; cfmtDNA: cell-free mitochondrial DNA; cfnDNA: cell-free nuclear DNA.
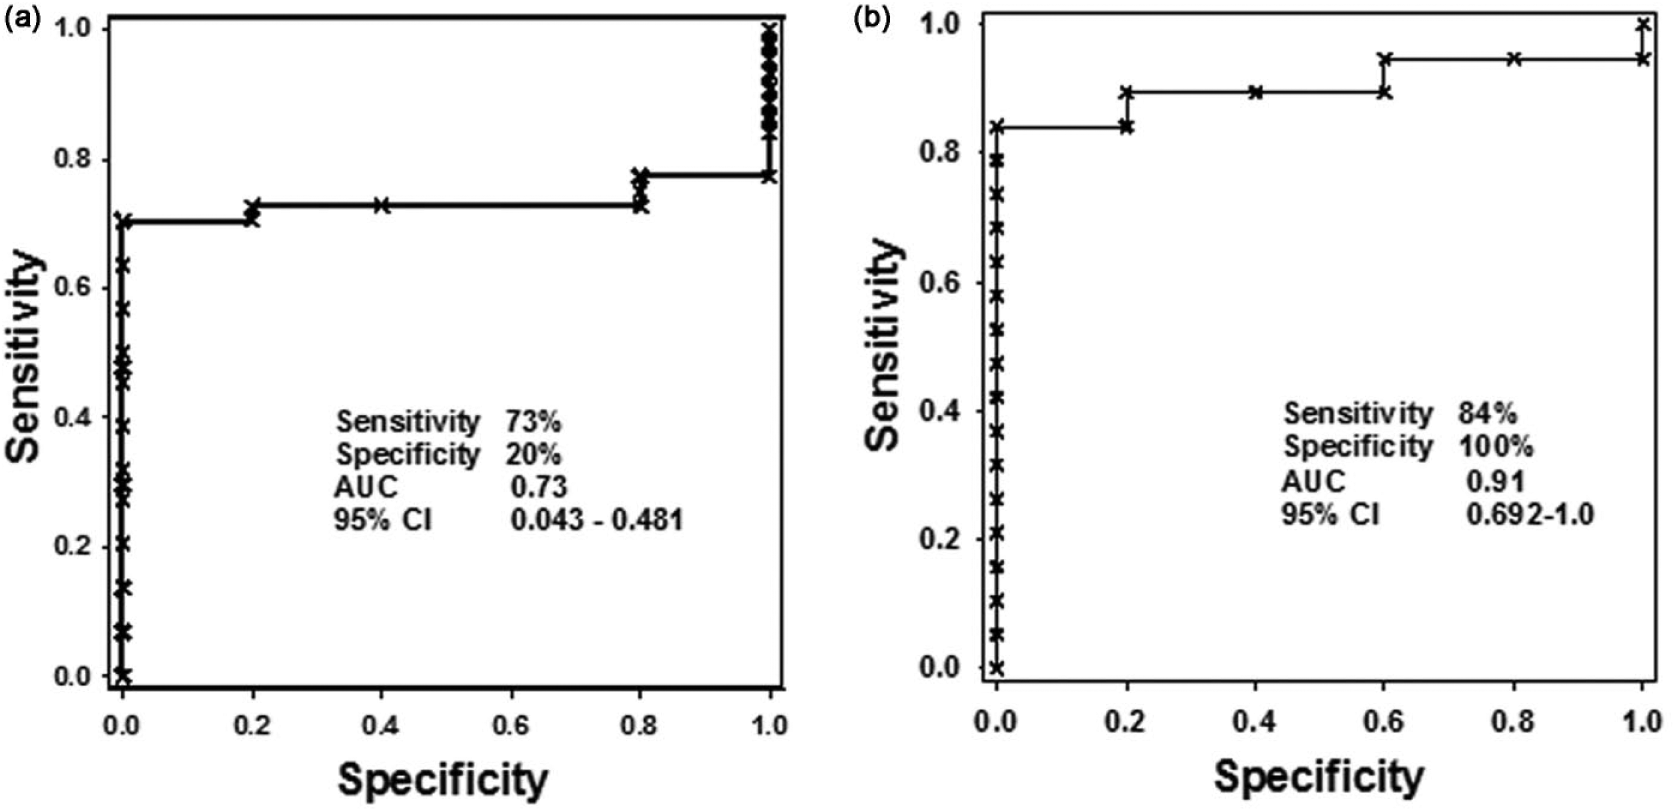
ROC curve comparison in the diagnosis of HNSCC versus healthy controls using (a) cfnDNA and (b) cfmtDNA copy number. For the nuclear GAPDH, AUC is 0.73 and mitochondrial D-loop (C-tract) mtDNA AUC is 0.91.
ROC curve analysis using cfmtDNA to distinguish between HNSCC case and control groups
An increased level of cfmtDNA was observed in the HNSCC cases when compared to the controls. For distinguishing between the two groups, optimal cutoff point was indicated at <19.84 raw Ct for cfmtDNA with a sensitivity 84%, specificity of 100% (AUC = 0.91; p < 0.001; 95% CI = 0.692–1.0) as shown in Table 5. The ROC curve between the HNSCC cases and the healthy control group using cfmtDNA is shown in Figure 2(b).
CfnDNA and cfmtDNA combinatorial biomarker
On single parametric test, the diagnostic utility of cfnDNA was questioned based on the observed sensitivity (84%) and specificity (20%) providing a higher FPR (80%). Although on comparison, cfmtDNA displayed higher sensitivity (84%), specificity (100%), acceptable FPR (FPR = 0%), lower false-negative rate (FNR = 16%), and higher predictive negative value (PNV = 63%) which would effectively confirm that any subject which tests negative will have a low probability of having cancer. The combinatorial testing of cfnDNA and cfmtDNA showed higher FNR and lower PNV, which would not efficiently diagnose the presence of cancer (Table 5).
Discussion
The habitual practice of chewing tobacco and betel quid is prevalent throughout the Indian subcontinent. The betel quid is commonly known as “paan”(quid of piper betel leaf that contains areca nut, lime, condiment, sweeteners, and sometimes tobacco or without tobacco) made by wrapping chopped areca nut in a piper betel leaf; sometimes lime (calcium hydroxide) and tobacco leaves or zarda (flavored tobacco) are included to improve the taste. The combinations of the ingredients are altered according to individual preferences and it is preferred to be consumed in combination with zarda and gutkha.33–35 The habit of betel quid chewing, cigarette smoking, gutkha, 36 zarda, 37 Khaini (chewing tobacco with lime), 38 alcohol along with cigarette smoking, and closed kitchen setup (minimal ventilation) with the use of traditional firewood for cooking are considered to be one of the potential risk factors responsible for HNSCC. 39 Tobacco consumption by cigarette smoking as well as chewing is also considered in development of HNSCC. The presence of 3-(methylnitrosamino) propionitrile (MNPN), nitrosamines, and nicotine, which initiates the production of ROS present in non-burn tobacco (gutkha, zarda, Khaini), eventually leads to DNA and RNA damage which is thought to be the major etiological risk factors for the development of HNSCC (oral cancer) caused by irritation from direct contact with the mucous membranes of mouth with concomitant increased risk of 50-fold.23,40,41
MtDNA decrease and increase in copy number variations of cancer patients have been shown in the past, with adequate efforts to explain both the events. However, decrease in mtDNA content was found in many studies in cancer,6,23,42 but increase in mtDNA content in cancer patients was only reported in very few cases4,37,43 including this study. An increase in mitochondrial copy number has been viewed as a potential compensatory effect for the generalized decline in mitochondrial respiratory function due to oxidative damage. 18 The lack of histones and other DNA-protecting proteins as well as DNA repair systems lesser than those observed in nDNA allows increased deterioration in mtDNA as a possible reason for generating ROS and inducing cell death for observed increase in copy number. 44
Elevated mtDNA content can be an indicative marker of oxidative stress and lipid peroxidation which is associated with environmental exposure to tobacco, smoke, xenobiotics, or radiation. 25 High mtDNA content is also an important marker of a weakened aerobic mechanism that is thought to be involved in the mechanisms of carcinogenesis. 43 It is also believed that tobacco-associated products speed up the accumulation of somatic mutations in mtDNA causing deficiencies in electron transport chain and oxidative phosphorylation, which, in turn, cause increased production of ROS followed by subsequent leakage into the cytoplasm.36,45 However, this process can explain only a part of the association that we observed between increase in cfmtDNA copy number and risk of HNSCC. In this study, we found higher cfmtDNA copy number to be a significant (p < 0.0001) risk factor associated with betel quid chewing, cigarette smoking, gutkha, Zarda, khaini, alcohol drinking along with cigarette smoking and closed kitchen setup.
The association observed in our study reflected smoke and smokeless tobacco–dependent oxidative stress. The carcinogenic and oxidative effects of tobacco-specific nitrosamines, N-nitrosodiethylamine, N-nitrosoanabasine, 4-(N-methyl-N-nitrosamino)-1-(3-pyridyl)-1-butanone, and N′-nitrosonornicotine have been detected in the saliva of betel quid chewers with tobacco. 46 Chemical products of smokeless tobacco such as nicotine, nitrosamines, nitrosamine acids, polycyclic aromatic hydrocarbons (PAHs), aldehydes and metals are also capable in inducing oxidative stress by generating ROS. 10 The average consumption of tobacco snuff in regular users is about 10–15 g per day.11,26 In general, the snuff (snuff is a general term for finely cut or powdered, flavored tobacco, which can be prepared as moist or dry snuff) 47 which is kept in the oral cavity for several hours per day comprised more than 7000 chemical compounds with oxidative agents. Also, cigarette smoke contains many other carcinogens, tumor promoters, oxidants (1014−1016 free radicals per puff) and co-carcinogens, mostly derived from combustion.39,47 In fact, studies in humans have revealed a positive association between increased mtDNA copy number and markers of oxidative stress, including 8-hydroxy-2′-deoxyguanosine and thiobarbituric acid. 38
Increased mtDNA copy number is also an indication of lower levels of antioxidants in blood. 44 This highlights the consumption of antioxidant-rich foods such as green leafy vegetables and fruits may help in reducing the oxidative stress caused by tobacco-associated products48,49 which are usually lacking in their diet. 31 The burden of HNSCC can be minimized by addressing common risk factors, which includes smoking, consumption of tobacco-related products and intake of alcohol. Furthermore, practicing good oral hygiene along with routine cleaning and examination by the dentist can reduce the risk associated with oral cancer. The intake of fruits and vegetables on regular basis can also protect against HNSCC cancer as they are rich in antioxidants.
Conclusion
In conclusion, our study provides evidence that increased mtDNA content in HNSCC is significantly associated with betel quid chewing, smoke, and smokeless tobacco habits which is responsible for altered oxidative stress. Furthermore, our results suggests that the combined analysis of cfnDNA and cfmtDNA levels had a lower specificity and sensitivity compared to single cfmtDNA testing and predicted as a better outcome, especially in Northeast Indian population. Future studies are obligatory to evaluate oxidative stress–related factors that influence cfmtDNA content and to provide novel perception in understanding of cfmtDNA copy number variation and the onset of HNSCC. To the best of our knowledge, this is the first investigation from Northeast India to demonstrate the utility of liquid biopsy by monitoring the cfmtDNA content in the management of HNSCC as an early diagnostic marker.
Footnotes
Acknowledgements
The authors thank the Department of Science and Technology’s (DST), INSPIRE faculty program, Govt. of India, for providing research grant and Ayursundra Hospital, Lachit Nagar, India, for the biological samples.
Declaration of conflicting interests
The author(s) declared no potential conflicts of interest with respect to the research, authorship, and/or publication of this article.
Ethical approval
The study design was approved by Institutional Review Board (IEC (HS)/IASST/1082/2015-16/1) Institute of Advanced Study in Science and Technology (IASST).
Funding
The author(s) disclosed receipt of the following financial support for the research, authorship, and/or publication of this article: This work was supported by the Department of Science and Technology’s (DST) INSPIRE faculty program (DST/INSPIRE Faculty Award/2014/LSBM-130).