
Abstract
Our objective was to evaluate the differences between tumoral vascular pattern of renal cell carcinoma and fat-poor angiomyolipoma by contrast-enhanced computed tomography. All included patients had a definitive pathological diagnosis of either angiomyolipoma or renal cell carcinoma, and then the contrast-enhanced computed tomography images of these patients were evaluated. The patients who had visible prominent vessels in cross-sectional imaging were selected. The tumor vascular pattern (prominent (>2 mm) intratumoral and peritumoral vessels), density, and diameter of the vessels in renal cell carcinoma and fat-poor angiomyolipoma were evaluated. All cases (n = 12) with fat-poor angiomyolipoma were found to have intratumoral vessels and all cases (n = 36) with clear cell renal cell carcinoma were found to have peritumoral vessels. There was no significant correlation detected between the diameter of tumor and the density as well as diameter of the vessels. In conclusion, the evaluation of the vascular pattern using contrast enhancement contrast-enhanced computed tomography may provide important information that is useful in helping accurate differential diagnosis of fat-poor angiomyolipoma or renal cell carcinoma preoperatively.
Introduction
Renal cancer accounts for about 2%–3% of all cancer cases and is the third most common urological tumor. 1 Angiomyolipoma (AML) is one of the most common benign neoplasm of the kidney. 2 This tumor consists of a different amount of blood vessels, smooth muscle, and fat. 3 In general, the detection of the intratumoral adipose tissue is crucial for diagnosing AML accurately. 4 In about 4.5% of all AMLs, fat component is immature or scant. So, in this case, the intratumoral fat cannot be visualized in computed tomography (CT) which called fat-poor AML. 5 Renal cell carcinoma (RCC) is the 13th most common cancer worldwide and accounts for 85%–90% of all renal malignancies. 6 Most RCC are solitary cortical neoplasms that occur with equal frequency in either kidney. 7 RCC have three major histologic subtypes including clear cell, papillary, and chromophobe. The most common subtype is clear cell (about 75%–80%), 8 which is the hypervascular type of tumor. 9
Imaging studies for characterization of benign and malignant renal masses are imperfect. While typical AMLs can easily be diagnosed with various imaging studies, fat-poor AML mimic RCC in various imaging studies. 10 One of the most important roles of the imaging is to differentiate fat-poor AML from RCC because the treatment strategies for these two diseases are completely different. 11 Asymptomatic and small (smaller than 4 cm) AML is not an indication for surgery, whereas RCC should be completely removed by radical or partial nephrectomy. 3 This misdiagnosis ultimately leads to unnecessary surgical resection of these benign renal lesions. 12 Approximately 10%–17% of renal masses that are surgically excised are benign and 2%–6% of the benign solid masses excised from the kidney in surgical series are AML. 13 Although the incidence of fat-poor AML is higher in tuberous sclerosis (TS), but the risk of RCC in these patients is 2%–4%, then differentiation between these two tumors is important. 14 Previous study described methods to differentiate fat-poor AML from RCC, including measurement of lesion attenuation on unenhanced CT images, CT histogram analysis, and chemical shift magnetic resonance imaging (MRI).10,11,15 However, these methods had inconsistent reproducibility and lack validation on a larger scale.
We hypothesized that if the vascular pattern of fat-poor AML and RCC is different, it could be a valuable helpful method to distinguish between fat-poor AML and RCC. Thus, we conducted our study to retrospectively evaluate the vascular pattern for differentiating fat-poor AML from RCC using contrast-enhanced CT (CECT) scan.
Materials and methods
Patient selection
This was a retrospective study approved by our research ethics board. Patients were identified by searching the pathology database of our academic national referral center for urology and nephrology (Hasheminejad Kidney Center, Tehran, Iran) between January 2014 and January 2016 for pathological diagnosis of renal AML or RCC (by surgical resection or biopsy specimens (. All histopathologic analyses were performed by pathologists within the same academic institution with subspecialty training in genitourinary pathology for 20 years. We identified 296 patients with a pathological diagnosis of renal AML or RCC at surgical resection or biopsy specimens (220 patients with RCC diagnosis and 76 patients with AML diagnosis). Then, the cross-sectional images of these patients were evaluated by searching in the picture archiving and communication system (PACS) of the same center (Hasheminejad Kidney Center). Each cross-sectional image was reviewed by a genitourinary radiologist with 12 years’ experience who was blind about pathological diagnosis. Only patients who had preoperative non-enhanced and CECT are selected. So, 22 patients with RCC diagnosis who have only MRI, only non-enhanced CT, or only CECT are excluded. In the next step by searching in images, every patient who had hemorrhagic tumor (later it was found that they all had AML diagnosis), macroscopic fat (fat-rich AML), or tumor thrombosis (later it was found that they all had RCC diagnosis) are excluded. As a result, 16 patients with hemorrhagic tumor, 20 patients with macroscopic fat, and 33 patients with tumor thrombosis are excluded. The remaining patients are 165 with RCC diagnosis and 40 with fat-poor AML (the absence of macroscopic fat on unenhanced CT images was defined as a fat-poor AML in this study). Next, those who had prominent intratumoral or prominent peritumoral vessels (>2 mm) in CECT scan images were selected. The tumor size was identified as the mean greatest dimension recorded with the participating radiologist in this study. The tumor density was measured in non-enhanced CT scan images (in cases with tumoral necrosis, tumor density was measured in solid enhancing part of tumor by comparing non-enhanced and CECT scan images to find the suitable place without necrosis).
CT examinations
CT examinations were performed with a dual-slice multidetector row helical CT scanner (HiSpeed NX/i; GE Medical Systems, USA). The multiphasic CT scan protocol was as follows: First, unenhanced CT scan (from dome of diaphragm to pelvic floor) was obtained. Some patients received 1000 mL of oral contrast material (2% solution of Gastrografin in water) within 60 min until obtaining contrast CT examination (200 mL every 10 min). Then, intravenous contrast media (iopromide (Ultravist 300); Schering, Berlin, Germany) was administered via antecubital vein with a power injector at a dose of 1–2 mL/kg of body weight at a rate of 2–3 mL/s to a maximum of 120 mL. Then, corticomedullary phase was obtained with 30 s delay after contrast injection. Early nephrographic phase scanning was started about 70–75 s after start of injection. The scan delay for excretory phase scanning was started about 3 min after start of injection. The scanning parameters are as follows: pitch = 1.5, slice thickness = 5 mm, tube voltage = 120 kV, and tube current = 95–120 mA.
Statistical analysis
Statistical analysis was performed using SPSS 18 software. Results were expressed as mean ± standard error of the mean (SEM) and minimum and maximum values. We used Fisher’s exact test and independent t test to analyze the difference between two groups (fat-poor AML and RCC). Also, we used Spearman correlation coefficient to analyze the relation between variables in the study. p < 0.05 was considered statistically significant.
Results
This retrospective study was conducted involving 296 adult patients, and all patients had a definitive pathological diagnosis of either renal AML or RCC. Because we are in referral academic hospital, many cases with vague diagnosis refer to this hospital, so the ratio of fat-poor AML to RCC cases in this study is high compared with other study.
There were 76 pathologically proven renal AML. Then by looking at the images, 16 patients were excluded due to hemorrhage and 20 patients were excluded due to macroscopic fat component. So a total of 40 patients with fat-poor AML were selected, 28 patients were excluded due to lack of a prominent peritumoral or intratumoral vessels, and 12 patients (prevalence 30%) with fat-poor AML were included in the study. For the RCC group, we initially identified 220 consecutive patients with pathology-proven RCC at surgical excision. In total, 33 patients were excluded due to tumor thrombosis (in these cases collateral vessels engender around kidney and lead to misinterpretation whether this vessel is engendering because of tumor or thrombosis) and 22 were excluded as patient did not have both non-contrast and CECT scans (or only have MRI, only non-enhanced CT, and/or only CECT scan). So a total of 165 patients with RCC were selected, 129 patients were excluded due to lack of a prominent peritumoral or intratumoral vessel, and 36 (prevalence 21.8%) patients with RCC were included in the study (Figure 1).
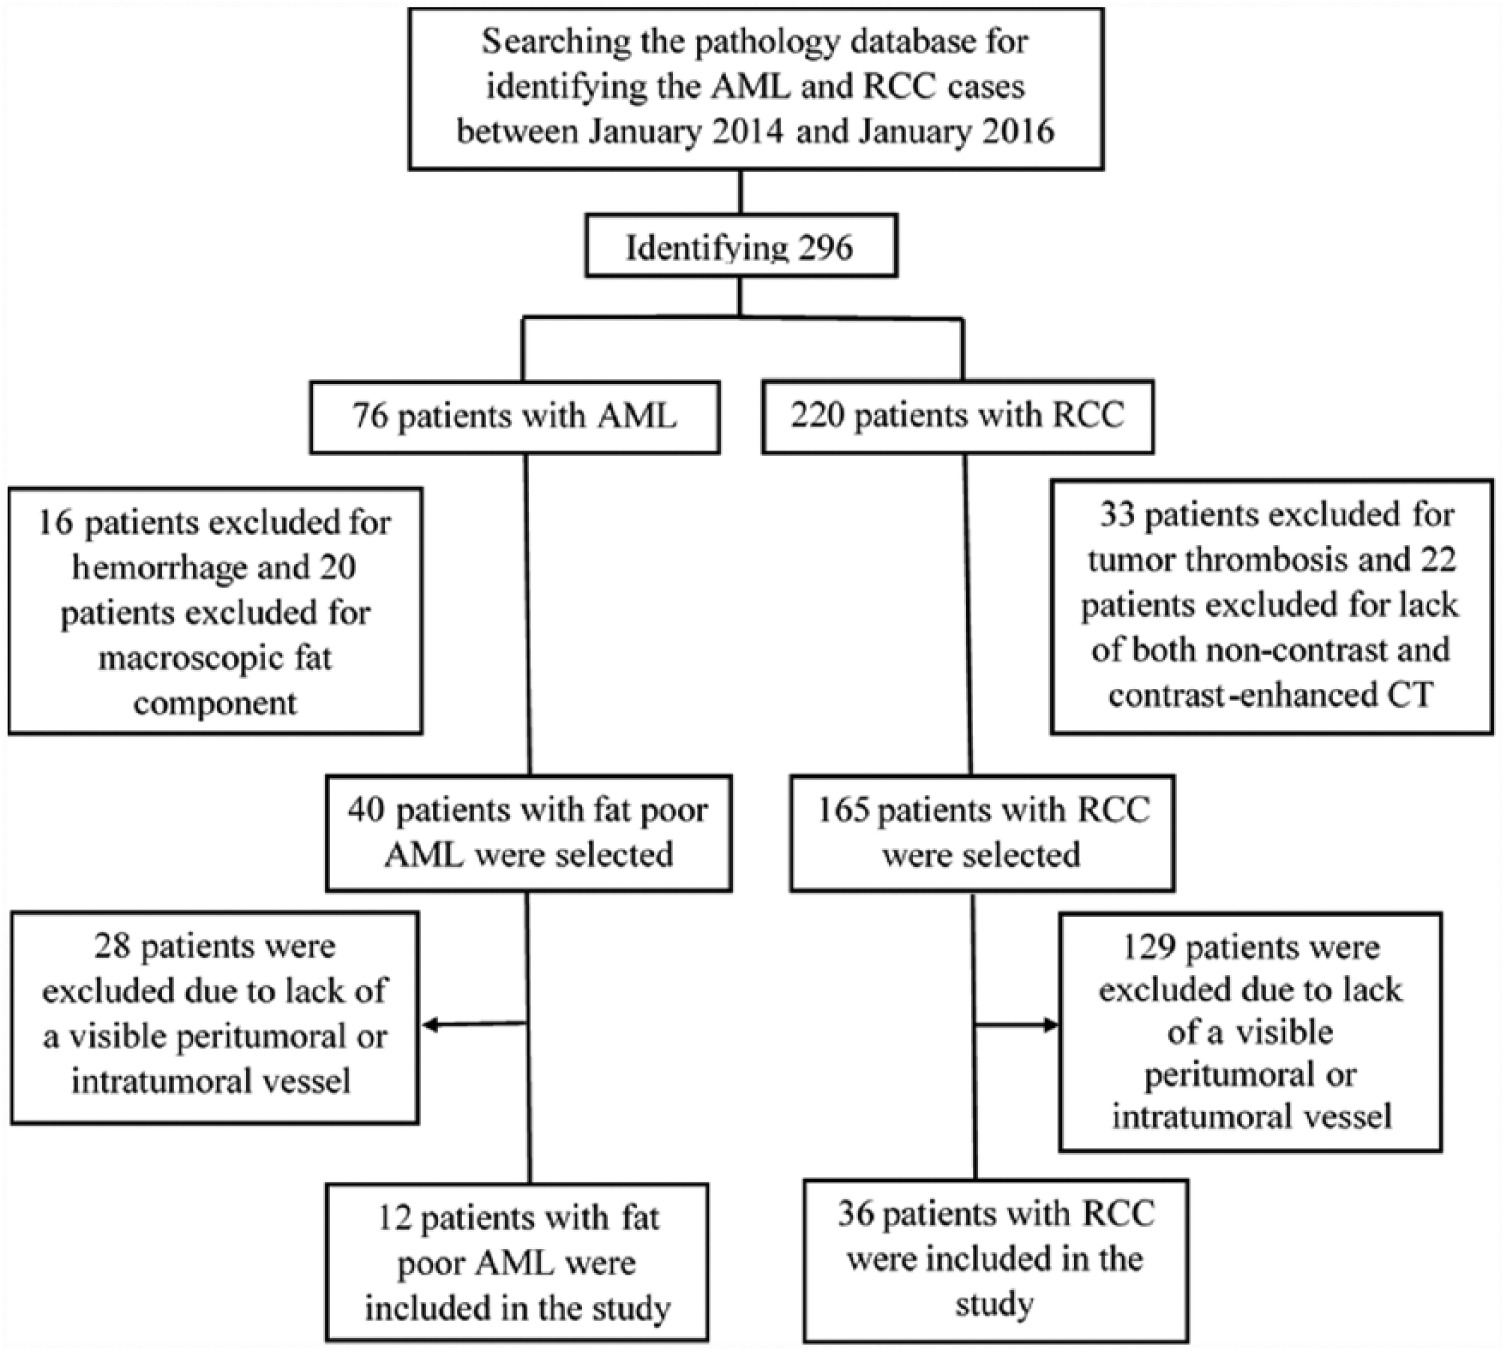
Study workflow diagram with respect to patient selection.
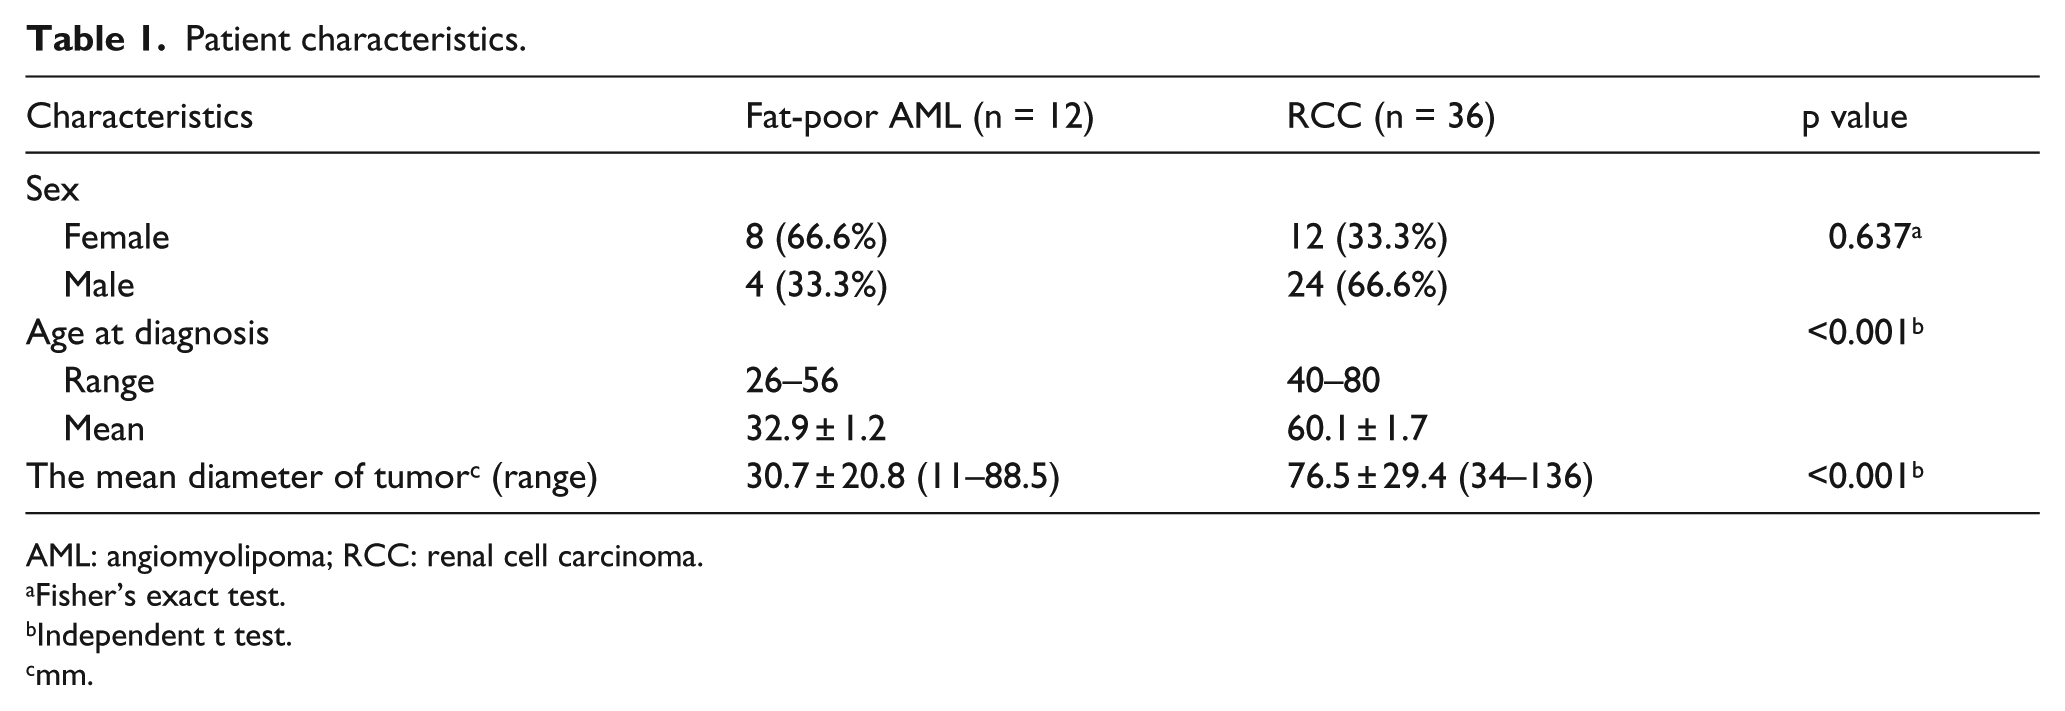
Patient characteristics are illustrated in Table 1. In total, 12 patients were with fat-poor AML, the mean age was 32.9 ± 1.2 years (range = 26–56 years) and comprised 33.33% (4/12) males and 66.66% (8/12) females; 36 patients were with RCC, the mean age was 60.1 ± 1.7 years (range = 40–80 years) and comprised 66.66% (24/36) males and 33.33% (12/36) females. Although the incidence of these tumors (fat-poor AML and RCC) is different in male and female, it was not statistically different in our study (p = 0.637), but the difference in age was significant between fat-poor AML and RCC (p < 0.001). The mean diameter of RCC (76.5 ± 29.4) is longer than fat-poor AML (30.7 ± 20.8) which is statistically significant (p < 0.001).
Patient characteristics.
AML: angiomyolipoma; RCC: renal cell carcinoma.
Fisher’s exact test.
Independent t test.
mm.
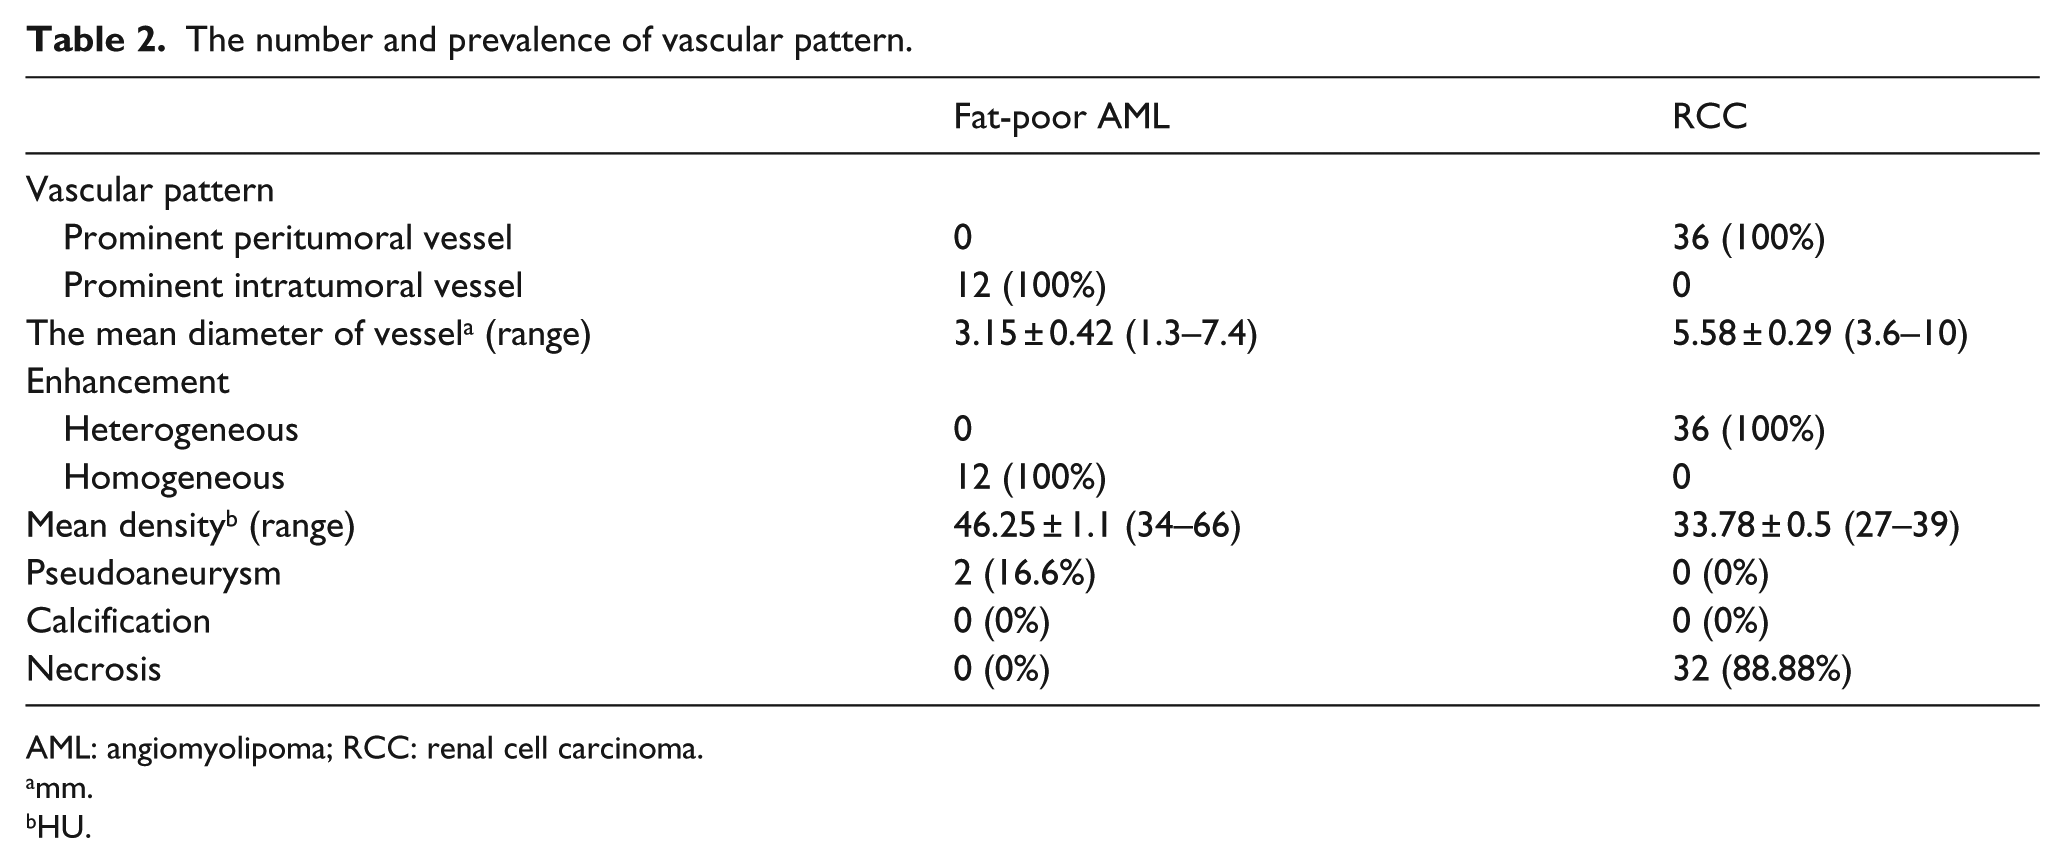
The number and prevalence of vascular pattern are illustrated in Table 2. In 40 patients with fat-poor AML, 12 cases (prevalence is 30%) were found to have prominent intratumoral vessels (Figure 2(a)) and four patients with prominent intratumoral vessels had TS (prevalence is 33.3%; Figure 2(b)). The mean diameter of intratumoral vessels was 3.15 ± 0.42 mm. The mean diameter of prominent intratumoral vessels in AML did not differ between two groups (patient with and without TS). All of the fat-poor AML had homogeneous enhancement and the mean density was 46.25 ± 1.1 HU. No significant correlation was detected between the diameter of intratumoral vessels and the diameter of tumor (p = 0.140). Moreover, no significant correlation was detected between the density and the diameter of tumor (p = 0.881). None of the fat-poor AML with prominent intratumoral vessels had tumor necrosis or calcification. Also, two patients with fat-poor AML had intratumoral pseudoaneurysm (Figure 3).
The number and prevalence of vascular pattern.
AML: angiomyolipoma; RCC: renal cell carcinoma.
mm.
HU.
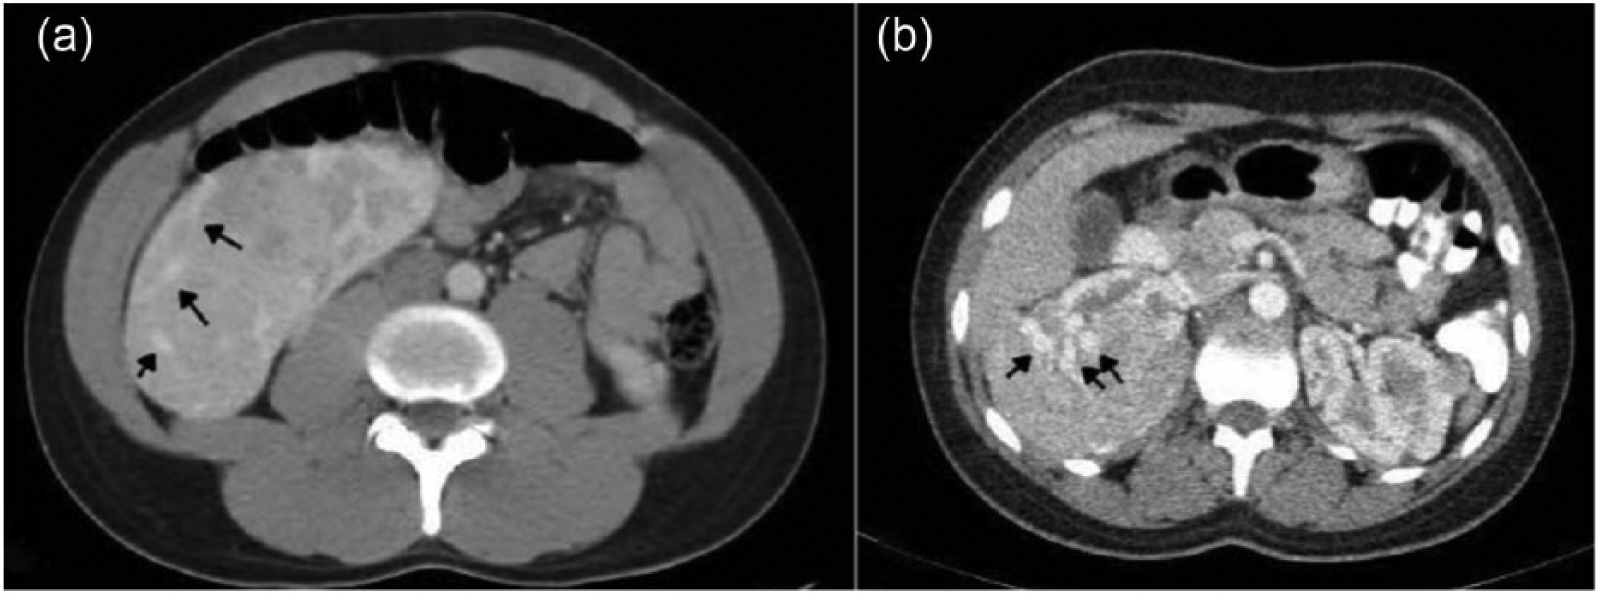
Fat-poor angiomyolipoma and axial contrast-enhanced CT in corticomedullary phase. (a) A 29-year-old man with well-defined large renal mass without obvious fat component in right kidney which contain prominent intratumoral vessels (black arrows). (b) A 26-year-old woman with tuberous sclerosis and well-defined nearly homogeneous large renal mass in right kidney which contain prominent intratumoral vessels (black arrows).

Large fat-poor angiomyolipoma with intratumoral pseudoaneurysm in a 45-year-old woman. Axial contrast-enhanced CT in corticomedullary phase shows a large homogeneous enhancing renal mass without obvious fat component or area of necrosis in right kidney which display well-defined intratumoral intense enhancing focus that represent intratumoral pseudoaneurysm (black arrow). Mild peripheral inflammatory changes are depicted.
In 36 patients with RCC, 36 cases (prevalence is 100%) were found to have peritumoral vessels (Figures 4 and 5) and the mean diameter of peritumoral vessels was 5.58 ± 0.29 mm. All of the RCC had heterogeneous enhancement, and the mean precontrast density (in non-enhanced CT scan) in solid portion was 33.78 ± 0.5 HU. No significant correlation was detected between the diameter of peritumoral vessels and the diameter of tumor (p = 0.959). Moreover, no significant correlation was detected between the density and the diameter of tumor (p = 0.881). None of the RCC had intratumoral pseudoaneurysm or calcification. Also, 32 patients with RCC had tumor necrosis, so it seems that these vessels are not associated with tumor necrosis. Approximately, these vessels are seen in 21.8% of total RCC (total number of RCC 165)
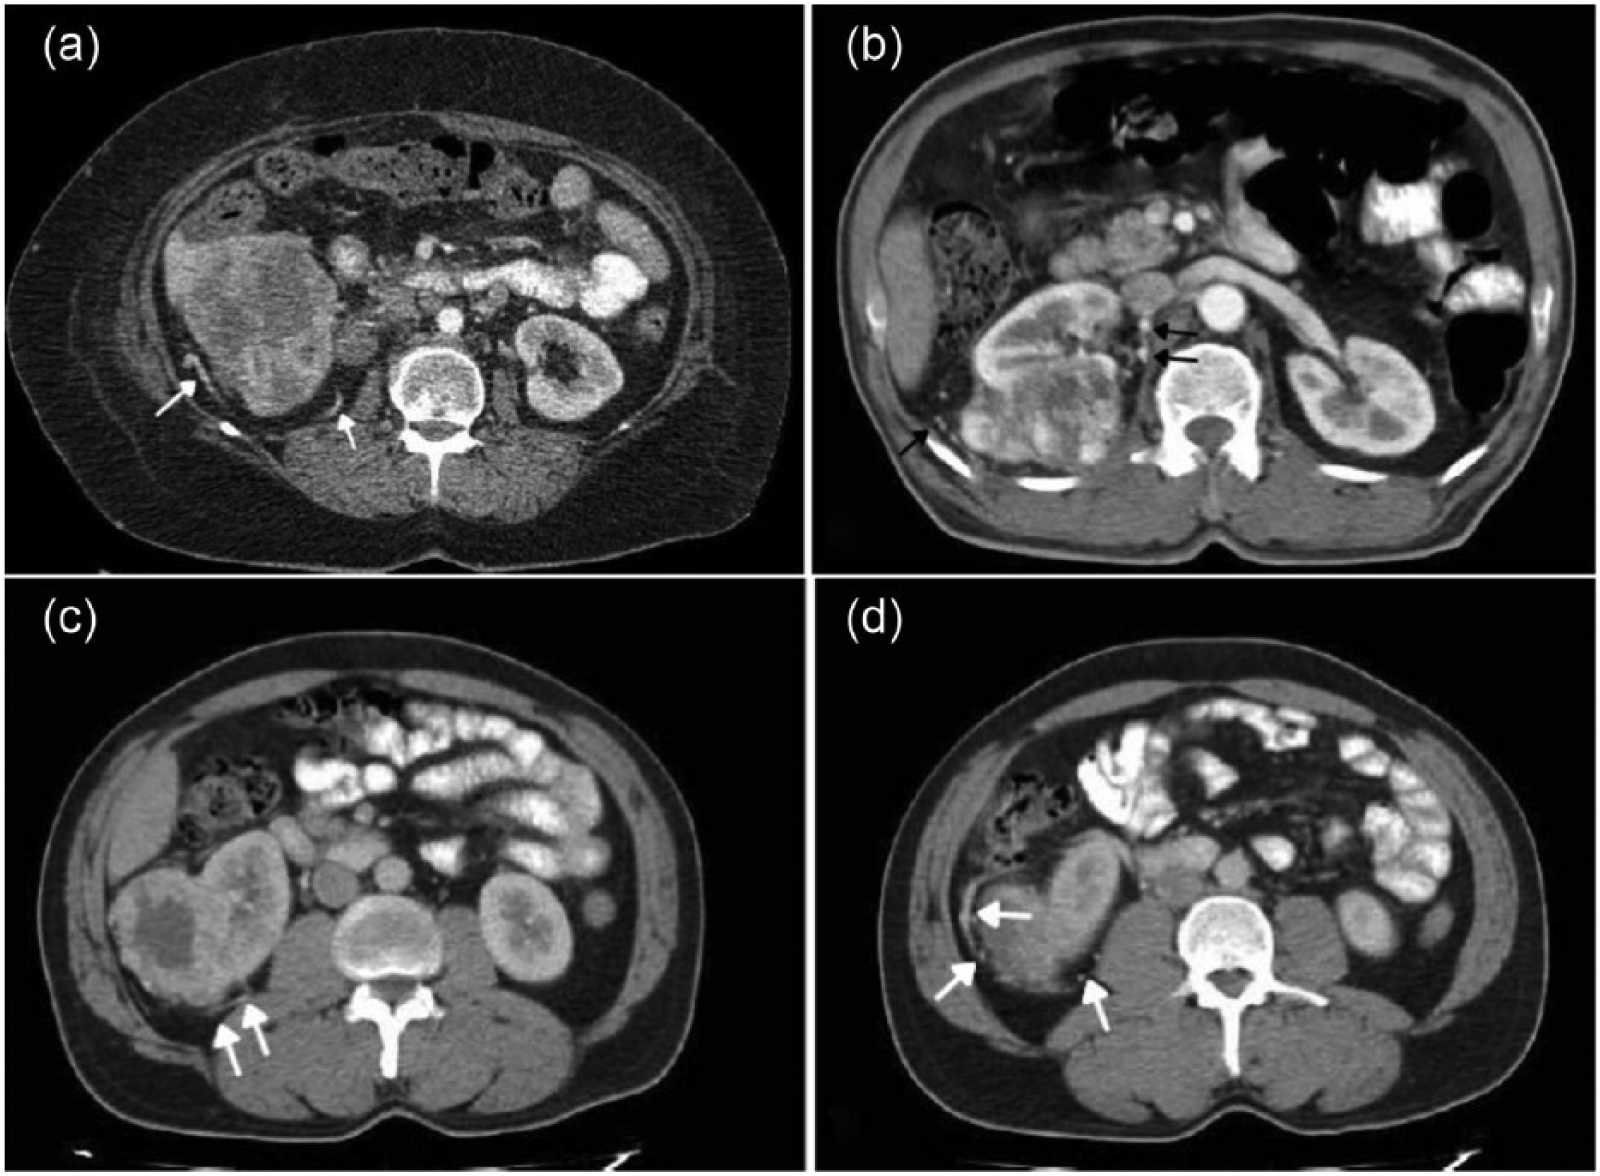
Renal cell carcinoma and axial contrast-enhanced CT in nephrographic phase. (a) A 54-year-old man with large renal mass in right kidney contains prominent peritumoral vessels (white arrows); this mass shows heterogeneous enhancement due to areas of necrosis. (b) A 65-year-old man with large heterogeneous exophytic renal mass in middle pole of right kidney shows prominent peritumoral vessels (black arrows); also, this mass shows heterogeneous enhancement due to areas of necrosis. (c and d) A 58-year-old female with exophytic renal mass with central necrosis in lower pole of right kidney with prominent peritumoral vessels (white arrows).

Two small renal cell carcinoma with prominent peritumoral vessels. Axial contrast-enhanced CT scan in corticomedullary phase shows two small enhancing renal mass in lower pole of left kidney containing prominent peritumoral vessels (white arrows). (a and b) A 54-year-old woman with 34 mm tumor shows central necrosis (black arrow). (c and d) A 64-year-old man with 20 mm tumor without evidence of necrosis.
The pathological sections of the renal tumors are shown in Figure 6.
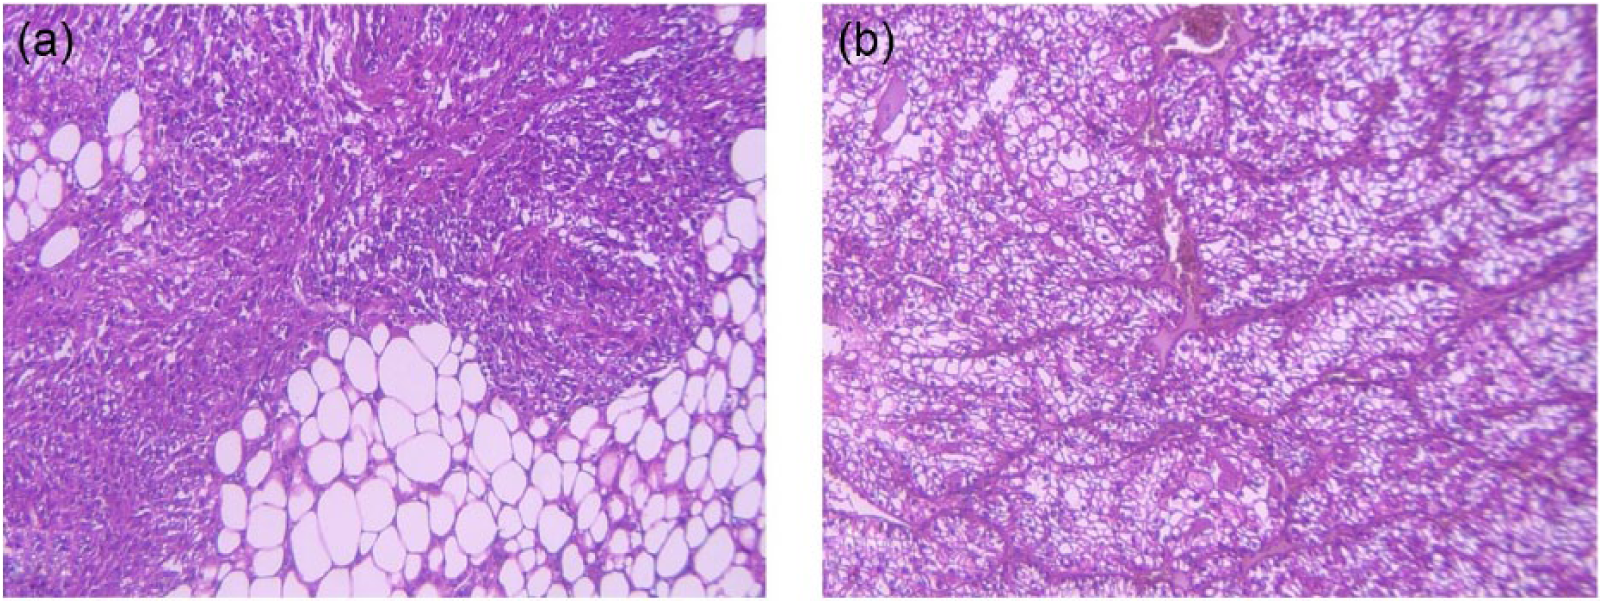
Pathological figures of angiomyolipoma and clear cell renal cell carcinoma (H&E, 400 X). (a) Angiomyolipoma: The picture shows spindle cells, thick walled vessels, and adipose tissue. (b) Clear cell renal cell carcinoma: The photo reveals tubules, nests of neoplastic cells with clear cytoplasms, and some vessels.
Discussion
Our results suggest that vascular pattern evaluation can be used to differentiate fat-poor AML from RCC with CT with contrast. RCC was characterized by peritumoral vessels whereas AML have intratumoral vascular pattern in CECT scan.
There have been studies about differentiating fat-poor AML from RCC. Li et al., use monoexponential, biexponential, and stretched exponential diffusion-weighted imaging to differentiate clear cell RCC (ccRCC) from fat-poor AML. They found that the information from water molecular diffusion heterogeneity index and true apparent diffusion coefficient improved differentiation with better sensitivity and specificity between fat-poor AML and ccRCC. 16 In another study, Park et al., use MRI variables such as tumor-to-renal cortex signal intensity ratio on T2-weighted images and apparent diffusion coefficient to differentiate fat-poor AML from ccRCC. They suggested that in small renal tumors with predominantly low tumor-to-renal cortex signal intensity ratio on T2-weighted images, apparent diffusion coefficient is useful for differentiating fat-poor AML from ccRCC. 17 Xie et al., investigated the wash-in and washout characteristics of fat-poor AML and ccRCC on CECT. They found that ccRCC have larger wash-in and washout of contrast enhancement. 18 Sung et al., found that the analysis of morphological and enhancement features on CT were significantly different between fat-poor AML and RCC. They suggested that renal masses with an amorphous, irregular outline without an enhancing rim, and prolonged enhancement were suggestive of fat-poor AML. 15
Recent investigations have indicated that the vascular structure and pattern may have an important role in the differential diagnosis of different tumor. Chiang et al., use the tumor vascular pattern for differential diagnosis of leiomyoma and adenomyosis. They found that adenomyosis has intratumoral vessels and leiomyoma has outer feeding vessels. They also suggested that tumor vascular pattern had a higher accuracy than morphology for differential diagnosis of these two tumors. 19 In another study, Miyakawa et al., investigated the vascular pattern between follicular adenoma and follicular carcinoma as benign and malignant thyroid tumor, respectively. They found that the evaluation of the vascular pattern may provide important information that is useful in making correct differential diagnosis of malignant or benign thyroid follicular tumor. 20
We attempted to evaluate the vascular pattern with CECT to aid differentiation between AML and RCC. We attempted to classify the vascular pattern into two patterns: prominent intratumoral vessels and prominent peritumoral vessels in CECT scan (prominent vessels are visible vessels larger than 2 mm). According to our results, a prominent intratumoral vessel pattern was a valuable CT finding that helped the authors to differentiate fat-poor AML from RCC, and the authors extrapolated these findings to fat-poor AML. Overall, 30% of patients with fat-poor AML had an intratumoral vessel, whereas no evidences exist that these tumors had prominent peritumoral vessel. Moreover, 21.8% of patients with RCC had a prominent peritumoral vessel, whereas no evidences exist that these tumors had prominent intratumoral vessel. Our study showed that the vascular pattern is an important finding in differentiating fat-poor AML from RCC. Interestingly, the same finding happens about hepatic AML. Zheng and Kudo 21 showed that hepatic AML has intratumoral vein which can aid in differentiating hepatic AML from hepatocellular carcinoma. However, ccRCC are hypervascular type of tumor, and in this kind of tumor due to rapid growth, vascular impairment and necrosis occur in the tumor. In our study, 88.88% patients with RCC had intratumoral necrosis which may due to the hypervascularity characteristics of these tumors. However, the results of our study showed that 12% of RCC had not necrosis. So there is the possibility that vascular pattern did not correlate to necrosis and have independent nature. Although the mean size of RCC in this study is large (mean size = 76.5 ± 29.4 mm), we saw peritumoral vascular pattern in four tumors with size in range 34–41 mm which were considered as small renal mass (Figure 5). However, the mean size of fat-poor AML in this study is small (mean size = 30.7 ± 20.8 mm), we also saw intratumoral vascular pattern in three tumors with size in range 75–88 mm which were considered as large renal mass. So, it seems that there was no correlation between the size of tumor and the vascular pattern in both RCC and fat-poor AML. Moreover, it is well-established that RCC had tumoral thrombosis in renal vein. Kim and sim 22 describe imaging finding of renal vein tumoral thrombosis which consists of filling defect in renal vein, enlargement of renal vein, and development of collateral vessels. Furthermore, recently, various studies using CT have been reported on pattern of differential diagnosis in cancer and other cases.23–29 So we excluded the cases with tumoral thrombosis to excise this effect. Accordingly, using the vascular pattern within or around tumors improved differentiating accuracy of RCC from fat-poor AML than using morphologic criteria alone.
Conclusion
In conclusion, our data show that vascular pattern evaluation may provide additional information and could lead to improved differentiation between fat-poor AML and RCC at CECT scan. We suggest that combining vascular pattern with morphologic finding increases the accuracy of RCC prediction from fat-poor AML. We did not see a tumor with both prominent peritumoral and intratumoral vessels, so further studies consisting of more patients are needed to extrapolate this finding accurately.
Footnotes
Declaration of conflicting interests
The author(s) declared no potential conflicts of interest with respect to the research, authorship, and/or publication of this article.
Ethical approval
All procedures performed in studies involving human participants were in accordance with the ethical standards of the institutional and/or national research committee and with the 1964 Helsinki declaration and its later amendments or comparable ethical standards.
Funding
The author(s) received no financial support for the research, authorship, and/or publication of this article.
Informed consent
Informed consent was obtained from all individual participants included in the study.