
Abstract
Cancer incidence and/or mortality among individuals varies with diet, socio-culture, ethnicity, race, gender, and age. Similarly, environmental temperature modulates many biological functions. To study the effect of environment temperature on cancer incidence, the US population was selected. Because, county-wise cancer incidence rate data of various anatomical site–specific cancers and different races/ethnicities for both males and females are available. Moreover, the differences amongst the aforementioned factors among individuals are much less, as compared to the world population. Statistical analysis showed a negative correlation between the average annual temperature and cancer incidence rate at all anatomical sites and individually for 13 types (out of 16 types) of anatomical site–specific cancer incidence rates (e.g. uterine, bladder, thyroid, breast, esophagus, ovary, melanoma, non-Hodgkin lymphoma, leukemia, brain, pancreas, etc.) for females. Further analysis found a similar inverse trend in all races/ethnicities of the female population but not in all male races/ethnicities or anatomical site–specific cancers. Moreover, the majority of the counties having the top-most cancer incidence rate in females are located above the latitude 36.5°N. These findings indicate that living in a cold county in the United States might have a higher risk of cancer irrespective of cancer type (except cervical and liver) and races/ethnicities for females but not in all such cases for the male population.
Introduction
Despite considerable progress in the advancement of cancer treatment, cancer is still the second leading cause of morbidity and mortality in patients worldwide. Epidemiological studies have identified several environmental factors (extrinsic), including smoking, unhealthy lifestyle, industrialization/air pollution, toxin exposure, and so on, as risk factors for cancer development.1,2 However, aging, hormonal abnormality, obesity, diabetes, and high cholesterol are some intrinsic factors that enhance tumorigenesis as well.3–9 Oxidative and metabolic stresses are shown to enhance tumor occurrence and progression.10–13 For example, metabolism can trigger tumorigenesis through reactive oxygen species (ROS) generation. 14 Many studies have demonstrated the influence of the tumor microenvironment in promoting tumorigenesis.15–17 These cancer-causing factors may increase tumorigenesis either by directly influencing the cancer cells or the tissue microenvironment.18–21
Accumulating evidence demonstrates that the aforementioned factors and stresses may modulate the programming of the epigenome. 22 In addition, it has been reported that epigenetic dysregulation is a key player in tumorigenesis. 23 Thus, “epigenetic changes” have been recognized as a new hallmark of cancer, which results in reduced apoptosis, increased invasion, sustained angiogenesis, promotion of self-growth, insensitivity to anti-growth signals, and limitless replicative potential.24,25 In fact, various environmental factors appear to be involved in the development of many cancers through altering epigenetic regulation. 26
The body becomes stressed upon exposure to a cold environment. Prolonged cold stress (temperature change) may directly or indirectly modify the epigenetic program which might impact cellular health. 22 One study experimentally compared the cancer progression and metastasis in mice at 22°C and 30°C and found that these mice developed cancer more rapidly at 22°C than 30°C. 27 High temperature has been shown to enhance the chemosensitivity of cancerous cells.28,29 Another study has shown that cold-inducible RNA-binding protein enhances tumorigenesis by increasing ROS accumulation. 30 We have recently shown that an inverse relationship between cancer mortality rate and environmental temperature exists in the world population. 31 However, there have been a few reports that either support or negate these recent findings.32–34 These contradicting findings may be a result of the influence of disparities in many demographic factors such as lifestyle, socio-culture, diet, education, smoking and alcohol consumption along with age, gender, race/ethnicity, and genetic variability.
To find out the reasons of these contradicting findings and to authenticate the inverse relationship between cancer incidence rate (CIR) and environmental temperature, we selected the US county-wise CIR data in this study because (1) the disparities of these above-mentioned demographic factors among individuals are less in the US population as compared to the rest of the world population, 35 (2) county-wise CIR, for different genders, different anatomical site–specific cancers, and various races/ethnicities are available in the United States cancer registries, and (3) there is a long range of average annual temperature (AAT; –10.29°C to 24.22°C) among counties. In fact, the US cancer registries provide the data of county-wise CIR for 16 types of anatomical site–specific cancers and 7 kinds of various races/ethnicities along with different genders. Thus, we thought the extended analysis of CIR data might provide strong support to the relationship between cancer incidence and temperature and to the susceptibility of cancers of different anatomical sites, races, ethnicities, and genders to cold exposure.
This study suggests that cold exposure results in higher risk of cancer for cancers overall along with the majority of the anatomical site–specific cancers in the US female population. Further analyses demonstrated that low temperature provide the greatest risk factor in all female races/ethnicities. Unlike females, the consistency of this negative relationship between these two parameters for various races/ethnicities and for different anatomical site–specific cancers is quite different in the male population. However, both males and females may have a higher risk of thyroid, bladder, esophageal, brain, and non-Hodgkin lymphoma (NHL) cancers if they live in a cold temperature county of the United States. Here, we propose that females living above the 36.5°N latitude show greater risk of cancer incidence in general. In brief, this study, for first time, suggests that females are susceptible to developing cancers if they live in colder temperature.
Materials and Methods
Data collection
Age-standardized CIR with 95% confidence interval for males and females, different races/ethnicities, and at various anatomical sites was taken from http://statecancerprofiles.cancer.gov/, from the date period 2009 to 2013. The cancer incidence data are provided by the National program of cancer registries. AAT of a county was taken from USA.com/state name/county name/weather. Latitude and longitude coordinates were collected from a Google search of the county name, state name, and latitude. This study included cancer incidence data for all 16 and 13 types of anatomical site–specific cancers for females and males, respectively, and all 7 types of races/ethnicities for both females and males.
Statistical analysis
The parametric Pearson and the non-parametric Kendall and Spearman methods of univariate analysis were used to test the null hypothesis between two independent variables. 31 First, we used the parametric Pearson method, but it was assumed that the distribution of the variables is to be normal. However, it is not necessary that the distribution of the variables is always normal. Hence, we also used non-parametric Spearman’s and Kendall’s method for further analysis. However, Kendall’s method performs better if there are discrepancies in the data as it is insensitive to errors. Therefore, the univariate analysis has been done using all these methods. Kendall’s method provides the coefficient of correlation, denoted by “Tau.” Spearman’s and Pearson’s correlation coefficients are denoted by “rs” and “r,” respectively. Both negative and positive correlation may exist, which is denoted by negative and positive coefficients. p values indicate whether the difference between two comparisons is statistically significant. Significant differences were considered at p < 0.05*. In this statistical analysis, we included all the data available in the cancer registries, and we did not make any selection bias for the data use or any adjustment for missing data.
Linear models
In this article, to study the relationship between AAT and CIR, simple linear models have been used as described previously. 36 Estimates and the plots for the fitted models have been obtained using the R studio software, an open statistical software, with a special package ggplot2 used for plotting. From the base package of R studio, using a built-in command lm(Y~X) $ coefficients on the given variables, the estimated tables have been obtained. The presence of outliers in the data was observed in the box plots. To remove these outlier observations, a method of standardized residuals was used. Estimates were obtained for the modified linear model. Normal probability plots have also been obtained to check the fitness of the models.
Geographical distribution
A line at 36.5°N was drawn to define the cancer-prone boundary within the United States from that region with a reduced cancer risk. Based on the criterion of analysis for US county CIR, the spatial variability of CIR is shown in maps using geographical information software (ArcGIS 10.1; version 10.1 and authorization number: EFL691568009-1010). For all cases, point shapefiles were prepared with their location (latitude and longitude) in a secondary database. The lower and upper quartile CIR-50 and CIR-200 maps were prepared to visualize the pattern of cancer incidence, based on county number. These spatial distributions were analyzed with reference to the 36.5°N latitude line. The maps were prepared by using base map of US counties (UCLA Geoportal, US_counties_generalized, open and public domain, and source: http://gis.ucla.edu/geodata/sq/about), data of different counties (such as top 50 counties with highest CIR-AAS (all anatomical sites) and least 50 counties with lowest CIR-AAS). There are also three lines with latitudes of 45°N, 36.5°N, and 30°N showing the different regions in US map.
Results
CIR negatively correlates with AAT of US counties in the female population
To test the relationship between AAT and CIR, we conducted a univariate analysis of a paired data set from US counties (Supplementary Table S1). Pearson’s univariate analysis indicated a negative correlation with statistical significance between AAT and CIR-AAS for the female population but no negative relationship in the male population (Table 1). Both these non-parametric Spearman’s and Kendall’s univariate procedures demonstrated a similar trend for females and males (Table 1). Overall, these findings indicated that environmental temperature appears to influence CIR-AAS risk in the female population.
Univariate analysis between AAT and CIR-AAS.

AAT: average annual temperature; CIR: cancer incidence rate; AAS: all anatomical sites (overall).
“r,”, “rs,” and “Tau” are Pearson’s, Spearman’s, and Kendall’s correlation coefficient, respectively.
Correlation coefficients were determined at every 2°C between 25°C and −11°C comparing AAT with CIR-AAS correlation coefficients for females (Supplementary Table S2). These data demonstrated a negative correlation with statistical differences at 15°C and lower. These results suggested that a negative correlation between these two parameters might be found when the AAT difference among different counties is large.
Inverse correlation between AAT and CIR for site-specific cancers for females
To prove the concept of an inverse relationship for female population, a univariate analysis between AAT and CIR was performed for all 16 types (included all types of site-specific cancers available in the cancer registries) of anatomical site–specific cancers. All three statistical approaches demonstrated a negative correlation (with statistical significance) for uterine, bladder, thyroid, esophagus, melanoma, NHL, leukemia, ovary, brain, breast, and pancreatic cancers in females with AAT (Table 2). However, a very weak negative correlation (without statistical significance) was observed in cases of colon and oral cancer but no relationship in lung cancer, while there was a positive correlation with statistical significance for cervical and liver cancer in females (Table 2). Thus, the majority (13 out of 16 types) of these anatomical site–specific cancers showed an inverse association between AAT and CIR for female population.
Univariate analysis between AAT and CIR of anatomical site–specific cancer types.

AAT: average annual temperature; CIR: cancer incidence rate; NHL: non-Hodgkin lymphoma.
“r,” “rs,” and “Tau” are Pearson’s, Spearman’s, and Kendall’s correlation coefficient, respectively.
Kendall analysis shows error in p values for some cases. Spearman along with Pearson methods were used to test these relationships.
Similarly, we observed a negative correlation (with statistical significance) between AAT and CIR for bladder, thyroid, esophagus, NHL, brain, melanoma, and prostate cancers in the male population. There was a positive association (with statistical significance) for liver, lung, leukemia, oral, and colon cancers but a weak negative relationship without statistical difference in pancreatic cancers in males (Table 2). Unlike females, males did not show much consistency in relationship (8 out of 13 types) between AAT and CIR for various anatomical site–specific cancers. In all the cases of inverse relationships, the female data had a stronger correlation than the male data except thyroid cancers (here, both males and females showed same correlation coefficient). Thus, all these findings together suggested that cold environment has a larger influence on females for developing cancers.
Negative relationship exists between AAT and CIR irrespective of races/ethnicities for females
We wanted to know whether the effect of cold environment on CIR varies among different races/ethnicities of the US population, apart from gender and anatomical site–specific cancers. Cancer incidence data available for several races/ethnicities including White, White Hispanic and non-Hispanic, Black, American Indian/Alaska (AI/AK) Natives, and Asian Pacific Islanders (AP Islander) in the cancer registries were included in the univariate analysis (The reader is reminded that the website used to report the data breaks down the data using two parameters: race (e.g. White) and ethnicity (e.g. Hispanic)). Females demonstrated a negative correlation between AAT and CIR in all these categories. However, only White Hispanic females showed a negative correlation without statistical significance (Table 3 and Supplementary Table S3).
Race/ethnicity univariate analysis between AAT and CIR.

AAT: average annual temperature; CIR: cancer incidence rate; AI: American Indian; AK: Alaska; AP: Asian Pacific; AR: any race; H: Hispanic; NH: non-Hispanic.
“r,” “rs,” and “Tau” are Pearson’s, Spearman’s, and Kendall’s correlation coefficient, respectively.
Kendall analysis shows error in p values for some cases. Spearman along with Pearson methods were used to test this relationship.
Males demonstrated a disparity in cancer incidence with AAT. An inverse relationship with statistical difference was observed in AI/AK Natives, AP Islanders, and Hispanic but no relationship in Black and White males. However, a positive correlation with statistical significance was exhibited in White non-Hispanic males, unlike females (Table 3). These data suggested that females appear to have a greater risk of cancer incidence irrespective of races/ethnicities as compared to males when in colder environments.
Linear model fitting to study the relationship between AAT and CIR
In order to strengthen our work, here in this section, we fit a simple linear model by taking CIR as a response and AAT as a regressor. Using these fitted models, we tried to establish the relationship between CIR and AAT and predict the response variable for the given values of regressor variable for males and females for AAS, different anatomical sites, and different races/ethnicities. To explore the behavior of CIR for the male and female population, initially box plots were made (Supplementary Figures S1 and S2). It was observed that there are some data points present in the plots, which correspond to the observations, which are behaving abnormally when compared to the rest, and, hence, these are considered as outliers. Since the relative data in case of races/ethnicities varied from 84 to 2910 counties, the box plots cannot be drawn adequately. The simple linear model for the variables defined above can be given as

where b0 and b1 are the intercept and slope (for change in CIR with a unit change in AAT), respectively. The box plots obtained indicated the presence of many outlier values in the data set. In order to remove these outliers, one can proceed in the following way.
The fitted values for CIR, CIR (estimated), can be obtained as follows

The deviation of CIR from CIR (estimated) is known as “residual” that is

In contrast to these residuals, scaled residuals are preferred as they show more deviation of the fitted value from the observed one, and such, one type of scaled residual, which has been used here, is the standardized residual, defined as

These residuals have a mean of zero and approximate unit variance that makes it possible to look for outliers as these outliers when present in the data gives poor approximation to the true response. The standardized residuals should lie in between −3 and 3, and any observation with a standardized residual outside this interval is a potential outlier.
Now, after removing these potential outliers, a modified data set for CIR was obtained; hence, the modified model can be given as

Now, the modified residual can be given as

Hence, the modified standard residual as

Based on the modified model, estimated values of parameters were determined (Supplementary Table S4). The relationship between CIR and AAT for female and male population is shown in Figure 1 and Supplementary Figure S3, respectively. The linear model fit data also showed similar results to the data generated by the univariate analysis (Table 1). Moreover, the linear regression fit (Figure 1) further indicated a strong negative relationship between CIR-AAS and AAT for the female population.
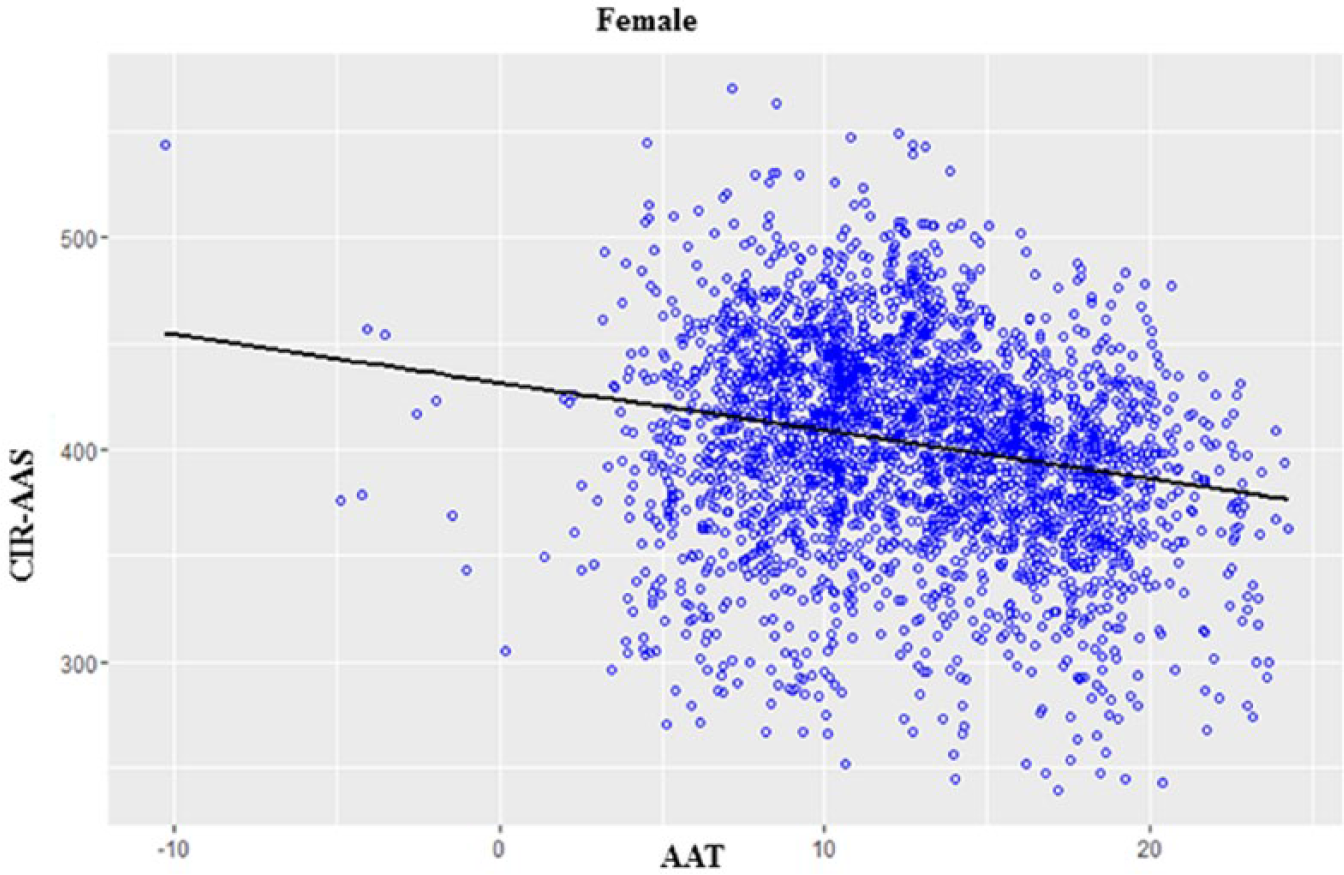
Linear regression fit for the female population.
Up to this stage, the estimates have been obtained for the modified linear model and linear regression fit. To check whether the model fits the data well or not, it is required to check whether the residuals fulfill the normality assumption or not, that is, whether they are normally distributed or not. The normal probability plot was used to check normality, which is a graphical technique to identify considerable departures from normality. The normal probability plots for all the categories are shown in the Supplementary Figures S4–S7.
These plots indicated that the standardized residuals for liver cancers in all the three populations show deviation from the normal behavior at the tail region because less than 30% of the data were available in this case. In the case of different races/ethnicities, data again is very low and the deviation is again at the tail region, which is normal. Therefore, findings of all these analyses suggested that the modified model fits the data well.
Cancer incidence increases in females above latitude 36.5°N
Data analyzed was directed at determining where in the United States the cancer incidence was greatest. The geographical location of the top 50 counties having the highest CIR-AAS (females) was marked on the US map (Figure 2). The majority of these top 50 counties are located above the latitude range of 36°N–37°N. Thus, we decided to define a latitude above this latitude in which the CIR is more, as compared to the latitude below it (Supplementary Table S5). It was observed that 45 of the top 50 counties with the highest CIR-AAS were located above the latitude range of 35.75°N–36.5°N (Supplementary Table S5 and Figure 2). Here, we should mention that in this study, out of a total of 2877 counties, 1759–1896 are located above and 981–1114 counties are located below the latitude of 35.75°N–36.5°N. This may lead to the question about whether this analysis is picking up a trend that is based on most counties being above this latitude line. Thus, the data have been adjusted (Supplementary Table S5 and Table 4) to include equal proportions of counties above or below this latitude. Adjusted data showed that the counties located above 36.5°N have highest CIR-AAS as compared to other latitudes. These observations lead us to question as to whether this trend exists in cases of the top 25, 100, 150, 200, and 500 counties having the highest CIR-AAS. These analyses mostly satisfied the latitude 36.5°N, since counties located above of this latitude have highest CIR (Table 4 and Supplementary Figure S8). These data show that females living in counties located above the 36.5°N have a 4.25- to 7.3-fold increase in CIR-AAS (from top 25 to top 500 counties) as compared to the counties located below the 36.5°N. These findings indicate that females living above 36.5°N have a higher risk of cancer incidence as compared to those females living below this latitude.

Geographical distribution of the top 50 counties and the least 50 counties having the highest and lowest CIR-AAS for females. Red circles depict the distribution of the top 50 counties with the highest CIR-AAS in females. Green circles depict the distribution of 50 counties with the lowest CIR-AAS in females. The US map shows 36.5°N, 45°N, and 30°N latitudes.
Distribution of top CIR-AAS and least CIR-AAS counties based on position of latitude 36.5°N.

CIR: cancer incidence rate; AAS: all anatomical sites.
The obtained latitude value of these counties was never exactly equal to 36.50°N; they either reside above or below 36.50°N.
The data for females were also used to compare the counties with the lowest CIR-AAS above and below 36.5°N latitude (25, 50, 100, 200, and 500; Table 4, Figure 2, and Supplementary Figure S8). This analysis also demonstrates that counties located above the 36.5°N have a 0.35- to 0.55-fold increase in CIR-AAS (from top 25 to top 500) as compared to the counties located below the 36.5°N. These findings reveal that the females living below 36.5°N have a lower risk of cancer as compared to females living above this latitude.
Discussion
We have, for the first time, recently reported that there is a link between cold environment exposure and cancer mortality based on an analysis of 188 countries worldwide. 31 In that published report, there was a (known) wide range of variation among drinking habits, diet, toxin exposure, lifestyle, genetic background, race/ethnicity, social culture, medical facilities, economic condition, and life expectancy among individuals of different countries. 35 The range of AAT was from −0.5°C to 30°C, and a majority of the countries belong to a hot temperature zone. Here, US county data were chosen to evaluate the link between environmental temperature exposure and cancer incidence since disparities of these parameters above are expected to be smaller within the population of the United States and also the majority of counties belonging to a relatively colder temperature zone. Moreover, county-wise data of CIR for 16 types of anatomical site–specific cancers, 7 types of races/ethnicities, and for both males and females were available in the cancer registries. Thus, we thought that this extended study might further strengthen the concept of an inverse association existing between environmental temperature and cancer incidence.
Our analyses of the US county data showed a strong negative relationship between AAT and CIR-AAS for the female population, while a weak positive relationship was observed in males, as evidenced by three different univariate statistical methods (Table 1). These contrasting findings tempted us to question whether this relationship exists in different anatomical site–specific cancers and varies on genders.
Analyses of anatomical site–specific cancers found an inverse relationship with AAT for 13 cancer types out of 16 types in the female population, while this inverse relationship exists for 8 cancer types out of 13 types in males. These findings indicated that females might have a higher risk of cancer incidence irrespective of cancer types except for lung, liver, and cervical cancers if they are exposed to a cold environment. However, males also have a higher risk of cancer incidence for some anatomical site–specific cancers including bladder, thyroid, esophagus, NHL, and brain cancers if they live in a cold county. Moreover, these analyses demonstrated a positive association with liver and cervical cancer with AAT in both males and females. The data from the laboratory previously documented this similar and yet contrasting result in these two cancers with AAT. 31 It may be surmised that the incidence of these two cancers may decrease as a result of a lower incidence of human papilloma virus (HPV; cause of cervical cancer) and hepatitis virus (HV; cause of liver cancer) infection as these two infectious viruses are more common in relatively hot temperature zones.31,37,38 Similarly, females failed to show a negative correlation for lung cancers while males showed a positive association with AAT. It could be due to the use of tobacco since lung cancers are predominately caused by smoking and males usually do more smoking than females. 39 Similarly, smoking habit might impede the inverse relationship between oral cancer and AAT in case of males.40,41 Thus, these analyses of various subsets of cancer incidence data, suggested the existence of a stronger inverse relationship between AAT and CIR for specific cancers (anatomical site–specific) in females as compared to males (Table 2).
Similar to site-specific cancers, cancer prevalence and/or mortality also differs among different racial and ethnic groups. 42 Thus, we investigated whether this relationship between CIR and AAT differs with different races and ethnicities. The terms race and ethnicity are often interchanged and can be confusing. Race is mostly used to distinguish groups of people based on their physical characters (such as skin color), biological disposition, and ancestry whereas ethnicity is emphasized on the difference between groups of people who share a certain social background, behaviors, cultures, traditions, as well as physical characteristics. 43 We observed that the female population from all types of races/ethnicities showed an inverse relationship between AAT and CIR. Here, statistical significant differences were found in six types of races/ethnicities except White Hispanic. Similarly, males from AI/AK Natives, A/P Islanders, and Hispanic groups showed a negative correlation with statistical significance while no relationship was noticed in cases of White, Black, and White Hispanic groups. In contrast, the White non-Hispanic male population showed a strong positive correlation between AAT and CIR that is not fully understood yet. Similarly, it is not yet understood why the male population showed a strong positive correlation between AAT and leukemia while a strong negative correlation between AAT and leukemia was found in the female population.
In general, these data further supported our notion that cold environment have a higher influence on women to develop cancers (Tables 2 and 3). A linear fit model of the data also supports this similar relationship (Figure 1, Supplementary Figure S3, and Supplementary Table S4). These data suggest that females have a higher risk of cancer incidence if they live in cold environment.
To test the influence of temperature change on CIR, the average CIR was calculated at every 1°C of AAT for anatomical site–specific cancer types (Figure 3 and Supplementary Table S6) and graphed. Herein, we considered the AAT range from 7°C to 20°C. Since there was no regularity beyond these data points, it is possible that a small number of counties present in this temperature range could produce geographical artifacts. There was a similar graphical trend line (a gradual decreased pattern with respect to increment of AAT) in all types of site-specific cancers (except for liver and cervical cancers, Figure 3). An opposite trend (increased trend line with respect to increment of AAT) was observed in the case of liver and cervical cancer as compared to other cancer types; however, the trend was in a similar direction (Figure 4). However, steepness of the trend line along with R2 value (data are not shown) indicated that change of environmental temperature might have a greater influence on the cancer incidence in the order of uterus, thyroid, esophagus, melanoma, and bladder cancers and a moderate influence in the order of NHL, leukemia, ovary, and breast cancers. These data indicated that the influence of temperature change might have impact on CIR with different grade for each type of specific cancer. In the case of uterus cancer, the trend line decline was steeper as compared to other specific cancers indicating a greater influence of temperature change on uterus cancer than other types (Figure 3). Previous findings also support this negative relationship since countries having high levels of sunlight showed lower risk of endometrial cancer. 44 Literature documented that cold exposure increases interstitial hypertrophy in the uterus, 45 and moreover, cold-inducible uncoupling protein 1 (UCP-1) is also expressed in the smooth muscle cells of uterus, similar to brown adipose tissue (BAT). 46 Recent findings establish the role of UCP in tumorigenesis and cancer cachexia.47,48 This evidence indicates that cold exposure could increase uterine cancer incidence by upregulating UCP proteins.

CIRs of all anatomical sites and different anatomical site–specific cancers in females. Female average cancer incidence rate (CIR) and site-specific CIRs from US counties tabulated by 1°C average annual temperature change obtained from calculations in Supplementary Table S1. The average data were adjusted to a similar scale for all the cases (Supplementary Table S6). Trend lines were drawn for all cases.

Liver and cervical CIR of females compared to AAT. Average female cancer incidence rates (CIRs) for liver and cervical cancer from US county data for each 1°C interval was calculated from Supplementary Table S1. Average data were adjusted to a similar scale for all the cases (Supplementary Table S6). Trend lines were drawn for all cases.
Similar to uterine cancer, the trend line decline was also steeper in the case of thyroid cancer (Figure 3). Earlier findings also support the higher risk of thyroid cancer for those populations who live in a cold environment. 32 In a cold environment, our body needs high thermogenesis to maintain body temperature. Thyroid hormones play a vital role in thermogenesis. 49 Cold exposure increases the activity of the thyroid gland to produce thyroid hormones.50–52 Thus, elevated thyroid activity may lead to cancer development in the thyroid gland upon cold exposure. Our findings also demonstrate a strong negative correlation between AAT and thyroid-specific CIR data that exists in both male and female populations (Table 2).
Analysis also found a strong negative correlation between AAT and bladder cancer–specific CIR in both genders. The literature supports this concept as the bladder has a cold-response receptor that has been shown to lead to changes in cell morphology that induce bladder injury.53,54 Similar to our findings, few studies have documented that cold environment might have a higher prevalence of esophagus and leukemia cancers.55,56
The trend lines for average CIR at every 1°C and respective AAT for different race/ethnicity for the female population was studied (Supplementary Figure S9 and Supplementary Table S7). There was a similar graphical trend line in all races/ethnicities except AI/AK natives and White non-Hispanic. In these two cases, the decreased trend line was steeper when compared to other races/ethnicities. These data suggest that there is a greater influence on CIR for AI/AK natives and White non-Hispanic with respect to a colder environment. It is yet unclear why females of these two categories are more sensitive than the females of other races/ethnicities. However, it is not yet understood why the White non-Hispanic males show a strong positive correlation between AAT and CIR unlike females.
This study documented that the female population has a relatively high risk of CIR irrespective of races/ethnicities and cancer types except for lung, oral, liver, and cervical cancers as compared to males if they live in a cold environment. The exact answers and reasons for these differences are hard to classify. However, women are more sensitive to cold than men in different ways: (1) women are more responsive of skin cooling; (2) they are less able to tolerate cold environment than men; and (3) they cool at the faster rate in cold water than men.57–59 In fact, blood flow provides heat to the skin, muscle, and joint, which is reduced rapidly in case of women as compared to men. 57 Some differences between males and females that might contribute to this difference may be muscle to fat mass differences between the sexes. 60 This would require further analysis as muscles tend to allow for more rapid energy consumption, which could reduce the cold stress exposure in males as compared to females. Earlier, our laboratory proposed a cold-induced tumorigenesis model based on literature reports and observations that cold exposure increases the activity of the thyroid gland and BAT. 31 Active BAT may supply some factors to neighboring epithelial cells, which may increase the oncogenic response of epithelial cells. 31 A recent study suggests that BAT activity is correlated with thyroid hormone levels in humans. 61 Research studies have also demonstrated that cold exposure increases thyroid hormones levels. 52 A recent study by Cypess et al., 62 demonstrated that women have greater BAT compared to men. 63 This finding supports the concept that upon cold exposure, females may have higher BAT activity as compared to males, which could enhance tumorigenesis in females. 62 In addition, males tend to have more muscle mass and may burn higher levels of energy, making them more resistant to cold exposure BAT activity and explain why males have less BAT. Recent studies have demonstrated that activation of BAT appears to increase the risk of cancer,64–66 although it is shown to improve diabetes management.67,68 BAT is a debatable target since it may be good for cancer but less so for diabetic patients. Targeting BAT however, might be beneficial over the long term with regards to cancer development.
Although the findings of this study are quite striking, this study has several limitations that can interfere with the interpretation and provide false positives. For example, the migration rate is quite high. Peoples frequently change their residence from one state to another state, and male migration to the United States was higher than females since 1970. 31 Constant changes in location and exposure to different environmental temperatures and climates may influence the results. In addition, the impact of how people live their lives in these environments might also affect the results. For example, male smoking rates are higher than females. Moreover, many climate factors may influence the overall population in many aspects, such as lifestyle, diet, alcohol/meat consumption, and so on. In this study, we did not consider these parameters because of the lack of availability of county-wise data. However, in our previous study, we had considered all these parameters where multivariate analysis found AAT in rank first position as compared to the above parameters. 31 The missing data for some anatomical specific cancers (such as esophagus) and for some races/ethnicities (such as AI/AK native) are another limitation because (1) state legislation and regulations prohibit the release of county level data for some cases, (2) data exchange agreement specifically prohibits the release of data to third parties, and (3) some states (such as Nevada) do not have cancer incidence data. Moreover, data for races and ethnicities are not enlisted distinctly in the cancer registries. However, we have included all data available in the cancer registries and did not do any selection bias in this entire statistical analysis.
This study, for first time, divides the United States into two zones: north and south of the 36.5°N latitude (Figure 2, Supplementary Figure S8, Table 4, and Supplementary Table S5). This report proposes that females who live above 36.5°N have a 4.25–7.0 times greater risk of cancer incidence than those females who live below this latitude.
In conclusion, this study further suggests that cold environment could be an independent risk factor for cancer especially in the female population. Experimental studies are necessary to prove the concept and to unravel the molecular mechanisms by which cold exposure increases cancer risk.
Footnotes
Declaration of conflicting interests
The author(s) declared no potential conflicts of interest with respect to the research, authorship, and/or publication of this article.
Funding
The author(s) disclosed receipt of the following financial support for the research, authorship, and/or publication of this article: C.C.M. is supported by University Grants Commission (UGC) (30-49/2014 (BSR)), Department of Biotechnology (DBT) (6242-P9/RGCB/PMD/DBT/CCML/2015), and Central University of Rajasthan, India. T.S. is supported by DST-INSPIRE fellowship (IF140765) provided by the Department of Science & Technology, India.
Supplementary material
Supplementary material is available for this article online
References
Supplementary Material
Please find the following supplemental material available below.
For Open Access articles published under a Creative Commons License, all supplemental material carries the same license as the article it is associated with.
For non-Open Access articles published, all supplemental material carries a non-exclusive license, and permission requests for re-use of supplemental material or any part of supplemental material shall be sent directly to the copyright owner as specified in the copyright notice associated with the article.